ICA-fNORM: spatial normalization of fMRI data using intrinsic group-ICA networks
- 1 Chester F. Carlson Center for Imaging Science, Rochester Institute of Technology, Rochester, NY, USA
- 2 The Mind Research Network, Albuquerque, NM, USA
- 3 School of Mathematical Sciences, Rochester Institute of Technology, Rochester, NY, USA
- 4 Olin Neuropsychiatry Research Center, Hartford, CT, USA
- 5 Department of Electrical and Computer Engineering, University of New Mexico, Albuquerque, NM, USA
A common pre-processing challenge associated with group level fMRI analysis is spatial registration of multiple subjects to a standard space. Spatial normalization, using a reference image such as the Montreal Neurological Institute brain template, is the most common technique currently in use to achieve spatial congruence across multiple subjects. This method corrects for global shape differences preserving regional asymmetries, but does not account for functional differences. We propose a novel approach to co-register task-based fMRI data using resting state group-ICA networks. We posit that these intrinsic networks (INs) can provide to the spatial normalization process with important information about how each individual’s brain is organized functionally. The algorithm is initiated by the extraction of single subject representations of INs using group level independent component analysis (ICA) on resting state fMRI data. In this proof-of-concept work two of the robust, commonly identified, networks are chosen as functional templates. As an estimation step, the relevant INs are utilized to derive a set of normalization parameters for each subject. Finally, the normalization parameters are applied individually to a different set of fMRI data acquired while the subjects performed an auditory oddball task. These normalization parameters, although derived using rest data, generalize successfully to data obtained with a cognitive paradigm for each subject. The improvement in results is verified using two widely applied fMRI analysis methods: the general linear model and ICA. Resulting activation patterns from each analysis method show significant improvements in terms of detection sensitivity and statistical significance at the group level. The results presented in this article provide initial evidence to show that common functional domains from the resting state brain may be used to improve the group statistics of task-fMRI data.
Introduction
fMRI Normalization Methods
An initial requirement for analyzing fMRI data from a group of subjects is registration of multi-subject fMRI scans to a common spatial co-ordinate space. This requirement is incorporated as a fundamental step in almost every pre-processing software package designed for the analysis of fMRI data. To date, one of the most common approaches used is transforming subjects’ images to the Montreal Neurological Institute (MNI) co-ordinate space utilizing a template created by averaging echo-planar imaging (EPI) MRI scans (e.g., Collins et al., 1994). Needless to say, all normalization methods, in strict sense, map the fMRI data to a common space using information from structural data. The structure (across subjects) is different due to magnetic field homogeneities in addition to individual biological variability. A commonly used approach implemented within most pre-processing software packages such as FSL (Jenkinson, 2003) and SPM (Andersson et al., 2001), uses field maps to correct for the field inhomogeneities. This enables correction of warping due to susceptibility within each subject, but the biological variability in structure remains.
There is enough evidence to support the fact that the size, shape, and position of brain structures are anatomically non-uniform for individuals and show significant differences associated with race, age, gender, or state of healthiness (Rademacher et al., 1993; Watson et al., 1993; Thompson et al., 1997; Zilles et al., 1997, 2001; Good et al., 2001a; Toga and Thompson, 2001; Dougherty et al., 2003; Dubb et al., 2003; Park et al., 2004; Jang et al., 2005; Raz, 2005; Sabuncu et al., 2010). Thus, the spatial normalization step implemented using various techniques may require caution in order to minimize the effect of spatial transformations due to inter-subject anatomical variations that exist between the MNI template and data being transformed.
In order to address the aforementioned problem, researchers have tried different types of approaches and seen improvements in context to specific requirements of their studies. Some of these include constructing templates for region-of-interest (ROI) analyses in a standard space (Hammers et al., 2002; Kubota et al., 2006), development of specially tailored transformation methods to serve specific anatomical landmarks (Grachev et al., 1999; Hammers et al., 2003), creating atlases based on cortical surface averaging (Fischl et al., 1999; Argall et al., 2006), utilizing localizer contrasts or functional ROIs prior to applying hypotheses tests for detecting activity across the cortex (Saxe et al., 2006), and developing templates to compensate for age and gender differences (Lee et al., 2005). Comprehensive surveys such as Ardekani et al. (2005), Crivello et al. (2002), and Robbins et al. (2004) present an elaborate description of differences between some of the widely used spatial normalization techniques.
A more specialized approach is to use a “study-specific template” (SST), which was initially proposed by Good et al. (2001b) for voxel-based morphometric (VBM) study of multiple subjects. The SST is generated in two steps: normalizing all individual T1-weighted images to the MNI T1-weighted template and then taking the average of all normalized images to create the SST. This method proved to be extremely useful in improving the results of the VBM analysis as initially shown in Good et al. (2001b) and later summarized by (Huang et al., 2010). More recently, Huang et al. (2010) proposed a new approach for deriving a SST using the EPI scans of the individual subjects belonging to the group being analyzed. The effects of the method were reported in two groups (young and old) each of which performed a different task. Significant differences were reported in both smoothed and unsmoothed raw data when comparing statistics from MNI template approach against the EPI–SST approach, with a large improvement in the latter in addition to achieving better sensitivity of local maxima. This study, in addition to previous experiments (Good et al., 2001a,b), can be seen as compelling evidence that anatomical variations within a group of subjects as well as differences in scanners used for acquisition can cause considerable spatial distortion when mapping the data to a common co-ordinate space. This causes the statistics to change significantly, and can lead to misinterpretation when studying spatial patterns of cognitive activity.
The differences in correspondence between the functional and structural landmarks of the human brain have been discussed since well before the advent of fMRI. In the past, several studies have initiated efforts to try and compensate for these differences at a macroscopic as well as microscopic level. Proposals and reviews such as those by Brett et al. (2002) and Mazziotta et al. (2001) have re-iterated the importance of functional localization and incorporating cyto- and chemo-architecture knowledge in to algorithms and methods that are applied for re-alignment and segmentation of neuroimaging data sets. Their experiments involving superimposition of cytoarchitechtonic areas describe the inter-subject variability in extent and position of Brodmann areas 44 and 45. Enough evidence exists to show that functionally well-defined areas such as the visual motion or the MT can vary across subjects in terms of size (Watson et al., 1993) or mapped anatomical location (Tootell et al., 1995). A relatively recent work by (Sabuncu et al., 2010) provides an array of examples where structural anatomical landmarks on the cortex were offset or inconsistent with estimated locations of corresponding functional activity. Such studies (Mazziotta et al., 2001; Sabuncu et al., 2010) support our preamble that such an approach may be able to incorporate locally defined functional information that not only aligns activation centers but also the boundaries of these areas and some aspects of within-activation topography at a network level. Hence, a possibly favorable alternative to collecting data from a battery of tasks, as initially proposed by Mazziotta et al. (2001) and implemented by Sabuncu et al. (2010), is to robustly estimate functional landmarks using resting state fMRI data and use these for functional re-alignment.
Rest and Task: Co-Existing Spatial Dynamics
Prior to generalizing some recent work that addresses functional co-registration of group fMRI data, we introduce here a few phrases and relevant definitions that can be useful in order to clearly follow the objectives and results of this paper.
Intrinsic Networks: Brain regions which exhibit temporally coherent fluctuations and are identified from an fMRI scan collected during rest or during a task (Calhoun et al., 2008).
Intrinsic Dynamics: Spontaneous temporal fluctuations exhibited by intrinsic networks (INs).
Functional Domains/Systems: Spatial characteristics of INs, essentially represented by a region or group of regions showing variable spatial patterns across individuals.
Functional Standard Space: N-dimensional space that consists of each individual’s data co-registered for variation in N functional domains in order to bring functional normality to the group being analyzed.
Functional Normalization: Process of registering fMRI images to a functional standard space.
In the past decade, functional organization of the human brain has been increasingly studied using INs alternatively known as the “resting state networks.” Resting state fMRI has been collected on a large scale (Biswal et al., 2010; Allen et al., 2011) since the seminal discovery of INs in resting brain (Biswal et al., 1995) and independent component analysis (ICA) has been a widely used tool to analyze resting state fMRI data and draw inferences regarding functional connectivity (Beckmann et al., 2005; Damoiseaux et al., 2006; Calhoun et al., 2008; Harrison et al., 2008; Smith et al., 2009; Biswal et al., 2010; Khullar et al., 2011). Recent work (Mennes et al., 2010) shows that strong spatial associations, known as transition zones, that exist between brain regions representing intrinsic dynamics and those active during a cognitive task. The abundance of resting data and increased interest in building the functional connectome (Biswal et al., 2010; Allen et al., 2011) can play a key role in building novel methods. Thus, there exists a possibility of successfully utilizing functional information within REST-fMRI to better inform the data collected for cognitive tasks (Calhoun et al., 2008) as later demonstrated in this article.
What Do We Propose?
We propose a novel approach for co-registering a group of subjects by utilizing their intrinsic functional networks (resting state fMRI) as an additional pre-processing step in contrast to the existing convention that only uses structure as a reference. The proposed method, hence forth referred to as ICA-based functional normalization or “ICA-fNORM” delineates resting fMRI data into INs using ICA and utilizes them as “functional templates” (FT) to eventually derive normalization parameters. As shown by Calhoun et al. (2001), and Smith et al. (2009), some of these networks co-exist independent of the cognitive state (at rest or while performing a task) and the condition (healthy or diseased) of the brain. Multiple networks exhibit temporal and spatial modulation during cognitive task versus rest which implies existence of common spatial excitation patterns between these identified networks (Calhoun et al., 2008). This congruence in neural activity raises two questions that are yet to be addressed definitively: (a) “Is it possible to build normalization templates that re-align spatial boundaries of function rather than structure on a subject-to-subject basis?” and (b) “Can resting state networks be used to help improve group statistics for a cognitive task?” The main contribution of this article is to attempt to answer these questions through the proposed framework. We attempt to utilize the normalization parameters (set of non-linear basis functions) computed using RSNs for re-aligning each subject’s fMRI data corresponding to a cognitive task such as the auditory oddball design (AOD). For every subject, the new AOD data is normalized to the group according to variations in functional systems unique to that subject. This results in more robust co-registration of all subjects to a functionally standard space specific to that particular group. Our results indicate that the ICA-fNORM approach applied in addition to the conventional MNI-based spatial normalization (Ashburner and Friston, 1999), improves the group statistics as compared to those obtained by applying the latter method alone. Default mode network (DMNrest) and the temporal lobe network (TLrest) are two of the several INs repeatedly found to co-exist in resting state scans and in a cognitive task (Calhoun et al., 2008; Smith et al., 2009). These two networks were used as templates to derive the normalization parameters (explained later) that are applied to task-fMRI data for functional re-alignment.
Materials and Methods
Participants
Subjects in this study consisted of 28 healthy adults, all of whom gave written, informed, IRB approved consent at Hartford Hospital and were compensated for their participation. The data set is comprised of the same cohort of 20 healthy controls used by Calhoun et al. (2008) in addition to 8 other healthy subjects scanned using the same scanner and scanning parameters. All but one subject were right handed and the mean age (SD) = 31.46 ± 10.9 years. There were 9 female and 19 male subjects involved in the study. All subjects were able to perform the oddball task successfully during practice held prior to the scanning sessions.
Experimental Design
All subjects were scanned once (one session lasting 5-min) while at rest and twice (each sessions lasting 8-min) while performing the auditory oddball task (referred as AOD from here on). The AOD task comprises of pressing a button when the subject hears an infrequent sound within a series of regular and different sounds. The auditory stimuli were presented to each participant by a computer stimulus presentation system (VAPP) via insert earphones attached within a pair of 30-dB noise-canceling MR compatible headphones. The standard stimulus (regular sounds) and target stimulus (infrequent sounds) were 500 and 1000 Hz tones respectively. Whereas the novel stimulus (different sound) were random digital tones such as tone sweeps and whistles. The target and novel stimuli each occurred with a probability of 10% and the standard stimuli occurred with a probability of 80% during the scans. Other details related to the AOD task can be found in Kiehl et al. (2005). The resting state scans (referred as REST from here on) were acquired while the participants rested (with their eyes open) for 5 min inside the scanner.
Image Acquisition
All scans were acquired at a single site – Olin Neuropsychiatry Research Center at the Institute of Living/Hartford Hospital on a Siemens Allegra 3T dedicated head scanner equipped with 40 mT/m gradients and a standard quadrature head coil. Following parameters were set for acquiring the functional scans trans-axially with gradient-echo EPI: repeat time (TR) = 1.50 s, echo time (TE) = 27 ms, field of view = 24 cm, acquisition matrix = 64 × 64, flip angle = 70°, voxel size = 3.75 mm × 3.75 mm × 4 mm, slice thickness = 4 mm, gap = 1 mm, 29 slices, ascending acquisition. In order to compensate for longitudinal equilibrium, six “dummy” scans were performed at the beginning of every session followed by the automatic triggering of the auditory paradigm by the scanner (Calhoun et al., 2008).
Pre-Processing
The data were pre-processed using the conventional pipeline in the SPM5 software package1. The data were (a) motion corrected using an approach which minimizes the impact of the local signal variations using the INRI align algorithm (Freire et al., 2002); (b) spatially normalized (Ashburner and Friston, 1999) into the MNI space using the EPI template in SPM5; (c) slightly re-sampled (bi-linear interpolation) from 3.75 mm × 3.75 mm × 4 mm to a voxel size = 3 mm × 3 mm × 3 mm resulting in 53 × 63 × 46 voxels per volume, and lastly (d) spatial smoothed using a 10 mm × 10 mm × 10 mm full width at half-maximum (FWHM) Gaussian kernel. The four steps (a–d) stated above were applied to both data sets used in our experiment – REST and AOD fMRI. In addition, ICA-fNORM was applied on AOD data using templates derived from REST data.
Proposed Framework: ICA-fNORM
The proposed functional normalization approach is divided in to four stages: (1) Stage 1: derive FT relevant to the task (see FT From REST-fMRI), (2) Stage 2: estimate the functional re-alignment parameters corresponding to each subject using SPM (see Estimating Normalization Parameters), (3) Stage 3: apply these parameters to the pre-processed task-fMRI data collected for the same set of subjects (see Functional Normalization of AOD Data), and lastly (4) Stage 4: perform statistical analysis using ICA and general linear model (GLM; separately) and compare group level statistical significance and detection sensitivity between the “before” and “after” ICA-fNORM data sets (see Analysis Methods). Figure 1 illustrates the complete approach including the derivation of normalization parameters from REST data and their utilization for warping the task-relevant fMRI data.
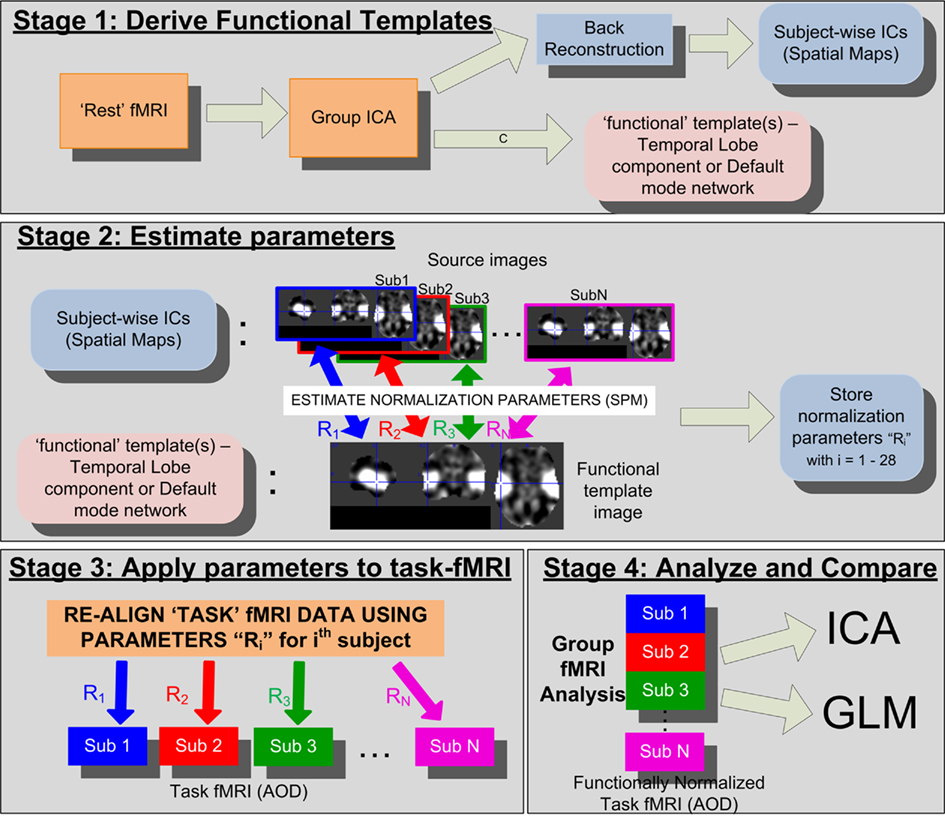
Figure 1. Detailed flowchart of the proposed ICA-fNORM framework illustrating all relevant stages involved. This figure illustrates temporal lobe (TLrest) template in stage 2. A similar process is repeated when using the default mode network (DMNrest) as the functional template.
Functional templates from REST-fMRI
In order to derive the FT, REST data was decomposed into INs (spatial components) using group spatial ICA implemented within the GIFT toolbox (Calhoun et al., 2001) available online2. We utilize GICA instead of single subject ICA since it provides multiple advantages over the latter such as efficiency, less subject to noise, and accurately represents individual variations (Erhardt et al., 2010). In our approach, we utilize a high model order of 50 components for extracting large number of INs. A recent study by Abou Elseoud et al. (2010) explains the effects of increasing model order on ICA of resting state fMRI data. A low model order used for resting state is expected to yield a rather less informative set of large scale brain networks. Whereas, there is loss of repeatability if a very high model order (>100) is used. They also presented evidence depicting spatially overlapping IC sources as a result of using model order of 30–40. The motivation to use a high model order also comes from recent studies (Biswal et al., 2010; Allen et al., 2011) that show separation of artifactual networks from meaningful components. Previous study by Calhoun et al. (2008) that utilized the same resting data as this article utilized a much lower model order (∼19). However, we use a higher order keeping in sight a future goal that is to combine multiple known resting state networks into a single functional template that may further be used to co-register data from any cognitive paradigm. It is worthy to note that spatial characteristics of the two specific networks, used as FT here, did not show considerable variation but it may be useful to experiment with the model order in future so as to develop a stable functional template. Thus, high model order for decomposing REST data is more feasible in order to separate the INs with more subtle differences that have systematic significance in context of resting state patterns within the brain.
After estimating the group spatial component maps and corresponding time courses through GICA, subject-specific components are estimated using that subject’s fMRI data and the group independent time courses through a back reconstruction step built into the GIFT software package (Calhoun et al., 2001; Erhardt et al., 2010). These subject-wise independent components are then used as target images to derive the subject-specific normalization parameters (explained in Estimating Normalization Parameters) by warping the subject’s component map to the group mean component map (as seen in Figure 1).
As mentioned before, we identified and utilized two INs – TLrest (temporal lobe from REST-fMRI) and the DMNrest (default mode network from REST-fMRI) to validate our proposed methodology for functional normalization. The TLrest network was chosen due to implicit reasons associated with the nature of the cognitive task (AOD) involved in our experiment. The auditory oddball task is known to induce BOLD signal increases in the temporal lobe network (Kiehl et al., 2005; Calhoun et al., 2008). Raichle et al. (2001) proposed that the deactivation patterns observed during goal-directed behavior may represent an operational “default mode of brain function.” Thus, the DMNrest was chosen, firstly, in order to understand the global interactions between this system’s functional boundaries on subject-to-subject basis and secondly, to compare the influence of using this network with ICA-fNORM on statistical results and detection sensitivity against using a task-related intrinsic network such as the TLrest.
In this initial paper, we limit the work to two INs, used one at a time, to demonstrate the effectiveness and a proof-of-concept in context to our approach. However, in the future we plan to extend this to incorporate all the INs being used together. The FT corresponding to TLrest and DMNrest are presented in Figures 2A,B respectively.
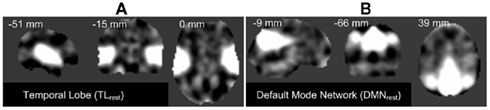
Figure 2. Orthogonal views of the template images derived used by the proposed framework: (A) temporal lobe (TLrest), and (B) default mode network (DMN) component images obtained from group-ICA on REST-fMRI data. The aggregate spatial components are presented here with the respective MNI co-ordinates.
Estimating normalization parameters
Next, the normalization parameters for each subject were estimated using the study-specific TLrest network (or DMNrest) as the reference image and that subject’s TLrest (or DMNrest) component as the source image, as illustrated in Figure 1. Note that, the normalization algorithm used here was also applied to all data sets in the pre-processing stage in order to map all the data to the MNI co-ordinate space using the 305-subject EPI template provided within SPM. We utilized SPM’s spatial normalization algorithm for computing the 12-parameter affine model and the non-linear basis functions that account for global shape differences (Friston et al., 1995; Ashburner and Friston, 1999) between the functional network’s boundaries of each subject and that of the group. We used the default settings within SPM for estimating the 392 parameters (7 × 8 × 7) to describe deformations in each direction. The basis functions were estimated using 3-D discrete cosine transform (DCT) and regularization was done using λ = 0.01. The non-linear registration was performed as 12 iterations and normalization parameters were stored. Warping parameters were computed for each subject and used for registration of the task-related data corresponding to the same subject, as explained in the next section (see Figure 1 for illustration). The above process is repeated with DMNrest network used as the functional template and the data were stored for further analysis.
Functional normalization of AOD data
The normalization parameters derived above are representative of the difference between each subject’s functional activity patterns and the group’s average activity with respect to a particular functional system/network. Utilization of resting state functional boundaries as a reference to re-align another independently acquired data set (AOD) facilitates transformation of all the data to a functionally standard space. In this paper we restrict to utilizing only two networks (one at a time), known to play a significant role in performance of this task and validate our proposed methodology. Hence, the functionally transformed AOD data was able to incorporate the template network’s spatial variations that exist between multiple subjects within the same group.
In this experiment, we only applied the non-linear transformation (derived above) for re-aligning every subject’s AOD data using SPM’s “normalize” routine. As mentioned before, AOD data was prepared for analysis using a conventional pre-processing pipeline that included spatial normalization to the MNI space using SPM (see Pre-Processing). The spatial normalization step in pre-processing included a 12-parameter rigid-body transformation, thus eliminating the need for applying another affine transformation when performing the functional normalization step. The geometric differences (affine matrix) between the group level network (reference) and each subject’s network (object) are local in nature in the sense that they may not generalize well to the rest of the brain if applied as a set of affine parameters. Therefore, the affine matrix was set to an identity matrix in order to avoid distortions in the shape of the brain since the reference image for deriving this affine transform was an activation component with most positive values spatially distributed within a small region across the whole brain (such as the temporal lobe or the DMN regions). To corroborate the aforementioned observations, some of the adverse effects, of using a second affine transformation, such as shape distortion of the overall brain are highlighted here through Figure 3. Thus, only the non-linear transformation Ri for every ith subject derived in the estimation step (see Figure 1) was applied to each subject’s AOD task data.
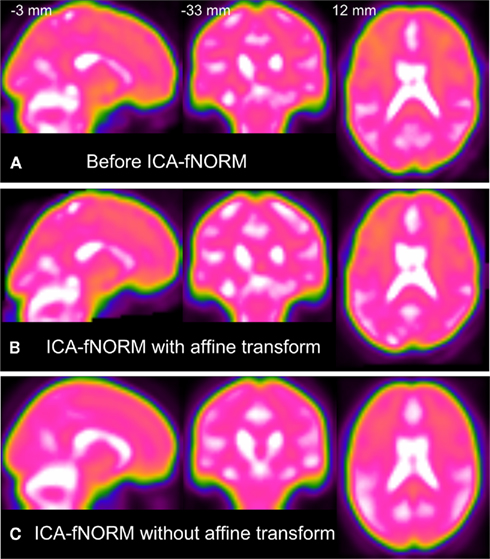
Figure 3. A comparison showing global shape distortion effects due to affine transformation applied along with the functional normalization step: (A) Original image, (B) ICA-fNORM with second affine transform, (C) ICA-fNORM without second affine transform. We use a non-conventional color-scheme to better highlight the shape distortion effects. Images in (A–C) are derived from the same MNI co-ordinates mentioned in (A).
It is worth noting that the fNORM (functional normalization) parameters (non-linear transformations) that were derived from the resting state networks were highly dependent on the spatial characteristics of the reference and source images. The reference image, and in most cases the source image, mostly had positive values concentrated within or around the primary activation region as seen in Figure 2.
The functional dynamics across individuals within a group can be quantified in form of INs and thus inform us about the functional organization of each individual’s brain. Therefore, these networks and in turn the normalization parameters act as a default basis set for that particular subject. The key to our hypothesis is that functional normalization using these INs compensates for absence of these functional systems in structural templates such as the MNI–EPI template or the T1-weighted images used to register data to a stereotactic space through spatial normalization. The INs were most likely able to provide us with a priori information about how each individual’s brain is organized at a functional level. It is known from literature that the brain’s functional organization is modulated in many ways when performing a task as compared to being at rest (Calhoun et al., 2008; Smith et al., 2009; Mennes et al., 2010) while the spatial organization of these networks remains similar on a global scale. Note that, the same set of fNORM parameters for each subject was used to co-register every volume of the AOD fMRI data set for that subject.
Analysis Methods
This section briefly describes the methods used to compare the effects of functional normalization. In order to see the improvements at a group level, we applied two of the standard fMRI analysis methods on the functionally re-aligned AOD data: (a) group independent component analysis (GICA) using the GIFT toolbox (Calhoun et al., 2001) and (b) GLM analysis using SPM5 (Friston et al., 1994) available online (see text footnote 1). For comparisons, the aforementioned analysis methods were also applied to the regularly pre-processed AOD data without applying ICA-fNORM as presented under the results section.
For the AOD task, data from each participant was entered in to the GLM group analysis framework using SPM5. Regressors were created by modeling the target, novel, and standard stimuli as delta functions convolved with the default SPM5 canonical hemodynamic response function (HRF). This resulted in a set of activation maps (β-weight maps) associated with each of the parametric regressors. Scanner drift was modeled by a high pass filter with cutoff at 128 s. Contrasts between target versus standard (hereafter referred to as target) were created for further analysis. This specific contrast was selected based on existing evidence (Halgren et al., 1998; Kiehl et al., 2005) showing detection of extensive and spatially distributed time-locked brain activity during processing of the target stimuli. The resultant statistics were corrected for multiple comparisons with p < 0.01 using FDR (Genovese et al., 2002).
Independent component analysis is a method that decomposes data into signals that are maximally independent. We utilized a GICA method first proposed by Calhoun et al. (2001) for deriving maximally independent components representing distributed neural activity across the brain. In our experiment, the order was set to n = 20 components and ICA applied to regularly pre-processed (“before” ICA-fNORM) AOD data and the functionally re-aligned (“after” ICA-fNORM) AOD data separately. Two task-relevant components were chosen to investigate and verify the improvements introduced by ICA-fNORM: (1) temporal lobe component (TLAOD), and (2) default mode network (DMNAOD). These correspond to the same networks that were chosen as FT for normalizing AOD data before. All 20 components were estimated for each individual subject using a back reconstruction method known as GICA3 (Erhardt et al., 2010).
Results
In order to study and report the effects of functional normalization, we compared the statistics and spatial characteristics of two task-relevant components mentioned above. Each of these was estimated twice, that is, once before applying ICA-fNORM (that is, MNI-based normalization only), and once after applying ICA-fNORM (MNI-based normalization + functional re-alignment using ICA-fNORM) with each of the two templates. The first set of results highlight the spatial differences between activation regions corresponding to before and after ICA-fNORM followed by the comparisons based on difference “threshograms.” Please note that the term threshograms is coined to avoid confusion with conventional histograms, even though they appear graphically similar. This comparison is similar to subtracting the reverse cumulative density functions of the two methods where the x-axis corresponds to increasing t-thresholds. Also, ROI analysis is later presented using multiple anatomical atlases. Each of the aforementioned comparison is presented using results from each of the analysis methods (GLM and ICA) for both FT (TLrest and DMNrest).
Morphological and Intensity Variations
Prior to presenting the statistical improvements introduced by our method, we demonstrate here the similarities in shape, size, and contrast differences between the data obtained before and after application of ICA-fNORM. Global differences in shape and size introduced by our method at an individual level are visible only in few areas as seen from the mean images estimated by averaging all volumes from all subjects (Figure 4). Thus, there is minimal distortion in terms of shape, size, and intensity values. The outline of mean image after ICA-fNORM is overlaid over the “before” ICA-fNORM mean image as shown in Figure 4B. The outline was computed using 80% of the mean intensity value from Figure 4A. The overall shape of the brain is preserved and only a few differences are seen near the areas that are sensitive to susceptibility artifacts. Also, there is little variation in intensities introduced by ICA-fNORM, mostly at very low intensity values as seen from the histograms in Figure 4C estimated using images from Figures 4A,B.
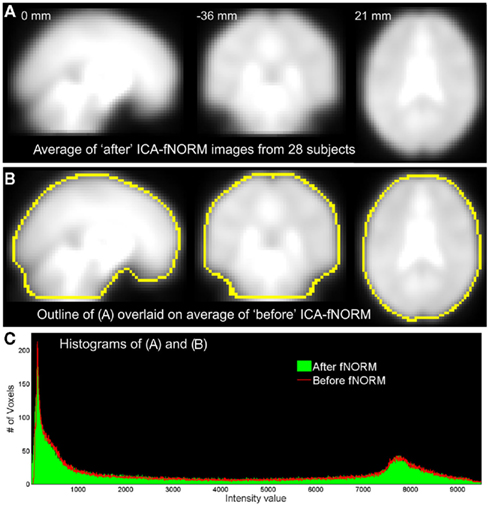
Figure 4. Averaged data from all 28 subjects in three orthogonal views corresponding to the two methods under comparison: (A) after ICA-fNORM; (B) before ICA-fNORM with overlaid boundaries extracted from images in (A); (C) intensity histograms corresponding to images presented in (A,B).
Spatial Overlap and Differential Analysis
Group activation patterns were extracted using a one-sample t-test on each subject’s activation maps obtained after – (a) first level GLM analysis built into SPM5 and (b) GICA, applied on the functionally re-aligned (after ICA-fNORM) and regularly processed (before ICA-fNORM) AOD data. The two main advantages of the proposed approach that were observed irrespective of the analysis method (GLM or ICA) used, were higher t-statistics for the same voxel locations and more number of significant voxels that seemed to fill in possibly task-modulated regions that showed little significance before applying ICA-fNORM. We investigated the effects of applying ICA-fNORM using different templates – (1) TLrest and (2) DMNrest. These were compared against the results corresponding to regularly processed data, that is, when ICA-fNORM was not applied.
General linear model
Group activation t-maps (n = 28) obtained after the group GLM analysis of the two data sets (before and after ICA-fNORM) were overlaid for the target condition and presented in Figure 5. Each color on the map represents whether a voxel passed the significance threshold (t > 6) using either or both methods under comparison. Overlapping and differential areas seen in Figure 5A depict several differences introduced by mapping the data with ICA-fNORM and TLrest intrinsic network, with the following two as the most clearly observable. Firstly, some small clusters were found to be absent in either of the two approaches in addition to some new voxels that filled the gaps between neighboring active clusters, thus affecting detection sensitivity. Secondly, the number of significant voxels (after thresholding at t > 6) obtained after ICA-fNORM were fairly larger than those before ICA-fNORM.
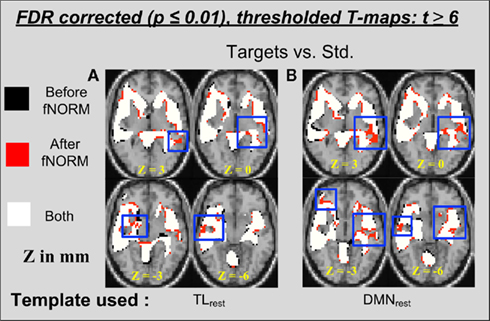
Figure 5. Thresholded activation maps (t > 6, p < 0.0001) for the target condition from the GLM analysis (n = 28) showing overlapping and differential regions obtained “before” and “after” ICA-fNORM of AOD data done using different templates: (A) TLrest, (B) DMNrest. Each method is indicated using different colors: (i) red – “after” ICA-fNORM; (ii) black – “before” ICA-fNORM; and (iii) white – voxels active in both (1) and (2). The functional maps were overlaid on a re-sliced and co-registered anatomical template in SPM.
A similar comparison was done for the t-maps obtained after analyzing the AOD data that was re-aligned using the DMNrest template. Overlapping and differential areas of activation for this particular case are presented in Figure 5B. Additional voxels (marked red) form contiguous connections between previously unconnected neighboring activations (see slice z = 3 mm), which was also our first major observation from Figure 5A. Secondly, there were a few small clusters where either of the methods have little or no significant voxels present. Overall, the number of significantly active voxels is considerably greater in t-maps estimated after ICA-fNORM (see Figure 7 for exact numbers).
Independent component analysis
The second method used to analyze the effects of functional normalization on task data (AOD) is GICA (Calhoun et al., 2001). Note that the same method was applied to the resting state fMRI data in order to derive the FT (TLrest and DMNrest) from the resulting independent components. Here, the order was set to n = 20 and the primary task-related component (termed TLAOD hereafter) is selected for spatial overlap and ROI analysis. The t-map for TLAOD was extracted by performing a one-sample t-test on all 28 back-reconstructed subject-specific maps corresponding to this particular component. These t-maps correspond to ICA component maps estimated separately for the two data sets (before and after ICA-fNORM) as presented in Figure 6. The main observation from Figure 6 is appearance of new clusters of significant voxels (in red) that failed the threshold (t > 6) prior to functional normalization. Also some small and medium-sized clusters were found absent in either of the two approaches. Most new voxels appear along boundaries of activation regions already detected before applying ICA-fNORM (in white and black) as seen in Figure 6A. This was a direct result of re-aligning subjects to a common functional space, in turn improving the detection sensitivity of the t-test performed on that group of subjects.
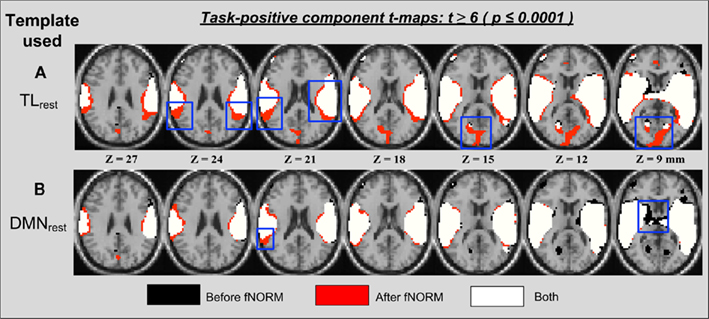
Figure 6. Thresholded activation maps (t > 6, p < 0.0001) for the TLAOD component from ICA analysis (n = 28) showing overlapping and differential regions obtained “before” and “after” ICA-fNORM of AOD data done using different templates: (A) TLrest, (B) DMNrest. Each method is indicated using different colors: (i) red – “after” ICA-fNORM; (ii) black – “before” ICA-fNORM; and (iii) white – voxels active in both (i) and (ii). The functional maps were overlaid on a re-sliced and co-registered anatomical template in SPM.
A reverse effect is observed in Figure 6B which corresponds to functional normalization performed using the DMNrest template. Voxels around the boundaries belong to “before” maps in most slices in Figure 6B, thus showing the inhibitive nature of the DMN toward positively task-modulated functional systems. Such modulating behavior along functional boundaries was recently illustrated in Mennes et al. (2010) where they utilized the resting state functional boundaries to predict BOLD fMRI task activity. Our experiment provides further evidence that the most primitive of relationships between different networks exist along the boundaries of these systems and may be utilized favorably to improve the resultant statistics.
Difference Threshogram Analysis
Next, we compare the results obtained before and after ICA-fNORM by subtracting the t-maps (after – before) corresponding to multiple thresholds. The resulting graphic is called a difference threshogram as the information presented through it suggests. The process was repeated for results corresponding to each analysis method used (GLM and ICA) as well as each functional template utilized in ICA-fNORM. Voxels corresponding to the primary task-modulated ROI, that is, the temporal lobe, were extracted using a mask constructed from the Wake Forest University Pick atlas (WFU Pick Atlas; Lancaster et al., 2000). The masked t-maps for the “before” and “after” images were subtracted and thresholded using a range of thresholds.
The aforementioned steps were first applied on t-maps obtained through GLM analysis. Figures 7A,B show the difference threshograms under the target condition for the whole brain (left column) and the temporal lobe (right column) corresponding to the TLrest and DMNrest templates respectively. Application of ICA-fNORM clearly helps improve the statistics as seen from large positive change in number of voxels over different thresholds (Figure 7).
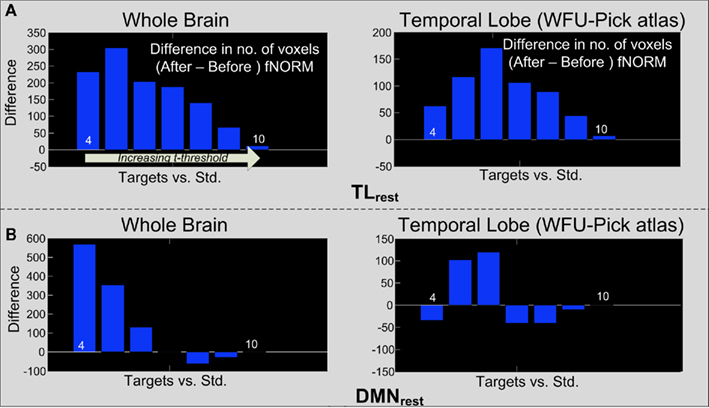
Figure 7. Difference threshograms derived by subtracting the “after” and “before” ICA-fNORM t-maps for the target condition estimated through GLM analysis. The bars correspond to number of voxels gained (y-axis) after ICA-fNORM for increasing t-threshold (x-axis). Differences are presented for whole brain (left) and temporal lobe ROI extracted using WFU Pick Atlas (right) for each template: (A) TLrest and (B) DMNrest.
An approach similar to the one used to estimate the threshograms in Figure 7, is followed for computing the difference threshograms for the ICA component (TLAOD) t-maps. Threshograms corresponding to the whole brain and ROI (temporal lobe) are presented separately in Figure 8. The maximum change is seen in case of TLrest at t > 15 (854 voxels for whole brain; 739 voxels within the temporal lobe) as seen from the threshograms in Figure 8A. The peaks were observed at a low t-threshold (t > 6), with gradual increase until attaining the maximum height at t > 15, eventually decaying to lowest height at the maximum t-threshold (t > 30). Such behavior was observed in both threshograms presented in Figure 8A. Thus, t-statistics improved consistently across the task-engaged region after application of ICA-fNORM with TLrest.
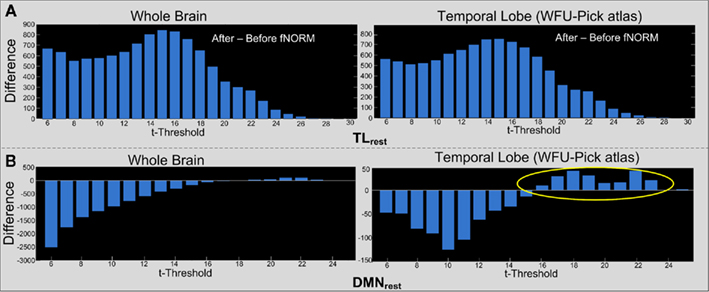
Figure 8. Difference threshograms derived by subtracting the “after” and “before” ICA-fNORM t-maps for the TLAOD component estimated through ICA. The bars correspond to number of voxels gained (y-axis) after ICA-fNORM for increasing t-threshold (x-axis). Differences are presented for Whole brain (left) and Temporal lobe ROI extracted using WFU Pick Atlas (right) for each template: (A) TLrest and (B) DMNrest.
In case of the DMNrest template, a bimodal type of pattern is observed from the difference threshograms as seen in Figure 8B. Initially, there is a large decrease in number of voxels (after versus before ICA-fNORM) over lower thresholds, but our method appears to gain more at higher thresholds (t > 15) as seen from the ROI threshogram (right column) in Figure 8B.
Region-of-Interest Analysis
To provide further insight into the differences between “before” and “after” ICA-fNORM results, the activation maps were analyzed using the automatic anatomical labeling (AAL) atlas (Tzourio-Mazoyer et al., 2002) and ROI labels of most significant voxels. Prior to ROI analysis, the activation maps were corrected for multiple comparisons (p < 0.01) and eventually thresholded (t > 6). We estimated the location of maxima (x, y, z), mean t-value, maximum t-value, and number of significant voxels above the threshold, for all regions labeled within the thresholded t-maps for both methods. Spatial shifts in activation foci between the two approaches were computed as the Euclidean distance (ED) between the local maxima. As in Section “Spatial Overlap and Differential Analysis” and “Difference Threshogram Analysis,” these calculations were repeated on results corresponding to each functional template (TLrest and DMNrest) for the two analysis methods (GLM and ICA).
Note that we utilized two different types of masks to generate results in Figure 7B and Tables 1 and 2. The former was generated using a binary mask where the bilateral temporal lobe is labeled as the only ROI and voxels qualifying the t-threshold (t > 6) within that region are used to generate the difference threshograms in Figure 7B, whereas the values in Table 2 were estimated using AAL atlas that contains several different regions to parcellate the functional activation maps anatomically. The motivation for using separate masks was to present the overall improvements in t-values by covering the anatomical regions that were not specific to the AAL atlas.
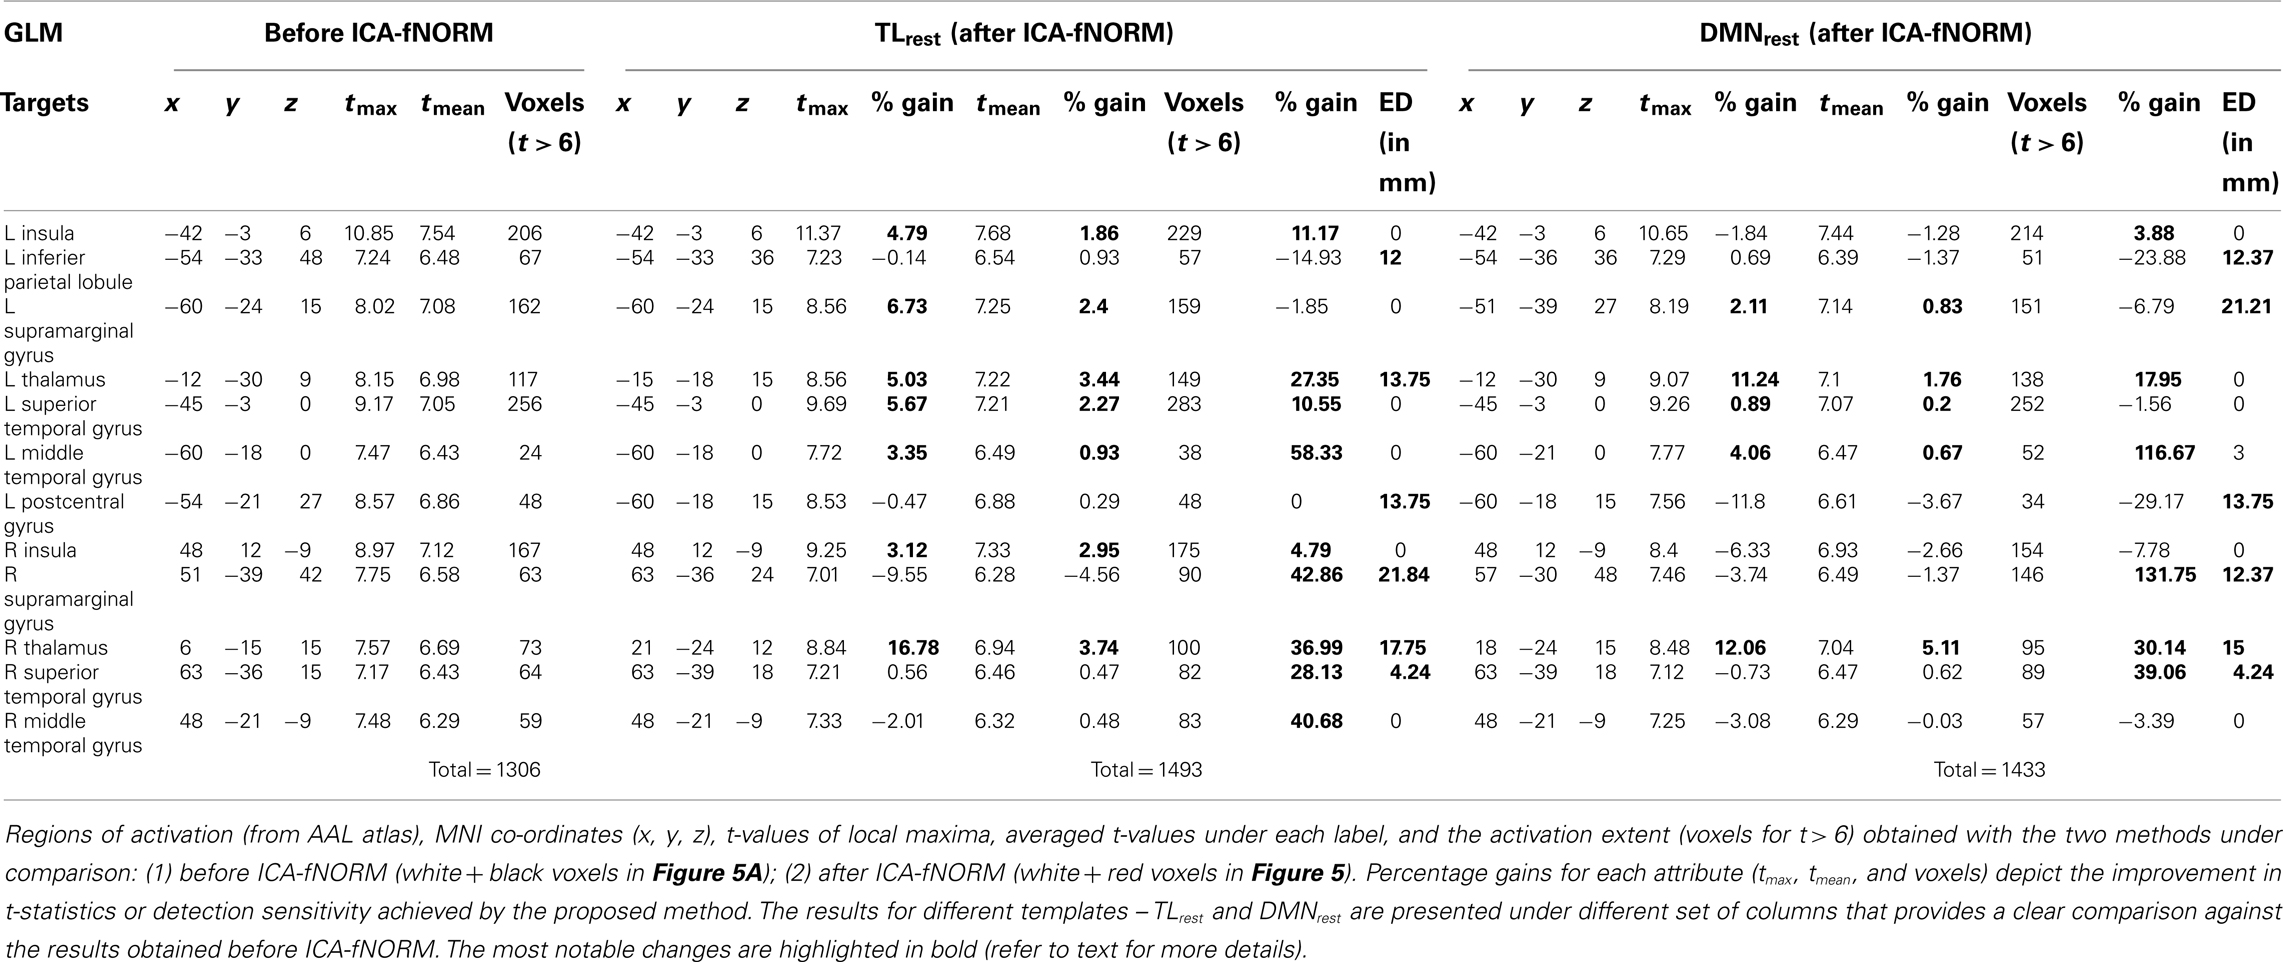
Table 1. General linear model analysis – results of the ROI analysis done on target condition group level t-map (corrected for p < 0.01).
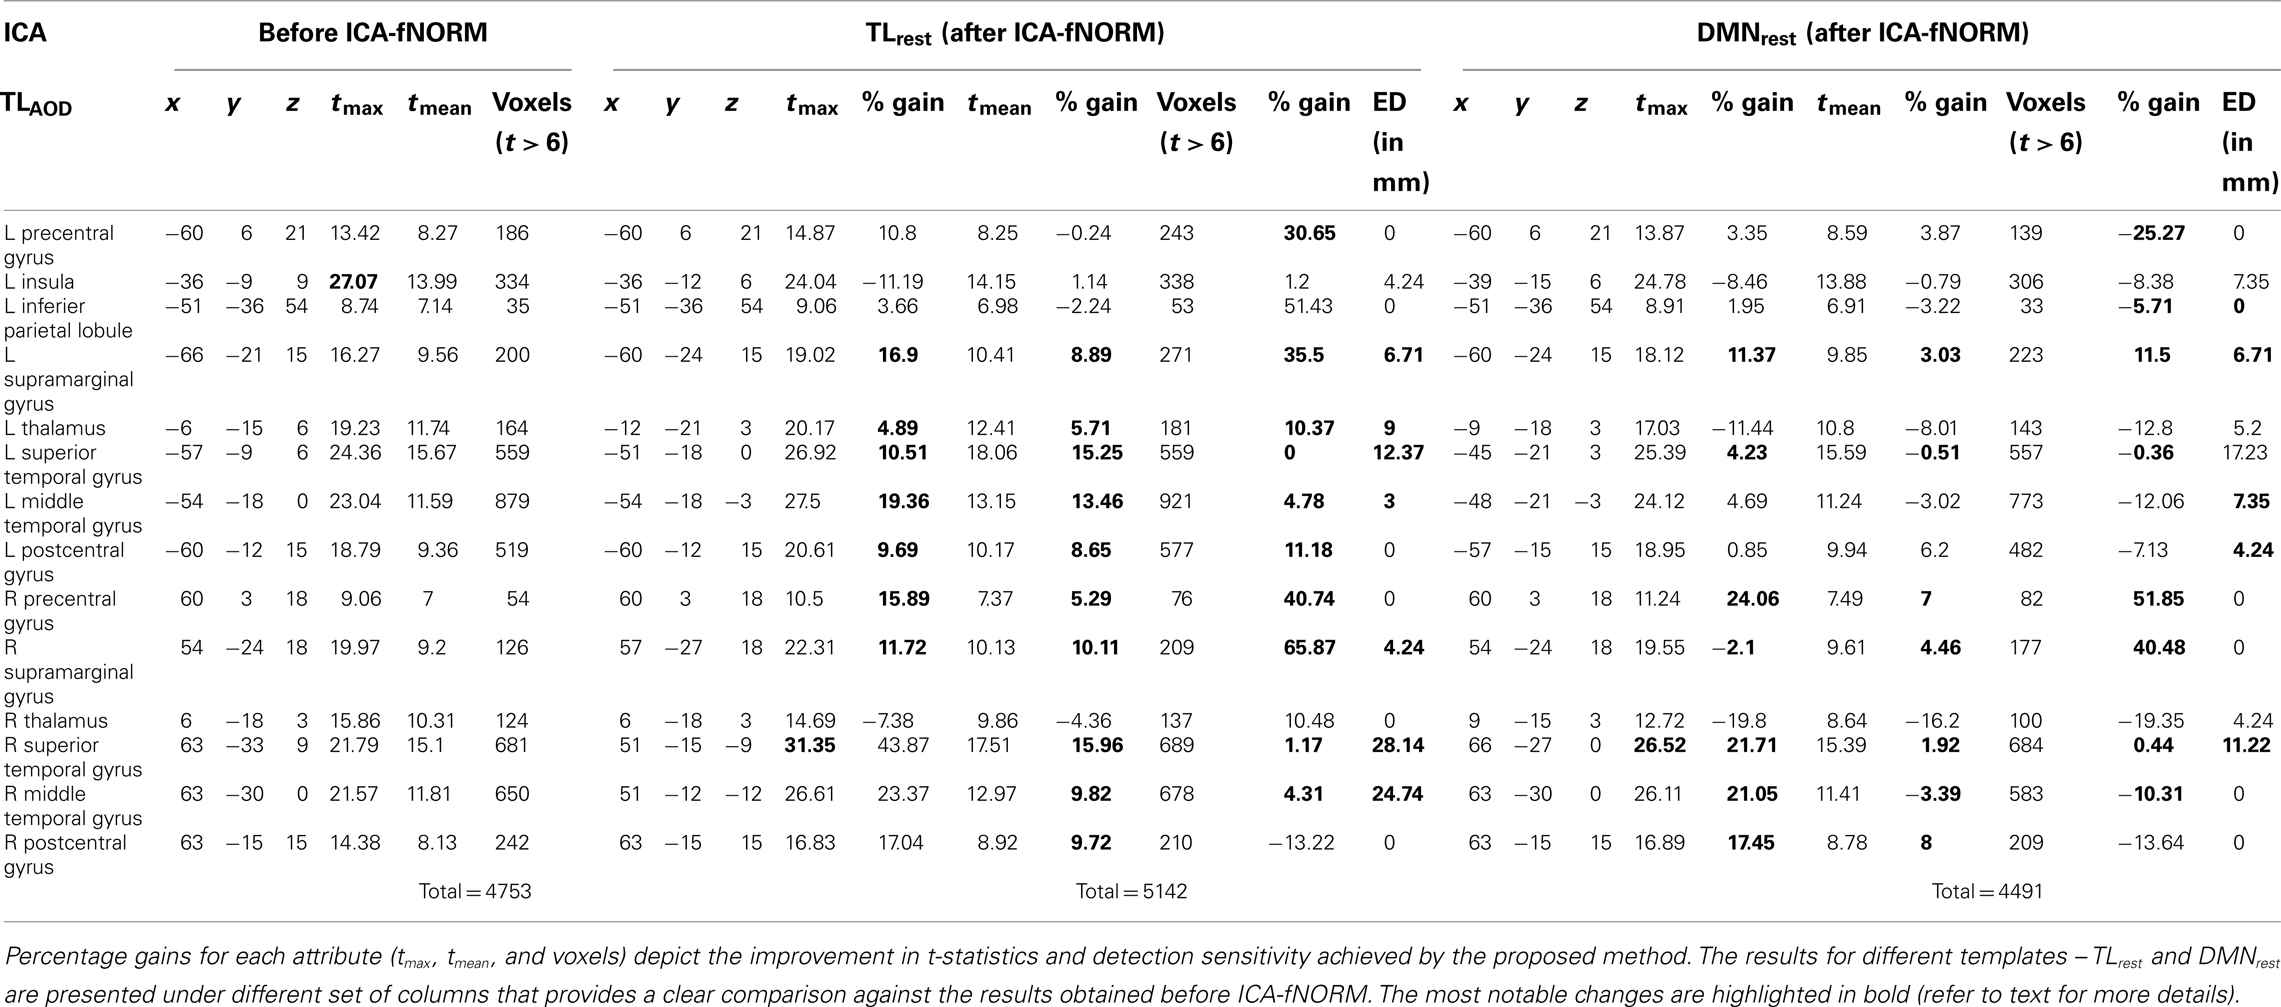
Table 2. Independent component analysis – activation labels within the t-map of the TLAOD component (correct p < 0.01) sorted in to anatomical labels (AAL) and the respective details: MNI co-ordinates (x, y, z), t-values of local maxima, averaged t-values, and activation extent (voxels for t > 6), estimated for each of the two methods under comparison: (1) before ICA-fNORM (white + black voxels in Figure 6B); (2) after ICA-fNORM (white + red voxels in Figure 6B).
General linear model
The results of the ROI analysis done for the target condition’s t-maps are presented in Table 1. The results are tabulated separately based on the template used for ICA-fNORM and compared against the GLM results of regular analysis.
In case of TLrest, we found five bilaterally active regions – insula, supramarginal gyrus, thalamus, superior temporal gyrus, middle temporal gyrus, and two regions that were significant in the left brain only – inferior parietal lobule and postcentral gyrus. Percentage gains were estimated for tmax, tmean, and voxels (as listed in Table 1), and it was observed that several regions show positive gain percentages in favor of ICA-fNORM. Regions such as left insula (4.79%), left supramarginal gyrus, left thalamus, left superior temporal gyrus, left middle temporal gyrus, right insula, and right thalamus show highest gains in tmax among all regions (highlighted in Table 1). A similar pattern was also observed for the mean t-values where most regions had conforming trends for tmax and tmean. A large fall in the t-values was observed for the right supramarginal gyrus although there was a considerable increase in this region’s activation volume (42.86%) after ICA-fNORM. This result was an apt example of the ability of our proposed method to improve the detection sensitivity while assisting in determining a region’s significance accurately based on the functional organization of all subjects within that particular group. Considerable increase in activation volumes was recorded for 9 out of 12 regions (in bold) presented in Table 1, highest being for the left middle temporal gyrus (58.33%).
The group t-maps corresponding to the DMNrest were also analyzed using the ROI analysis and the most significant regions reported in Table 1 under the DMNrest columns. This experiment helped reveal higher tmax values for left superior temporal gyrus, left middle temporal gyrus, and left supramarginal gyrus whereas lower tmax values for these regions were recorded in the right half of the brain. Almost similar patterns were observed for the tmean with an exception of right supramarginal gyrus and left inferior parietal lobule. As observed in case of TLrest, right supramarginal gyrus showed maximum increase in volume of activation even though there was a minor drop observed in the tmax and tmean values. Other task-engaged regions such as the left middle temporal gyrus (116.67%), thalamus (L: 17.95%; R: 30.14%), and right superior temporal gyrus (39.06%) show large increases in activation.
Irrespective of the template used, the activation foci of some regions shifted considerably after applying ICA-fNORM as seen from the ED columns in Table 1. The regions that experienced maximum shift in local maximum include left postcentral gyrus, right supramarginal gyrus, right thalamus, and right superior temporal gyrus. However, there were some regions that shifted in case of only one of the templates – left thalamus (TLrest), and left middle temporal gyrus (DMNrest), left supramarginal gyrus (DMNrest).
Independent component analysis
The results of the ROI analysis done for the group level t-maps corresponding to the temporal lobe component are presented in Table 2. The activation maps corresponding to the primary task-positive component from functionally re-aligned AOD data (TLAOD) were analyzed and ROI labels of most significant voxels were derived. The results corresponding to different templates are summarized below.
In case of TLrest, we identified eight anatomical regions out of which six showed significant bilateral activity – precentral gyrus, supramarginal gyrus, thalamus, superior temporal gyrus, middle temporal gyrus, and postcentral gyrus. Two regions – insula and inferior parietal lobule, were significant in the left brain only as presented in Table 2. Two regions that recorded the maximum relative percentage gain in tmax were the superior temporal gyrus (L: 10.51%; R: 43.87%) and the middle temporal gyrus (L: 19.36%; R: 23.37%). These anatomical regions also showed similar patterns of improvement in tmean with gains as high as ∼16% (right superior temporal gyrus). However, the volumetric gains for the aforementioned regions were minimal. The maximum improvement in terms of volume was observed for supramarginal gyrus (L: 35.5%; R: 65.87%) and precentral gyrus (L: 30.65%; R: 40.74%). As an outlier, the right thalamus experienced decrease in tmax and tmean and a slight improvement in volume (10.48%).
Interestingly, the global maximum for regularly processed data was observed within the left insula. Whereas, the global maximum for functionally re-aligned data was found in a more highly task-engaged region, that is, the right superior temporal gyrus (highlighted in Table 2) alongside highest improvement in mean t-value. ED measures (TLrest) shown in Table 2 indicated maximum shift of the activation foci for two regions that also showed consistent improvement in rest of the statistics – right superior temporal gyrus (28.14 mm) and the right middle temporal gyrus (24.74 mm). A slightly different pattern was observed, in case of DMNrest template, where large shifts in activation foci were observed for the left superior (17.23 mm) and middle temporal gyrus (7.35 mm), right superior temporal gyrus (11.22 mm) but no change for right middle temporal gyrus. In addition to the above regions, more than half other regions reported in Table 2 showed significant shifts in activation foci for of both the templates.
In case of the DMNrest template, we used two different thresholds to perform the ROI analysis separately. The two thresholds used for this experiment were t > 6 (Table 2) and t > 16 (Table 3). A reasonable explanation for performing a multi-threshold analysis can be justified through the bipolar nature observed in Figure 8B. An expected but interesting pattern was observed after analyzing the component t-maps using multiple thresholds.
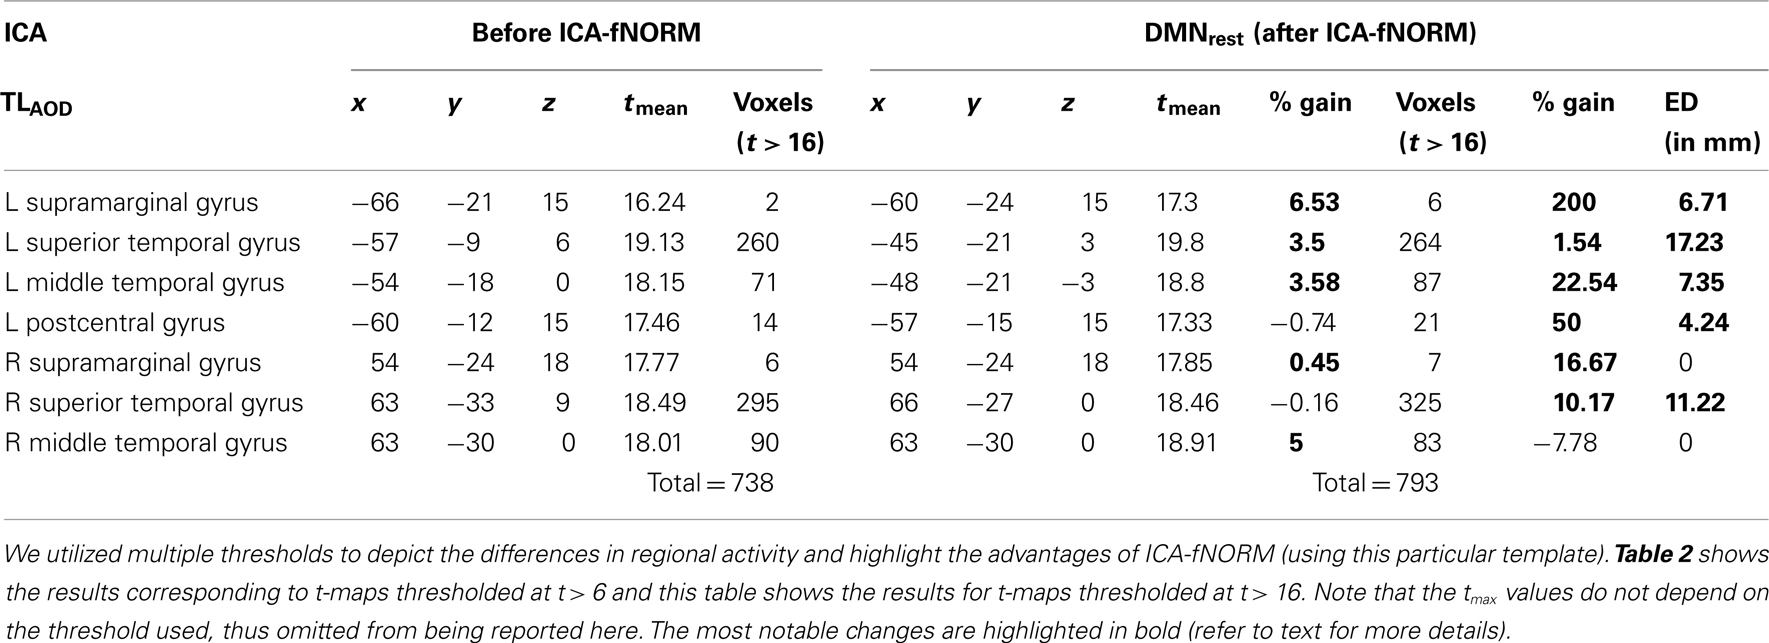
Table 3. Activation labels and other attributes estimated using a higher threshold (t > 16) for t-maps corresponding to ICA-fNORM using DMNrest template.
Threshold: (t > 6): Although minor, several regions showed negative gain (decreases) in tmean values after ICA-fNORM with exceptions of precentral gyrus, postcentral gyrus, supramarginal gyrus, and right superior temporal gyrus. Similar pattern was observed in volume calculations with exceptions of supramarginal gyrus (L: 11.5%; R: 40.58%) and right precentral gyrus (51.85%) indicating enlarged activation volume. However, large improvements in local maxima were observed for all regions other than the thalamus region as reported in Table 2.
Threshold: (t > 16): Regions with significant differences at this threshold are presented in Table 3 separately. Considerable percent gain was observed in tmean and volume for the primary task-engaged regions reported here. The superior temporal gyrus (L: 1.54%, R: 16.67%), left middle temporal gyrus (22.54%), and supramarginal gyrus (L: 200%; R: 16.67%) showed large gain in activation volume. Thus, at higher significance levels, the DMNrest template has more impact on the functional boundaries of primary task-engaging regions.
This section provided evidence showing how ICA-fNORM, using functional information from two INs helped improve various aspects of post-analysis results such as t-statistics and detection sensitivity and possibly help identify differences in region-wise activity that may go un-noticed otherwise.
Transition Regions
In results presented so far, the most consistent post ICA-fNORM differences in spatial maps were observed around the edges of activation regions. These observations partially concur with recent work (Mennes et al., 2010) that presented evidence regarding strong spatial associations, known as transition zones, that exist between regions representing resting state dynamics and those active during a cognitive task. After doing a selective threshold analysis (see Figure 9), we observed differences around regions that conformed the recent findings (Mennes et al., 2010) about interactions between various cognitive states. In Figure 9, some major regional differences occurring at various levels of significance are shown by utilizing the t-maps presented in for TLAOD (Figure 6A) and different intervals of t-thresholds to divide them in to boundary-type representations at various levels of statistical significance. It was already clear from Figure 7 that more voxels appear to be significant (t > 6) after application of ICA-fNORM. Whereas Figure 9 is focused on the distribution of voxels around edges at various levels of significance (starting at t > 4), thus establishing favorable relationship between the INs from resting state and functional systems involved in cognitive task processing. Other than transitions occurring around edges, several small clusters of active voxels exist at high range thresholds indicating activity that went undetected prior to ICA-fNORM. The new regions were detected only after involving the intrinsic systems of each subject’s brain and re-aligning them with respect to the functional properties of that group.
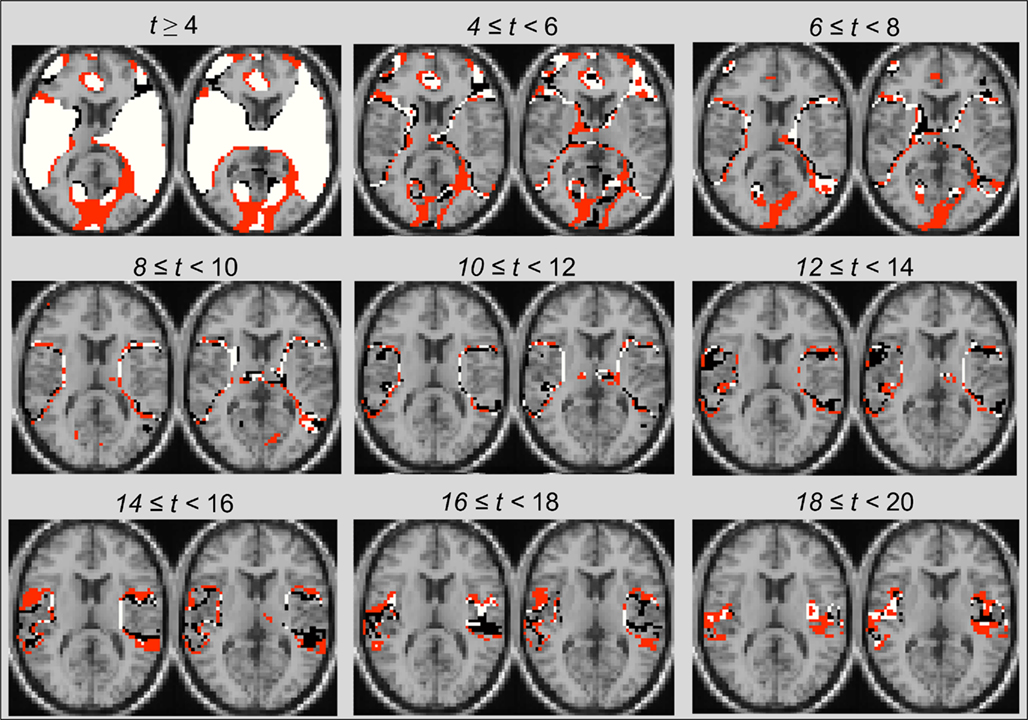
Figure 9. Illustration of transition zones using range-thresholding of the primary task-positive component t-map obtained through group-ICA. All voxels are labeled based on the method – (i) “black”: Before ICA-fNORM, (ii) “red”: After ICA-fNORM, and (iii) white – voxels active in both (i) and (ii). Most edge-based differences are seen at lower and middle-range thresholds whereas large cluster-based differences are seen at high thresholds.
Discussion
In this paper, we presented a new framework for functional normalization using resting state networks. We provided evidence suggesting that the proposed algorithm assists in improving the statistical results of activation patterns extracted from task-fMRI data. Temporally coherent INs were treated as a basis set depicting functional boundaries of an individual’s brain (REST-fMRI) and successfully utilized to re-align the same individual’s data acquired while they performed a cognitive task. Thus, each individual’s task data was brought to a standard space by warping it based on spatial variations in functional domains relative to the group. The improvement in statistics led to some noteworthy findings about the functional involvement of various regions as compared to what was known before application of ICA-fNORM. However, there is enough room for further investigation in order to accurately interpret and parcellate the subtle changes introduced as a result of computational approaches such as these.
The different fMRI images obtained from the two approaches (MNI-based normalization and MNI-based + ICA-fNORM) were first seen to be different through minor changes observed in the histograms presented in Figure 4. There was minimal morphological distortion and minor changes in the shape of the brain after proper application of functional normalization (see Morphological and Intensity Variations for a discussion of the need to reset the affine transformation to an identity matrix). Therefore, the proposed algorithm re-aligns the task-fMRI data without introducing large morphological or intensity variations in the resulting images.
Enhanced Detection Sensitivity
Analysis of the functionally re-aligned AOD data showed larger activation volumes. This result was further supported by metrics computed using t-maps from the two analysis methods (ICA and GLM). In order to compare the results on a global scale, difference threshograms were presented for each template in Figure 7 (GLM) and Figure 8 (ICA).
Comparisons based on GLM analysis revealed substantial differences in spatial properties of activation. Spatial analysis of t-maps demonstrated large overlapping and differential areas of activation for either or both methods (Figure 5). Application of ICA-fNORM resulted in considerably greater number of voxels being active at high levels of significance. These voxels mostly existed as small clusters or edges around regions active prior to ICA-fNORM, especially around the supramarginal gyrus, superior and middle temporal regions, and the thalamus. Such spatial behavior was observed irrespective of the functional template (TLrest or DMNrest) used for normalization. More prominent shape of the temporal lobe was observed in case of activation components derived using ICA as compared to the β-maps derived using GLM. However, the two methods share the primary spatial characteristics of activation patterns observed, that is, the differences introduced after ICA-fNORM mostly exist around edges and in the form of small overlapping clusters as seen from Figures 5 and 6. For the ICA results, the t-statistics improved consistently across the task-engaged region after application of ICA-fNORM for the TLrest template. However, a different behavior was observed in case of DMNrest which exhibited decreasing differences until a certain threshold (t > 15), followed by a positive gain at higher t-values. The transitions from negative to positive gain occur at t = 15 which is also the peak threshold in case of TLrest. To further support these findings, a brief discussion on transition zones alongside thresholded representations of ICA component map was provided in Section “Transition Regions” where we demonstrated that there were an increasing number of voxels showing differences at high threshold levels.
It is possible that changes in activation extent (Figures 7 and 8) in group analysis can be a result of complicated interactions between individual subject’s activation boundaries during the functional normalization performed using SPM’s spatial normalization routine (low dimensional non-linear basis functions). However, significant improvements in statistics were observed even in regions that were spatially distant from the region(s) used for functional normalization, for, e.g., ICA-fNORM with DMNrest improved statistics for regions active within the temporal lobe. This provides initial evidence to suggest that there are undiscovered relationships between the intrinsic functional organization of an individual’s brain and the manner it deploys resources to process a cognitive task.
Default Mode Network and ICA-fNORM
Several studies in the past have shown the deactivation patterns in the DMN to be associated with regions routinely exhibiting positively task-modulated patterns (Raichle et al., 2001; Fox et al., 2005). Even though DMN is known to be negatively modulated during a task, we hypothesized that the spatial boundaries of an individual’s DMN during rest can be used to re-align the functional boundaries corresponding to the same brain while it performs a cognitive task. We bolstered our argument relating intrinsic functional boundaries and task-related statistics by presenting results obtained after applying ICA-fNORM using an intrinsic network (DMNrest) that is known to be deactivated during a task (see Spatial Overlap and Differential Analysis, Difference Threshogram Analysis, and Region-of-Interest Analysis). In addition to being negatively task-modulated, the DMNrest template does not spatially correlate with the positively task-modulated region (temporal lobe) and yet we observe large improvements in a statistical sense (Tables 1 and 2) and in detection sensitivity (Figures 5–8). The improvements in detection sensitivity were rather obvious from the results corresponding to the GLM analysis (Figures 5 and 7). However, a relatively contrasting result in ICA analysis was observed for the case when the DMNrest template was utilized for re-alignment. The number of significantly active voxels demonstrated negative gain for relatively lower (6 < t < 15) and positive gain for higher (t > 16) thresholds (see Figure 7, and Tables 2 and 3). We hypothesize that re-alignment with warp parameters based on DMNrest leads to complimentary interactions with the task-engaged region (temporal lobe) at a global level. This led to improvement in statistics especially at higher t-values. Such a behavior can reveal initial information regarding the DMN’s boundaries being more interactive with voxels that were of high significance in majority of subjects, and thus being highly significant at a group level. By individually warping each subject’s DMNrest network to the group mean, our method was able to compensate for the inter-subject variability in activation boundaries for this particular network. As a result, the statistics and detection sensitivity increased considerably at a group level, irrespective of the type of template used for normalization.
Intra-Group Regional Dependencies Revealed by ICA-fNORM
The spatial analysis done using threshograms and overlapping t-maps did not reveal information about anatomical regions that experienced change, large or small, after functional normalization. In order to specifically label the anatomical regions that comprise the activation patterns obtained after different methods of normalization, we applied an ROI analysis on activation t-maps from GLM and ICA as presented in Section “Region-of-Interest Analysis.” This revealed further details about the specific improvements in certain statistical features that were helpful in supporting the utility of our proposed method. Using this ROI analysis, it was discovered that certain regions such as the thalamus, superior and middle temporal gyrus, supramarginal gyrus, and precentral gyrus demonstrated consistent improvements in number of significant voxels, mean t-values, and local maximum, across both analysis methods (GLM and ICA). In case of task-positive template (TLrest), most identified regions show consistent percentage gain in tmax and tmean values irrespective of the analysis method used as seen in Tables 1–3. However, in the case of DMNrest template, the two regions also identified as the primary task-engaged regions – (1) superior temporal gyrus, and (2) middle temporal gyrus, stood out in terms of improvement in local maxima and mean t-values irrespective of the method used.
Another striking change observed as a result of applying ICA-fNORM was the shift in the location of the global maximum (tmax) of the TLAOD component from the insula to the superior temporal gyrus. The latter region, in addition to the middle temporal gyrus, is known to be relatively more engaged in processing the auditory stimulus (targets) presented randomly during the AOD task (Kiehl et al., 2005). Thus, the new location of the global maximum is more intuitive and anatomically relevant to the task at hand as compared to the results observed before (see Table 2). These changes suggest that intrinsic functional systems within the brain are capable of compensating for the inter-subject variation in functional properties. Thus, the above observations further strengthen the undiscovered, but statistically favorable relationships between the boundaries of intrinsically and variably modulated functional systems with task-modulated regions of highest significance within each individual. Hence, the results (Tables 1–3) suggest our method may provide relatively more accurate information regarding the location of activation maxima, voxels, and boundaries involved in processing the task stimuli.
Other Experiments with ICA-fNORM
We believe that applying ICA-fNORM to the REST-fMRI data using the resting state networks that are derived from the same data set might assist in making better decisions about functional network connectivity and also reveal new regions that have significant connections that were previously averaged out due to inter-subject functional variability. Three substantial reasons for why we used AOD fMRI were – (1) to validate the approach on an independently acquired data set, (2) to show that the INs at rest can be used to spatially normalize the INs at work, and (3) use both GLM and ICA to validate the framework on task data that has a specific temporal pattern associated with it in contrast to the low-frequency fluctuations within resting state networks. On the other hand, the notion of using activation networks from the task data set to re-align the same data may theoretically be considered a valid approach but it is more susceptible to circular analysis (double-dipping) type of concerns that may in turn bias the final results. However, the work by Sabuncu et al. (2010) has revealed that using two different tasks, known to engage similar brain regions, for functional re-alignment can convincingly improve the statistical significance of the regions involved in performing the task. This work provided initial evidence that cross-utilization of information from multiple data sets could be used in order to make more informed inference about the patterns of neural activity.
Methodological Limitations and Future Work
Non-Linear Registration and Subject-Level Improvements: A Pragmatic Explanation
When studying a group of subjects, it is a known fact that structure and function are not always tightly coupled. Perfect registration of structure does not imply the same for regions that perform similar functions in different individuals. In this paper we introduced a novel framework that utilized resting state networks to derive a functionally standard space specific for a group of subjects. This process revealed interesting positive and negative relationships between various intrinsic resting networks and regions involved in performing a task. In this section we discuss a few methodological limitations and present possible reasoning and arguments.
A noteworthy issue with the current model used to derive the non-linear warps is its property of being non-invertible, thus making it difficult to transfer the results from template space to subjects’ individual co-ordinates. An alternative to compute inverse deformation fields that exists within SPM5 uses symmetric priors and group-specific averages to compute mappings efficiently (Ashburner et al., 2000). We plan to experiment with inverse deformations and other algorithms that generate invertible mappings as part of our future work. Another possible problem that may arise as a result of non-linear warping is unnecessary spatial expansion of certain regions, especially the ones corresponding to high loading values in the resting state ICA templates used for registration. To further explore this issue, subject-specific activation maps obtained after ICA (temporal lobe component) of AOD data are overlaid and compared in Figure 10. Different colors in Figure 10A represent the number of subjects with that particular voxel active. Regions with the most striking differences between before and after ICA-fNORM results exist near the center of activation regions where most subjects have significantly active (z > 3) voxels. This finding is further illustrated in Figure 10B where voxels that are significant (z > 3) in all 28 subjects are shown separately using an axial rendering. These differences help establish the fact that there is certain improvement in functional significance of centrally located voxels across all subjects without introducing a large number of false positives (expected due to non-linear registration) within the activation region (see Figure 10A).
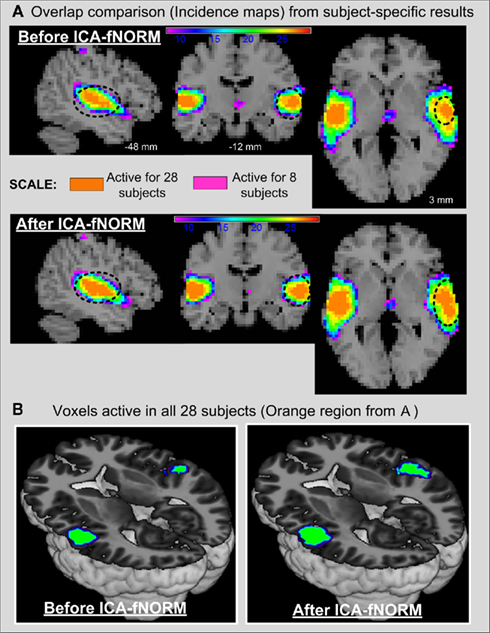
Figure 10. Subject-specific results from all 28 subjects presented using incidence maps from the temporal lobe IC derived from before and after ICA-fNORM data sets. (A) Incidence maps with voxels that overlap in at least 8 subjects (pink) to all 28 subjects (orange). Significant differences near the center of activation clusters are highlighted to illustrate higher functional significance of neighboring voxels after ICA-fNORM is applied. (B) Rendering of voxels from all 28 subjects to highlight the improvement in functional localization at a subject-specific level. More common voxels across subjects are found to be significant after applying ICA-fNORM.
At this stage, it is appropriate to re-iterate that we chose two specific networks as templates in order to illustrate a proof-of-concept explaining the possibility of doing re-alignment of task-fMRI using resting state fMRI data. This paper, at no point, claims to suggest that these networks are the best suited FT for normalization of AOD data. It is evident from existing literature that performing an auditory oddball task excites a network of regions in the temporal, parietal, frontal cortices, and insula. Thus, it is highly likely that these INs may prove to be more or as much useful for functional re-alignment. We propose to investigate effects of using combination of multiple components in coherence with a more sophisticated registration scheme as a part of related future work.
For the Future: Extending the Proof-of-Concept
In future, we intend to explore aspects that may help improve the current methodology and ultimately result in a highly robust and simple-to-implement framework. To start with, we are currently working on methods to develop a template that combines multiple INs to extract normalization parameters from the resting state group fMRI data. In addition, we also wish to explore and apply some of the more general spatial normalization approaches that utilize diffeomorphic transformations such as DARTEL (implemented within SPM) and others (Marsland and Twining, 2004; Ashburner, 2007; Avants et al., 2008; Sabuncu et al., 2009) to compute warps between the group level activation map and the subject-specific maps.
A possible application may be to use the ICA-fNORM methodology as the last pre-processing step when performing inter-group comparisons, for example, healthy controls and schizophrenia patients. The inter-group differences are expected to change and possibly reveal marked dissimilarities in cognitive systems co-existing in rest and task that may have been difficult to detect earlier due to the large magnitude of inter-subject variations, especially within the patient groups. However, there is still some uncertainty whether the disrupted networks in task would be affected negatively from the rest networks, eventually resulting in loss of activation information. It remains to be seen if we can somehow utilize methods that establish cross-task relationships, to better understand some of the convoluted brain dynamics underlying various neurodegenerative illnesses.
Conclusion
This article lays a foundation for utilizing several known resting (intrinsic) networks as multiple basis functions to derive a functionally standard space. Our proposed framework, termed as ICA-fNORM utilizes the inter-subject variation in functional boundaries across a group to better align the functional domains within task-fMRI data recorded for the same group. A comprehensive set of results presented in this paper show significant improvements in detection sensitivity, localization of activity, and above all statistical significance of most regions known to be involved in performing an auditory oddball task. Using a task-positive (TLrest) and a task-negative (DMNrest) intrinsic network as separate FT not only helps achieve gains in the statistical significance of the derived results, but also reveal interesting relationships about variability in interactions at multiple levels of significance (transition zones). We used two INs separately to demonstrate the proof-of-concept, but a future direction motivated by this work is to utilize more networks as a combination. Our results suggest that combining multiple INs into a single functional template, based on the nature of task (auditory, visual, or attention), may help uncover higher levels of interactions associated with intrinsic dynamics and task-performance. We believe that the proposed method has a lot of potential and can be considered user-ready in its current form for experimentation under various pre-processing scenarios. Also, it is possible that a high dimensional warping scheme may be able to benefit this particular framework as compared to the current low dimensional scheme (from SPM) utilized in our approach.
Conflict of Interest Statement
The authors declare that the research was conducted in the absence of any commercial or financial relationships that could be construed as a potential conflict of interest.
Acknowledgments
This research was supported by a research grant from National Institutes of Health (NIH–R01EB006841). The authors would like to thank their colleagues – Elena Allen, Erik B. Erhardt, David Boutte, Arvind Caprihan, Tom Eichele, Eswar Damaraju, Martin Havlicek, and Lei Wu, and the anonymous reviewers for being extremely generous with their time and continuously providing valuable comments and feedback to improve this research article.
Footnotes
References
Abou Elseoud, A., Starck, T., Remes, J., Nikkinen, J., Tervonen, O., and Kiviniemi, V. (2010). The effect of model order selection in group PICA. Hum. Brain Mapp. 31, 1207–1216.
Allen, E. A., Erhardt, E. B., Damaraju, E., Gruner, W., Segall, J. M., Silva, R. F., Havlicek, M., Rachakonda, S., Fries, J., and Kalyanam, R. (2011). A baseline for the multivariate comparison of resting-state networks. Front. Syst. Neurosci. 5:2. doi:10.3389/fnsys.2011.00002
Andersson, J. L. R., Hutton, C., Ashburner, J., Turner, R., and Friston, K. (2001). Modeling geometric deformations in EPI time series. Neuroimage 13, 903–919.
Ardekani, B., Guckemus, S., Bachman, A., Hoptman, M., Wojtaszek, M., and Nierenberg, J. (2005). Quantitative comparison of algorithms for inter-subject registration of 3D volumetric brain MRI scans. J. Neurosci. Methods 142, 67–76.
Argall, B., Saad, Z., and Beauchamp, M. (2006). Simplified intersubject averaging on the cortical surface using SUMA. Hum. Brain Mapp. 27, 14–27.
Ashburner, J., Andersson, J. L. R., and Friston, K. J. (2000). Image registration using a symmetric prior – in three dimensions. Hum. Brain Mapp. 9, 212–225.
Ashburner, J., and Friston, K. J. (1999). Nonlinear spatial normalization using basis functions. Hum. Brain Mapp. 7, 254–266.
Avants, B., Epstein, C., Grossman, M., and Gee, J. (2008). Symmetric diffeomorphic image registration with cross-correlation: evaluating automated labeling of elderly and neurodegenerative brain. Med. Image Anal. 12, 26–41.
Beckmann, C., DeLuca, M., Devlin, J., and Smith, S. (2005). Investigations into resting-state connectivity using independent component analysis. Philos. Trans. R. Soc. B Biol. Sci. 360, 1001.
Biswal, B., Mennes, M., Zuo, X., Gohel, S., Kelly, C., Smith, S., Beckmann, C., Adelstein, J., Buckner, R., and Colcombe, S. (2010). Toward discovery science of human brain function. Proc. Natl. Acad. Sci. U.S.A. 107, 4734.
Biswal, B., Yetkin, F., Haughton, V., and Hyde, J. (1995). Functional connectivity in the motor cortex of resting human brain using echo-planar MRI. Magn. Reson. Med. 34, 537–541.
Brett, M., Johnsrude, I., and Owen, A. (2002). The problem of functional localization in the human brain. Nat. Rev. Neurosci. 3, 243–249.
Calhoun, V., Adali, T., Pearlson, G., and Pekar, J. (2001). A method for making group inferences from functional MRI data using independent component analysis. Hum. Brain Mapp. 14, 140–151.
Calhoun, V., Kiehl, K., and Pearlson, G. (2008). Modulation of temporally coherent brain networks estimated using ICA at rest and during cognitive tasks. Hum. Brain Mapp. 29, 828–838.
Collins, D., Neelin, P., Peters, T., and Evans, A. (1994). Automatic 3D intersubject registration of MR volumetric data in standardized Talairach space. J. Comput. Assist. Tomogr. 18, 192.
Crivello, F., Schormann, T., Tzourio Mazoyer, N., Roland, P., Zilles, K., and Mazoyer, B. (2002). Comparison of spatial normalization procedures and their impact on functional maps. Hum. Brain Mapp. 16, 228–250.
Damoiseaux, J., Rombouts, S., Barkhof, F., Scheltens, P., Stam, C., Smith, S., and Beckmann, C. (2006). Consistent resting-state networks across healthy subjects. Proc. Natl. Acad. Sci. U.S.A. 103, 13848.
Dougherty, R., Koch, V., Brewer, A., Fischer, B., Modersitzki, J., and Wandell, B. (2003). Visual field representations and locations of visual areas V1/2/3 in human visual cortex. J. Vis. 3, 586–598.
Dubb, A., Gur, R., Avants, B., and Gee, J. (2003). Characterization of sexual dimorphism in the human corpus callosum. Neuroimage 20, 512–519.
Erhardt, E. B., Rachakonda, S., Bedrick, E. J., Allen, E. A., Adali, T., and Calhoun, V. D. (2010). Comparison of multi subject ICA methods for analysis of fMRI data. Hum. Brain Mapp. doi: 10.1002/hbm.21170
Fischl, B., Sereno, M., Tootell, R., and Dale, A. (1999). High-resolution intersubject averaging and a coordinate system for the cortical surface. Hum. Brain Mapp. 8, 272–284.
Fox, M. D., Snyder, A. Z., Vincent, J. L., Corbetta, M., Van Essen, D. C., and Raichle, M. E. (2005). The human brain is intrinsically organized into dynamic, anticorrelated functional networks. Proc. Natl. Acad. Sci. U.S.A. 102, 9673.
Freire, L., Roche, A., and Mangin, J. (2002). What is the best similarity measure for motion correction in fMRI time series? IEEE Trans. Med. Imaging 21, 470–484.
Friston, K., Ashburner, J., Frith, C., Poline, J., Heather, J., and Frackowiak, R. (1995). Spatial registration and normalization of images. Hum. Brain Mapp. 3, 165–189.
Friston, K., Holmes, A., Worsley, K., Poline, J., Frith, C., and Frackowiak, R. (1994). Statistical parametric maps in functional imaging: a general linear approach. Hum. Brain Mapp. 2, 189–210.
Genovese, C. R., Lazar, N. A., and Nichols, T. (2002). Thresholding of statistical maps in functional neuroimaging using the false discovery rate* 1. Neuroimage 15, 870–878.
Good, C., Johnsrude, I., Ashburner, J., Henson, R., Friston, K., and Frackowiak, R. (2001a). Cerebral asymmetry and the effects of sex and handedness on brain structure: a voxel-based morphometric analysis of 465 normal adult human brains. Neuroimage 14, 685–700.
Good, C., Johnsrude, I., Ashburner, J., Henson, R., Friston, K., and Frackowiak, R. (2001b). A voxel-based morphometric study of ageing in 465 normal adult human brains. Neuroimage 14, 21–36.
Grachev, I., Berdichevsky, D., Rauch, S., Heckers, S., Kennedy, D., Caviness, V., and Alpert, N. (1999). A method for assessing the accuracy of intersubject registration of the human brain using anatomic landmarks* 1. Neuroimage 9, 250–268.
Halgren, E., Marinkovic, K., and Chauvel, P. (1998). Generators of the late cognitive potentials in auditory and visual oddball tasks. Electroencephalogr. Clin. Neurophysiol. 106, 156–164.
Hammers, A., Allom, R., Koepp, M., Free, S., Myers, R., Lemieux, L., Mitchell, T., Brooks, D., and Duncan, J. (2003). Three dimensional maximum probability atlas of the human brain, with particular reference to the temporal lobe. Hum. Brain Mapp. 19, 224–247.
Hammers, A., Koepp, M., Free, S., Brett, M., Richardson, M., Labbé, C., Cunningham, V., Brooks, D., and Duncan, J. (2002). Implementation and application of a brain template for multiple volumes of interest. Hum. Brain Mapp. 15, 165–174.
Harrison, B., Pujol, J., López-Solà, M., Hernández-Ribas, R., Deus, J., Ortiz, H., Soriano-Mas, C., Yücel, M., Pantelis, C., and Cardoner, N. (2008). Consistency and functional specialization in the default mode brain network. Proc. Natl. Acad. Sci. U.S.A. 105, 9781.
Huang, C., Lee, S., Hsiao, I., Kuan, W., Wai, Y., Ko, H., Wan, Y., Hsu, Y., and Liu, H. (2010). Study-specific EPI template improves group analysis in functional MRI of young and older adults. J. Neurosci. Methods 189, 257–266.
Jang, S., Ahn, S., Yang, D., Lee, D., Kim, D., and Son, S. (2005). Cortical reorganization of hand motor function to primary sensory cortex in hemiparetic patients with a primary motor cortex infarct. Arch. Phys. Med. Rehabil. 86, 1706–1708.
Jenkinson, M. (2003). Fast, automated, N dimensional phase unwrapping algorithm. Magn. Reson. Med. 49, 193–197.
Khullar, S., Michael, A., Cahill, N., Baum, S., and Calhoun, V. (2011). ICA-fNORM: spatial normalization of fMRI data using intrinsic group-ICA netoworks. Front. Syst. Neurosci. 5:93. doi:10.3389/fnsys.2011.00093
Kiehl, K. A., Stevens, M. C., Laurens, K. R., Pearlson, G., Calhoun, V. D., and Liddle, P. F. (2005). An adaptive reflexive processing model of neurocognitive function: supporting evidence from a large scale (n = 100) fMRI study of an auditory oddball task. Neuroimage 25, 899–915.
Kubota, T., Ushijima, Y., Okuyama, C., and Nishimura, T. (2006). A region-of-interest template for three-dimensional stereotactic surface projection images: initial application to the analysis of Alzheimer’s disease and mild cognitive impairment. Nucl. Med. Commun. 27, 37.
Lancaster, J., Woldorff, M., Parsons, L., Liotti, M., Freitas, C., Rainey, L., Kochunov, P., Nickerson, D., Mikiten, S., and Fox, P. (2000). Automated Talairach atlas labels for functional brain mapping. Hum. Brain Mapp. 10, 120–131.
Lee, J., Lee, D., Kim, J., Kim, Y., Kang, E., Kang, H., Kang, K., Lee, J., Kim, J., and Park, H. (2005). Development of Korean standard brain templates. J. Korean med. sci. 20, 483.
Marsland, S., and Twining, C. J. (2004). Constructing diffeomorphic representations for the groupwise analysis of nonrigid registrations of medical images. IEEE Trans. Med. Imaging 23, 1006–1020.
Mazziotta, J., Toga, A., Evans, A., Fox, P., Lancaster, J., Zilles, K., Woods, R., Paus, T., Simpson, G., and Pike, B. (2001). A four-dimensional probabilistic atlas of the human brain. J. Am. Med. Inform. Assoc. 8, 401.
Mennes, M., Kelly, C., Zuo, X. N., Di Martino, A., Biswal, B. B., Castellanos, F. X., and Milham, M. P. (2010). Inter-individual differences in resting-state functional connectivity predict task-induced BOLD activity. Neuroimage 50, 1690–1701.
Park, H., Levitt, J., Shenton, M., Salisbury, D., Kubicki, M., Kikinis, R., Jolesz, F., and McCarley, R. (2004). An MRI study of spatial probability brain map differences between first-episode schizophrenia and normal controls. Neuroimage 22, 1231–1246.
Rademacher, J., Caviness, V. Jr., Steinmetz, H., and Galaburda, A. (1993). Topographical variation of the human primary cortices: implications for neuroimaging, brain mapping, and neurobiology. Cereb. Cortex 3, 313.
Raichle, M. E., MacLeod, A. M., Snyder, A. Z., Powers, W. J., Gusnard, D. A., and Shulman, G. L. (2001). A default mode of brain function. Proc. Natl. Acad. Sci. U.S.A. 98, 676.
Raz, N. (2005). “The aging brain observed in vivo: differential changes and their modifiers,” in Cognitive Neuroscience of Aging: Linking Cognitive and Cerebral Aging, vol. viii, eds R. Cabeza, L. Nyberg, and D. C. Park (New York, NY: Oxford University Press), :400.
Robbins, S., Evans, A., Collins, D., and Whitesides, S. (2004). Tuning and comparing spatial normalization methods. Med. Image Anal. 8, 311–323.
Sabuncu, M., Singer, B., Conroy, B., Bryan, R., Ramadge, P., and Haxby, J. (2010). Function-based intersubject alignment of human cortical anatomy. Cereb. Cortex 20, 130–140.
Sabuncu, M., Yeo, B., Van Leemput, K., Vercauteren, T., and Golland, P. (2009). Asymmetric image-template registration. Med. Image Comput. Comput. Assist. Interv. 2009, 565–573.
Saxe, R., Brett, M., and Kanwisher, N. (2006). Divide and conquer: a defense of functional localizers. Neuroimage 30, 1088–1096.
Smith, S., Fox, P., Miller, K., Glahn, D., Fox, P., Mackay, C., Filippini, N., Watkins, K., Toro, R., and Laird, A. (2009). Correspondence of the brain’s functional architecture during activation and rest. Proc. Natl. Acad. Sci. U.S.A. 106, 13040.
Thompson, P., MacDonald, D., Mega, M., Holmes, C., Evans, A., and Toga, A. (1997). Detection and mapping of abnormal brain structure with a probabilistic atlas of cortical surfaces. J. Comput. Assist. Tomogr. 21, 567.
Tootell, R., Reppas, J. B., Kwong, K. K., Malach, R., Born, R. T., Brady, T. J., Rosen, B. R., and Belliveau, J. W. (1995). Functional analysis of human MT and related visual cortical areas using magnetic resonance imaging. J. Neurosci. 15, 3215.
Tzourio-Mazoyer, N., Landeau, B., Papathanassiou, D., Crivello, F., Etard, O., Delcroix, N., Mazoyer, B., and Joliot, M. (2002). Automated anatomical labeling of activations in SPM using a macroscopic anatomical parcellation of the MNI MRI single-subject brain. Neuroimage 15, 273–289.
Watson, J., Myers, R., Frackowiak, R., Hajnal, J., Woods, R., Mazziotta, J., Shipp, S., and Zeki, S. (1993). Area V5 of the human brain: evidence from a combined study using positron emission tomography and magnetic resonance imaging. Cereb. Cortex 3, 79.
Zilles, K., Kawashima, R., Dabringhaus, A., Fukuda, H., and Schormann, T. (2001). Hemispheric shape of European and Japanese brains: 3-D MRI analysis of intersubject variability, ethnical, and gender differences. Neuroimage 13, 262–271.
Zilles, K., Schleicher, A., Langemann, C., Amunts, K., Morosan, P., Palomero-Gallagher, N., Schormann, T., Mohlberg, H., Bürgel, U., and Steinmetz, H. (1997). Quantitative analysis of sulci in the human cerebral cortex: development, regional heterogeneity, gender difference, asymmetry, intersubject variability and cortical architecture. Hum. Brain Mapp. 5, 218–221.
Keywords: fMRI, ICA, spatial normalization, functional re-alignment, inter-subject co-registration, study-specific template, resting state networks, oddball paradigm
Citation: Khullar S, Michael AM, Cahill ND, Kiehl KA, Pearlson G, Baum SA and Calhoun VD (2011) ICA-fNORM: spatial normalization of fMRI data using intrinsic group-ICA networks. Front. Syst. Neurosci. 5:93. doi: 10.3389/fnsys.2011.00093
Received: 22 August 2011;
Accepted: 27 October 2011;
Published online: 17 November 2011.
Edited by:
Raphael Pinaud, University of Oklahoma, USACopyright: © 2011 Khullar, Michael, Cahill, Kiehl, Pearlson, Baum and Calhoun. This is an open-access article subject to a non-exclusive license between the authors and Frontiers Media SA, which permits use, distribution and reproduction in other forums, provided the original authors and source are credited and other Frontiers conditions are complied with.
*Correspondence: Siddharth Khullar, The Mind Research Network, 1101 Yale Boulevard NE, Albuquerque, NM 87106, USA. e-mail: skhullar@mrn.org