Using large-scale neural models to interpret connectivity measures of cortico-cortical dynamics at millisecond temporal resolution
- Brain Imaging and Modeling Section, National Institute on Deafness and Other Communication Disorders, National Institutes of Health (NIH), Bethesda, MD, USA
Over the last two decades numerous functional imaging studies have shown that higher order cognitive functions are crucially dependent on the formation of distributed, large-scale neuronal assemblies (neurocognitive networks), often for very short durations. This has fueled the development of a vast number of functional connectivity measures that attempt to capture the spatiotemporal evolution of neurocognitive networks. Unfortunately, interpreting the neural basis of goal directed behavior using connectivity measures on neuroimaging data are highly dependent on the assumptions underlying the development of the measure, the nature of the task, and the modality of the neuroimaging technique that was used. This paper has two main purposes. The first is to provide an overview of some of the different measures of functional/effective connectivity that deal with high temporal resolution neuroimaging data. We will include some results that come from a recent approach that we have developed to identify the formation and extinction of task-specific, large-scale neuronal assemblies from electrophysiological recordings at a ms-by-ms temporal resolution. The second purpose of this paper is to indicate how to partially validate the interpretations drawn from this (or any other) connectivity technique by using simulated data from large-scale, neurobiologically realistic models. Specifically, we applied our recently developed method to realistic simulations of MEG data during a delayed match-to-sample (DMS) task condition and a passive viewing of stimuli condition using a large-scale neural model of the ventral visual processing pathway. Simulated MEG data using simple head models were generated from sources placed in V1, V4, IT, and prefrontal cortex (PFC) for the passive viewing condition. The results show how closely the conclusions obtained from the functional connectivity method match with what actually occurred at the neuronal network level.
Introduction
We try to relate present realizations with prior experiences in numerous daily life activities. For example, imagine a situation where you encounter a person during a train ride who appears to be vaguely familiar. Almost instinctively, you try to remember this person from the near or distant past. Within a short time, maybe in a few seconds, you come to a decision by matching the current face against a huge sample of faces you have known as to whether this is somebody you were familiar with from the past. Outcomes of such a matching endeavor may further decide whether you are going to start an informal social interaction with the person. Such seemingly simple tasks engage a complicated set of information processing stages in the brain. Starting with sensory processing of the facial and bodily features of the person, the human brain performs face and object recognition, recollection of short and long-term memories, and finally decision-making. All this may occur with varying levels of attention in each occurrence of the event across individuals. Brain dynamics underlying these processing stages operate at a millisecond scale to ensure that the final outcome (decision to interact) occurs as soon as possible, most likely within seconds. Existing research in sensory visual processing (Prechtl et al., 1997; Horwitz and Braun, 2004), face and object recognition (Haxby et al., 1991, 1995; DiCarlo and Cox, 2007), long-term memory retrieval (Frankland and Bontempi, 2005; Smith et al., 2010a) and decision-making (Siegel et al., 2011) suggests that large-scale brain networks are involved in each stage of neural information processing (Atkinson and Shiffrin, 1968). Hence, understanding goal directed behavior in humans will require characterization of network mechanisms at varying spatiotemporal scales from neuroimaging data recorded at high temporal resolution.
The idea of studying networks as substrates of higher order cognition has gained relatively recent popularity. Human brain mapping have traditionally relied on functional segregation studies (Felleman and van Essen, 1991) based on the fact that cortical areas get preferentially connected in terms of their functional relevance. Functional integration (Luria, 1980), the mechanism that refers to integration of information processed in distributed brain structures, can be studied with modern neuroimaging techniques. Based on these two mechanisms that govern cognitive function, it can be hypothesized that neurocognitive networks form coordinated configurations which vary in size and temporal characteristics (Kelso, 1995; Bressler and Kelso, 2001; McIntosh, 2004; Horwitz, 2005). Identifying the task-specific variations in size and temporal characteristics of large-scale neurocognitive networks is highly non-trivial. Overlapping of the network components, also known as neural degeneracy (Tononi et al., 1999), presents a significant challenge for neuroelectromagnetic data analysis and interpretation as well as quantification of spatiotemporal network boundaries. In order to unravel the temporal structure of a functionally relevant brain network, two vital questions need to be addressed simultaneously: (1) How can low dimensional functional brain networks be defined from high dimensional electromagnetic recordings? (2) How can the time scales of modulatory and compensatory network processing mechanisms be interpreted from neurodynamics? Answering these questions on a subject-by-subject basis will help us understand the neural basis of several higher order cognitive tasks.
The purpose of this article is two-fold. First, in the Overview section we review a set of existing methods that aids in inferring the existence of large-scale networks from imaging data at high temporal resolution. We also present some existing modeling approaches to simulate the dynamics of large-scale networks and indicate their importance for testing novel connectivity analysis methods. Second, we review one novel method in detail that detects the time scales of formation and extinction of large-scale neurocognitive networks from EEG/MEG data. We applied this method to simulated MEG data from a biophysically realistic large-scale neural model of a delayed match-to-sample (DMS) task to partially validate the time scales of network level processing. Only with simulated data does one have the knowledge of ground truth, and hence data from large-scale neural models encompassing neural assemblies in both hemispheres provide an ideal platform to test the efficacy and validity of novel methods that are being developed to interpret the presence of network mechanisms.
Overview of Methods to Assess Large-Scale Network Mechanisms
Identifying network substrates of higher order cognition poses a number of significant challenges. The number of nodes in a functional network and their connections can undergo reorganization within a few milliseconds. At certain instants of time, new areas may get recruited while subsisting areas disengage. Added to this is the fact that the total number of possible functional configurations that might exist within a large-scale network is itself a large number. These configurations may result from the different temporal relationships each node has on the others and are defined as functional connectivity during a specific task (Friston et al., 1993b). Alternatively, a large-scale network may need to recruit additional brain areas for task-specific information processing (Meredith and Stein, 1983; Damasio, 1989; Calvert and Thesen, 2004). Understanding this orchestra of recruitment-modulation mechanisms can be formulated as data-driven frameworks for elucidating neuronal processes (Banerjee et al., 2008; Smith et al., 2010b). There are several ways to explore the spatiotemporal features of network evolution which gives us a deeper understanding of the circuit mechanisms underlying ongoing behavior and emerging brain states. In this section we classify some of the popular concepts which are applied to neuroimaging data at high temporal resolution. The first two sections are based on indirect measurements of network function and the last two are devoted to direct measures of extracting networks.
Reduction of High Dimensional Data to a Low Dimensional Subspace
Motivated by empirical observation, it can be argued that dynamics of brain network activations following an externally presented stimulus becomes low dimensional. This simply means that a significant proportion of data can be captured by the dynamics of a few patterns using spatiotemporal mode decomposition techniques, such as principal component analysis (Friston et al., 1993a; McIntosh et al., 1996; Kelso et al., 1998), independent component analysis (ICA) (Bell and Sejnowski, 1995; Makeig et al., 1997; Onton et al., 2006; Kovacevic and McIntosh, 2007) etc., Hence, the goal of any of the dimensional reduction analyses is to explain the maximum possible variance in the data with the minimum number of modes (spatial patterns) and corresponding temporal projections. The spatial patterns can be interpreted as signatures of large-scale networks that constitute the substrate on which information processing occurs. Extracting such spatial patterns by combining temporal evolution of the corresponding behavioral task and brain recordings in a covariance matrix, allows one to study the relationship between behavior and brain signals at the network level (McIntosh et al., 1996). One common method for extracting such spatial patterns is principle components analysis (PCA). PCA (also known as singular value decomposition and Karhunen-Loève transform) involves a high dimensional rotation of the covariance matrix to rank the orthogonal dimensions (components) in the data in order of decreasing variance explained by each dimension. Hence, data distributions structured as a high dimensional ellipsoid rather than a sphere is suitable for PCA analysis. Ranking dimensions in order of variance becomes ambiguous for a spherically symmetric distribution (Jollife, 2002). Higher order statistics, e.g., kurtosis and skewness is ignored by PCA and thus any sharp or abrupt changes in variability wouldn't be extracted as an independent feature.
The orthogonality of principle components (PCs) is both an advantage and disadvantage of PCA. Orthogonal PCs provide an intuitive backdrop of data visualization. Choosing the number of PCs to use for dimensional reduction can follow quantitative approaches (Mitra and Pesaran, 1999) rather than handpicking them based on a priori hypothesis of brain areas involved. On the other hand, there is no biophysical motivation as to why patterns of activity spanned by orthogonal PCs have to be functionally relevant. This is the single biggest disadvantage of the PCA method. However, it is important to note that attributing functional significance to individual principal components is where the main disadvantage of PCA is apparent. Thus, PCA is more suited to identify the most general features in the signal, characterize the overall subspace of neural activity and disambiguate it from the noise space.
The success of relatively simpler approaches like PCA has led to the development of more complicated dimension reduction techniques based on explaining higher order statistics in the data (variance is only second-order). Commonly known as ICA (Bell and Sejnowski, 1995) these techniques come in various flavors (Makeig et al., 1997; Onton et al., 2006). Typically ICA is based on the assumption that the true underlying generators of the data are statistically independent (but not necessarily orthogonal). Hence, ICA maps do not have any preference or temporal order in which they appear in the neural time series. However, a “second-order blind identification” (SOBI) approach (Molgedey and Schuster, 1994) considers relationships between multiple time points using an autoregressive model in which sources are assumed to have both differing spatial distributions and stable power spectra. ICA algorithms can be used as a quantitative technique to reject physiological artifacts in the neural data (Delorme et al., 2007), classify electromagnetic brain activity from different population groups (Kovacevic and McIntosh, 2007) and characterize task-specific network activations from whole brain recordings (Makeig et al., 1999). The temporal structure of task-related network dynamics can also be studied using ICA (Hong et al., 2005; Grau et al., 2007). However, the challenge here lies in quantifying the right set of independent components (ICs) that capture the global properties of the network over a certain period of time. The major disadvantage of ICA is that a subset of relevant ICs for explaining a particular function is often chosen based on a priori hypothesis on the role of certain brain structures onto the task rather than a quantitative scheme.
There are other options for dimensional reduction methods that address some of the disadvantages listed here, but not yet applied consistently to EEG/MEG data analysis. Notable among these are factor analysis (Everitt, 1984), probabilistic PCA (Tipping and Bishop, 1999), locally linear embedding (Roweis and Saul, 2000). In summary, there exist several dimensional reduction techniques for developing ways to compare spatiotemporal network mechanisms underlying two tasks and identification of the onsets and offsets of task-specific information processing. Combining this with behavioral measures of task performance can give us a comprehensive understanding of the network mechanisms involved during higher order cognition.
Spectral Representations of Raw EEG/MEG Data
Spectral decomposition of neurophysiological time series has now become an essential pre-requisite for analysis of multivariate EEG/MEG signals. In 1924, Hans Berger observed that the most dominant contribution in EEG signals came from 8 to 12 Hz oscillations during wakeful relaxation with closed eyes (Niedermeyer, 1997). He named these “alpha” rhythms and correspondingly the smaller amplitude faster waves (16–25 Hz) during awake state with eyes open were denoted as “beta.” Originating in the occipital areas, alpha rhythms have been proposed to reflect the electrical activity of large-scale networks incorporating neocortical visual areas and thalamus that have strong bi-directional excitatory connections (Llinas and Pare, 1991). “Beta” rhythms have been related to synchronized firing activity of long distant brain networks (such as those comprising frontal and parietal areas) during a perceptual or cognitive task (Brovelli et al., 2004). Finally, the “gamma” oscillations (>30 Hz) initially related to processing of complex visual stimuli in pyramidal cell layers of the visual cortex (Gray et al., 1989) are now considered as a crucial ingredient for consciousness (Crick and Koch, 2003), perceptual binding (Rodriguez et al., 1999) and other higher order cognitive functions (Buzsáki, 2006).
However, for EEG/MEG time series recorded over a considerable period of time with high temporal resolution, power spectra may not show clear peaks and indeed such spectra follow a 1/freq distribution (pink noise). This scale free nature of brain dynamics has been termed self-organized criticality (Kelso, 1995; Linkenkaer-Hansen et al., 2001; Stam and de Bruin, 2004). Theoretically, the scale free nature of EEG power spectra can be viewed as counterintuitive to the notion of orderliness in EEG signals explained by dominance of one or two frequency bands, but taken together these two notions offer an attractive explanation for empirically observed brain dynamics, such as spontaneous transitions of global modes of oscillation in the absence of external input (for more detailed discussions see Kelso, 1995; Buzsáki, 2006). In this theoretical framework the ordered brain dynamics constitutes a transiently stable behavior resulting from the presence of a sensory input or task-processing on top of the perpetually critical state on which the brain sits. The spatial localization of the power spectra reveals interesting features of such transient stability. For example, the “mu” rhythm (9–11 Hz), which seems to originate from network activity involving thalamus and motor cortex, disappears when there is movement or movement intention (Steriade and Llinas, 1988). “Phi” rhythm, localized over parietal regions and comprising two sub-components; Phi1 (10–12 Hz) and Phi2 (12 Hz) are enhanced during social interaction. Phi1 during independent and Phi2 during coordinated behavior respectively (Tognoli et al., 2007). We will return to the scale-free nature of brain dynamics and try to relate it with underlying anatomical connections in a latter section. However, the key concept here is that identifying the large-scale network underlying task-related processing may lie in characterizing the spatial and temporal structure of transiently stable brain oscillations.
To understand the temporal dynamics of spectral power, time-frequency spectrograms can be computed. Primarily, this involves windowing the raw time series in small time windows over which the power spectrum is computed. To obtain a continuously varying spectrogram (power spectrum across frequency and time) wavelet (Grossman and Morlet, 1984; Antonini et al., 1992), and multitaper (Thompson, 1982) analyses techniques have been employed. One striking result obtained from the wavelet analysis was the discovery of spontaneous bursts of EEG/MEG activity in “gamma” band when spectrograms were computed over single trials (induced power) but not when they were computed from the trial averaged evoked potential time series (Tallon-Baudry et al., 1998). In a recent review, different spectral profiles have been related to different cognitive functions (Donner and Siegel, 2011). According to this hypothesis, encoding functions (such as the encoding of sensory features or motor plans) involving local computations will be reflected in gamma oscillations, whereas integrative functions (such as perceptual inference and decision-making) involving long-range interactions among distant brain regions will be reflected in beta band modulation. Time-frequency spectrograms (Percival and Walden, 1993) also allow the development of effective connectivity measures that establish the presence of networks of brain regions which communicate during the task-specific information processing. We will continue this discussion briefly in the next section. However, it is important to note that very few methods exist that quantitatively capture the onset times of spectral changes (Bokil et al., 2006). How can the onset and offset times of transiently stable large-scale oscillatory networks be computed at millisecond resolution is an open question that will be the target of future research.
Applying Direct Measures of Connectivity onto Functional Imaging Data
Functional integration (Luria, 1980) is the cortical organizational principle by which two or more brain areas can simultaneously engage in information processing via modulations of their interactions. Integration of information across distributed brain areas is required by higher order cognitive tasks (Luria, 1980; Horwitz, 1989, 2003; Horwitz et al., 1992; Sporns et al., 2004; Bressler and Tognoli, 2006; Friston, 2009). Hence, functional integration as opposed to the mechanism of functional segregation (Penfield and Erickson, 1941) operates over a larger spatial scale. Non-invasive neuroimaging techniques EEG/MEG/fMRI are ideal tools to study functional integration because they can record from multiple brain areas simultaneously. One way to measure functional integration would entail computation of statistical relationships between brain activations across different brain areas. Comparing the strengths of such connections (functional connectivity) across the entire brain will reveal the functional brain network underlying a specific task (Horwitz et al., 1992; Friston, 1994). The spatiotemporal scale of functional integration is an elusive concept (a recurring theme of this review) as it depends on the context of the experimental design (Horwitz, 2003; Kim and Horwitz, 2008). Thus a more restricted measure of functional integration—“effective connectivity”—is widely used (Friston, 1994; McIntosh et al., 1996; Horwitz et al., 1995; Horwitz, 2003; Sporns et al., 2004). Effective connectivity essentially constrains the more general functional connectivity onto a network with specified anatomical connections (McIntosh et al., 1994) between a relatively small number of nodes based on a model of the behavior being studied (Friston, 1994; McIntosh and Gonzalez-Lima, 1995; Friston et al., 2003).
In the early days of neuroimaging research, functional and effective connectivity concepts were primarily developed on modalities with high spatial resolution but low temporal resolution such as PET and fMRI (Friston et al., 1993b, 2003; Horwitz et al., 1995; Horwitz and Braun, 2004). In principle, functional connectivity changes of the order of a few milliseconds can be measured with EEG and MEG (Breakspear, 2004; Schnitzler and Gross, 2005; Wendling et al., 2009; Stam, 2010). However, results obtained from a connectivity analysis are highly dependent on the algorithms used to quantify a network and task context (Horwitz, 2003).
Perhaps the simplest measure of connectivity can be defined in terms of the correlation between neural signals from different brain areas. If X(t) and Y(t) represent the simultaneous electromagnetic activity (EEG/MEG) from two sensors at time t, correlation (CXY) between them is defined as
where, σx and Σy are standard deviations of X(t), X(t) and cov stands for covariance between X and Y over the time window of recording. Thus, correlation evaluates the degree of statistical interdependency between two time series within a given time window. It is important to note that correlation does not tell us anything about causality. A correlation analysis can also be performed on latencies of neural events across different brain areas (DiCarlo and Maunsell, 2005; Banerjee et al., 2010) or between task variables and parameters of a large-scale neural model (Daunizeau et al., 2009).
One way to understand the intricate relationship between two correlated time series can be to explore how correlated they are at different frequencies. This can be evaluated using coherence (Bendat and Piersol, 1971; Bressler et al., 1993). Coherence (ρXY) is defined as
where, SXX and SYY are power spectral densities obtained from the Fourier transforms of X and Y respectively and SXY is the cross-spectral density. Significance tests on correlation, coherence, correlation differences and coherence differences can be performed parametrically using Fisher's Z-transforms (Kleinbaum et al., 1998) as well as non-parametric tests (Maris et al., 2007) that involves creating null distributions from shuffled data sets. Coherence quantifies the degree of synchronization in the oscillatory responses from multiple brain areas. Functional brain networks can be extracted by setting thresholds on coherence values from whole brain analysis of EEG and MEG data. A potential problem with pair-wise correlation and coherence measures magnify when dealing with multivariate recordings such as EEG/MEG. Significant correlation between two time series does not overrule the fact that such a relationship may arise from a common input driving two regions, rather than two independent regions working harmoniously over time. To address this issue, both correlation and coherence can be computed invoking multivariate considerations and the corresponding quantities are called partial correlation and coherence (Fisher, 1924). Here, the inter-relationship between two time series can be conditioned on the activations of all other sensors. Several other measures of functional connectivity are used for EEG/MEG data analysis such as nonlinear coherence (Lopes da Silva et al., 1989), phase synchrony (Rodriguez et al., 1999; Pikovsky et al., 2001) and a generalized synchronization index (Arnhold et al., 1999). Typically each method is tuned to detect a specific feature of inter-relationships, however, the simpler regression based methods (correlation and coherence) seem to be the most robust in detecting the underlying neural coupling (Wendling et al., 2009). To detect the dynamics of coherence, the method of wavelet coherence have been used (Lachaux et al., 2002). This method holds a lot of promise in detecting the temporal structure of network evolution during a task.
Graph Theoretic Methods for Assessing Network Dynamics
In previous sections we presented a brief overview of some of the widely used EEG/MEG-based tools to measure the strength of inter-relationships between different brain regions. Here, we briefly present an alternative direct way to construct a functional brain network using graph theoretical tools (Bullmore and Sporns, 2009; Rubinov and Sporns, 2010). A network is characterized essentially by two components: nodes (vertices) and connections (links). Nodes in large-scale networks represent brain regions or sensors whereas connections can be anatomical, functional or effective (Horwitz et al., 1992, 1995; Friston, 1994). EEG/MEG records brain activity from sensors located outside the head and “far away” from the neural sources. Often cortical source dynamics is estimated using inverse techniques (Geselowitz, 1967; Gross et al., 2001; Hillebrand and Barnes, 2005). Hence, graph theoretic tools can be applied to both sensor level (Bassett et al., 2006; Stam, 2010) and source level (Palva et al., 2010) data. An overwhelming number of these studies indicate that the dynamical state of the networks lie near the order/disorder transition point, a phenomenon known as self-organized criticality (Stam and de Bruin, 2004; Bassett et al., 2006; Kitzbichler et al., 2009). Bassett et al. (2006) showed that the highest-frequency gamma network had greater synchronizability, greater clustering of connections, and shorter path length than networks in lower frequencies. Even though the global topology or synchronizability was not strongly influenced by the ongoing behavioral state, motor task performance was associated with emergence of long-range connections in both beta and gamma networks. Since the task was over a long time window, this observation fits within the theoretical framework of self-organized criticality governing the ongoing background activity of the brain upon which the task-specific transiently stable dynamics emerges (Buzsáki, 2006). In the future, metrics with higher temporal resolution such as wavelet coherence (Lachaux et al., 2002) may be able to reveal the time scale of transiently stable oscillations. Hypotheses about spectral markers of cognitive functions (Donner and Siegel, 2011) can be tested using this framework.
In addition to the number of nodes and connections of a network, other measures such as modularity, clustering, path length, and efficiency are often meaningful (Bassett et al., 2009; Bullmore and Sporns, 2009). Such measures seem to be ideally tuned to reveal the spatial structure of a large-scale network. Often complex brain networks are densely connected within a module and have only a few nodes that have connections with different modules. Such modes of network organization can be extracted via the measures of clustering and modularity (Meunier et al., 2010). Recent studies have tried to address the dynamics of task-specific processing in large-scale networks using complexity measures (Palva et al., 2010).
Temporal Microstructure of Large-Scale Cortical Networks Underlying Task-Related Differences
The knowledge of time scales of network level processing has been used to identify the sequential steps in task processing via feed-forward and feedback processes (Garrido et al., 2007; Liu et al., 2009). In neurophysiological studies on non-human primates, top-down and bottom-up influences on neural information processing during higher order cognitive tasks have been disambiguated using onset time detection (Hanes and Schall, 1996; Monosov et al., 2008; Liu et al., 2009). Nonetheless, there are two major limitations in extending these approaches directly to multivariate EEG/MEG data. First, task-specific network recruitment cannot be interpreted from a “pure insertion” based subtraction of brain activity during control from the task condition, because the possibility of temporal modulation via changes in the strength of functional connections cannot be easily ruled out (Friston et al., 1996). Second, the existing analysis methods are somewhat tuned in an either/or fashion to address the spatial or temporal aspects of network dynamics.
To circumvent some of these issues, we have recently developed a computational framework that decodes the temporal microstructure of spatiotemporal network mechanisms (Banerjee et al., submitted). Here, dimensional reduction techniques are used to define control subspaces from an experimental control dataset (EEG/MEG at the sensor level). Data from an experimental task condition can be reconstructed from their projections onto this control subspace. Banerjee et al. (2008) showed how the goodness of fit of such reconstructions can be used to interpret the underlying spatiotemporal network mechanisms: “temporal modulation” where the task relevant large-scale network is comprised of the network components identified for the baseline control versus “recruitment” where compensatory network involvement is required for specific aspects of task processing. In our current framework (Banerjee et al., submitted) the temporal evolution of the goodness of fit of such reconstructions is used for detection of the time scales of task-specific network recruitment at millisecond resolution. Decoding the temporal microstructure of task-specific large-scale networks based on quantitative definitions is of immense practical importance. One may be able to obtain a network level biomarker for a broad variety of higher order neural processes where information processing occurs in stages. Using our approach, quantitative statistical analysis can be performed on the resulting onset times of network recruitment at an individual subject level. In a subsequent section, we will discuss the details of our computational framework and use it to decode the temporal microstructure of network level processing on simulated MEG data for a DMS task (Atkinson and Shiffrin, 1968). We have earlier applied this analysis for a paired associate long-term memory recall task (Banerjee et al., submitted). There, we were able to decode the time scale (onset time and offset time) of task-specific networks required for retrieving an auditory object (a non-linguistic tonal pattern) paired with a visual stimuli from the long-term memory at an individual subject level. A comparison with visual-visual association indicated that the onset times for long-term memory retrieval networks appeared after an initial period of sensory processing of about 0–250 ms.
Large-Scale Neural Models
We have briefly reviewed a range of techniques that can be used to estimate the presence and functionality of brain networks (from EEG/MEG data at high temporal resolution) essential for task-specific processing. We also reviewed one such method in detail to illustrate how such methods can be applied to actual experimental data. The regression based techniques such as correlation and coherence have been shown to be the most robust in detecting changes in inter-relationships between functional units (Wendling et al., 2009). However, this is not an isolated result. Using biophysically motivated neural mass models, each method was shown to have different sensitivity profiles for functional connectivity estimation in EEG data (David et al., 2004). This, as well as several other studies (Srinivasan et al., 2007; Deco et al., 2008; Daunizeau et al., 2009; Coombes, 2010), indicate that large-scale models can become an important tool to test the validity of signal processing tools that are being applied to decipher functional connectivity in brain networks at high temporal resolution.
An important step in understanding large-scale network mechanisms is to develop an understanding of empirical EEG and MEG observations at the macroscopic level (Kelso, 1995; Horwitz et al., 1999; Buzsáki, 2006). Neural field models of macroscopic EEG/MEG activity have been used primarily to explain the dynamics of spatial patterns that are observed at the sensor level (Wilson and Cowan, 1972; Nunez, 1974; Amari, 1977; Jirsa and Haken, 1996; Robinson et al., 1997; Coombes, 2010). The underlying neural circuit mechanisms producing the spatiotemporal patterns at the sensor level are harder to address. One can only rely on the knowledge gained from electrophysiological recordings in non-human primates. Understanding from animal recordings can then be used to develop biologically realistic simulation frameworks to understand the circuit mechanisms in humans (Tagamets and Horwitz, 1998; Deco et al., 2004, 2008; Horwitz and Husain, 2007). These are large-scale approaches that consider a basic unit of neural processing to consist of excitatory and inhibitory populations of neurons within one cortical column, and the connection topology across several such units shape the overall network dynamics and ultimately control behavior. The mean field approximation is often employed by these approaches (Wilson and Cowan, 1972), which essentially means that overall activity from a population of neurons in one cortical column in a functionally active area such as V1 for processing elementary visual stimuli can be lumped into one variable whose temporal dynamics can be studied using differential equations. This approximation is supported by empirical evidence from electrophysiology (Mountcastle, 1957; Hubel and Wiesel, 1963). Event related potentials (ERPs), or changes in the brain's electromagnetic potential difference (voltage response) following the presentation of a visual/auditory/tactile stimulus recorded from EEG, reflect the collective behavior of neuronal populations combined with spatial filtering through volume conduction. Event related fields (ERFs) on the other hand capture the minute changes in magnetic fields generated from varying intensities of current sources inside the brain from MEG recordings with minimal volume condition. A combination of collective behavior and spatial filtering makes the large changes in the ERPs/ERFs highly correlated across sensors. Mathematically this makes spatiotemporal analysis of the EEG/MEG signals simpler. A high dimensional recording can be captured in terms of the dynamics of few spatial patterns (Friston et al., 1993a; Kelso et al., 1998; Banerjee et al., 2008). Modeling the collective behavior of neural networks giving rise to these patterns is of immense practical importance. They provide a phenomenological understanding of the laws which govern neurobiological elements that produce emergent dynamics (Deco et al., 2004, 2008; Assisi et al., 2005; Stefanescu and Jirsa, 2008) and can be used to validate new techniques that estimate functional connectivity (Banerjee et al., 2008).
A major advantage of using simulated large-scale models of neural dynamics is one can test the effects of different connectivity topologies on task-specific information processing. A large number of studies have shown the role of local and global connectivity in shaping cortical oscillations. For example a simplistic approximation of the feed-forward connectivity between thalamus and visual areas has been used for explain the generation of alpha rhythms (Lopes da Silva et al., 1974). Whereas, detailed models of excitatory and inhibitory neuronal populations can capture complex phenomena such as multistability (Freyer et al., 2011), and epileptic seizures (Breakspear et al., 2006). Synchronization among distant populations of neurons in the gamma frequency band has been shown to occur in a network of integrate and fire neurons with small world connection topology (Bazhenov et al., 2008). Large-scale models on the role of attention and working memory encoding in prefrontal cortex (PFC) have been highly useful for explaining fMRI and PET brain imaging results and unifying them with animal recordings (Tagamets and Horwitz, 1998; Deco et al., 2004; Horwitz et al., 2005). Similar models have been extended to understand the neural dynamics underlying perceptual and sequential decision-making (Deco and Rolls, 2005; Deco et al., 2010). Large-scale models have also been used to explain the role of neural connectivity in bimanual motor coordination (Jirsa et al., 1998; Daffertshofer et al., 2005; Banerjee and Jirsa, 2007).
Thus, large-scale models of functional brain networks provide a unique way to relate brain structure with function. Though most of the neuromodeling studies we have discussed are at the network level, numerous studies model the local circuits at the level of few neurons (Wang, 2008). A detailed overview of some of these local microcircuits can be found in Wang (2008). This also presents us an opportunity to unify different levels of neuronal dynamics in a combined theoretical framework (Deco et al., 2008). Neuroimaging data with high spatial and temporal resolution are highly complex and requires careful interpretation of brain organization often using multiple methods of data analysis if possible (Horwitz, 2003).
How Can we use Large-Scale Neural Models to Test New Network Level Measures?
Often the goal of network level measures is to understand minute changes in brain network organization during a particular task or during neurological disorders. Comparisons are drawn between different populations to reveal the change in functional neural circuitry and the strength of the results are established based on statistical significance tests. Using large-scale models of neural activity provides us with sample data sets where all underlying network organizations and parameters are completely understood. Here, one can validate the reliability and sensitivity of a novel network analysis technique. In the spirit of this approach, we performed a sensitivity analysis for the temporal microstructure analysis (Banerjee et al., submitted) presented earlier using simulated data from a large-scale neural model for a visual DMS task (Tagamets and Horwitz, 1998).
Modeling the MEG Activity During a Delayed Match-To-Sample (DMS) Task
DMS tasks involve presentation of two consecutive sensory stimuli, following which a subject has to respond whether second stimulus matches the first one (Haxby et al., 1995). They are used extensively to study working memory with neuroimaging techniques PET/fMRI in humans (Sergent et al., 1992; Haxby et al., 1995; Courtney et al., 1997; Husain et al., 2006; Schon et al., 2008) and in single unit electrophysiological recordings in monkeys (Fuster et al., 1982; Haenny et al., 1988; Fuster, 1990; Wilson et al., 1993; Miller et al., 1996). Tagamets and Horwitz (1998) proposed a large-scale neural model incorporating the major nodes of the ventral visual pathway comprising areas V1, V4, inferior temporal (IT) and the PFC to generate simulated data for a visual DMS task. These nodes were observed in PET and fMRI studies of the ventral visual stream in relation to face and object recognition (Corbetta et al., 1991; Haxby et al., 1991; Haxby et al., 1995; Sergent et al., 1992; Courtney et al., 1997; Connor et al., 2007). The basic circuit used to represent each cortical column (the basic neuronal unit in each region) is shown in Figure 1. The local response and total synaptic activity within a cortical area depends on the interactions of the afferent connections, originating from other areas and local connectivity which shapes the response. Following earlier results (Douglas et al., 1995; Tagamets and Horwitz, 1998) we have (1) 85% of the synapses in cortex are excitatory, and (2) of those, 85% are to other excitatory neurons. This high percentage of excitatory connection has given rise to the notion of “amplification” of neuronal responses within a local circuit in response to small amount of afferents. Following Tagamets and Horwitz (1998) we chose the total excitatory to excitatory connectivity weight at 0.6, excitatory to inhibitory connectivity weight at 0.15 and inhibitory to excitatory connectivity weight at −0.15 (Figure 1). Each pair of excitatory and inhibitory units is the well-known Wilson-Cowan unit (Wilson and Cowan, 1972). In our large-scale model, each brain area is composed of 81 Wilson Cowan units in 9 × 9 configuration (in order to capture complex visual patterns). We model the MEG activity for the DMS task in three steps. In the first step, we define the activation equations of membrane currents for each Wilson-Cowan unit. In the second step, we sum the activation of excitatory neurons to compute the primary currents which are the main sources of MEG data. In the third stage, we obtain the magnetic fields generated by the current sources outside the brain on a unit hemisphere using a forward solution for a spherical head (Mosher et al., 1999).
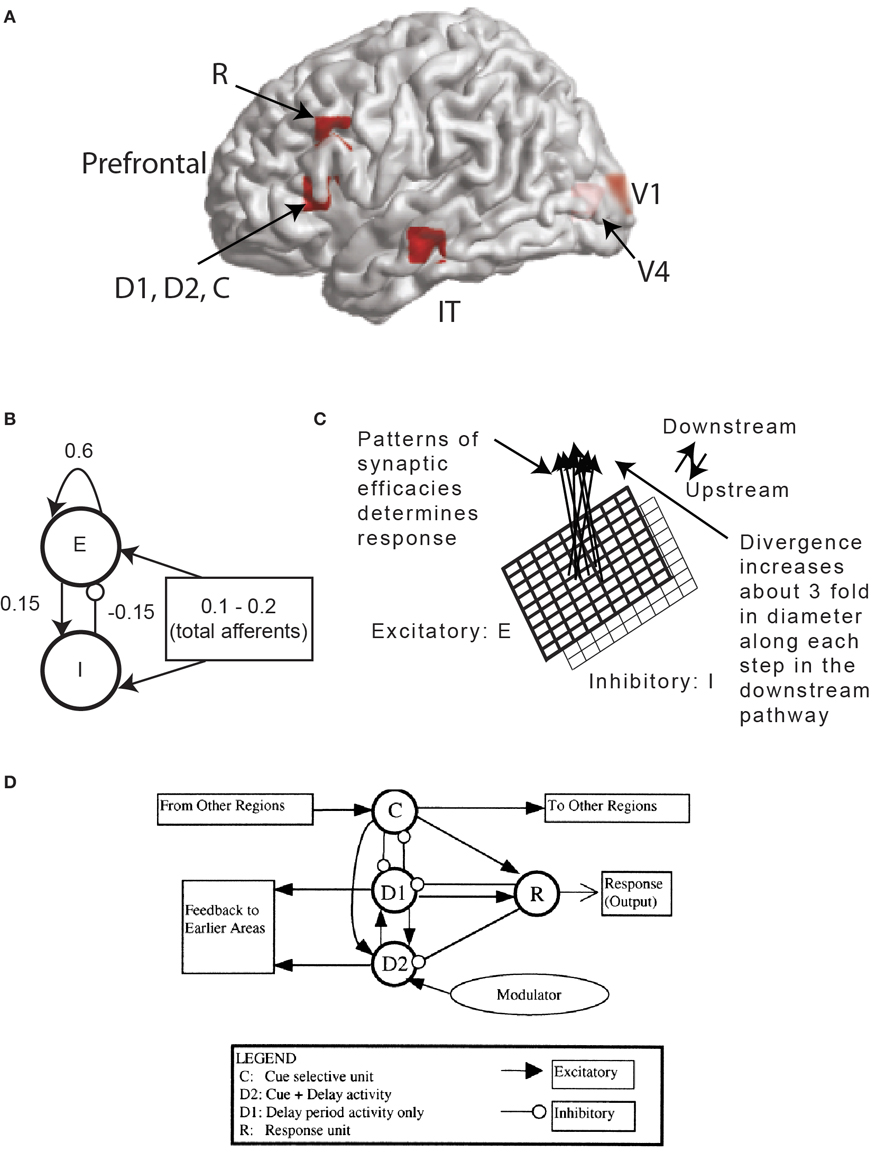
Figure 1. MEG Extension of the Tagamets-Horwitz (1998) large-scale neural model. (A) Locations in the ventral visual stream where sources are located for simulating MEG data. The 3-D Talairach coordinates have been projected to the nearest gray matter on the cortical surface within a window of 5 mm. The medial surface locations V1 and V4 are shaded in lighter color, pink whereas the lateral surface locations in inferior temporal (IT) and prefrontal cortex (PFC) in brighter red. (B) The basic Wilson-Cowan unit. E represents the excitatory population and I the inhibitory population in a local assembly such as a cortical column. Local synaptic activity is dominated by the local excitation and inhibition, while afferents account for the smallest proportion, as indicated by the synaptic weights shown. (C) A cortical area is modeled by a 9 × 9 sets of basic units. The excitatory population is shown in bold lines above the inhibitory group, shown in lighter lines. Individual units in the excitatory and inhibitory populations within a group are connected as shown in (B). (D) The working memory circuit in the prefrontal area of the model. It is composed of different types of units, as identified in electrophysiological studies, and shown in (C). Each element of the circuit shown is a basic unit, as shown in (B). Inhibitory connections are affected by excitatory connections onto inhibitory units. These D2 units also are the source of feedback into earlier areas. Figures B–D are adapted with permission from (Tagamets and Horwitz, 1998).
The electrical activity of each of the excitatory (E) and inhibitory (I) units is governed by a sigmoidal function of the summed synaptic inputs that arrive at the unit. This corresponds to average spiking rates from single-cell recordings. The electrical activity of an E-I pair is mathematically expressed as:

where, Ei(t) and Ii(t) represent the electrical activations of the ith excitatory and inhibitory elements at time t respectively. KE and KI are the gains or steepness of the sigmoid functions for excitatory and inhibitory units respectively, τ E and τ I are the input thresholds for the excitatory and inhibitory units, Δ is the rate of change, Δ is the decay rate, and N(t) is the added noise term. wEE, wIE, and wEI are the weights within a unit: excitatory-to-excitatory (value = 0.6), inhibitory-to-excitatory (value = −0.15) and excitatory-to-inhibitory (value = 0.15) respectively. iniE(t) and iniI(t) are the total inputs coming from other areas into the excitatory and inhibitory units at time t.

where, wEji and wIji are weights coming from excitatory/inhibitory unit j in another area into the ith excitatory and inhibitory units respectively. Electrical activations in the model range between 0 and 1, and can be interpreted as reflecting the percentage of active units within a local population. For this article we chose to keep parameter values (KE, KI, τ, δ, Δ) identical to (Tagamets and Horwitz, 1998).
The source of MEG activity is the primary currents across pyramidal cell assemblies dominated by excitatory connections (Okada, 1983). To obtain the source activity of magnetic dipoles, the generators of ERFs, we sum over the total inputs to one excitatory unit.

where, the first two terms on the right hand side of Equation (6) represent the contribution of excitatory inputs onto itself (no axonal delays are considered) and the third term represents the input from other excitatory units.
The DMS task involves remembering the first stimulus S1 and responding after a second stimulus S2 with a button press if S2 matches with S1. We have square patterns of light (S1 and S2) as external visual stimuli presented consecutively interspersed with a delay period. A large-scale model of the DMS task is created by including brain areas V1, V4, IT, and the PFC as the magnetic dipole sources (Figure 1A). A local short-term memory circuit is implemented in the PFC by incorporating different sub-modules (Figure 1D). We placed dipoles at the Talairach coordinates corresponding to each area (Table 1) with electrical responses as follows:
- V1/V4/IT become active during stimulation periods S1 and S2.
- Cue (C) units respond if there is a stimulus present.
- Delay only (D1) units become active during delay period after presentation of the first stimulus.
- Delay + Cue (D2) units become active during presentation of the stimulus and delay period.
- Response (R) units show a brief activation if the second stimulus matches the first and if the first stimulus is remembered.
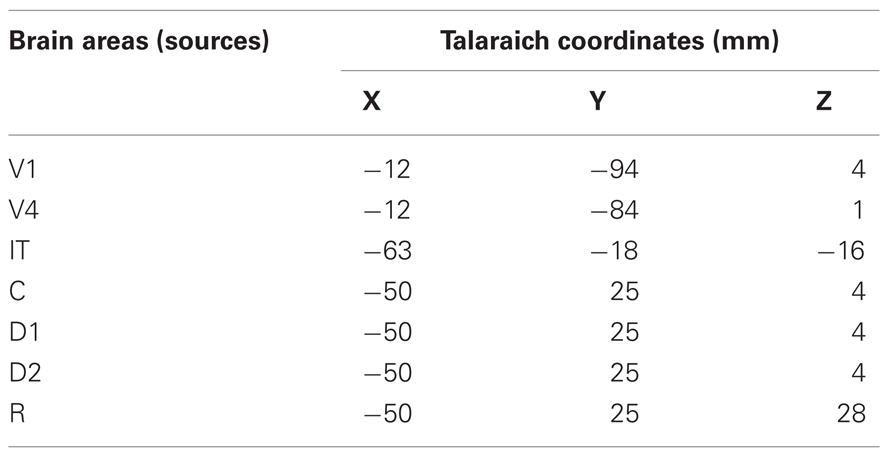
Table 1. Talaraich coordinates of the cortical sources used for simulation of MEG data.
Based on primate electrophysiological recordings (Funahashi et al., 1990), D1, D2, and C are taken to be located near one another and hence, share the same Talairach coordinates. The effect of attention in the model is implemented by a low-level, diffuse incoming activity to the D2 units as shown in Figure 1D (from the modulator). While we do not model the source of this modulation, our model makes it explicit that the D2 units are the recipients. When the attention level is low there is very little delay period activity in the D1 and D2 units (Figure 2). Hence, the prefrontal working memory network is only recruited for the DMS task during high attention. Two sources of trial-by-trial variability were incorporated in the model: (1) additive random noise to each Wilson-Cowan unit, and (2) activity of the non-specific units at a background rate were added to the DMS task-specific network (see Horwitz et al., 2005 for details). The magnetic dipole source dynamics at different brain locations are plotted in Figure 2. Finally, MEG activity at the sensor level is computed by applying a forward solution with sources at the aforementioned locations. We chose a single-shell forward model of a spherical head with unit conductivity derived by Mosher et al., (1999). MEG data were generated for DMS task with low and high levels of attention. The scalp topography of the simulated data at two different time points (stimulation and delay period respectively) is shown in Figure 2.
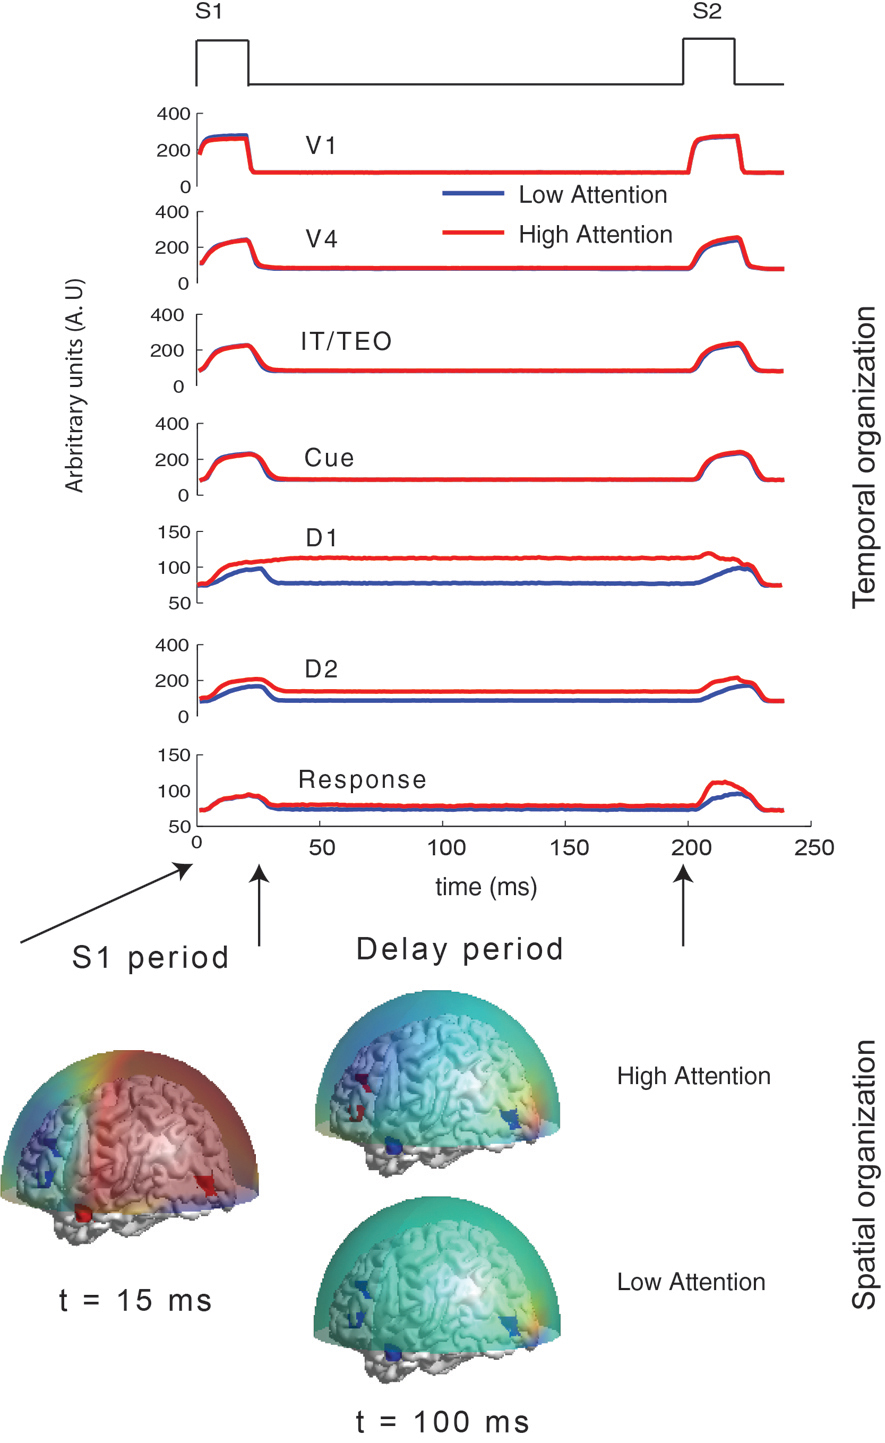
Figure 2. Temporal and spatial organization of simulated neural activity: Total currents in each brain location computed using the large-scale neural model for two different levels of attention (0 and 0.3). During stimulus S1, the sensory and object identification areas are first activated (V1, V4 and IT) followed by activations in prefrontal network (D1, D2, C, and R). For low attention (or zero attention) all units are silent during delay period because no working memory is required to perform the DMS task. D1 and D2 units have sustained activation (recruited) during delay period if high attention is required to store the identity of S1 in working memory while the other units were silent. Neuromagnetic (MEG) activity is simulated at 264 sensors using a forward solution with spherical head model. Topographic maps of this activity are plotted over a transparent hemisphere at times t = 15(within initial S1) and t = 100(during delay). During S1 similar identical network organization between passive viewing (low attention) and DMS task performance (high attention) occurs. However, network organization changes during the delay period. Discerning by looking at raw topographic maps is quite hard, as illustrated by closeness of the scalp topography between the two task conditions during delay period. The temporal microstructure of cortical network (TMCN) analysis retrieves the onset of recruitment of the task-specific prefrontal networks at the sensor level.
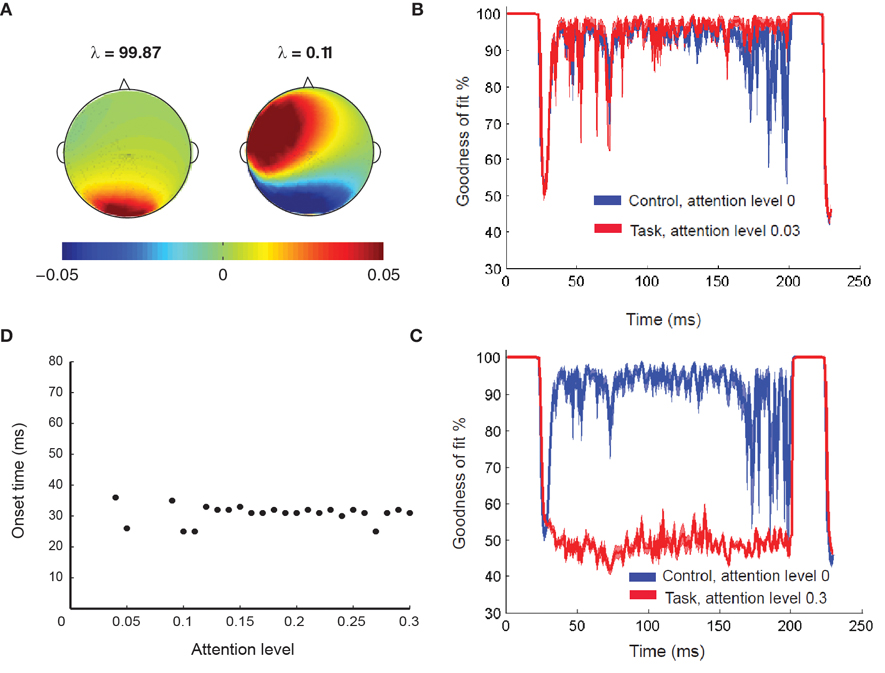
Figure 3. Temporal microstructure analysis. (A) The two principal components (and corresponding eigenvalues λ computed from the DMS task at lowest attention level that spans the control subspace. The sum of the eigenvalues amounts to the total variance of the control condition that is capture by these two patterns. (B) The mean goodness of fit of reconstruction (Gof) time series plotted as a function of time when the difference in attention levels is low. The error bars at 95% significance level are also plotted as a function of time (patches). In this scenario, lack of significant recruitment results in statistically equivalent Gofover time. (C) The mean goodness Goftime series from two conditions are plotted as a function of time when the difference in attention levels is high. The error bars at 95% significance level are also plotted as a function of time (patches). The regime of difference in Gofdistributions reflect the time scale of recruitment. (D) Sensitivity analysis for onset time detection: Onset time plotted as function of different attention levels. For all levels of attention (except the zero attention scenario) the same prefrontal network (D1, D2) is recruited in the delay period, with varying degrees of intensity. At low attention (gain<0.09), onset time of this prefrontal network recruitment occurs twice by chance. However, after a threshold level of attention (0.09), onset time is consistently detected for all higher levels.
Decoding Temporal Microstructure of Task-Related Information Processing
A key event in the DMS task is the recruitment of the local prefrontal circuit to engage the working memory network during the delay period. This is required for temporarily storing the visual stimulus S1 until S2 arrives following which a DMS response is made. The large-scale model is set up such that an effective recruitment of the prefrontal working memory network only occurs for high attention scenarios. By applying a recently developed method to identify the temporal microstructure of task processing (Banerjee et al., submitted), we sought to decode the onset times of recruitment of this network and validate if the decoded onset times correspond to those occurring in the underlying neural model. Thus, the main objective here is to illustrate the usage of large-scale models for providing face validity for connectivity analysis. The temporal microstructure analysis involves three steps:
- Defining control subspaces from the control condition (DMS task during low attention, which amounts to passive viewing).
- Reconstructing the experimental task condition (DMS task during high attention) from their projection onto the control subspace.
- Statistical comparison of goodness of fit of reconstruction time series to detect onset times of recruitment.
In principle, any of the dimensional reduction techniques discussed in the overview section can be used to compute the control subspace. However, for the purpose of this example, we chose one of the simpler methods: principal component analysis. This can be mathematically expressed as

where, DMSlow att are the simulated MEG data at the sensor level for low attention scenario, Φi's are the principal components, λi is the eigenvalue that scales component Φi, and ξi(t) is the temporal coefficient of the spatial pattern Φi. X is a column vector of all sensors, n is the number of sensors at which MEG data were simulated (n = 264, matches closely with the 275 channel CTF MEG system) and t is the instantaneous time. The first two modes Φ1 and Φ2 capture 99.98% of the total variance in data DMSlow att. Hence, we chose m = 2 to construct the control subspace.

The two modes (Φ1 and Φ2) are plotted in Figure 3A with corresponding normalized eigenvalues reflecting percentage contribution to the total variance. The MEG data for high attention DMShigh att can be reconstructed ms-by-ms by using their projections onto the vector space spanned by the set of orthogonal vectors Φ1 and Φ2.

where, 〈¦〉 indicates projection operation, and † represents transpose. The orthogonality of basis vectors is an important requirement that is guaranteed by PCA. However, non-orthogonal basis vectors can be employed in the control subspace by using the dual basis for reconstruction. Similarly, DMSlow att can be reconstructed ms-by-ms from the two control modes.

Goodness of fit of the reconstruction is computed by the following expression
where, i = low att, high att. We obtained the Gof time series for low attention and high attention DMS tasks. Using bootstrapping techniques (Efron, 1979), distributions of these variables can be derived (Figures 3B,C) for different levels of attention in the DMS task.
Using the lines of reasoning outlined in Banerjee et al. (2008), a high goodness of fit occurrence indicates that no additional nodes compared to the control network is present in the task network, whereas any depreciation of Gof from 100% will indicate recruitment of additional subspaces. The regimes where the two Gof's significantly differ are identified as the time scales of recruitment. For example if the zero attention scenario is used as control and high attention as task, then the time scale of network recruitment for storing the identity of S1 in working memory is captured by the onset and offset of significant differences in Gof (Figure 3C). On the other hand, if the DMS task is performed at a lower attention level, significant amount of network recruitment is absent and hence, the Gof distributions are statistically equivalent over time (Figure 3B). The onset time of recruitment was defined as the first point where the two Gof time series are significantly divergent with p <0.05 and remains so for 50 consecutive time points. Additionally at least for one point within this regime p should reach a value of 0.001. Choosing a window size of 50 time points sets a lower limit on the time scale of recruitment decoded from this analysis. The choosing of the time window for control subspace construction is another constraint on the network to which recruitment is analyzed. For our example, we chose to run the PCA on the entire DMS data from start of S1 to end of S2. However, choosing such time segments can also be done a posteriori from the experimental design and stability of onset times may be tested by varying the length of such windows.
The value of onset time detected by the temporal microstructure analysis (in Figure 3D) closely matched with the time at which D1 and D2 units get activated for the delay period in the high attention scenarios (Figure 2). We performed a sensitivity analysis for the temporal microstructure method by varying the attention level for the task condition and correspondingly computing the onset time for each levels of attention (Figure 3D). For low levels of attention (<0.09) our method was unable to detect an onset time consistently. However, the onset time detected after a threshold attention level of 0.09 did not change significantly when the level was parametrically varied up to 0.3. Hence, we conclude that statistically significant levels of recruitment occur for this network at a certain attention level beyond which the DMS task can be actively executed. Once the threshold attention level is reached, recruitment of a large-scale network is detected and the onset time does not change with further increases in attention level. The detection of the onset time of task-specific recruitment amounts to decoding an important event in the underlying information processing at the large-scale network level. Using similar statistical thresholds, we can also decode when the recruitment of additional nodes get disengaged. Changes in functional connectivity via interactions among overlapping components of control and task networks are not detected by the temporal microstructure analysis. Hence, the regimes where, Gof's are statistically equivalent can be used as ideal candidates for applying other functional connectivity techniques described in the overview, such as correlation and coherence. We conclude that the large-scale model provided a partial validation for the use of temporal microstructure analysis as a tool to detect spatiotemporal network mechanisms at millisecond resolution.
An important aspect of the temporal microstructure analysis that needs immediate attention is that once presence of recruitment is inferred, how can we estimate the spatial localization of recruited brain areas? This issue will be addressed in future research. The challenge here is that the residual activity which carries the signatures of spatial localization has higher noise to signal ratios than the original signals. One way to circumvent this issue would be to design experiments with a larger number of trials when the localization question needs to be answered.
The time scales of recruitment decoded from the microstructure analysis can be used as constraints for building large-scale models of behavioral tasks. Such models provide a mechanistic understanding of neural information processing. From a complementary perspective, decoding the timing of information processing is a key to understanding network mechanisms underlying ongoing behavior in action-perception paradigms where brain dynamics at millisecond resolution controls task processing. Also, in practical scenarios such as in development of neural prosthetic tools where decoding between two alternative task conditions is the often the main goal, the temporal microstructure analysis might provide a simple but robust algorithmic framework.
Summary
In this article we have provided an extended overview of methods that can detect the presence of functional brain networks for a wide variety of tasks in which information processing occurs at the network level with rich temporal behavior. EEG/MEG/iEEG provide high temporal resolution whole brain recordings that have the ability to record the elemental properties of a large-scale network. A major challenge in analyzing such giant data sets is the fact that no consensus exists as to what constitutes a large-scale network. It often depends on the modality of the imaging technique and the idiosyncrasies of the particular task that are being studied that ultimately shapes the patterns observed in the data. In addition each network level analysis (some of which are discussed in the Overview), may yield different results, sometimes seemingly conflicting. A classic example is the observation of temporally ordered brain responses (Gray et al., 1989; Tallon-Baudry et al., 1998; Tognoli et al., 2007; Donner and Siegel, 2011) and self-organized criticality (Kelso, 1995; Linkenkaer-Hansen et al., 2001; Stam and de Bruin, 2004) being simultaneously present as mechanisms of neural information processing. Interpreting such results with theoretical frameworks that allows co-existence of different mechanisms (such as Kelso, 1995; Buzsáki, 2006) will be a pre-requisite for future signal processing tools. We have recently developed a computational framework (Banerjee et al., submitted) which decodes the time scales of network level processing at high temporal resolution via characterization of two distinct modes of information processing: modulation of functional connectivity and recruitment of task-specific networks.
Our second objective in this article was to show how development of network analysis can immensely benefit from using biologically realistic large-scale models of brain activity. It is relatively easy to implement candidate functional connectivity topologies in such models at various time scales mimicking the complexity associated in real neuronal processing, following which the face validity of a novel method for network analysis can be tested on simulated data generated by the model. This is important, because only in simulated data one has the knowledge of the ground truth. Using this approach we have tested the face validity of our recently developed method to decode the temporal microstructure of task-specific information processing during a DMS task. Such tasks or its variants are used in the literature to study a diverse set of questions in higher order sensory processing (Corbetta et al., 1991; Sergent et al., 1992), multisensory integration (Haenny et al., 1988; Maunsell et al., 1991; Colombo and Gross, 1994), working memory processing (Haxby et al., 1995; Courtney et al., 1997), long-term memory retrieval (Naya et al., 1996; Smith et al., 2010a) and perceptual and cognitive decision-making (Bechara et al., 2000; Lamar et al., 2004). Hence, we believe our simple illustration of decoding network mechanisms during a DMS task may lay out a strategic framework to answer long-standing questions in several brain systems. In the future a combined modeling-decoding approach may help in characterization of timing of task-specific processing in networks at the level of single trials.
Conflict of interest statement
The authors declare that the research was conducted in the absence of any commercial or financial relationships that could be construed as a potential conflict of interest.
Acknowledgments
This research was funded by the NIDCD intramural research program.
References
Amari, S. (1977). Dynamics of pattern formation in lateral-inhibition type neural fields. Biol. Cybern. 27, 77–87.
Antonini, M., Barlaud, M., Mathieu, P., and Daubechies, I. (1992). Image coding using wavelet transform. IEEE Trans. Image Process. 1, 205–220.
Arnhold, J., Grassberger, P., Lehnertz, K., and Elger, C. E. (1999). A robust method for detecting interdependences: application to intracranially recorded EEG. Physica D-Nonlinear Phenomena 134, 419–430.
Assisi, C. G., Jirsa, V. K., and Kelso, J. A. (2005). Synchrony and clustering in heterogeneous networks with global coupling and parameter dispersion. Phys. Rev. Lett. 94, 018106.
Atkinson, R. C., and Shiffrin, R. M.eds (1968). Human Memory: A Proposed System and Its Control Processes, New York: Academic Press.
Banerjee, A., Dean, H. L., and Pesaran, B. (2010). A likelihood method for computing selection times in spiking and local field potential activity. J. Neurophysiol. 104, 3705–3720.
Banerjee, A., and Jirsa, V. K. (2007). How do neural connectivity and time delays influence bimanual coordination? Biol. Cybern. 96, 265–278.
Banerjee, A., Tognoli, E., Assisi, C. G., Kelso, J. A., and Jirsa, V. K. (2008). Mode level cognitive subtraction (MLCS) quantifies spatiotemporal reorganization in large-scale brain topographies. Neuroimage 42, 663–674.
Bassett, D. S., Bullmore, E. T., Meyer-Lindenberg, A., Apud, J. A., Weinberger, D. R., and Coppola, R. (2009). Cognitive fitness of cost-efficient brain functional networks. Proc. Natl. Acad. Sci. U.S.A. 106, 11747–11752.
Bassett, D. S., Meyer-Lindenberg, A., Achard, S., Duke, T., and Bullmore, E. (2006). Adaptive reconfiguration of fractal small-world human brain functional networks. Proc. Natl. Acad. Sci. U.S.A. 103, 19518–19523.
Bazhenov, M., Rulkov, N. F., and Timofeev, I. (2008). Effect of synaptic connectivity on long-range synchronization of fast cortical oscillations. J. Neurophysiol. 100, 1562–1575.
Bechara, A., Damasio, H., and Damasio, A. R. (2000). Emotion, decision making and the orbitofrontal cortex. Cereb. Cortex 10, 295–307.
Bell, A. J., and Sejnowski, T. J. (1995). An information-maximization approach to blind separation and blind deconvolution. Neural. Comput. 7, 1129–1159.
Bendat, J., and Piersol, A. (1971). Random Data: Analysis and Measurement Procedures. Willey- Interscience.
Bokil, H. S., Pesaran, B., Andersen, R. A., and Mitra, P. P. (2006). A method for detection and classification of events in neural activity. IEEE Trans. Biomed. Eng. 53, 1678–1687.
Breakspear, M. (2004). “Dynamic” connectivity in neural systems: theoretical and empirical considerations. Neuroinformatics 2, 205–226.
Breakspear, M., Roberts, J. A., Terry, J. R., Rodrigues, S., Mahant, N., and Robinson, P. A. (2006). A unifying explanation of primary generalized seizures through nonlinear brain modeling and bifurcation analysis. Cereb. Cortex 16, 1296–1313.
Bressler, S. L., Coppola, R., and Nakamura, R. (1993). Episodic multiregional cortical coherence at multiple frequencies during visual task performance. Nature 366, 153–156.
Bressler, S. L., and Kelso, J. A. (2001). Cortical coordination dynamics and cognition. Trends Cogn. Sci. 5, 26–36.
Bressler, S. L., and Tognoli, E. (2006). Operational principles of neurocognitive networks. Int. J. Psychophysiol. 60, 139–148.
Brovelli, A., Ding, M., Ledberg, A., Chen, Y., Nakamura, R., and Bressler, S. L. (2004). Beta oscillations in a large-scale sensorimotor cortical network: directional influences revealed by Granger causality. Proc. Natl. Acad. Sci. U.S.A. 101, 9849–9854.
Bullmore, E., and Sporns, O. (2009). Complex brain networks: graph theoretical analysis of structural and functional systems. Nat. Rev. Neurosci. 10, 186–198.
Calvert, G. A., and Thesen, T. (2004). Multisensory integration: methodological approaches and emerging principles in the human brain. J. Physiol. Paris. 98, 191–205.
Colombo, M., and Gross, C. G. (1994). Responses of inferior temporal cortex and hippocampal neurons during delayed matching to sample in monkeys (Macaca fascicularis). Behav. Neurosci. 108, 443–455.
Connor, C. E., Brincat, S. L., and Pasupathy, A. (2007). Transformation of shape information in the ventral pathway. Curr. Opin. Neurobiol. 17, 140–147.
Corbetta, M., Miezin, F. M., Dobmeyer, S., Shulman, G. L., and Petersen, S. E. (1991). Selective and divided attention during visual discriminations of shape, color, and speed: functional anatomy by positron emission tomography. J. Neurosci. 11, 2383–2402.
Courtney, S. M., Ungerleider, L. G., Keil, K., and Haxby, J. V. (1997). Transient and sustained activity in a distributed neural system for human working memory. Nature 386, 608–611.
Daffertshofer, A., Peper, C. L., and Beek, P. J. (2005). Stabilization of bimanual coordination due to active interhemispheric inhibition: a dynamical account. Biol. Cybern. 92, 101–109.
Damasio, A. R. (1989). Time-locked multiregional retroactivation: a systems-level proposal for the neural substrates of recall and recognition. Cognition 33, 25–62.
Daunizeau, J., David, O., and Stephan, K. E. (2009). Dynamic causal modelling: a critical review of the biophysical and statistical foundations. Neuroimage.
David, O., Cosmelli, D., and Friston, K. J. (2004). Evaluation of different measures of functional connectivity using a neural mass model. Neuroimage 21, 659–673.
Deco, G., Jirsa, V. K., Robinson, P. A., Breakspear, M., and Friston, K. (2008). The dynamic brain: from spiking neurons to neural masses and cortical fields. PLoS Comput. Biol. 4, e1000092. doi: 10.1371/journal.pcbi.1000092
Deco, G., and Rolls, E. T. (2005). Attention, short-term memory, and action selection: a unifying theory. Prog. Neurobiol. 76, 236–256.
Deco, G., Rolls, E. T., and Horwitz, B. (2004). “What” and “where” in visual working memory: a computational neurodynamical perspective for integrating fMRI and single-neuron data. J. Cogn. Neurosci. 16, 683–701.
Deco, G., Rolls, E. T., and Romo, R. (2010). Synaptic dynamics and decision making. Proc. Natl. Acad. Sci. U.S.A. 107, 7545–7549.
Delorme, A., Sejnowski, T., and Makeig, S. (2007). Enhanced detection of artifacts in EEG data using higher-order statistics and independent component analysis. Neuroimage 34, 1443–1449.
DiCarlo, J. J., and Cox, D. D. (2007). Untangling invariant object recognition. Trends Cogn. Sci. 11, 333–341.
DiCarlo, J. J., and Maunsell, J. H. (2005). Using neuronal latency to determine sensory-motor processing pathways in reaction time tasks. J. Neurophysiol. 93, 2974–2986.
Donner, T. H., and Siegel, M. (2011). A framework for local cortical oscillation patterns. Trends Cogn. Sci. 15, 191–199.
Douglas, R. J., Koch, C., Mahowald, M., Martin, K. A., and Suarez, H. H. (1995). Recurrent excitation in neocortical circuits. Science 269, 981–985.
Felleman, D. J., and van Essen, D. C. (1991). Distributed hierarchical processing in the primate cerebral cortex. Cereb. Cortex 1, 1–47.
Frankl, P. W. and Bontempi, B. (2005). The organization of recent and remote memories. Nat. Rev. Neurosci. 6, 119–130.
Freyer, F., Roberts, J. A., Becker, R., Robinson, P. A., Ritter, P., and Breakspear, M. (2011). Biophysical mechanisms of multistability in resting-state cortical rhythms. J. Neurosci. 31, 6353–6361.
Friston, K. J. (1994). Functional and effective connectivity in neuroimaging: a synthesis. Hum. Brain Mapp. 2, 56–78.
Friston, K. J. (2009). Modalities, modes, and models in functional neuroimaging. Science 326, 399–403.
Friston, K. J., Frith, C. D., and Frackowiak, R. S. (1993a). Principal component analysis learning algorithms: a neurobiological analysis. Proc. Biol. Sci. 254, 47–54.
Friston, K. J., Frith, C. D., Liddle, P. F., and Frackowiak, R. S. (1993b). Functional connectivity: the principal-component analysis of large (PET) data sets. J. Cereb. Blood Flow Metab. 13, 5–14.
Friston, K. J., Harrison, L., and Penny, W. (2003). Dynamic causal modelling. Neuroimage 19, 1273–1302.
Friston, K. J., Price, C. J., Fletcher, P., Moore, C., Frackowiak, R. S., and Dolan, R. J. (
Funahashi, S., Bruce, C. J., and Goldman-Rakic, P. S. (1990). Visuospatial coding in primate prefrontal neurons revealed by oculomotor paradigms. J. Neurophysiol. 63, 814–831.
Fuster, J. M. (1990). Inferotemporal units in selective visual attention and short-term memory. J. Neurophysiol. 64, 681–697.
Fuster, J. M., Bauer, R. H., and Jervey, J. P. (1982). Cellular discharge in the dorsolateral prefrontal cortex of the monkey in cognitive tasks. Exp. Neurol. 77, 679–694.
Garrido, M. I., Kilner, J. M., Kiebel, S. J., and Friston, K. J. (2007). Evoked brain responses are generated by feedback loops. Proc. Natl. Acad. Sci. U.S.A. 104, 20961–20966.
Geselowitz, D. B. (1967). On bioelectric potentials in an inhomogeneous volume conductor. Biophys. J. 7, 1–11.
Grau, C., Fuentemilla, L., and Marco-Pallares, J. (2007). Functional neural dynamics underlying auditory event-related N1 and N1 suppression response. Neuroimage 36, 522–531.
Gray, C. M., Konig, P., Engel, A. K., and Singer, W. (1989). Oscillatory responses in cat visual cortex exhibit inter-columnar synchronization which reflects global stimulus properties. Nature 338, 334–337.
Gross, J., Kujala, J., Hamalainen, M., Timmermann, L., Schnitzler, A., and Salmelin, R. (2001). Dynamic imaging of coherent sources: studying neural interactions in the human brain. Proc. Natl. Acad. Sci. U.S.A. 98, 694–699.
Grossman, A., and Morlet, J. (1984). Decomposition of Hardy functions into square integrable wavelets of constant shape. SIAM J. Math. Anal. 15, 732–736.
Haenny, P. E., Maunsell, J. H., and Schiller, P. H. (1988). State dependent activity in monkey visual cortex. II. Retinal and extraretinal factors in V4. Exp. Brain Res. 69, 245–259.
Hanes, D. P., and Schall, J. D. (1996). Neural control of voluntary movement initiation. Science, 274, 427–430.
Haxby, J. V., Grady, C. L., Horwitz, B., Ungerleider, L. G., Mishkin, M., Carson, R. E., Herscovitch, P., Schapiro, M. B., and Rapoport, S. I. (1991). Dissociation of object and spatial visual processing pathways in human extrastriate cortex. Proc. Natl. Acad. Sci. U.S.A. 88, 1621–1625.
Haxby, J. V., Ungerleider, L. G., Horwitz, B., Rapoport, S. I., and Grady, C. L. (1995). Hemispheric differences in neural systems for face working memory. Hum. Brain Mapp. 3, 68–82.
Hillebrand, A. and Barnes, G. R. (2005). Beamformer analysis of MEG data. Int. Rev. Neurobiol. 68, 149–171.
Hong, B., Acharya, S., Thakor, N., and Gao, S. (2005). Transient phase synchrony of independent cognitive components underlying scalp EEG. Conf. Proc. IEEE Eng. Med. Biol. Soc. 2, 2037–2040.
Horwitz, B. (1989). “Functional neural systems analyzed by use of interregional correlations of glucose metabolism,” in Visuomotor coordination, eds J. P. Ewert M. A. Arbib (New York: Plenum Press).
Horwitz, B. (2005). Integrating neuroscientific data across spatiotemporal scales. C R Biol. 328, 109–118.
Horwitz, B., and Braun, A. R. (2004). Brain network interactions in auditory, visual and linguistic processing. Brain Lang. 89, 377–384.
Horwitz, B., Grady, C. L., Haxby, J. V., Schapiro, M. B., Rapoport, S. I., Ungerleider, L. G., and Mishkin, M. (1992). Functional associations among human posterior extrastriate brain regions during object and spatial vision. J. Cogn. Neurosci. 4, 311–322.
Horwitz, B., and Husain, F. T. (2007). “Simulation frameworks for large-scale brain systems,” in Handbook of Brain Connectivity, eds V. K. Jirsa A. R. McIntosh (Springer-Verlag).
Horwitz, B., McIntosh, A. R., Haxby, J. V., Furey, M., Salerno, J. A., Schapiro, M. B., Rapoport, S. I., and Grady, C. L. (1995). Network analysis of PET-mapped visual pathways in Alzheimer type dementia. Neuroreport 6, 2287–2292.
Horwitz, B., Tagamets, M. A., and McIntosh, A. R. (1999). Neural modeling, functional brain imaging, and cognition. Trends Cogn. Sci. 3, 91–98.
Horwitz, B., Warner, B., Fitzer, J., Tagamets, M. A., Husain, F. T., and Long, T. W. (2005). Investigating the neural basis for functional and effective connectivity. Application to fMRI. Philos. Trans. R. Soc. Lond. B Biol. Sci. 360, 1093–1108.
Hubel, D. H., and Wiesel, T. N. (1963). Shape and arrangement of columns in cat's striate cortex. J. Physiol. 165, 559–568.
Husain, F. T., Fromm, S. J., Pursley, R. H., Hosey, L. A., Braun, A. R., and Horwitz, B. (2006). Neural bases of categorization of simple speech and nonspeech sounds. Hum. Brain. Mapp. 27, 636–651.
Jirsa, V. K., Fuchs, A., and Kelso, J. A. (1998). Connecting cortical and behavioral dynamics: bimanual coordination. Neural. Comput. 10, 2019–2045.
Jirsa, V. K., and Haken, H. (1996). Field theory of electromagnetic brain activity. Phys. Rev. Lett. 77, 960–963.
Kelso, J. A., Fuchs, A., Lancaster, R., Holroyd, T., Cheyne, D., and Weinberg, H. (1998). Dynamic cortical activity in the human brain reveals motor equivalence. Nature 392, 814–818.
Kim, J., and Horwitz, B. (2008). Investigating the neural basis for fMRI-based functional connectivity in a blocked design: application to interregional correlations and psycho-physiological interactions. Magn. Reson. Imaging 26, 583–593.
Kitzbichler, M. G., Smith, M. L., Christensen, S. R., and Bullmore, E. (2009). Broadband criticality of human brain network synchronization. PLoS Comput Biol, 5, e1000314. doi: 10.1371/journal.pcbi.1000314
Kleinbaum, D., Kupper, L. L., Muller, K. E., and Nizam, A. (1998). Applied Regression Analysis and Other Multivariable Methods. Duxbery Press.
Kovacevic, N., and McIntosh, A. R. (2007). Groupwise independent component decomposition of EEG data and partial least square analysis. Neuroimage 35, 1103–1112.
Lachaux, J. P., Lutz, A., Rudrauf, D., Cosmelli, D., Le Van Quyen, M., Martinerie, J., and Varela, F. (2002). Estimating the time-course of coherence between single-trial brain signals: an introduction to wavelet coherence. Neurophysiol. Clin. 32, 157–174.
Lamar, M., Yousem, D. M., and Resnick, S. M. (2004). Age differences in orbitofrontal activation: an fMRI investigation of delayed match and nonmatch to sample. Neuroimage 21, 1368–1376.
Linkenkaer-Hansen, K., Nikouline, V. V., Palva, J. M., and Ilmoniemi, R. J. (2001). Long-range temporal correlations and scaling behavior in human brain oscillations. J. Neurosci. 21, 1370–1377.
Liu, H., Agam, Y., Madsen, J. R., and Kreiman, G. (2009). Timing, timing, timing: fast decoding of object information from intracranial field potentials in human visual cortex. Neuron 62, 281–290.
Lopes da Silva, F., Pijn, J. P., and Boeijinga, P. (1989). Interdependence of EEG signals: linear vs. nonlinear associations and the significance of time delays and phase shifts. Brain Topogr. 2, 9–18.
Lopes da Silva, F. H., Hoeks, A., Smits, H., and Zetterberg, L. H. (1974). Model of brain rhythmic activity. The alpha-rhythm of the thalamus. Kybernetik 15, 27–37.
Makeig, S., Jung, T. P., Bell, A. J., Ghahremani, D., and Sejnowski, T. J. (1997). Blind separation of auditory event-related brain responses into independent components. Proc. Natl. Acad. Sci. U.S.A. 94, 10979–10984.
Makeig, S., Westerfield, M., Townsend, J., Jung, T. P., Courchesne, E., and Sejnowski, T. J. (1999). Functionally independent components of early event-related potentials in a visual spatial attention task. Philos. Trans. R. Soc. Lond. B Biol. Sci. 354, 1135–1144.
Maris, E., Schoffelen, J. M., and Fries, P. (2007). Nonparametric statistical testing of coherence differences. J. Neurosci. Methods 163, 161–175.
Maunsell, J. H., Sclar, G., Nealey, T. A., and Depriest, D. D. (1991). Extraretinal representations in area V4 in the macaque monkey. Vis. Neurosci. 7, 561–573.
McIntosh, A. R. (2004). Contexts and catalysts: a resolution of the localization and integration of function in the brain. Neuroinformatics 2, 175–182.
McIntosh, A. R., Bookstein, F. L., Haxby, J. V., and Grady, C. L. (1996). Spatial pattern analysis of functional brain images using partial least squares. Neuroimage 3, 143–157.
McIntosh, A. R., and Gonzalez-Lima, F. (1995). Functional network interactions between parallel auditory pathways during Pavlovian conditioned inhibition. Brain. Res. 683, 228–241.
McIntosh, A. R., Grady, C. L., Ungerleider, L. G., Haxby, J. V., Rapoport, S. I., and Horwitz, B. (1994). Network analysis of cortical visual pathways mapped with PET. J. Neurosci. 14, 655–666.
Meredith, M. A., and Stein, B. E. (1983). Interactions among converging sensory inputs in the superior colliculus. Science 221, 389–391.
Meunier, D., Lambiotte, R., and Bullmore, E. T. (2010). Modular and hierarchically modular organization of brain networks. Front. Neurosci. 4, 200. doi: 10.3389/fnins.2010.00200
Miller, E. K., Erickson, C. A., and Desimone, R. (1996). Neural mechanisms of visual working memory in prefrontal cortex of the macaque. J. Neurosci. 16, 5154–5167.
Mitra, P. P., and Pesaran, B. (1999). Analysis of dynamic brain imaging data. Biophys. J. 76, 691–708.
Molgedey, L., and Schuster, H. G. (1994). Separation of a mixture of independent signals using time delayed correlations. Phys. Rev. Lett. 72, 3634–3637.
Monosov, I. E., Trageser, J. C., and Thompson, K. G. (2008). Measurements of simultaneously recorded spiking activity and local field potentials suggest that spatial selection emerges in the frontal eye field. Neuron 57, 614–625.
Mosher, J. C., Leahy, R. M., and Lewis, P. S. (1999). EEG and MEG: forward solutions for inverse methods. IEEE Trans. Biomed. Eng. 46, 245–259.
Mountcastle, V. B. (1957). Modality and topographic properties of single neurons of cat's somatic sensory cortex. J. Neurophysiol. 20, 408–434.
Naya, Y., Sakai, K., and Miyashita, Y. (1996). Activity of primate inferotemporal neurons related to a sought target in pair-association task. Proc. Natl. Acad. Sci. U.S.A. 93, 2664–2669.
Niedermeyer, E. (1997). Alpha rhythms as physiological and abnormal phenomena. Int. J. Psychophysiol. 26, 31–49.
Okada, Y. (1983). “Neurogenesis of evoked magnetic fields,” in Biomagnetism: An Interdisciplinary Approach, (New York: Plenum Press).
Onton, J., Westerfield, M., Townsend, J., and Makeig, S. (2006). Imaging human EEG dynamics using independent component analysis. Neurosci. Biobehav. Rev. 30, 808–822.
Palva, S., Monto, S., and Palva, J. M. (2010). Graph properties of synchronized cortical networks during visual working memory maintenance. Neuroimage 49, 3257–3268.
Penfield, W., and Erickson, T. C. eds (1941). Epilepsy and Cerebral Localization: A Study of the Mechanism, Treatment and Prevention of Epileptic Seizures. Springfield, IL: Charles C Thomas.
Percival, D. B., and Walden, A. T. (1993). Spectral Analysis for Physical Applications. New York: Cambridge university press.
Pikovsky, A., Rosenblum, M., and Kurths, J. (2001). Synchronization: A Universal Concept in Nonlinear Sciences. Cambridge Nonlinear Science Series.
Prechtl, J. C., Cohen, L. B., Pesaran, B., Mitra, P. P., and Kleinfeld, D. (1997). Visual stimuli induce waves of electrical activity in turtle cortex. Proc. Natl. Acad. Sci. U.S.A. 94, 7621–7626.
Robinson, P. A., Rennie, C. A., and Wright, J. J. (1997). Propagation and stability of waves of electrical activity in the cerebral cortex. Phys. Rev. E 56, 826–840.
Rodriguez, E., George, N., Lachaux, J. P., Martinerie, J., Renault, B., and Varela, F. J. (1999). Perception's shadow: long-distance synchronization of human brain activity. Nature 397, 430–433.
Roweis, S. T., and Saul, L. K. (2000). Nonlinear dimensionality reduction by locally linear embedding. Science 290, 2323–2326.
Rubinov, M., and Sporns, O. (2010). Complex network measures of brain connectivity: uses and interpretations. Neuroimage 52, 1059–1069.
Schnitzler, A., and Gross, J. (2005). Functional connectivity analysis in magnetoencephalography. Int. Rev. Neurobiol. 68, 173–195.
Schon, K., Tinaz, S., Somers, D. C., and Stern, C. E. (2008). Delayed match to object or place: an event-related fMRI study of short-term stimulus maintenance and the role of stimulus pre-exposure. Neuroimage 39, 857–872.
Sergent, J., Ohta, S., and Macdonald, B. (1992). Functional neuroanatomy of face and object processing. A positron emission tomography study. Brain 115, 15–36.
Siegel, M., Engel, A. K., and Donner, T. H. (2011). Cortical network dynamics of perceptual decision-making in the human brain. Front. Hum. Neurosci. 5, 21. doi: 10.3389/fnhum.2011.00021
Smith, J. F., Alexander, G. E., Chen, K., Husain, F. T., Kim, J., Pajor, N., and Horwitz, B. (2010a). Imaging systems level consolidation of novel associate memories: a longitudinal neuroimaging study. Neuroimage 50, 826–836.
Smith, J. F., Pillai, A., Chen, K., and Horwitz, B. (2010b). Identification and validation of effective connectivity networks in functional magnetic resonance imaging using switching linear dynamic systems. Neuroimage 52, 1027–1040.
Sporns, O., Chialvo, D. R., Kaiser, M., and Hilgetag, C. C. (2004). Organization, development and function of complex brain networks. Trends Cogn. Sci. 8, 418–425.
Srinivasan, R., Winter, W. R., Ding, J., and Nunez, P. L. (2007). EEG and MEG coherence: measures of functional connectivity at distinct spatial scales of neocortical dynamics. J. Neurosci. Methods 166, 41–52.
Stam, C. J. (2010). Use of magnetoencephalography (MEG) to study functional brain networks in neurodegenerative disorders. J. Neurol. Sci. 289, 128–134.
Stam, C. J., and de Bruin, E. A. (2004). Scale-free dynamics of global functional connectivity in the human brain. Hum. Brain Mapp. 22, 97–109.
Stefanescu, R. A., and Jirsa, V. K. (2008). A low dimensional description of globally coupled heterogeneous neural networks of excitatory and inhibitory neurons. PLoS Comput. Biol. 4, e1000219. doi: 10.1371/journal.pcbi.1000219
Steriade, M., and Llinas, R. R. (1988). The functional states of the thalamus and the associated neuronal interplay. Physiol. Rev. 68, 649–742.
Tagamets, M. A., and Horwitz, B. (1998). Integrating electrophysiological and anatomical experimental data to create a large-scale model that simulates a delayed match-to-sample human brain imaging study. Cereb. Cortex 8, 310–320.
Tallon-Baudry, C., Bertrand, O., Peronnet, F., and Pernier, J. (1998). Induced gamma-band activity during the delay of a visual short-term memory task in humans. J. Neurosci. 18, 4244–4254.
Tipping, M. E., and Bishop, C. M. (1999). Mixtures of probabilistic principal component analyzers. Neural. Comput. 11, 443–482.
Tognoli, E., Lagarde, J., Deguzman, G. C., and Kelso, J. A. (2007). The phi complex as a neuromarker of human social coordination. Proc. Natl. Acad. Sci. U.S.A. 104, 8190–8195.
Tononi, G., Sporns, O., and Edelman, G. M. (1999). Measures of degeneracy and redundancy in biological networks. Proc. Natl. Acad. Sci. U.S.A. 96, 3257–3262.
Wendling, F., Ansari-Asl, K., Bartolomei, F., and Senhadji, L. (2009). From EEG signals to brain connectivity: a model-based evaluation of interdependence measures. J. Neurosci. Methods 183, 9–18.
Wilson, F. A., Scalaidhe, S. P., and Goldman-Rakic, P. S. (1993). Dissociation of object and spatial processing domains in primate prefrontal cortex. Science 260, 1955–1958.
Keywords: EEG, MEG, large-scale networks, information processing, high resolution, timing, decoding, delayed match-to-sample (DMS)
Citation: Banerjee A, Pillai AS and Horwitz B (2012) Using large-scale neural models to interpret connectivity measures of cortico-cortical dynamics at millisecond temporal resolution. Front. Syst. Neurosci. 5:102. doi: 10.3389/fnsys.2011.00102
Received: 26 August 2011; Accepted: 16 December 2011;
Published online: 06 January 2012.
Edited by:
Gustavo Deco, Universitat Pompeu Fabra, SpainReviewed by:
Gustavo Deco, Universitat Pompeu Fabra, SpainGregor Rainer, University of Fribourg, Switzerland
Copyright: © 2012 Banerjee, Pillai and Horwitz. This is an open-access article distributed under the terms of the Creative Commons Attribution Non Commercial License, which permits non-commercial use, distribution, and reproduction in other forums, provided the original authors and source are credited.
*Correspondence: Arpan Banerjee, Brain Imaging and Modeling Section, National Institute on Deafness and Other Communication Disorders, National Institutes of Health (NIH), 10 Center Drive, Room 5D39, Bethesda, MD 20892, USA. e-mail: Arpan.Banerjee@nih.gov