Network deficiency exacerbates impairment in a mouse model of retinal degeneration
- 1 Department of Ophthalmology, Burke Medical Research Institute, Weill Medical College of Cornell University, White Plains, NY, USA
- 2 Department of Neurology, Burke Medical Research Institute, Weill Medical College of Cornell University, White Plains, NY, USA
Neural oscillations play an important role in normal brain activity, but also manifest during Parkinson’s disease, epilepsy, and other pathological conditions. The contribution of these aberrant oscillations to the function of the surviving brain remains unclear. In recording from retina in a mouse model of retinal degeneration (RD), we found that the incidence of oscillatory activity varied across different cell classes, evidence that some retinal networks are more affected by functional changes than others. This aberrant activity was driven by an independent inhibitory amacrine cell oscillator. By stimulating the surviving circuitry at different stages of the neurodegenerative process, we found that this dystrophic oscillator further compromises the function of the retina. These data reveal that retinal remodeling can exacerbate the visual deficit, and that aberrant synaptic activity could be targeted for RD treatment.
Introduction
In the CNS, neuronal cell death triggers a compensatory response within surviving tissue (Schnitzler and Gross, 2005). In the visual system, retinal degeneration (RD) results in photoreceptor cell death, which is followed by structural remodeling of surviving retinal tissue (Marc et al., 2003), including changes in synaptic connectivity (Strettoi et al., 2004) and receptor expression (Peng et al., 2000; Chua et al., 2009), leading to aberrant oscillatory activity (Margolis et al., 2008; Stasheff, 2008). Though significant progress has been made in characterizing these changes and identifying the source of this activity, it remains unclear (i) how different retinal pathways are affected by remodeling, (ii) what mechanism initiates this oscillatory activity, and (iii) what functional implications this noise has on the surviving retinal circuitry.
Multiple retinal pathways encode different aspects of the sensory signal. At the level of retinal output, this segregation is reflected by numerous types of retinal ganglion cells (GCs; Wassle, 2004). Unlike other retinal cells, GCs remain structurally (Mazzoni et al., 2008) and functionally (Margolis et al., 2008) stable during RD, which allows the physiological effects of structural remodeling in presynaptic cells to be observed by monitoring GC activity. Given the diversity of GCs, previous physiological characterizations of RD GCs, which considered only three cell classes (Margolis et al., 2008; Borowska et al., 2011), may not fully describe pathway-specific differences in retinal remodeling. We took physiological recordings from a large population of GCs from rd1 mouse retinas, which were classified into 11 groups based on morphological measurements. The occurrence and properties of aberrant oscillations varied largely with cell class, suggesting differences between visual pathways in their susceptibility to RD-induced functional changes.
Various cell types are known to produce oscillations in healthy retina. However, the cells responsible for oscillations in RD retina remain unclear. The source of the aberrant activity has been attributed to dystrophic bipolar cells (BCs; Menzler and Zeck, 2011) or, in contrast, to a circuit of dystrophic AII amacrine and cone BCs (Borowska et al., 2011). We combined single-cell recordings with pharmacological analysis to show that an amacrine cell (AC) oscillator is necessary and sufficient to drive aberrant activity in rd1 retina. BC oscillations are present in both wt and rd1 retina, but are unaffected by RD and are unnecessary for aberrant activity in rd1.
Sensory loss due to photoreceptor death due to photoreceptor death has been well characterized (Strettoi et al., 2002; Gargini et al., 2007; Stasheff, 2008; Stasheff et al., 2011), but the functional impact of aberrant activity within surviving retinal tissue has not. By stimulating the inner retina with electrical pulses, we demonstrate that the efficiency of signal transmission is greatly reduced by synaptic noise, which increases as degeneration progresses.
Together, these data provide potential targets for treatment of RD, demonstrating variability in pathway-specific resilience to remodeling, identifying an independent source of aberrant oscillations in retina, and showing that eliminating oscillatory noise could be a treatment in itself.
Materials and Methods
In all experimental procedures, the animals were treated according to the regulations in the ARVO Statement for the Use of Animals in Ophthalmic and Vision Research and in compliance with protocols approved by Weill Cornell Medical College. Wild type (C57BL/6J) and rd1 (C3H/HeJ) mice of either sex were purchased from the Jackson Laboratory (Bar Harbor, ME, USA).
Preparation of Retinal Wholemounts
Experimental procedures were similar to those in earlier work (Sagdullaev et al., 2011). All mice (P21–75) were euthanized in the morning on the day of the experiment. The eyes were enucleated and placed in oxygenated standard HEPES-buffered extracellular solution. The cornea, iris and lens were removed with small scissors. The retina was dissected into four equal quadrants, which were attached photoreceptor surface down to a modified translucent Millicell filter ring (Millipore, Bedford, MA, USA). Individual rings were transferred to a recording chamber on the stage of an upright Nikon FN1 microscope. To reduce discrepancy between preparations and reduce contribution of photoreceptors to maintained activity, both wt and rd1 retinas were maintained in light-adapting conditions. The recording chamber was constantly superfused (1 mL/min) with bicarbonate-buffered Ringer’s extracellular solution, bubbled with 95% O2 and 5% CO2. Reagents including 6-cyano-7-nitroquinoxaline-2,3-dione (CNQX), 1,2,5,6-tetrahydropyridine-4yl) methyphosphinic acid (TPMPA), strychnine hydrochloride, nifedipine, mibefradil dihydrochloride hydrate, bicuculline methbromide, Lidocaine N-ethyl bromide (QX-314) were obtained from Sigma (St. Louis, MO, USA); D(-)-2-amino-5-phosphonopentanoic acid (D-AP5), and SR95531 hydrobromide (gabazine) were obtained from Tocris (Ballwin, MO, USA).
Retinal Stimulation and Recording Procedures
Ganglion cell spiking activity was recorded in a cell-attached mode. Whole-cell recordings were made using patch pipettes filled with intracellular solution containing (in mM) 120 Cs-gluconate, 10 tetraethylammonium chloride (TEA-Cl), 1.0 CaCl2, 1.0 MgCl2, 11 ethylene glycol-bis-(beta-aminoethyl ether)-N,N,N′,N′-tetraacetic acid (EGTA), and 10 sodium N-2-hydroxyethylpiperazine-N′-2-ethanesulfonic acid (Na-HEPES), adjusted to pH 7.2 with CsOH. The calculated ECl for this solution was −58 mV. The intracellular solution was supplemented with 0.05% sulforhodamine B. Electrodes were pulled from borosilicate glass (1B150F-4; WPI, Sarasota, FL, USA) with a P-97 Flaming/Brown puller (Sutter Instruments, Novato, CA, USA) and had a measured resistance of ∼4–7 MΩ. Cell-attached and voltage-clamp recordings were made with MultiClamp 700B patch-clamp amplifiers (Molecular Devices, Sunnyvale, CA, USA). All stimulation and recording routines were controlled by Signal software (CED, UK). Data were filtered at 5 kHz with a four-pole Bessel filter and were sampled at 15 kHz. Resting excitatory and inhibitory postsynaptic currents, EPSCs (Vh = −60 mV) and IPSCs (Vh = 0 mV), respectively, were recorded for all cells. For the experiments involving the light stimulation, the microscope’s illuminator was used to deliver a ∼300 μm in diameter spot of light was centered on the GC receptive field. The tissue was adapted at 30 cd/m2, and stimulus was 270 cd/m2 within visible light range. An aperture, a series of neutral density filters and FN-C LWD condenser (Nikon) were used to control size, intensity and focal plane of the stimulus. Duration of the light stimulus (0.5 s) was controlled by a Uniblitz shutter (Vincent Associates, Rochester, NY, USA). For electrical (zap) stimulation, a positive current pulse (0.1–1 ms; 3–15 μA, Grass Technologies, West Warwick, RI, USA) was applied to the BCs using a patch pipette filled with extracellular solution (Sagdullaev et al., 2011). For cross-cell comparisons, the stimulus intensity was adjusted at the level yielding a half-maximal response, experimentally determined by intensity–response curves obtained for each cell, following the procedures described previously (Sagdullaev et al., 2006, 2011). GCs were clamped at +40 mV. This paradigm allowed us to (a) account for both excitatory and inhibitory inputs that are known to contribute to spiking output via both excitation and disinhibition, (b) sample the integral current without bias toward cell-specific excitatory and inhibitory inputs, and (c) relieve NMDARs from Mg2+-block seen at negative potentials. Temperature of the solution and the recording chamber was maintained at near physiological range of 32–35°C.
Morphological Characterization
Each GC was filled with sulforhodamine B, included in patch pipette solution. At the end of each recording session, contrast and fluorescent images of the cell were documented with a modified Nikon D5000 DSLR attached to a Nikon FN1 microscope. The preparation was immediately placed in glass bottom culture dish (Matek, Ashland, MA, USA) and transferred to a stage of a Nikon C1 confocal microscope. A z-stack of 160 images was acquired at 0.5 μm steps at a resolution of 1024 × 1024 pixels. A nuclear stain stock solution, 2 μL of an equal mixture of 12 mM ethidium bromide and 100 μM To-Pro-3 (Invitrogen, Carlsbad, CA, USA) was added for determining the borders of the inner plexiform layer (IPL, Figure 1). GCs were distinguished from displaced ACs by the presence of an axon. As previously described (Sun et al., 2002), for dendritic field (DF) size, a polygon was drawn by linking the tips of dendrites, and the area calculated. The area was converted back to diameter by assuming a circular DF. Cell body size was measured similarly. The level at which the GC dendritic processes stratified in the IPL was measured as the distance of its processes from the proximal (0%) to distal margin (100%) of the IPL. In general, ON GCs were defined as those whose dendrites stratified <60% of the IPL depth, and OFF GCs stratified >60% of the IPL depth. Measurement of cell properties was performed with ImageJ and Nikon EZ-C1 software. Cells were classified under two different methods. First, cell body size, DF diameter, and depth of dendritic stratification were used to classify cells in adherence to the groups described by Sun et al. (2002). This was done to verify a broad sampling of previously identified classes in both wild type (Sun et al., 2002) and RD (Mazzoni et al., 2008) GCs, and to establish a baseline for cluster analysis (Kong et al., 2005). Second, a cluster analysis was performed using SPSS (SPSS Inc., Chicago, IL, USA), with stratification depth and DF diameter as parameters (Badea and Nathans, 2004; Kong et al., 2005). This followed the method described by Badea and Nathans: Ward’s joining method was used to determine the number of clusters by a separation threshold of 25% of the greatest distance between nodes, followed by a k-means analysis to determine cluster membership. Monostratified and bistratified cells were analyzed separately. For bistratified cells, the dendritic depth and the area were obtained for both branches.
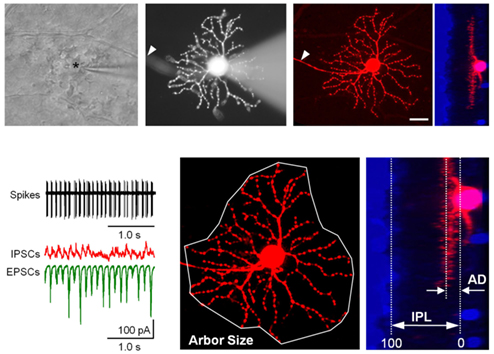
Figure 1. Recording procedures and identification of GCs in RD retinal wholemount. Top. The view at the retinal ganglion cell (GC) layer in wholemount retinal preparation. The outlines of individual cell bodies are visible across the field. The recording pipette is targeting one of the GCs (asterisk). Fluorescent image of the same GC with attached recording pipette filled with sulforhodamine B (monochrome image). GCs were distinguished from displaced amacrine cells by the presence of an axon (arrowhead). Following the characterization of excitatory (EPSCs) and inhibitory (IPSCs) inputs and spiking output, the pipette was detached and the detailed dendritic structure was reconstructed using confocal microscopy. A z-stack of 161 images was acquired at 0.5 μm steps at 1024 × 1024 pixel resolution. A nuclear stain (Ethidium Bromide with To-Pro-3, blue) was subsequently added to aid in determining the thickness of the inner plexiform layer (IPL). Scale bar – 20 μm. Bottom. (Left) Spikes and currents recorded from the same cell. (Middle) Arbor area and (Right) depth of the dendritic arbors (AD) were measured as illustrated.
Analysis
Currents were analyzed using Signal. The term “bursting” refers to periodic spiking activity measured with extracellular GC recordings, while “oscillations” refer to periodic current activity measured in voltage-clamp mode. To quantify the strength of synaptic oscillations, the power spectra of traces were obtained using a Hanning window, with 0.076 Hz bins. Frequency of oscillations was determined by finding the peak power within the range of 0.1 and 30 Hz. Cells with a peak greater than 2 SD above the mean of this range were considered to be oscillating at that frequency. Otherwise, cells were considered to be non-oscillating. Changes in oscillatory activity across a given experiment were illustrated in heat maps, where a series of power spectra for a given cell was obtained (using 20 s segments) and plotted on a time scale. Excitatory-to-inhibitory ratios were calculated by dividing the oscillatory power measured from EPSC traces by that measured from IPSC traces (Margolis et al., 2008). To measure efficiency of synaptic transmission of evoked response, signal-to-noise ratio (SNR) was calculated from DC-adjusted traces by dividing the charge transfer of the response (signal) by the charge transfer of unstimulated activity (noise) over equivalent epoch (250 ms). Spectrograms were generated for consecutive recording frames using custom scripts written for Matlab (Mathworks, Natick, MA, USA). Statistical analyses were performed using SigmaPlot (Systat Software Inc. Richmond, CA, USA) and SPSS. All data are reported as means ± SEM. Student’s t-test or paired t-tests were used for group comparisons or ANOVA for multiple comparisons. Two-way ANOVA was used where multiple factors were considered; one-way ANOVA was used unless otherwise specified. Multivariate pair-wise comparisons across treatment conditions were made with repeated-measures MANOVA.
Results
The following experiments analyze the effect of RD-induced oscillations on different retinal pathways, the mechanism of these oscillations, and the functional implications on retinal transmission. Our work is presented in three sections: (i) morphological classification of a large population of rd1 GCs and identification of class-specific variations in aberrant activity, (ii) isolation of two distinct oscillators and evaluation of their relative contribution to activity in both rd1 and wt retinas, and (iii) characterization of the efficiency of signal transmission through the surviving inner retinal network in rd1.
The Incidence and Nature of Oscillatory Inputs Varies Across Identified rd1 GC Classes
Morphological differences between GCs reflect distinct visual pathways that process unique features of the visual signal (Wassle, 2004), and numerous classes of GCs have been identified in wt and RD mouse retina (Sun et al., 2002; Badea and Nathans, 2004; Kong et al., 2005; Mazzoni et al., 2008). Here, we use a classification scheme based on cluster analysis of morphological measurements (Badea and Nathans, 2004; Kong et al., 2005), to better reflect GC diversity and to quantify class-specific physiological effects of RD (see Materials and Methods).
Bursting activity was recorded in ∼70% of rd1 GCs (n = 181), across six monostratified and five bistratified cell clusters (Table 1; Figure 2), which were compared to an earlier classification scheme (Sun et al., 2002) to verify a representative sample of previously identified GCs (Kong et al., 2005; Mazzoni et al., 2008). Monostratified cells varied in bursting probability. Clusters with larger DFs (≥199 μm) were more likely to burst (∼80%) within any given stratum, while those with smaller DFs (<199 μm) were less likely to burst (∼36%) within proximal strata but more likely (approaching 80%) distally (Figure 3B). Overall, cells with larger DFs were more likely to burst (81.8 versus 60.3%).
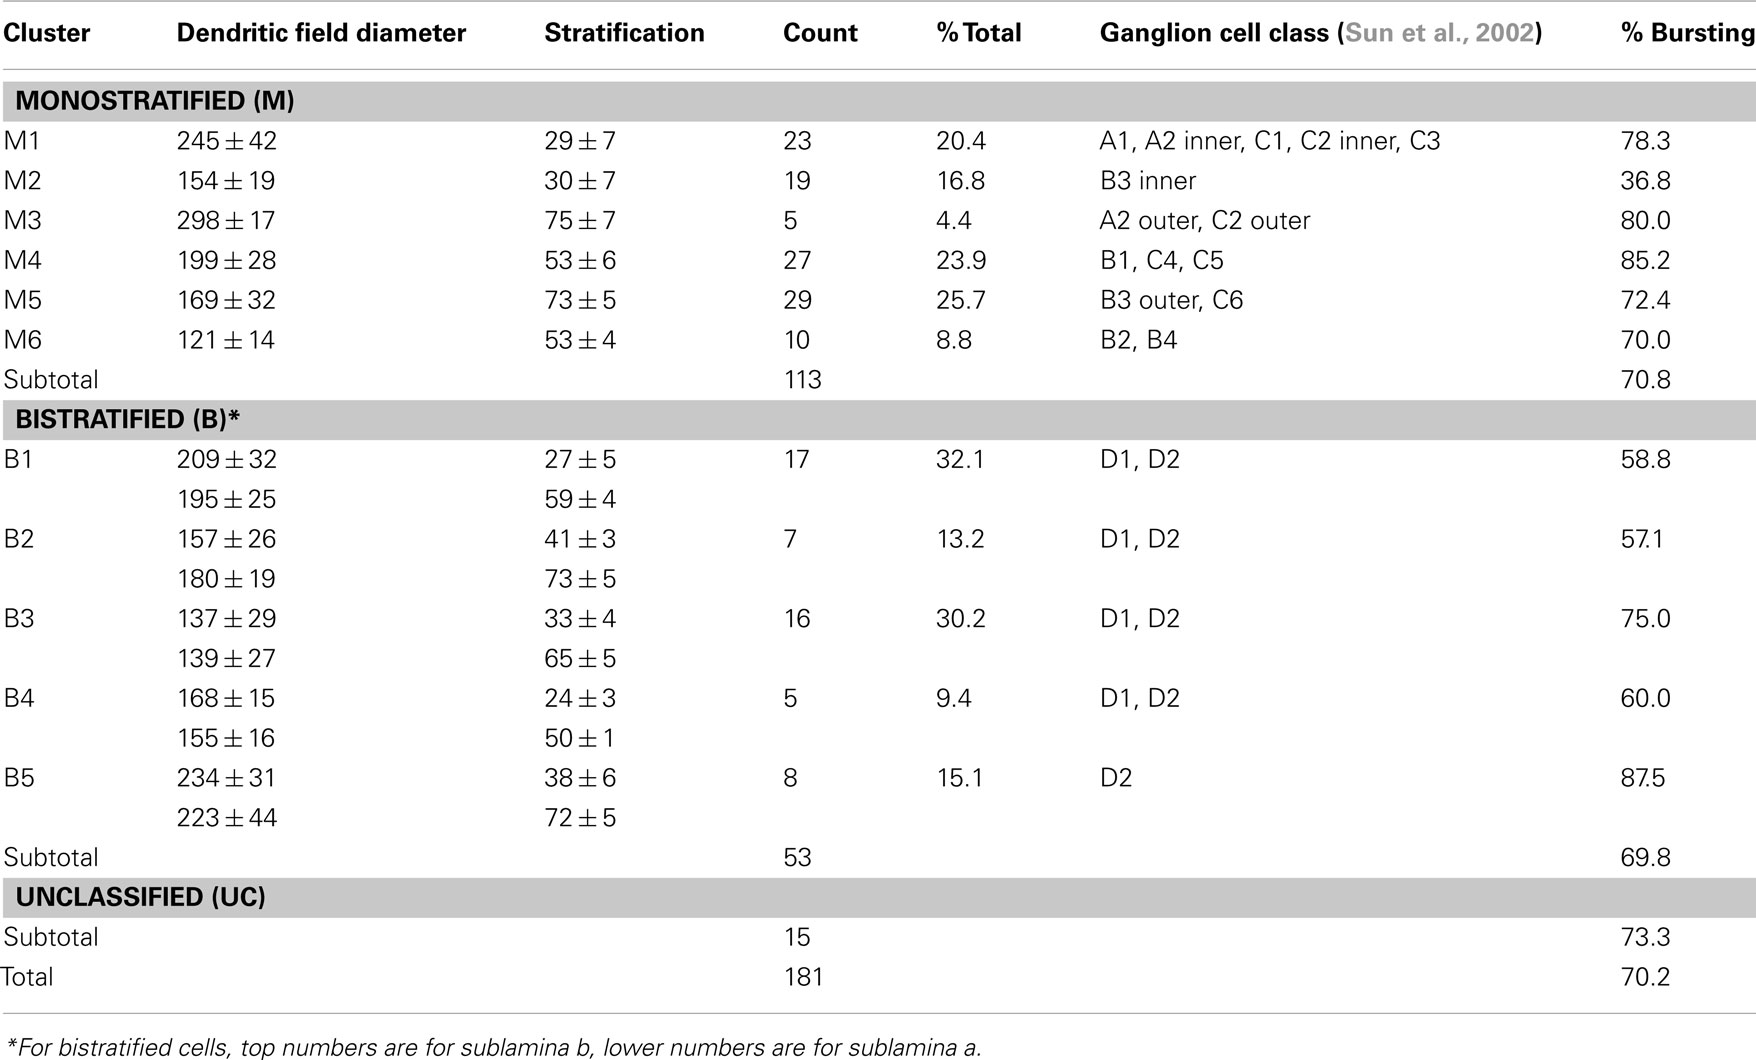
Table 1. Morphological classes of physiologically characterized ganglion cells in rd1 retina.
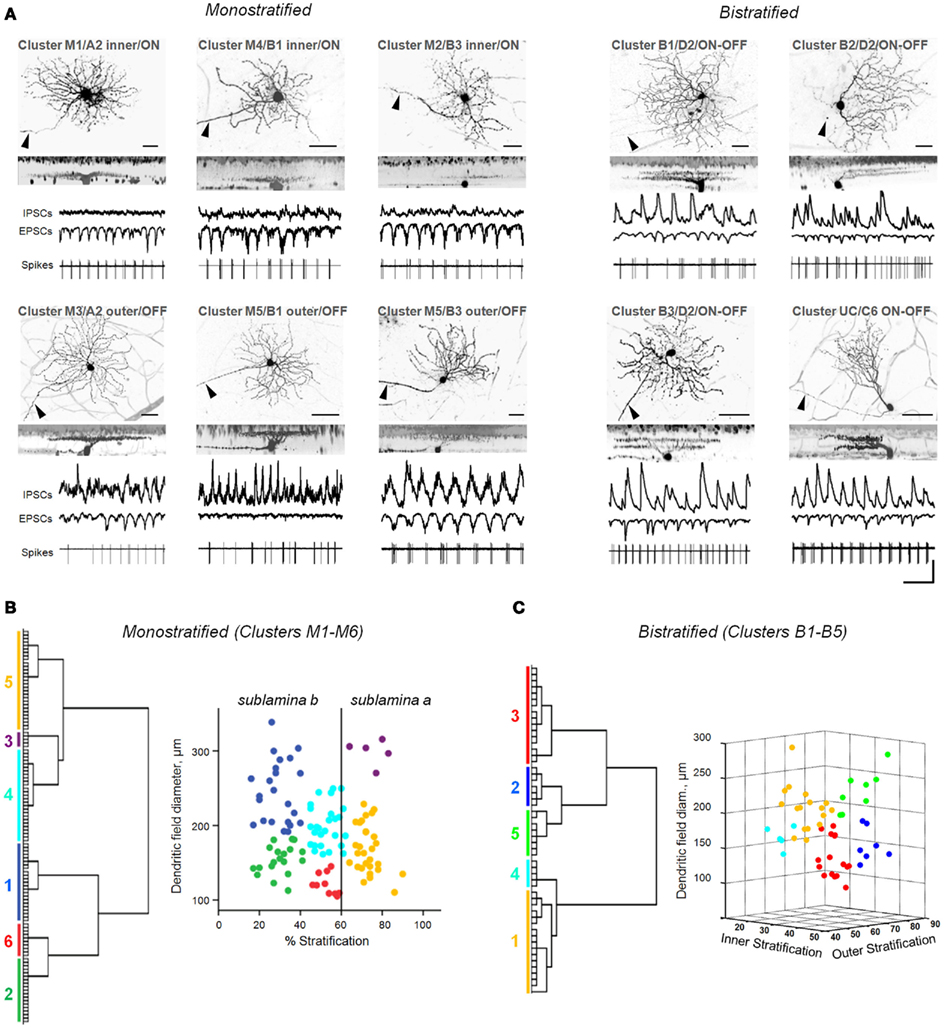
Figure 2. Diverse classes of rd1 GCs exhibit aberrant activity. (A) Representative rd1 GCs from multiple classes, shown with physiological activity. Here and in the following figures, reverse-contrast confocal images are shown, with scale bars adjusted to 40 μm. Cells are labeled by cluster membership, Sun et al. (2002) cell class, and physiological type above each set of images. GCs were distinguished from displaced ACs by the presence of an axon (arrowheads). Whole-cell inhibitory and excitatory currents (IPSCs, EPSCs) and spiking activity are shown for each cell. Scale bars: time 0.5 s, current amplitude 100 pA. (B,C) Dendrograms (left) and scatter plots (right) of the clustering of monostratified and bistratified rd1 GCs, based on dendritic arbor size and depth of arbor stratification. For bistratified cells, both inner and outer arbors were measured.
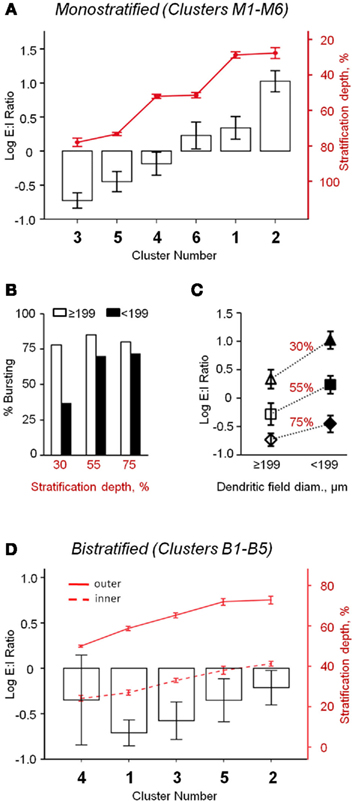
Figure 3. Oscillatory activity varies between distinct classes of rd1 GCs. (A) Monostratified clusters significantly differed in their E:I ratios (ANOVA, p < 0.001). As a population, there was a significant correlation between stratification and E:I ratio (Pearson’s r = −0.57, p < 0.001, n = 113). (B) Monostratified clusters with larger dendritic fields had a larger percentage of bursting cells than clusters with smaller dendritic fields (data also in Table 1). This difference was greatest in cells that stratified proximally to the GC layer (∼30%). (C) Monostratified clusters with larger dendritic fields had lower E:I ratios compared to clusters with smaller dendritic fields that stratified similarly (Two-way ANOVA, p = 0.008). Above each group, stratification depths are indicated as IPL percentiles. (D) Bistratified clusters did not differ in their E:I ratio (p = 0.56), but inhibitory oscillations had 316 ± 10% the power of excitatory oscillations (t-test, p < 0.001, n = 53). Data are reported as means ± SEM, except in (B), where percentages within groups are reported.
Oscillatory activity was present in both excitatory and inhibitory postsynaptic currents (EPSCs and IPSCs). The balance of these inputs was calculated as an excitatory-to-inhibitory ratio (E:I ratio) of oscillatory power (see Materials and Methods). For monostratified GCs, regression analysis showed that the relationship of E:I ratio to stratification depth is a continuum, rather than a strict division of ON and OFF sublaminae; GCs that stratified deeper into the IPL had relatively larger inhibitory oscillations (Pearson’s r = −0.57, p < 0.001, n = 113). When comparing clusters, E:I ratio differed significantly (p < 0.001, ANOVA; Figure 3A), with effects of both stratification and DF size (p < 0.001 and p = 0.008, respectively, two-way ANOVA; Figure 3C). Specifically, clusters that stratified at similar IPL depths differed in E:I ratio; cells with larger DFs received more inhibitory input than those with smaller DFs. The tendency toward greater inhibitory input in GCs with larger DFs may be related to the greater likelihood of bursting in these cells (Figure 3B). Bistratified GCs, as a population, had significantly stronger inhibitory than excitatory oscillations (316 ± 10%, t-test, p < 0.001, n = 53), and clusters did not differ significantly in E:I ratio (p = 0.56, n = 53, ANOVA; Figure 3D).
The varying incidence of bursting between cell types suggests that some retinal pathways are more susceptible to dystrophic remodeling than others. The higher incidence of bursting in larger-DF GCs, which have larger inhibitory oscillations, and the predominance of IPSC oscillations in previously unexplored bistratified RD GCs suggest that inhibitory inputs have a primary role in generating aberrant activity.
Oscillations Persist in the Absence of Bipolar Cell Input
It has been shown that oscillations in RD originate presynaptically to GCs (Margolis et al., 2008; Stasheff, 2008; Menzler and Zeck, 2011), but the source of these oscillations is unclear. Recent studies have proposed a role for BCs (Borowska et al., 2010; Menzler and Zeck, 2011). To examine this, we monitored EPSCs and IPSCs in rd1 GCs before and after application of CNQX (5 μM) and D-AP5 (50 μM), selective antagonists of non-NMDA and NMDA iGluRs.
CNQX and D-AP5 eliminated EPSCs in all rd1 GCs. Oscillatory IPSCs, in contrast, persisted in a large subset of GCs and were abolished after the addition of strychnine (3 μM), gabazine (5 μM) and TPMPA (100 μM), antagonists of glycine-, GABAA-, and GABACRs, respectively (Figure 4A). As evident from FFT heat maps (right panel), oscillations not only persisted, but were refined in a subset of GCs, showing less inter-wave variation in amplitude and frequency, reflected as an increase in power (p = 0.02, n = 11, paired t-test; Figure 4D). Notably, OFF cells all increased in power, while ON cells varied, though most maintained oscillations at reduced power (r2 = 0.67, p < 0.001, n = 26, linear regression; Figure 4C). The persistence of fast aberrant activity in a diversity of GCs suggests that BCs are not the source. An alternate pathway for these oscillations may be gap junction-mediated pathway between BCs and AII cells, which have been suggested to be required for their generation (Borowska et al., 2011) and/or propagation across the retina (Menzler and Zeck, 2011). For rd1 GCs with IPSC oscillations resistant to CNQX and DAP-5, the subsequent addition of the gap junction blocker carbenoxolone (100 μM, CBX) did not abolish oscillations (p = 0.46, n = 7, paired t-test; Figures 4B,D). Carbenoxolone alone had a variable effect on the size of oscillations, but they persisted in six out of nine GCs (Figures 5C,D).
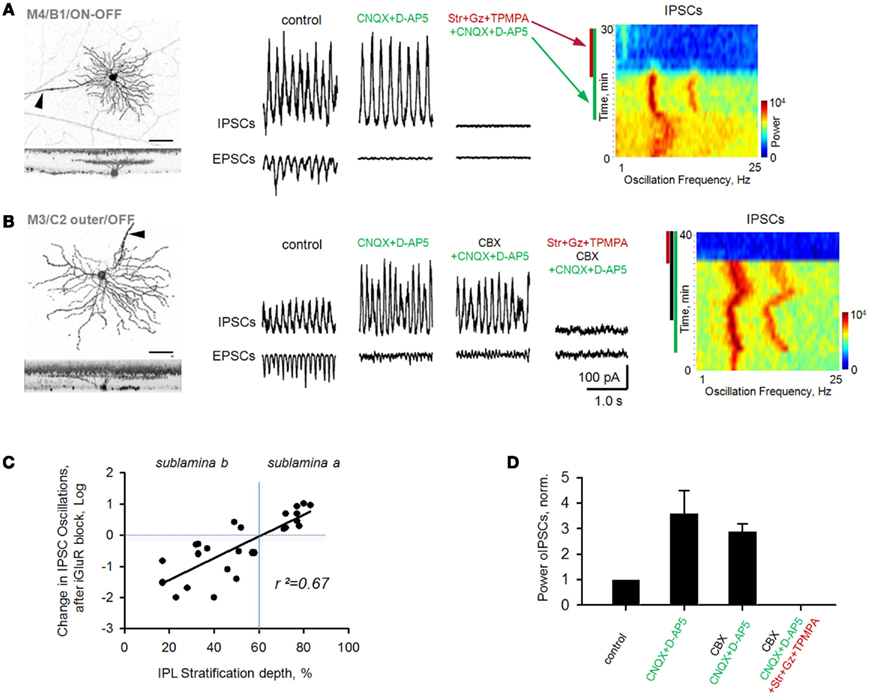
Figure 4. Oscillations persist in rd1 GCs after blockade of iGluRs. Oscillatory activity was evident in both EPSCs and IPSCs. (A) Following application of iGluR antagonists (CNQX, D-AP5), inhibitory oscillations persisted in a majority of GCs. All remaining synaptic activity was eliminated after block of inhibitory receptors. Spectrograms (right panels) are FFT power spectra, plotted over time, demonstrating changes in frequency components of EPSC oscillatory activity across different experimental conditions. In this and subsequent figures, colored bars along the left side of the spectrograms indicate the presence of antagonists. Refinement of oscillations is reflected by narrower frequency bands. (B) Cells that continued to oscillate in the presence of iGluR antagonists were not affected by subsequent addition of carbenoxolone (CBX), a gap junction blocker (p = 0.46, n = 7, paired t-test). All remaining synaptic activity was eliminated after block of inhibitory receptors. (C) Scatterplot of percent change (log units) of inhibitory oscillations in monostratified rd1 GCs from control conditions (horizontal dashed line) following application of iGluR blockers. There was a significant correlation with the depth of GC dendritic ramification in the inner plexiform layer (IPL, r2 = 0.67, p < 0.001, n = 26). (D) Summary bar chart for rd1 GCs under various pharmacological conditions. All data are reported as means ± SEM.
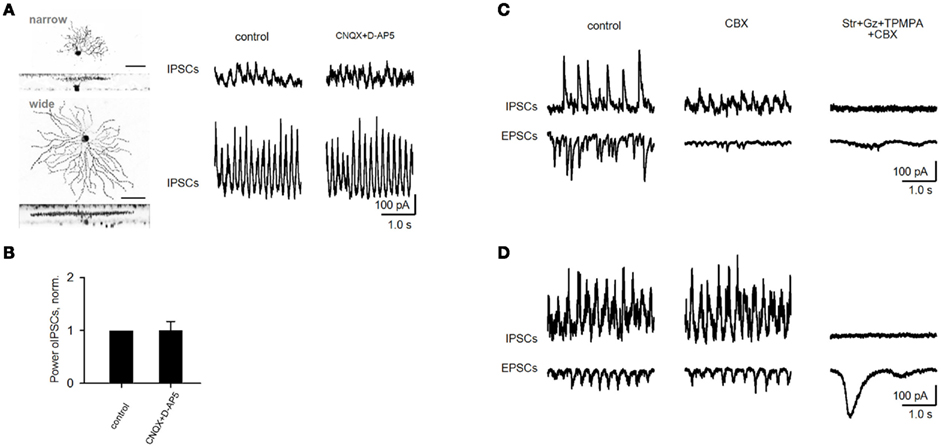
Figure 5. Oscillations in rd1 ACs and variable effect of gap junction blocker on fast oscillations in rd1 GCs. (A) Representative IPSCs from rd1 narrow- and wide-field amacrine cells. (B) Oscillations that persisted in amacrine cells following application of iGluR antagonists did not differ from control conditions (p = 0.19, n = 5, paired t-test). (C,D) Recordings of oscillatory activity in two representative GCs. Application of the gap junction blocker carbenoxolone (CBX, 100 μM) diminishes oscillatory activity in one cell (C), while this activity remained unaffected in another cell (D). In both cells, all high-frequency oscillatory activity was abolished following addition of blockers of inhibitory transmission. Large, low-frequency EPSCs remain [(D), right traces], which are driven by bipolar cells (as shown in Figures 6–8).
Oscillations in non-electrically coupled rd1 ACs could also rely on excitatory BC input. However, CNQX and DAP-5 did not diminish aberrant oscillations in 5 out of 7 ACs (p = 0.19, n = 5, paired t-test; Figures 5A,B), suggesting a serial inhibitory source instead. Together, our findings suggest that aberrant oscillations do not require BC input, and are generated by dystrophic amacrine cells (dACs), which provide inhibitory oscillatory input to BCs, GCs, and other ACs. These data also indicate that gap junctions may not be necessary to generate them, but rather to be involved in their spread across the retinal network.
Inhibitory Transmission is Necessary for Dystrophic Amacrine Cell Oscillations but Suppresses Intrinsic Bipolar Cell Oscillations: Identification of Two Oscillators in rd1
Oscillations putatively generated by dACs must be reconciled with intrinsic oscillations that occur in the retina. It has been shown that BCs in healthy mature retina can spontaneously oscillate (Burrone and Lagnado, 1997; Ma and Pan, 2003), and it has been suggested that aberrant RD oscillations reflect an exacerbation of this intrinsic BC activity (Borowska et al., 2011), rather than dACs. ACs use inhibitory transmission to shape the excitatory output of BCs. Accordingly, intrinsic BC oscillations have been shown to be silenced by inhibitory neurotransmitters (Zenisek and Matthews, 1998), suggesting that these oscillations are normally suppressed by ACs. Thus, we tested whether intrinsic BC oscillations differ between wt and rd1 retinas, by blocking inhibitory transmission.
We monitored BC output by measuring EPSCs in GCs prior to and following application of inhibitory receptor blockers. In rd1, high-frequency (fast) oscillations (6.8 ± 2.0 Hz, range 4.5–12.0 Hz) were abolished, and replaced by larger-amplitude EPSCs of significantly lower frequency (0.7 ± 0.5 Hz, range 0.2–2.0 Hz; p < 0.001, n = 32, paired t-test) and increased power (p < 0.001, n = 32, paired t-test; Figure 6A). These low-frequency (slow) oscillations were sufficient to drive GC spiking, and were abolished by iGluR blockers. Similarly, inhibitory receptor blockers also induced slow oscillations in wt GCs (Figure 6B). To compare oscillations between wt and rd1 GCs, a cluster analysis was performed, with oscillatory frequency and power as input parameters. In control conditions, wt (n = 25) and rd1 (n = 32) GCs formed two separate clusters (Figure 6C, circles), reflecting spontaneous fast oscillations in rd1 GCs and no oscillatory activity in wt GCs. After blocking inhibitory transmission, all GCs in both groups formed a single cluster, indicating no difference in the slow oscillations between wt and rd1 GCs (Figure 6C, triangles). A repeated-measures multivariate ANOVA confirmed this (effects of genotype and treatment, with interaction, all p < 0.001). Post hoc t-tests showed that wt and rd1 cells differed in frequency (p < 0.001) and power (p < 0.01) prior to blocking inhibitory transmission, but were no different afterward (p = 0.95, 0.28). Furthermore, if driven by the same source, properties of fast and slow oscillations should correlate. However, across rd1 GCs, they did not; the power of fast oscillations were not predictive of the power of slow oscillations (r2 = 0.018, p = 0.47, n = 32, linear regression; Figure 6D), suggesting separate sources.
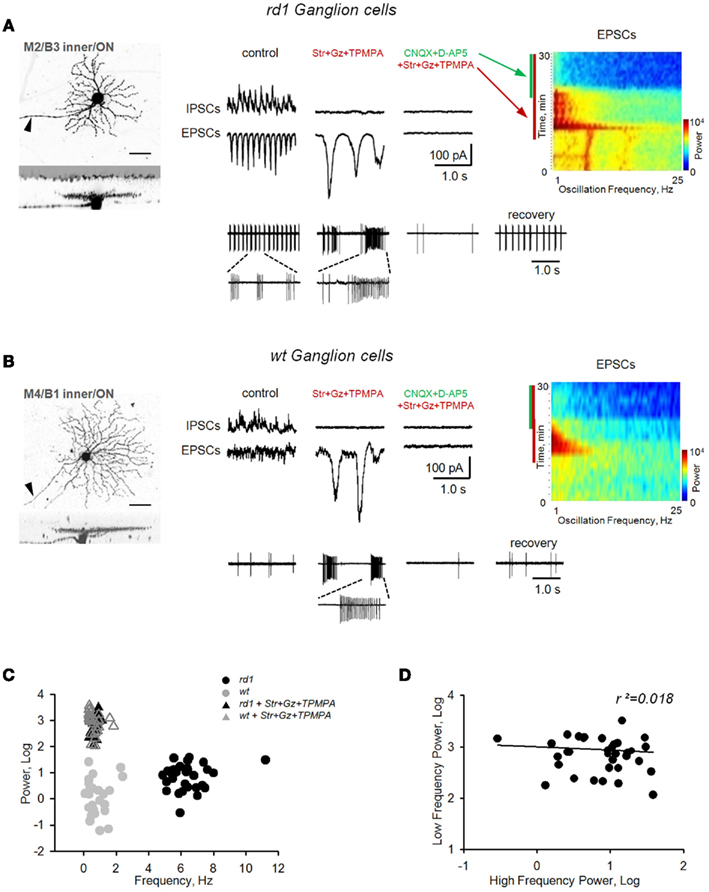
Figure 6. Block of inhibition eliminates fast bursting in rd1 retina and reveals slow intrinsic bipolar cell-mediated oscillations in both rd1 and wt retinas. Application of inhibitory receptor blockers (strychnine, gabazine, TPMPA) eliminated fast oscillations in rd1, but induced large, slow oscillations in both rd1(A) and wt (B) GCs. These slow oscillations were eliminated after subsequent block of iGluRs. (C) Cluster analysis shows that slow oscillations did not differ between wt and rd1 GCs. (D) Regression analysis shows no relationship between fast dystrophic oscillations and slow oscillations across rd1 GCs (r2 = 0.018).
Together, these data show that the slow oscillations observed in rd1 following block of inhibition are no different from those seen in wt, and suggest that the fast oscillations seen only in rd1 mice are generated by dACs, independent of BC oscillations. To further confirm this, we determined whether these two oscillators could be isolated pharmacologically from one another.
Necessity of L-Type Ca2+-Channels Distinguishes Intrinsic from Dystrophic Oscillators
We have shown that abolishing dAC oscillations with inhibitory receptor antagonists simultaneously unveils intrinsic BC oscillations, which are normally suppressed by ACs via inhibitory transmission. This effectively silences dAC oscillations while preserving BC oscillations. Next, we determine whether BC oscillations can be silenced while preserving dAC oscillations.
Glutamate release from BCs is triggered by the activation of voltage-gated Ca2+ channels (Kaneko et al., 1989; Pan et al., 2001; Berntson et al., 2003), and slow intrinsic BC activity has been shown to be Ca2+-dependent (Burrone and Lagnado, 1997; Ma and Pan, 2003). To confirm this in mice, we first applied inhibitory receptor blockers to unveil slow BC oscillations, then applied CdCl2 (200 μM), a non-specific calcium channel antagonist. This abolished slow oscillations in wt and rd1 GCs (1.8 ± 1.0%, p < 0.001, n = 10 for both wt and rd1, paired t-test; Figures 7B and 8A). We next evaluated specific Ca2+-channel types.
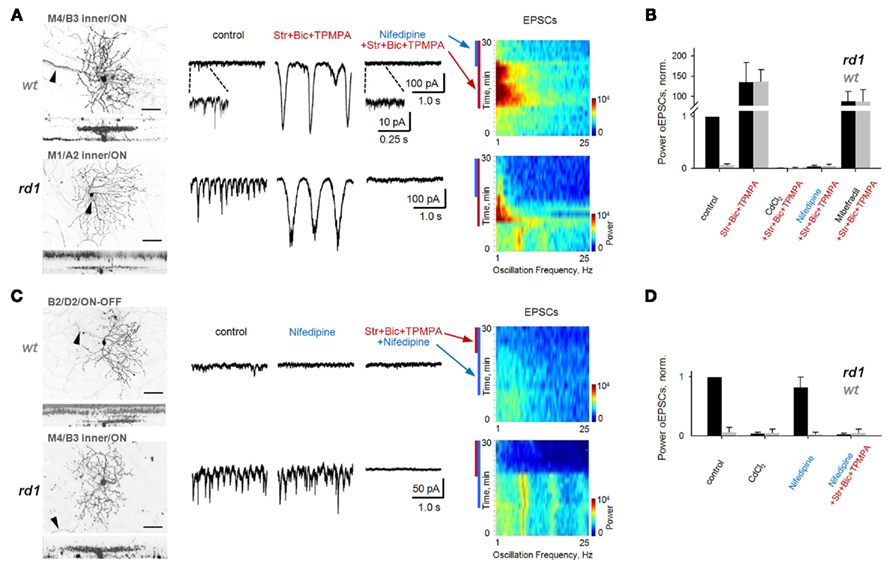
Figure 7. Block of L-type voltage-gated Ca2+-channels does not eliminate fast aberrant excitatory oscillations but abolishes slow intrinsic BC oscillations. Spontaneous EPSCs are shown from GCs in age-matched adult wt and rd1 wholemount retinas. In control conditions, fast oscillations were present in rd1, but not wt, GCs (left traces). (A) Block of inhibition unveiled large, slow oscillations in both rd1 and wt GCs (middle traces), which are visible as high-power, low-frequency bands (spectrograms). Application of nifedipine (50 μM), a selective L-type voltage-gated Ca2+-channel antagonist, abolished slow oscillations (right traces). (B) Summary bar chart for wt and rd1 GCs (n = 10, 10). The power of oscillatory EPSCs was normalized to those of rd1 GCs in control conditions. Slow oscillations were abolished by application of either CdCl2 to block all voltage-gated Ca2+-channels, or of nifedipine, to block L-type channels. Block of T-type Ca2+-channels with mibefradil reduced the power of oscillatory EPSCs, but did not abolish them. (C) Application of nifedipine in both wt and rd1 GCs prevented the generation of slow oscillations with subsequent block of inhibition. In contrast, in rd1 GCs, nifedipine did not abolish aberrant fast oscillations, but block of inhibition did (bottom traces). The spectrogram shows that the high-frequency oscillations are present both in control conditions and after the addition of nifedipine in rd1 (p = 0.12, paired t-test). (D) Summary bar chart for 10 wt and 10 rd1 GCs. See also Figure 8. All data are reported as means ± SEM.
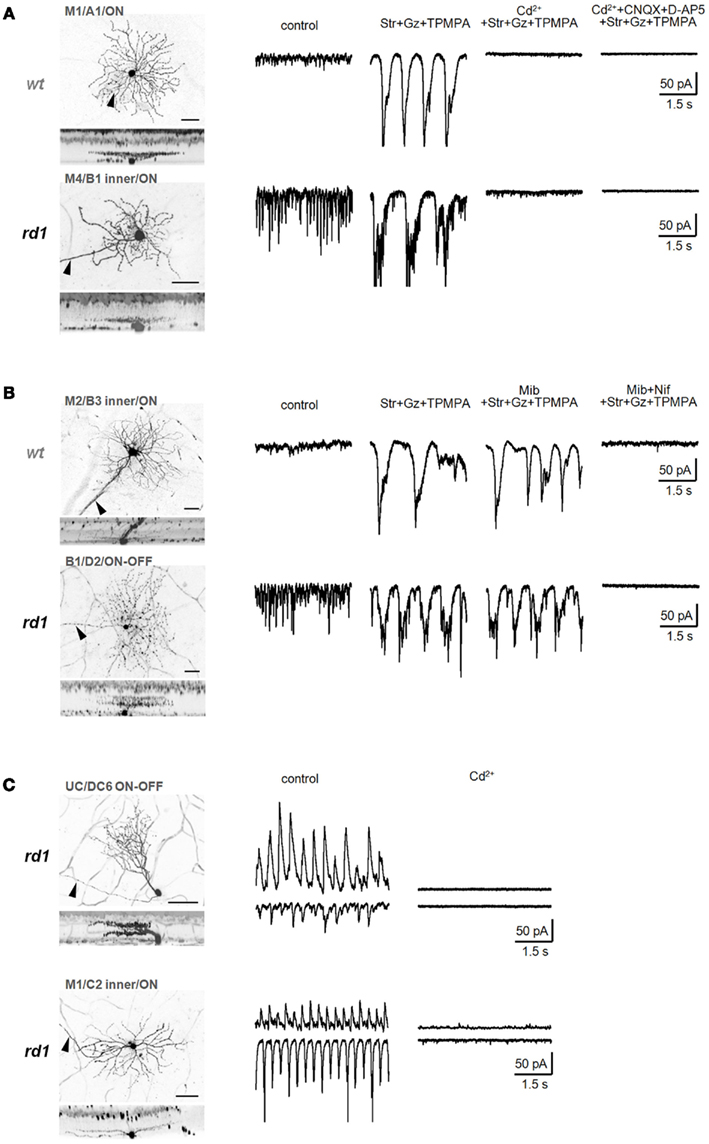
Figure 8. Calcium signals underlying two distinct oscillators. (A) Isolated low-frequency EPSC oscillations recorded from identified wt (top) and rd1 (bottom) GCs were eliminated by a non-selective voltage-gated Ca2+ channel blocker, CdCl2 (200 μM). (B) Bipolar cell-mediated oscillations were slightly reduced by mibefradil (5 μM), a selective T-type voltage-gated Ca2+-channel blocker, and completely abolished by nifedipine (30 μM), a selective L-type voltage-gated Ca2+-channel blocker, in both wt (top) and rd1 (bottom) GCs. (C) Ca2+ influx is required for amacrine cell-mediated high-frequency oscillations in rd1. In representative rd1 GCs, both oscillatory EPSCs and IPSCs were eliminated by CdCl2 (200 μM). Summary histograms are shown in Figure 6. In confocal images, scale bars are adjusted to 40 μm.
Though previously untested in mouse retina, spontaneous oscillatory activity in goldfish Mb1 BCs relies on Ca2+-influx via L-type Ca2+-channels (Burrone and Lagnado, 1997; Zenisek and Matthews, 1998; Protti et al., 2000), while isolated rat BCs rely on T-type Ca2+-channels (Pan et al., 2001; Ma and Pan, 2003). Nifedipine (50 μM), a selective antagonist of L-type Ca2+-channels, dramatically reduced the power of slow oscillatory EPSCs in wt and rd1 GCs (to 5.5 ± 2.1 and 4.3 ± 1.8%, respectively; p < 0.001, n = 10, for both, paired t-test; Figures 7A,B). Furthermore, if the intrinsic BC oscillator requires L-type Ca2+-channel activation, nifedipine should prevent slow oscillations. Indeed, blocking inhibition in the presence of nifedipine failed to elicit slow oscillations (p < 0.001, n = 10, for both wt and rd1, paired t-test; Figure 7C, right traces, and Figure 7D). In contrast, mibefradil (5 μM) a selective antagonist of T-type Ca2+-channels, had a variable effect on BC-mediated slow oscillations (reducing power to 67.0 ± 63.8 and 86.8 ± 55.0% in wt and rd1 cells, respectively; p = 0.08, n = 5 for wt and p = 0.27, n = 10 for rd1, paired t-test; Figures 7B and 8B). Along with the finding that Ca2+-evoked Ca2+ release from BC intracellular pools does not contribute to BC oscillations (Ma and Pan, 2003), our data suggest that L-type Ca2+-channels are necessary and sufficient to generate BC-mediated EPSC oscillations in both wt and rd1 retina.
Next, we determined whether fast and slow oscillations rely on the same source in RD, by first testing whether fast oscillatory EPSCs are Ca2+-dependent, and then, whether L-type Ca2+-channels are necessary to generate them. CdCl2 completely abolished fast oscillations in rd1 GCs, suggesting the involvement of voltage-gated Ca2+-channels (Figures 7D and 8C). Nifedipine had a small and variable effect on the power of rd1 oscillations, reducing them to 82.9 ± 16.3% of control (p = 0.12, n = 10, paired t-test; Figure 7C), indicating that L-type Ca2+-channels are not necessary for fast oscillations. Subsequently blocking inhibition abolished fast oscillations (p < 0.001, n = 10, paired t-test; Figures 7C,D).
Together, these data indicate that (a) dystrophic fast oscillations in rd1 are mediated by an autonomous dAC oscillator, and that (b) intrinsic slow oscillations, mediated by a BC-dependent mechanism, are unaffected in rd1 relative to wt.
Synaptic Noise Compromises Transmission of Evoked Responses through Inner RD Retina
The task of any sensory system is not to simply measure the strength of a signal, but to distinguish signals from accompanying noise (Brenner et al., 2000). During RD, photoreceptor cell loss progressively diminishes the sensory signal, while concurrent changes within the surviving inner retina lead to increased baseline activity, contributing to noise (Drager and Hubel, 1978; Margolis et al., 2008; Stasheff, 2008). Though the effects of signal loss due to photoreceptor death have been well characterized, the functional impact of increased noise due to retinal remodeling has not.
In rd1 mice at P20–26, light-induced responses could be observed (Figure 9A). At this stage, the majority of rods have died, while cones are still present in large numbers (Strettoi and Pignatelli, 2000). In light-adapted conditions (see Materials and Methods), responses are not evident in individual traces, but are observable in peristimulus time histograms (PSTHs) and averages. However, using light stimuli does not enable the separation of the relative contributions of photoreceptor and post-photoreceptor sites to diminished responses in RD.
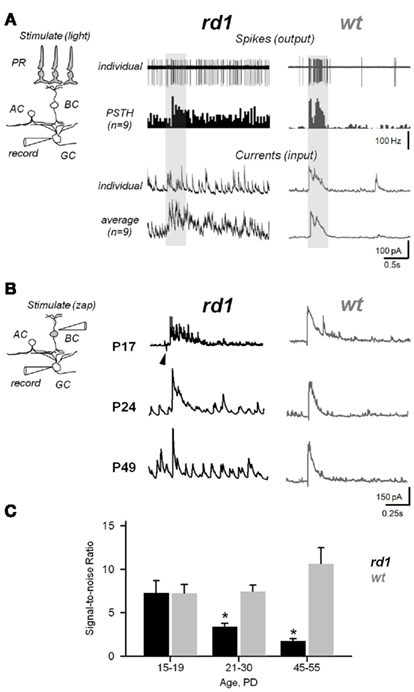
Figure 9. Aberrant activity compromises efficiency of synaptic transmission within the inner retina during RD. (A) Photoreceptor-dependent light-evoked spiking responses from GCs in rd1 and age-matched wt controls (P20–P26). Peristimulus time histograms (PSTHs) were generated with 0.1 ms bins. The recording paradigm is illustrated in the insert (PR, photoreceptor; BC, bipolar; AC, amacrine; GC, ganglion cells). Shaded area – timing of the light stimulus (∼300 μm light spot). (B) Photoreceptor-independent synaptically evoked activity from voltage-clamped GCs in rd1 mice at different phases of retinal remodeling and age-matched wildtype controls. A current pulse was delivered to the INL, bypassing photoreceptors. Arrowhead indicates stimulus artifact. (C) Signal-to-noise ratios at different ages in rd1 (black bars, n = 21) and wt (gray bars, n = 15). As RD progresses, increasing noise levels obscure the evoked response. All data are reported as means ± SEM; p < 0.001.
Therefore, to directly assess inner retinal function, independent of photoreceptors, we employed an electrical stimulation paradigm, in which cells presynaptic to recorded GCs were stimulated with a brief depolarizing electric pulse (Chen and Diamond, 2002; Sagdullaev et al., 2006). To measure the efficiency of synaptic transmission, we calculated SNR, allowing responses to be weighted against background activity (Dunn and Rieke, 2006). We stimulated GCs in wt and rd1 retina from 3 age groups corresponding to different stages of RD (Gargini et al., 2007; Figure 9B). To unmask the contribution of NMDARs and to monitor both excitatory and inhibitory currents in GCs (Roska et al., 2006; Manookin et al., 2010), we held GCs at +40 mV (see Materials and Methods). As RD progresses, aberrant oscillations (6–12 Hz) emerge that obscure evoked responses in GCs, resulting in a significant reduction of SNR compared to wt (main effect of genotype, p < 0.001, and interaction with age, p = 0.003, two-way ANOVA; Figure 9C). By P30, SNR is reduced by approximately 50% compared to P20 (7.28 ± 1.41 versus 3.45 ± 0.35; p < 0.001, n = 6 and 11, post hoc t-tests) and further declined to 25% of its initial value by P50 (1.78 ± 0.25, p < 0.001, n = 4). In contrast, SNR in age-matched wt controls remained significantly higher (P20: 7.26 ± 1.00, n = 4; P30: 7.44 ± 0.74, n = 5; >P50: 10.66 ± 1.83, n = 6).
Discussion
Until recently, RD has mainly been considered to be a deficiency of photoreceptors. We studied a form of “network deficiency” – maladaptive changes within the surviving tissue – that manifests as aberrant oscillatory activity. Incidence and properties of these oscillations varied between GC classes, suggesting differences between visual pathways in susceptibility to retinal remodeling. Single-cell recordings combined with pharmacological analysis allowed us to distinguish two independent oscillators in the RD retina, driven respectively by bipolar and amacrine cells. In contrast to earlier studies (Borowska et al., 2011; Menzler and Zeck, 2011), we find that an AC oscillator alone is necessary and sufficient to drive aberrant activity in rd1 retina. A BC oscillator, in both rd1 and wt, is normally suppressed by inhibition and not required for aberrant activity (Figure 10). We find that aberrant activity compromises transmission of evoked responses in surviving inner retina, exacerbating the visual deficit.
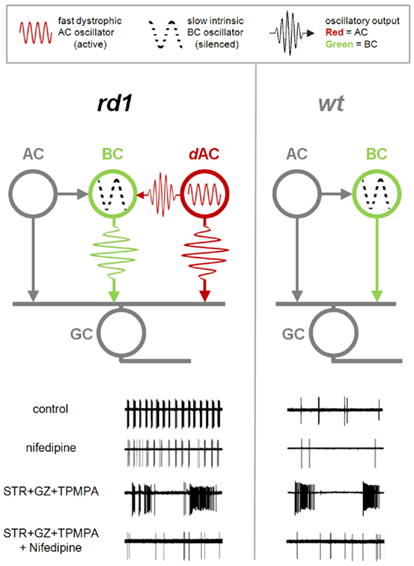
Figure 10. Dystrophic amacrine cell input drives bursting activity in RD. Diagrams of the synaptic interactions in rd1 (left) and wt (right) retinas. Bipolar cells (BC) provide excitatory drive to ganglion cells (GC) and amacrine cells (AC). Amacrine cells, in turn, modulate the GC activity via presynaptic inhibition of BCs, and direct inhibition of GCs. In both RD and healthy retina, an intrinsic slow BC oscillator is silent in resting conditions. In rd1 retina, an additional fast dystrophic AC oscillator is active, and affects both BC and GC output. Lower panels show GC spiking output at different conditions. In control conditions, GCs in RD retina show fast bursting activity driven by the AC oscillator. This fast bursting persists with nifedipine. In contrast, application of inhibitory blockers (STR + GZ + TPMPA) unveils the BC oscillator, which is present in both rd1 and wt, but silent in control conditions. Unlike fast oscillations this slow oscillator is abolished by nifedipine.
Functional Remodeling Varies across Parallel Retinal Circuits
Unique patterns of retinal interneuron connectivity establish distinct pathways to extract specific features of visual stimuli (Wassle, 2004). Using an approach to GC classification that accounts for both anatomical (Sun et al., 2002; Badea and Nathans, 2004; Kong et al., 2005; Mazzoni et al., 2008) and physiological diversity, we show that aberrant activity varies across GC classes in rd1 (Figures 2 and 3). Balance of excitatory and inhibitory input correlates to the stratification depth of monostratified GCs, rather than conforming to a strict division of ON and OFF cell types (Margolis et al., 2008). DF size affected both the incidence and properties of aberrant activity – GCs with larger DFs were more likely to burst, and had more inhibitory input. This may reflect the relatively larger lateral width of inhibitory versus excitatory inputs (Lukasiewicz and Werblin, 1990), and suggests that oscillatory activity originates from inhibitory inputs. Likewise, bistratified cells, which receive inputs from both sublaminae, showed a dominance of inhibitory oscillations. This variation suggests that inhibitory interneurons, which mediate lateral connections between vertical pathways (Roska and Werblin, 2001), may be less resistant to functional changes than those that involve only simple direct connections. The balance between the pathways that segregate and converge via these neurons may be more easily destabilized than in pathways that do not rely on lateral connections.
Separate Sources Drive Dystrophic and Intrinsic Oscillations
Several mechanisms have been proposed to account for the generation of aberrant activity during RD. Persistence of oscillatory activity following block of inhibitory transmission – albeit at a lower frequency – led to the hypothesis that the primary source of aberrant activity in RD are oscillating BCs (Borowska et al., 2010; Menzler and Zeck, 2011). Borowska et al. (2011) have proposed that gap junction-coupled cone BCs/AII ACs constitute an intrinsic oscillator, which is exacerbated by RD, resulting in aberrant activity that primarily relies on spontaneous excitatory inputs. Our findings support a role for dACs (Vaithianathan and Sagdullaev, 2010), which provide direct inhibitory oscillatory input to GCs, and shape BC output to provide excitatory oscillatory input to GCs. Additionally, our experiments show that intrinsic BC oscillations are not affected by RD, as they do not differ from wt (Figure 6C). Several lines of evidence suggest that dystrophic oscillations are independent of intrinsic BC oscillations. In the same cells, the powers of fast and slow oscillations did not correlate, suggesting different sources (Figure 6D). Slow BC-mediated oscillations were observable in wt and rd1 retinas only after blocking inhibitory transmission, and were abolished by blocking L-type Ca2+-channels; dAC oscillations were observable only in rd1 retinas, did not require pharmacological block, were insensitive to blocking L-type Ca2+-channels and gap junctions, but were abolished by blocking inhibitory transmission (Figures 7 and 8). Given the diversity of retinal cell types and the complexity of their interactions, multiple mechanisms of aberrant oscillatory activity cannot be ruled out, especially during different stages of RD (Marc et al., 2003). However, we find that dACs are necessary and sufficient for aberrant oscillations in adult rd1. The requirement for lateral interactions suggests the sparse distribution of oscillatory pacemaker cells across the retina; it is unlikely that every GC or BC would receive a direct input from dAC. In retinal slices (200 μm), the occurrence of oscillatory GC activity is dramatically lower than in retinal wholemount (15 versus 70%, unpublished observation). This is further supported by a variable effect of gap junction blockers on oscillatory activity in GCs, suggesting that oscillatory signals must be spread across the retinal network.
Slow oscillations are mediated by the intrinsic activity of BCs, and have been reported in mature healthy retina in a number of species (Burrone and Lagnado, 1997; Zenisek and Matthews, 1998; Ma and Pan, 2003). We demonstrate that this intrinsic oscillator is unchanged in adult rd1 mouse retina, showing a resistance to remodeling, indicating that it may be established early in life. Indeed, during development, retinal neurons exhibit coordinated spontaneous activity known as “retinal waves” (Shatz and Stryker, 1988; Wong et al., 1998), which can be modulated in size and velocity by influx through L-type Ca2+ channels (Singer et al., 2001; Firth et al., 2005). The slow oscillations we observe in both wt and RD retinas may be driven by these rudimentary BC properties, which are progressively masked by inhibitory inputs that develop as the retina matures. The origin of the dystrophic AC oscillator is less clear. Spiking GABA-ergic ACs can function as a source of pacemaker activity during early retinal development (Firth and Feller, 2006). Oscillating ACs in adult retina are less independent, however, relying heavily either on presynaptic glutamatergic inputs (Petit-Jacques et al., 2005) or L-type Ca2+-channels (Vigh et al., 2003). Oscillations in RD could also arise from an imbalance in retinal circuitry following photoreceptor death, unmasking resonant oscillatory properties of ACs (Steffen et al., 2003; Margolis and Detwiler, 2011).
Network Deficiency Compromises Signal Transmission in RD
Neurodegenerative diseases are widely considered to result in the loss of specific function. Both experimental and computational modeling data (Marc et al., 2003) suggest that degeneration can also entail a gain of aberrant activity, through remodeling, that can hinder the function of surviving inner retina. Indeed, our data demonstrate a significant decline in the ability of inner retina to transmit evoked responses, showing a decrease in the efficiency of both photoreceptor cell-dependent (light-evoked) and photoreceptor cell-independent (electrically evoked) activity in rd1 GCs (Figure 9). As expected, light-evoked responses from rd1 GCs at P20–26 were markedly affected by aberrant activity. These responses were likely driven by cone photoreceptors, since rods are absent by 3 weeks of age, while cones persist at P60–66 (LaVail et al., 1997). Rod BC dendrites show visible retraction by P10 (Strettoi et al., 2003), and the reliability of ERG responses decreases after P15 (Strettoi et al., 2002). Our light-evoked responses were similarly unreliable in individual traces, but summation and averaging demonstrated their presence. Remaining responses may also receive contributions from intrinsically photosensitive retinal GCs (Berson et al., 2002). More importantly, when bypassing diseased photoreceptors, to assess the function of surviving inner retina, we found that the transmission of evoked signals was significantly compromised (Figure 9C). These findings directly demonstrate that synaptic noise, which increases as inner retinal remodeling progresses in RD, can exacerbate the visual deficit by reducing the ability of surviving retina to transmit evoked signals. This noise is likely to compromise responses not only from surviving photoreceptors, but also those of ipRGCs, which receive inputs from second-order neurons (Wong et al., 2007) that are affected by RD. This suggests that eliminating aberrant synaptic noise could be a potential treatment in itself.
In conclusion, we use several methods to examine the variety, source, and effects of aberrant activity in RD. Our data reveal that (i) the presence and properties of aberrant activity vary between morphological GC classes according to stratification and DF size; (ii) aberrant oscillations in RD retina originate in dACs, while intrinsic BC oscillations are largely unaffected by RD; and (iii) aberrant oscillations compromise signal transmission through surviving retinal tissue. The question remains whether the dystrophic changes observed in rd1 mice are related to the overlap of RD onset with retinal development. Recent recordings from GCs in rd10 mice, which have a much later onset of RD, have shown a similar degree of hyperactivity between rd1 and rd10 within the corresponding age groups, indicating that the overlap with development is not a crucial factor (Stasheff et al., 2011). Characterization of aberrant activity in rd10 is currently underway in our laboratory, which will address common and dissimilar features between models of RD, to further define the mechanisms that lead to physiological dysfunction.
Author Contributions
Botir T. Sagdullaev, Christopher W. Yee, and Abduqodir H. Toychiev designed, performed research and analyzed data. Botir T. Sagdullaev and Christopher W. Yee wrote the paper. Christopher W. Yee and Abduqodir H. Toychiev contributed equally.
Conflict of Interest Statement
The authors declare that the research was conducted in the absence of any commercial or financial relationships that could be construed as a potential conflict of interest.
Acknowledgments
This work was supported by NIH grant R01-EY020535 (Botir T. Sagdullaev), International Retinal Research Foundation, and Karl Kirchgessner Foundation (Botir T. Sagdullaev). The authors thank Drs. Peter Lukasiewicz and Glen Prusky for comments on the manuscript.
References
Badea, T. C., and Nathans, J. (2004). Quantitative analysis of neuronal morphologies in the mouse retina visualized by using a genetically directed reporter. J. Comp. Neurol. 480, 331–351.
Berntson, A., Taylor, W. R., and Morgans, C. W. (2003). Molecular identity, synaptic localization, and physiology of calcium channels in retinal bipolar cells. J. Neurosci. Res. 71, 146–151.
Berson, D. M., Dunn, F. A., and Takao, M. (2002). Phototransduction by retinal ganglion cells that set the circadian clock. Science 295, 1070–1073.
Borowska, J., Trenholm, S., and Awatramani, G. B. (2011). An intrinsic neural oscillator in the degenerating mouse retina. J. Neurosci. 31, 5000–5012.
Borowska, J. T., Trenholm, S., and Awatramani, G. B. (2010). Intrinsic mechanisms in bipolar cells drive spontaneous network activity during retinal degeneration. ARVO Meet Abstr. 51, 2486.
Brenner, N., Bialek, W., and De Ruyter Van Steveninck, R. (2000). Adaptive rescaling maximizes information transmission. Neuron 26, 695–702.
Burrone, J., and Lagnado, L. (1997). Electrical resonance and Ca2+ influx in the synaptic terminal of depolarizing bipolar cells from the goldfish retina. J. Physiol. (Lond.) 505, 571–584.
Chen, S., and Diamond, J. S. (2002). Synaptically released glutamate activates extrasynaptic NMDA receptors on cells in the ganglion cell layer of the rat retina. J. Neurosci. 22, 2165–2173.
Chua, J., Fletcher, E. L., and Kalloniatis, M. (2009). Functional remodeling of glutamate receptors by inner retinal neurons occurs from an early stage of retinal degeneration. J. Comp. Neurol. 514, 473–491.
Drager, U. C., and Hubel, D. H. (1978). Studies of visual function and its decay in mice with hereditary retinal degeneration. J. Comp. Neurol. 180, 85–114.
Dunn, F. A., and Rieke, F. (2006). The impact of photoreceptor noise on retinal gain controls. Curr. Opin. Neurobiol. 16, 363–370.
Firth, S. I., and Feller, M. B. (2006). Dissociated GABAergic retinal interneurons exhibit spontaneous increases in intracellular calcium. Vis. Neurosci. 23, 807–814.
Firth, S. I., Wang, C. T., and Feller, M. B. (2005). Retinal waves: mechanisms and function in visual system development. Cell Calcium 37, 425–432.
Gargini, C., Terzibasi, E., Mazzoni, F., and Strettoi, E. (2007). Retinal organization in the retinal degeneration 10 (rd10) mutant mouse: a morphological and ERG study. J. Comp. Neurol. 500, 222–238.
Kaneko, A., Pinto, L. H., and Tachibana, M. (1989). Transient calcium current of retinal bipolar cells of the mouse. J. Physiol. (Lond.) 410, 613–629.
Kong, J. H., Fish, D. R., Rockhill, R. L., and Masland, R. H. (2005). Diversity of ganglion cells in the mouse retina: unsupervised morphological classification and its limits. J. Comp. Neurol. 489, 293–310.
LaVail, M. M., Matthes, M. T., Yasumura, D., and Steinberg, R. H. (1997). Variability in rate of cone degeneration in the retinal degeneration (rd/rd) mouse. Exp. Eye Res. 65, 45–50.
Lukasiewicz, P. D., and Werblin, F. S. (1990). The spatial distribution of excitatory and inhibitory inputs to ganglion cell dendrites in the tiger salamander retina. J. Neurosci. 10, 210–221.
Ma, Y. P., and Pan, Z. H. (2003). Spontaneous regenerative activity in mammalian retinal bipolar cells: roles of multiple subtypes of voltage-dependent Ca2+ channels. Vis. Neurosci. 20, 131–139.
Manookin, M. B., Weick, M., Stafford, B. K., and Demb, J. B. (2010). NMDA receptor contributions to visual contrast coding. Neuron 67, 280–293.
Marc, R. E., Jones, B. W., Watt, C. B., and Strettoi, E. (2003). Neural remodeling in retinal degeneration. Prog. Retin. Eye Res. 22, 607–655.
Margolis, D. J., and Detwiler, P. B. (2011). Cellular origin of spontaneous ganglion cell spike activity in animal models of retinitis pigmentosa. J. Ophthalmol. doi: 10.1155/2011/507037
Margolis, D. J., Newkirk, G., Euler, T., and Detwiler, P. B. (2008). Functional stability of retinal ganglion cells after degeneration-induced changes in synaptic input. J. Neurosci. 28, 6526–6536.
Mazzoni, F., Novelli, E., and Strettoi, E. (2008). Retinal ganglion cells survive and maintain normal dendritic morphology in a mouse model of inherited photoreceptor degeneration. J. Neurosci. 28, 14282–14292.
Menzler, J., and Zeck, G. (2011). Network oscillations in rod-degenerated mouse retinas. J. Neurosci. 31, 2280–2291.
Pan, Z. H., Hu, H. J., Perring, P., and Andrade, R. (2001). T-type Ca(2+) channels mediate neurotransmitter release in retinal bipolar cells. Neuron 32, 89–98.
Peng, Y. W., Hao, Y., Petters, R. M., and Wong, F. (2000). Ectopic synaptogenesis in the mammalian retina caused by rod photoreceptor-specific mutations. Nat. Neurosci. 3, 1121–1127.
Petit-Jacques, J., Volgyi, B., Rudy, B., and Bloomfield, S. (2005). Spontaneous oscillatory activity of starburst amacrine cells in the mouse retina. J. Neurophysiol. 94, 1770–1780.
Protti, D. A., Nicolas, F.-H., and Von Gersdorff, H. (2000). Light evokes Ca2+ spikes in the axon terminal of a retinal bipolar cell. Neuron 25, 215–227.
Roska, B., Molnar, A., and Werblin, F. S. (2006). Parallel processing in retinal ganglion cells: how integration of space-time patterns of excitation and inhibition form the spiking output. J. Neurophysiol. 95, 3810–3822.
Roska, B., and Werblin, F. (2001). Vertical interactions across ten parallel, stacked representations in the mammalian retina. Nature 410, 583–587.
Sagdullaev, B. T., Eggers, E. D., Purgert, R., and Lukasiewicz, P. D. (2011). Nonlinear interactions between excitatory and inhibitory retinal synapses control visual output. J. Neurosci. 31, 15102–15112.
Sagdullaev, B. T., Mccall, M. A., and Lukasiewicz, P. D. (2006). Presynaptic inhibition modulates spillover, creating distinct dynamic response ranges of sensory output. Neuron 50, 923–935.
Schnitzler, A., and Gross, J. (2005). Normal and pathological oscillatory communication in the brain. Nat. Rev. Neurosci. 6, 285–296.
Shatz, C. J., and Stryker, M. P. (1988). Prenatal tetrodotoxin infusion blocks segregation of retinogeniculate afferents. Science 242, 87–89.
Singer, J. H., Mirotznik, R. R., and Feller, M. B. (2001). Potentiation of L-type calcium channels reveals nonsynaptic mechanisms that correlate spontaneous activity in the developing mammalian retina. J. Neurosci. 21, 8514–8522.
Stasheff, S. F. (2008). Emergence of sustained spontaneous hyperactivity and temporary preservation of OFF responses in ganglion cells of the retinal degeneration (rd1) mouse. J. Neurophysiol. 99, 1408–1421.
Stasheff, S. F., Shankar, M., and Andrews, M. P. (2011). Developmental time course distinguishes changes in spontaneous and light-evoked retinal ganglion cell activity in rd1 and rd10 mice. J. Neurophysiol. 105, 3002–3009.
Steffen, M. A., Seay, C. A., Amini, B., Cai, Y., Feigenspan, A., Baxter, D. A., and Marshak, D. W. (2003). Spontaneous activity of dopaminergic retinal neurons. Biophys. J. 85, 2158–2169.
Strettoi, E., Mears, A. J., and Swaroop, A. (2004). Recruitment of the rod pathway by cones in the absence of rods. J. Neurosci. 24, 7576–7582.
Strettoi, E., and Pignatelli, V. (2000). Modifications of retinal neurons in a mouse model of retinitis pigmentosa. Proc. Natl. Acad. Sci. U.S.A. 97, 11020–11025.
Strettoi, E., Pignatelli, V., Rossi, C., Porciatti, V., and Falsini, B. (2003). Remodeling of second-order neurons in the retina of rd/rd mutant mice. Vision Res. 43, 867–877.
Strettoi, E., Porciatti, V., Falsini, B., Pignatelli, V., and Rossi, C. (2002). Morphological and functional abnormalities in the inner retina of the rd/rd mouse. J. Neurosci. 22, 5492–5504.
Sun, W., Li, N., and He, S. (2002). Large-scale morphological survey of mouse retinal ganglion cells. J. Comp. Neurol. 451, 115–126.
Vaithianathan, T., and Sagdullaev, B. T. (2010). Functional remodeling of inner retinal synaptic transmission during photoreceptor degeneration. ARVO Meet Abstr. 51, 2483.
Vigh, J., Solessio, E., Morgans, C. W., and Lasater, E. M. (2003). Ionic mechanisms mediating oscillatory membrane potentials in wide-field retinal amacrine cells. J. Neurophysiol. 90, 431–443.
Wong, K. Y., Dunn, F. A., Graham, D. M., and Berson, D. M. (2007). Synaptic influences on rat ganglion-cell photoreceptors. J. Physiol. (Lond.) 582, 279–296.
Wong, W. T., Sanes, J. R., and Wong, R. O. L. (1998). Developmentally regulated spontaneous activity in the embryonic chick retina. J. Neurosci. 18, 8839–8852.
Keywords: neurodegeneration, synaptic plasticity, functional remodeling, oscillations, retinitis pigmentosa
Citation: Yee CW, Toychiev AH and Sagdullaev BT (2012) Network deficiency exacerbates impairment in a mouse model of retinal degeneration. Front. Syst. Neurosci. 6:8. doi: 10.3389/fnsys.2012.00008
Received: 21 November 2011;
Accepted: 06 February 2012;
Published online: 24 February 2012.
Edited by:
Ranulfo Romo, Universidad Nacional Autónoma de México, MexicoReviewed by:
Anders Ledberg, Universitat Pompeu Fabra, SpainMario Eduardo Guido, Universidad Nacional de Cordoba, Argentina
Copyright: © 2012 Yee, Toychiev and Sagdullaev. This is an open-access article distributed under the terms of the Creative Commons Attribution Non Commercial License, which permits non-commercial use, distribution, and reproduction in other forums, provided the original authors and source are credited.
*Correspondence: Botir T. Sagdullaev, Departments of Ophthalmology and Neurology, Burke Medical Research Institute, Weill Medical College of Cornell University, 785 Mamaroneck Avenue, White Plains, NY 10605, USA. e-mail: bos2005@med.cornell.edu