Spatiotemporal properties of sensory responses in vivo are strongly dependent on network context
- Department of Neuroscience, University of Pennsylvania School of Medicine, Philadelphia, PA, USA
Sensory responses in neocortex are strongly modulated by changes in brain state, such as those observed between sleep stages or attentional levels. However, the specific effects of network state changes on the spatiotemporal properties of sensory responses are poorly understood. The slow oscillation, which is observed in neocortex under ketamine-xylazine anesthesia and is characterized by alternating depolarizing (up-states) and hyperpolarizing (down-states) phases, provides an opportunity to study the state-dependence of primary sensory responses in large networks. Here we used voltage sensitive dye (VSD) imaging to record the spatiotemporal properties of sensory responses and local field potential (LFP) and multiunit activity (MUA) recordings to monitor the ongoing brain state in which the sensory responses occurred. Despite a rich variability of slow oscillation patterns, sensory responses showed a consistent relationship with the ongoing oscillation and triggered a new up-state only after the termination of the refractory period that followed the preceding oscillatory cycle. We show that spatiotemporal properties of whisker-evoked responses are highly dependent on their timing with regard to the ongoing oscillation. In both the up- and down-states, responses spread across large portions of the barrel field, although the up-state responses were reduced in total area due to their sparseness. The depolarizing response in the up-state showed a tendency to propagate along the rows, with an amplitude and slope favoring the higher-numbered arcs. In the up-state, but not in the down-state, the depolarizing response was followed by a hyperpolarizing wave with a consistent spatial structure. We measured the suppression of whisker-evoked responses by a preceding response at 100 ms, and found that suppression showed the same spatial asymmetry as the depolarization. Because the resting level of cells in the up-state is likely to be closer to that in the awake animal, we suggest that the polarities in signal propagation which we observed in the up-state could be used as computational mechanisms in the behaving animal. These results demonstrate the critical importance of ongoing network activity on the dynamics of sensory responses and their integration.
Introduction
Complex representations in sensory cortices rely on the integration of inputs that overlap temporally and spatially, particularly in supragranular layers, yet the spatiotemporal dynamics of this synaptic integration are largely unknown. It is a general principle of cortical organization that cortical columns are arranged on the two-dimensional axis of the cortex in such a way as to form continuous topological representations, which may be thought of as maps of particular parameter spaces in the environment of an organism. When navigating the world and making decisions, organisms make use of the complete range of input from each sensory modality, and are continually combining inputs across modalities in the context of the brain's ongoing activity. Between the entry of the relatively segregated components of a representation into the input layer 4 of primary sensory cortex, and the so-called “higher” or “association” cortices where neurons respond to more abstract stimuli, these partial representations, the results of columnar computation, must be combined in a hierarchical processing scheme. This combination is the essence of sensory integration and requires anatomical and physiological overlap of the output of cortical columns. In the rodent whisker-barrel system, easily visualized input pathways for single whiskers in layer 4 of primary somatosensory cortex give rise to overlapping anatomical and functional representations in layer 2/3, creating an excellent opportunity to study the spatiotemporal dynamics of sensory processing and its relationship to ongoing brain activity.
In the past few decades, voltage-sensitive dye (VSD) imaging studies in this model system (Arieli et al., 1996; Contreras and Llinas, 2001; Petersen and Sakmann, 2001; Ferezou et al., 2006) have revealed fundamental properties of the neocortex which are sometimes left implicit in the presentation of results; namely, that subthreshold responses are locally homogeneous, that neighboring regions tend to be excited together, and that activity moves in all directions once initiated. These features are expected given early field potential results and the dense recurrent connectivity of neocortical tissue (Douglas et al., 2004; DeFelipe and Jones, 2010). At the same time, intracellular (Carvell and Simons, 1988; Moore and Nelson, 1998; Higley and Contreras, 2003; Wilent and Contreras, 2004) and extracellular (Simons, 1983; Brumberg et al., 1996; Shimegi et al., 2000; Webber and Stanley, 2004; Ego-Stengel et al., 2005) recordings indicate that stimulus-evoked spiking may be quite sparse, particularly in the rodent barrel cortex. Thus, we may think of the computations performed by a local cortical circuit as the selection of a subset of cells to fire from an envelope of partially synchronous subthreshold activity. The representation of sensory information as spikes which will be transmitted to other areas must be contained within the subthreshold spatiotemporal envelope; therefore, to understand the computation performed by a cortex it is important to understand the spatiotemporal dynamics of this envelope. Imaging studies with VSDs are uniquely suited to advancing this understanding and have revealed much about sensory responses in various modalities and organisms.
With some exceptions (Arieli et al., 1996; Petersen et al., 2003a; Ferezou et al., 2006; Hasenstaub et al., 2007; Poulet and Petersen, 2008), sensory studies have been based on data acquired as the average of many trials, combined indiscriminately with regard to brain state. Nevertheless, evoked responses in intact primary neocortex do not occur in a vacuum, but rather impinge on networks which are continuously active. Even the first experiments demonstrating the existence of the electroencephalogram (EEG) produced the surprising finding that the brain was active in the absence of sensory stimulation (Caton, 1875; Brazier, 1961). Since then, many studies have illustrated the rich repertoire of rhythms in the EEG. The cellular basis of most EEG rhythms has only recently been worked out (Speckmann et al., 2011). At both the single cell and network level, it is clear that there is a high level of ongoing activity constantly providing a background for sensory input. During sleep and epilepsy, highly synchronized slow (<15 Hz) EEG rhythms preclude the formation of dynamic neural ensembles necessary for the processing of information and the generation of rapid adaptive behaviors characteristic of the awake brain (Steriade, 2000). During the waking state, faster rhythms (>40 Hz) provide context and allow coordination of activity between groups of neurons within and between networks. Consistent with these observations, evoked sensory responses have been shown to be significantly dependent on the state of ongoing activity at the time of the stimulus (Arieli et al., 1996; Sachdev et al., 2004; Hasenstaub et al., 2007; Hirata and Castro-Alamancos, 2011).
One particular form of ongoing activity which has been the subject of much recent interest is the slow oscillation between so-called up- and down-states which occurs in the neocortex and other brain regions (Steriade et al., 1993a,b). For some time it has been known that this slow (<1 Hz) oscillation is a hallmark of deep ketamine-xylazine anesthesia and may be observed intracellularly in nearly all thalamic and cortical cells and extracellularly in the local field potential (LFP). The dynamics of cellular relationships during the slow oscillation have been extensively characterized with intracellular recordings in vivo (Steriade et al., 1993a,b; Contreras and Steriade, 1995; Contreras et al., 1996; Steriade, 1997) and in cortical (Sanchez-Vives and McCormick, 2000) and thalamic (Blethyn et al., 2006) slices in vitro. Neurons in thalamocortical circuits remain hyperpolarized and quiescent during the down-state, and are depolarized by 10–20 mV during the up-state. Both experimental and modeling studies have shown that the input resistance of cortical cells is lowered by the increased synaptic drive during depolarized states (Destexhe et al., 2003; Shu et al., 2003b; Sachdev et al., 2004; but see Waters and Helmchen, 2006). Negative LFP waves recorded from the cortical depth are the extracellular correlate of synchronized neuronal depolarization; positive waves are the correlate of synchronized and sustained hyperpolarization. Intracellular studies in the cat neocortex determined that the hyperpolarization of cortical cells is produced by the removal of synaptic input in combination with a powerful leak conductance, with the extreme synchrony owing much to the dense recurrent connectivity of these networks (Contreras et al., 1996; Sanchez-Vives and McCormick, 2000).
The recent avalanche of interest in the slow oscillation notwithstanding, neither its up- nor its down-state should be considered to be analogous to a conscious activated brain state (Steriade, 2000), nor is there yet sufficient evidence to ascribe to the phenomenon the role of a computational mechanism in the intact, awake brain, despite the demonstrated importance of persistent neural activity in other systems (Aksay et al., 2003; Major and Tank, 2004). Nevertheless, because of the well-characterized differences in the resting membrane potential and input resistance of single neurons in the two states, the slow-oscillating brain presents an opportunity to address a fundamental question in neurophysiology: how are the properties of an excitable tissue en masse shaped by changing the responsiveness of the individual elements which comprise it?
In this study we used tungsten bipolar electrodes to monitor the cortical LFP and multiunit activity (MUA) while recording whisker-evoked responses over the entire barrel cortex of the mouse in vivo using VSD imaging with either RH795 or RH1691. LFP and MUA recordings allowed us to characterize in detail the spontaneously occurring state changes observed under ketamine-xylazine anesthesia and classify the sensory responses into three categories according to their relationship to the spontaneous oscillation. We used single-whisker stimuli, paired simultaneous stimuli, and stimuli paired at a 100 ms interval. These stimulation conditions represent a sampling of common paradigms in the whisker sensory literature and in sensory physiology more generally. Our goal was to revisit each of these common conditions with attention to network context.
We observed that evoked sensory responses both altered and were altered by the ongoing network activity in important ways. Using barrel-column averaged VSD signals to examine response properties across the entire barrel field, we show that the properties of sensory responses are altered by the shift to the up-state in ways which go beyond what has been previously reported. We find that, in the up-state, whisker deflections produce an initial depolarization which is smaller in amplitude and area than that observed in the down-state and more likely to propagate asymmetrically across the barrel field. In the up-state, but not in the down-state, this depolarization is followed by a hyperpolarizing wave which moves in a consistent direction across cortical columns. We also show that, regardless of state, there is little difference between single- and multiple-whisker stimuli in the spatial extent of subthreshold evoked responses. Finally, we show that the degree of suppression of a second response depends more strongly on the second stimulated whisker's location than on the relative radial position of the first stimulated whisker, regardless of brain state. Because the resting level of cells in the up-state is likely to be closer to that in the awake animal, we suggest that the polarities in signal propagation which we observe in the up-state could be used as computational mechanisms in the behaving animal.
Materials and Methods
Results are based on 40 adult C57 mice (7–12 weeks old, 20–35 g). From these, 30 experiments were selected for analysis based on the following criteria: (1) homogeneous VSD staining of the barrel cortex as judged by visual inspection of the baseline image (14-bit) obtained at the beginning of each recording, (2) stability of the optical responses throughout the experimental session, (3) stability of the spontaneous LFP pattern recorded from the same electrodes used for electrical stimulation, (4) stability of the evoked LFP responses recorded by electrodes adjacent to the stimulating one, and (5) large signal-to-noise ratio (10:1) of VSD responses to deflections of at least two different vibrissae.
Surgery and preparation
Mice were deeply anesthetized with ketamine-xylazine (100 mg/kg i.p., 20 mg/kg i.p., respectively,) and mounted in a stereotaxic apparatus. Supplemental anesthesia (25 mg/kg, 5 mg/kg) was administered as necessary to maintain cortical slow oscillations and weak or absent foot withdrawal reflex. A craniotomy was made which extended 2 mm in the anterior-posterior direction starting from bregma, and 2–4 mm in the mediolateral direction starting from the midline. In most animals this was sufficient to expose most of the posteriomedial barrel subfield (PMBSF). The dura was resected over the entire craniotomy.
Once electrodes were inserted, hand stimulation of the whiskers with audio feedback from the cortical LFPs was used to determine the approximate location of the electrodes within the PMBSF. This information was used to determine the whiskers most suitable for VSD imaging.
Staining
Following Kleinfeld and Delaney (1996), a 1 mm3 piece of gelfoam (Upjohn Pharmacia) was soaked in a warm solution of the VSD RH795 (Molecular Probes, Eugene, OR, 1 mg/mL) or RH1691 (Optical Imaging, Mountainside, NJ, 1 mg/mL) in 0.9% saline and placed on the exposed cortex. Additional dye was added to keep the gelfoam soaked for 1.5 h. After staining and before recording the exposed surface of the brain was generously washed with saline to remove unbound dye. Throughout the experiment the brain surface was rinsed with saline to prevent desiccation. RH795 (Grinvald et al., 1994; Obaid et al., 2004) and RH1691 (Shoham et al., 1999) are potentiometric styryl dyes which attach to cell membranes and show a decrease (RH795) or increase (RH1691) in fluorescence on a microsecond time scale in response to membrane depolarization. For consistency with convention all VSD responses shown here are oriented so that positive-going deflections indicate depolarization. When applied topically in vivo, the dyes stain the supragranular cortical layers most intensely (Kleinfeld and Delaney, 1996; Petersen et al., 2003a). Potentiometric dyes are linear indicators of Vm over physiological ranges (Cohen and Salzberg, 1978; Cohen et al., 1978). The dye is taken up preferentially by dendrites and cell bodies. Because layers 2/3 are primarily neuropil, the signal source in vivo is considered to be mostly from dendrites (Grinvald et al., 1994; Yuste et al., 1997; Contreras and Llinas, 2001), although a recent detailed stereological analysis revealed that far more axonal than dendritic membrane per unit of volume is present in the neuropil of layers 2 and 3. Some contribution also comes also from glial cells (Konnerth et al., 1987; Salzberg, 1989).
Optical recordings
Recordings were made with a modified upright microscope (Olympus, BX50WI). Epi-illumination was provided by a 12V halogen lamp. Excitation light was bandpass filtered at 540 ± 20 nm; light emitted from the preparation was long-pass filtered below 600 nm. The optical signal was collected with a CCD camera (MiCam01 or Ultima, BrainVision, Japan) with a detector array of 87 × 60 (Micam01) or 100 × 100 (Ultima) imageable pixels, at frame rates of 250–500 Hz (2–4 ms/frame). Frame times given in figures and text refer to the end of acquisition of a frame; for example, a frame labeled 24 ms and acquired at 250 Hz is a measurement of light emitted from 20–24 ms poststimulus. The microscope objective was 4X (N.A. = 0.28, Olympus, Japan). With the Micam01, an Olympus U-TV0.35×C demagnifying camera adapter was used, resulting in a total magnification of 1.4×, imageable area of 1.5× 2 mm, and a pixel size of 22 by 22 μm (484 μm2). With the Micam Ultima, the camera adapter was not used, resulting in an imageable area of and 2.5 by 2.5 mm with a pixel size of 23 by 23 μm (529 μm2). Optical recording was controlled by the BrainVision software.
The fractional fluorescence change received little contribution from intrinsic metabolic signals related to oxygen delivery. No data was analyzed beyond 250 ms after a stimulus, i.e., the time between the first whisker deflection and the peak response to a second whisker deflection 100 ms later. In contrast, hemoglobin-associated absorbance changes have been shown to begin several hundred milliseconds poststimulus. For example, in Devor et al. (2003), blood-flow related signals were recorded from 1.5 to 2.5 s after the stimulus whereas LFP and MUA were integrated from 0 to 300 ms after the stimulus. The “early signal” or “initial dip” corresponding to the increase in deoxyhemoglobin by oxygen delivery to neurons takes almost 1 full second to develop (Frostig et al., 1990; Kim et al., 2000). Additionally, in experiments with RH1691, which is not sensitive to hemoglobin changes due to its shifted absorbance spectrum, the kinetics of the responses were identical to those seen with RH795.
Electrophysiological recordings
To record LFPs, we constructed arrays of 3 or 4 pairs of tungsten electrodes (FHC, Bowdoinham, ME), with vertical tip separation of 0.5 mm and horizontal separation of 0.75 mm between pairs in the array. For each experiment the array was advanced into the cortex at the lateral edge of the craniotomy, normal to the cortical surface, until the upper electrode just entered the pial surface. Recording and stimulation were in bipolar configuration. The signal from the electrodes was band-pass filtered between 0.1 and 300 Hz to obtain LFP recordings, and between 300 and 10000 Hz to obtain multiunit recordings (MUA). Measurements of MUA and LFP were made at the periphery of the stimulated area, to allow for imaging over the greatest possible cortical area.
Whisker stimulation
A reliable optical response was first obtained from a single whisker in response to a 100 ms ramp-and-hold deflection (8 ms rise time, 1300°/s, calibrated as for (Wilent and Contreras, 2004) in the ventral direction with a piezoelectric device (Simons, 1983). For simultaneous stimulation of two whiskers, two whiskers were threaded into the same piezo-controlled tube. For multiwhisker sequences, an air puff (Picospritzer, Intracel, Herts (UK), 10 ms, 2–5 PSI) was directed to deflect another single whisker or group of whiskers in the ventral direction using a 1 mm diameter glass capillary tube bent into an “L” shape. Great care was taken to ensure that no whiskers were unintentionally stimulated; when necessary, nearby whiskers were trimmed away. Once clear responses had been evoked from two whiskers, pairs of deflections were presented at an interstimulus interval (ISI) of 100 ms.
Cytochrome oxidase histology
At the conclusion of an imaging experiment, two fiducial marks were made by advancing an electrode into two different locations in the imaged cortex. Reference images in register with the VSD recordings were taken with these new marks. Animals were perfused with 4% paraformaldehyde in 0.1 M sodium phosphate buffer (PBS). Brains were postfixed overnight in the same fixative and the cortex was flattened by pressing gently between two clean microscope slides submerged on PBS. One hundred micron thick tangential sections were cut in a vibratome (Vibratome 1000-plus). In order to reveal the barrels, tissue was treated with 3,3′-Diaminobenzidine (DBA, Sigma D-5905) and Cytochrome C from horse heart (Sigma C-2506) according to (Wong-Riley 1979) with some modifications. Briefly, sections were washed in 0.1M PBS (3×10 min) at room temperature and incubated in a mixture of 0.1 M PBS with 10% methanol (Fisher Scientific BP1105-1) and 1% hydrogen peroxide (Sigma H-1009) for 15 min at room temperature, washed again in PBS (3×10 min) and kept in the dark shaking overnight at 4°C in 0.1 M PBS containing 4 g sucrose, 50 mg DBA (Sigma) and 30 mg of cytochrome oxidase per 100 ml of PBS. The following day, tissue was washed in PBS, mounted on subbed glass slides, dehydrated, and coverslipped.
Trial sorting
Optical data was collected as single trials, with no online blank subtraction or online averaging. We identified transitions between states by visual inspection of the simultaneously and continuously recorded LFP from S1 cortex, and classified the single-trial optical recordings into three groups: trials occurring in the down-state, trials occurring in the up-state, and trials in which the stimulus caused a transition to the up-state.
Barrel binning
The tracks left by the field potential electrodes, in combination with the additional fiducial marks made at the end of the experiment, were used to align the barrel outlines from histology with the fractional fluorescence images. This allowed binning of pixels into signals corresponding to the average activity within barrel-columns. The margin of error for the alignment of barrels was the width of a single electrode, which is close to the width of septa.
Data analysis
Optical data was collected as differential fluorescence and divided by a reference image acquired automatically at the start of each trial to produce fractional fluorescence (ΔF/F) data which was used for all analysis and figures. Post-processing consisted of averaging of single trials after screening (see below) followed by binning into barrels as described above. For clarity the images shown in Figure 4 were filtered with a flat 3 × 3 kernel. All analysis was done with custom routines written in Igor Pro (Wavemetrics, Lake Oswego, OR).
Quantification of Responses
Area functions (Figure 4B, right) were computed by counting the number of pixels in each frame with values at least 2 SD above the prestimulus noise at that pixel. These values were then multiplied by the pixel size to produce areas in mm2. The number of barrel columns participating in a response (Figures 5 and 6) was measured by first projecting the histologically identified barrel map onto the optical recording using fiducial marks (see Civillico and Contreras, 2006 Figure 1), and binning the pixels into column-sized regions accordingly. Average time traces were then taken using these barrel-column regions of interest. The determination of a response for barrel column counts was performed by comparing the maximum amplitude of each barrel column signal in a 100 ms window following the stimulus with a threshold based on the prestimulus SD of the barrel column signal.
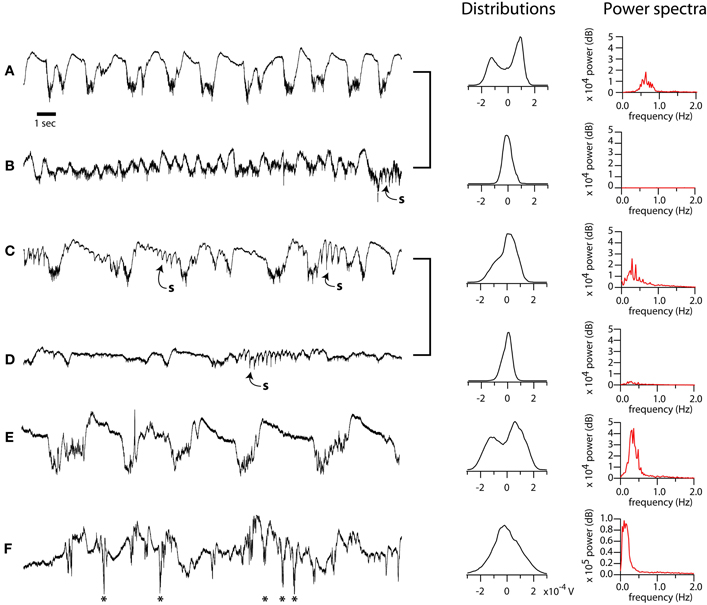
Figure 1. Diversity of spontaneous LFP patterns in mouse barrel cortex under ketamine-xylazine anesthesia. (A–F), left column: Selected 20 s epochs of LFP displaying typical variation in electrographic features. Recordings from same preparation (A–B, C–D) grouped with brackets. Sleep spindles in B, C, D, indicated by “s.” Paroxystic events in F indicated by asterisks. Middle column: distributions of LFP amplitude over 10 min periods containing the corresponding epochs shown at left. Right column: power in the 0–2 Hz frequency band for the same periods. Except where indicated, all recordings shown in this study were performed in the bistable, deeply anesthetized state corresponding to the recordings in A or E.
Polar Amplitude Plots
Polar amplitude plots (Figures 7, 8, 9, 10) were computed as follows: a grid schematic of the barrel field was divided into eight radial half-quadrant sectors with the stimulated whisker taken as the center. Each barrel column accessible to the VSD recording was mapped to a sector based on its angular position relative to the stimulated whisker on the schematized grid. The values of the mapped quantity (amplitude, slope, latency, etc.) were averaged for each radial sector and plotted using polar coordinates.
Polar amplitude plots in Figures 7, 8, and 10 were normalized by maximum polarity as follows: each eight-point plot consisted of four pairs separated by 180°, representing four possible axes of polarity. The largest polarity or maximum anisotropy was identified by comparing the members of each of these four pairs, and the smaller value of that pair was used to normalize the histogram. To facilitate comparison with the center hyperpolarization, polar amplitude plots in Figure 9 were normalized according to the value of the center hyperpolarization.
Quantification of divisive suppression
To quantify the divisive suppression of whisker responses as a function of radial position, the transient ratio (TR) was calculated as the magnitude of the second whisker transient following a preceding whisker response, divided by the size of the second whisker response alone. TR polar amplitude plots for second whisker responses were calculated as for the single response measurements, with different choices of origin as described in results.
Results
LFP and MUA Whisker Responses During the Slow Oscillation
The slow oscillation under anesthesia is characterized by spontaneous and widespread changes in membrane potential and firing probability. Our goal was to examine the effect of these well-characterized rhythmic neuronal excitability changes on the spatiotemporal properties of sensory responses measured with voltage sensitive dyes (VSDs) in vivo. In order to understand the effect of network state on sensory responses it is critical to first understand the variability of the oscillation under anesthesia and, perhaps more importantly, the interaction between single stimuli and the spontaneous cycles of oscillation. We reasoned that, if down-state stimuli could trigger new up-states, such responses must be analyzed separately from the other down-state responses. Because the period of the slow oscillation is much longer than the optical recordings, to monitor the spontaneous electrical activity on which responses were superimposed, we recorded the LFPs and MUA from the primary somatosensory cortex. The recordings shown in Figure 1 illustrate the rich variability of the anesthetized preparation. Under deep and stable anesthesia, the spontaneous LFP was characterized by a prominent and stable slow oscillation (<1 Hz) consisting of alternating positive and negative waves (Figures 1A,C,E, 2). Deepening of anesthesia resulted in an increase in amplitude and decrease in frequency of the slow oscillation, which reached values as low as 0.3 Hz (Figure 1E). Conversely, lightening of anesthesia was characterized by a progressive reduction in the amplitude of the slow oscillation (Figures 1B,D and Figures 2A,B, “activated”). We measured the bistability of EEG patterns by computing the distribution of amplitude values over 10 min periods (middle column, distributions). When the EEG alternated between two stable states, the distributions contained two separated peaks (A, E), or occasionally a peak with a prominent shoulder, indicating a greater proportion of intermediate values due to frequent spindles (C). We computed power spectra for 10 min EEG periods. During periods of deep anesthesia the power spectrum was dominated by a peak between 0 and 1 Hz; under lighter anesthesia this peak was absent. For the data presented below, we controlled the level of anesthesia as to maintain a stable slow oscillation (see below Figure 2). We will refer to the negative phase of the LFP during the slow oscillation, in which neurons are depolarized, as the up-state, and to the quiescent, depth-positive waves, in which neurons are hyperpolarized, as the down-state.
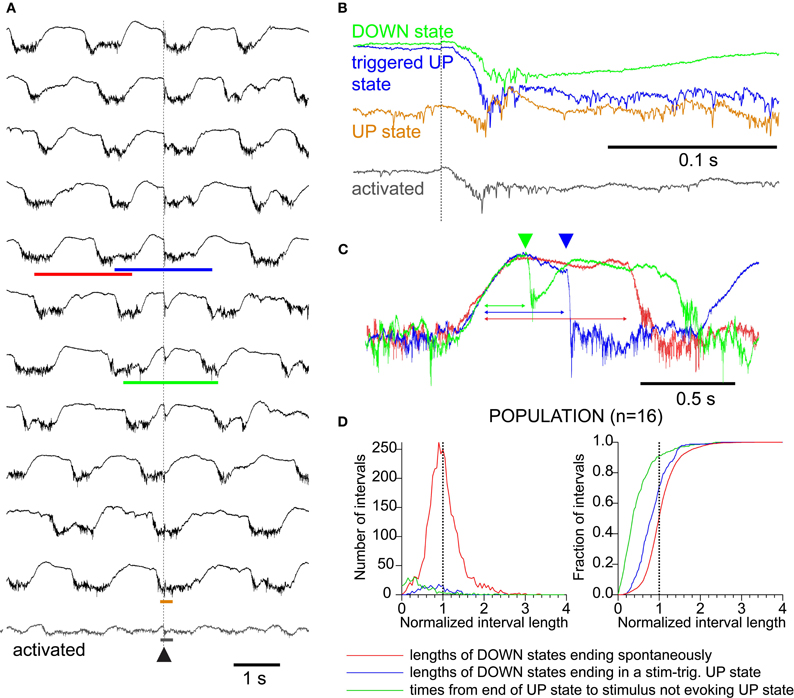
Figure 2. Sensory responses interact with ongoing network activity as visualized in the LFP.(A) LFP trials at compressed time scale, arranged from top to bottom by phase of sensory stimulus with respect to ongoing spontaneous oscillation. (B) Expanded time scale of four examples from A, showing differing structure of LFP responses to triggered-up (blue), down (black), up (brown), and “activated (gray).” As in A, traces are aligned to the stimulus time which is indicated by the dotted line. (C) Compressed time scale of three examples indicated by the colored bars in A showing the relationship between the stimulus and the oscillation. Traces are aligned on the end of an up-state to highlight the difference in down-state lengths. Green and blue arrowheads indicate stimulus times for green and blue traces, respectively. The red trace shows a cycle without a stimulus for comparison (see red bar in A). (D) Distributions (left) and cumulative distributions (right) of time measurements showing effects of state changes and responses on each other. RED: lengths of down-states which end spontaneously (compare to red trace in 1C). BLUE: lengths of down-states which end in a stimulus-associated up-state transition (compare to blue trace in 1C). GREEN: interval between the start of a down-state and a stimulus that did not trigger an up-state transition. Down-state shortening due to stimulus: green is shorter than blue (K–S test, p < 0.01); Up-state refractory period: blue is shorter than red (K–S test, p < 0.01).
Whisker stimuli were delivered at a fixed frequency (0.1–0.2 Hz) and, therefore, occurred randomly with respect to the ongoing slow oscillation. Because the stimulus frequency was much slower than the oscillation frequency, we recorded many oscillation cycles which contained no stimulus. The shape of the whisker responses was strongly modulated by the slow oscillation and, reciprocally, whisker responses entrained slow oscillation cycles, both in a phase-dependent manner (Figure 2). To illustrate the phase dependence between whisker responses and the slow oscillation, we ordered the LFP responses according to the phase in which they occurred (Figure 2A). Stimuli occurring in the second half of the down-state (>420 ms after the termination of the preceding up-state in this example) triggered a new up-state (Figures 2B and C, blue trace). Stimuli delivered early during the down-state did not trigger a new up-state but generated a large monophasic response lasting approximately 200 ms (Figures 2B and C, green trace). When stimuli occurred during the up-state, responses consisted of a short negative wave, followed by a positive wave and a return to the steady level of the up-state (Figure 2B, brown trace). Stimuli delivered during occasional periods when the slow oscillation was absent (similar to an activated EEG) (Figure 2A, bottom trace, detail in Figure 2B) generated a smaller amplitude response not followed by a large hyperpolarization. We did not observe changes in duration of the down-state when the stimuli occurred during the up-state, nor did we observe premature termination of the up-state by the occurrence of a whisker response. A typical triggered up-state is shown in Figure 2C (blue trace) with respect to a spontaneous cycle (red trace) and with respect to a response that does not trigger an up-state (green trace).
We quantified the effect of whisker stimulation on the ongoing activity by plotting the distribution of the durations of the down-states (n = 16 mice, 3968 total oscillatory periods; Figure 2D). To compensate for the variability in oscillation period across experiments, we normalized the down-state durations within each experiment to the median spontaneous duration for that experiment. The normalized distributions were added to obtain population distributions (Figure 2D, left), which were integrated to obtain population cumulative histograms (Figure 2D, right). The distributions show that down-states that were terminated by a sensory triggered up-state (blue trace) were significantly shorter than those terminating spontaneously (red trace, p < 0.01, K–S test), demonstrating that responses to whisker stimulation effectively reduced the duration of the down-state by triggering a new cycle of the slow oscillation. Responses that failed to trigger an up-state (green trace) occurred significantly earlier (hence, closer to the termination of a previous oscillatory cycle) than those that succeeded (green histogram vs. blue histogram, Figure 2D, p < 0.01, K–S test), which shows that the slow oscillation has a refractory period, as shown previously in vitro (Sanchez-Vives and McCormick, 2000).
The phase-dependence and duration of the LFP response was paralleled by the MUA recorded on the same electrodes (Figure 3). Spontaneous spiking activity occurred exclusively during up-states and paralleled the duration of the up-states recorded in the LFP, demonstrating that up-states represent sustained depolarization (Figure 3A). We quantified the MUA by constructing peristimulus time histograms (PSTH) from spikes isolated using an arbitrary threshold (Figure 3A, red line). Stimuli arriving during established up-states caused a short-latency multiunit response followed by a trough indicating inhibition which was strong enough to completely suppress firing for at least 50 ms (Figure 3B, top panel). Stimuli arriving early in the down-state triggered a phasic response which was sometimes followed by a temporally broader, lower-amplitude rebound (Figure 3B, middle panel). As described for LFP responses, stimuli arriving later in the down-state triggered an up-state (Figure 3B, bottom panel) and the response was characterized by a large initial MUA peak, followed by a valley and then a resumption of the activity level seen in spontaneous up-states. Neither the initial peak nor the valley were present in the firing pattern during spontaneous up-states (Figure 3B, bottom panel, red open histograms), indicating that the sensory response was to a certain degree additive with the up-state which it triggered. Thus, the slow oscillation showed a refractory period after which sensory responses to whisker deflections successfully triggered a new up-state. However, sensory responses did not terminate or delay an up-state. Furthermore, hyperpolarizing inhibition was only present in the sensory responses during the up-state. This is likely due to several effects of the more depolarized membrane potential, including an increased driving force for GABA-mediated chloride currents in pyramidal cells, as well as the increased firing probability of inhibitory interneurons. Thus, our results demonstrate that sensory responses are not only modulated by spontaneous activity, but also entrain it. Furthermore, sensory responses engage local circuit inhibition in a state-dependent manner.
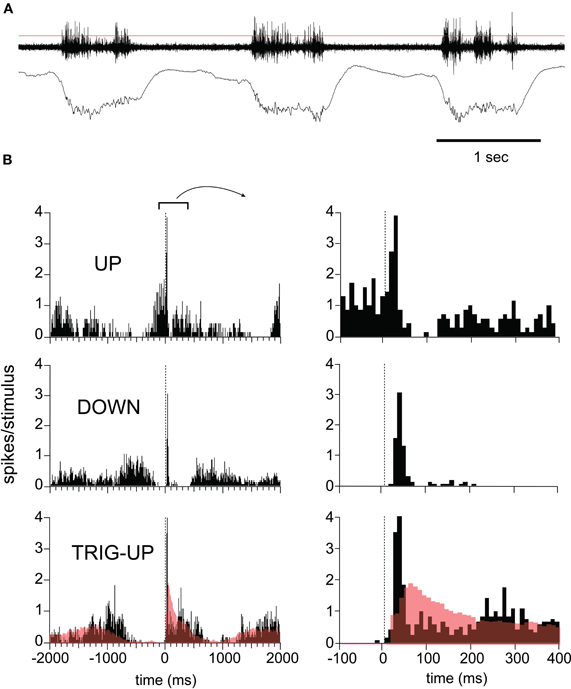
Figure 3. Response variability in the MUA as a function of network state. (A) Three cycles of spontaneous EEG. Top trace (MUA) was filtered at 30–10000 Hz and concurrent LFP recording was filtered at 0.1–100 Hz. Thin red line indicates threshold used to detect events used in peristimulus histogram (PSTH). (B) MUA responses to whisker deflections, grouped by time with respect to the slow oscillation. Top: responses in up-state. Note inhibition revealed by trough in PSTH during up-state. Middle: Short-lasting responses in down-state. Bottom: Stimulus triggers up-state. Red line shows the histogram of spontaneous up-state, superimposed. All data is from same experiment shown in Figure 1.
Responses Recorded with Voltage Sensitive Dyes
The LFP (Figure 2) and MUA (Figure 3) recordings illustrate the state-dependence of responses at single locations. To quantify this state-dependence over the entire surface of the barrel cortex, we recorded the population Vm response from the supragranular layers with VSDs (Figure 4). The simultaneous LFP and MUA recordings allowed determination of the state of the network at all times, providing an independent means to classify the VSD responses for analysis. Optical responses were sorted according to state based on the simultaneously recorded LFP and 10 trials per state were averaged together to produce three sub-averages (for consistency with intracellular recordings all VSD responses shown here are oriented so that net depolarization is indicated by upward deflections). In the example shown in Figure 4A, a deflection of whisker D2 during the up-state (top row) resulted in a low-amplitude depolarizing response, beginning above the D2 barrel at 22 ms and spreading to all other barrels, which was followed by a large and widespread hyperpolarization visible over the entire barrel field at 172 ms. Responses occurring early in the down-state (middle row) showed a larger depolarization and an absence of hyperpolarization, and failed to trigger an up-state. When the stimulus occurred later in the down-state and triggered an up-state (bottom row), the response was larger and of shorter latency than that occurring during the down-state. Consistent with the LFP recordings, the triggered up-state was the largest optical response and lead to a strong widespread depolarization with a long latency and long duration. The difference in response amplitude between states can be best appreciated in the fluorescence signal averaged over the principal barrel being activated (Figure 4B, left column, D2 in this example) but may also clearly be observed in the column-averaged signal in individual trials (thin traces). That such differences are robust across the surface is shown by the fact that single pixel, single trial behavior is consistently similar to the average (Figure 4B, middle column). The peaks of the fluorescence responses during the down- (blue traces) and the up-(red traces) states were 49% and 15% of the peak of the triggered up-state (blue traces), respectively. Finally, consistent with its corresponding LFP response, the VSD response in the up-state returned to baseline more quickly than in the other states (∼50 ms).
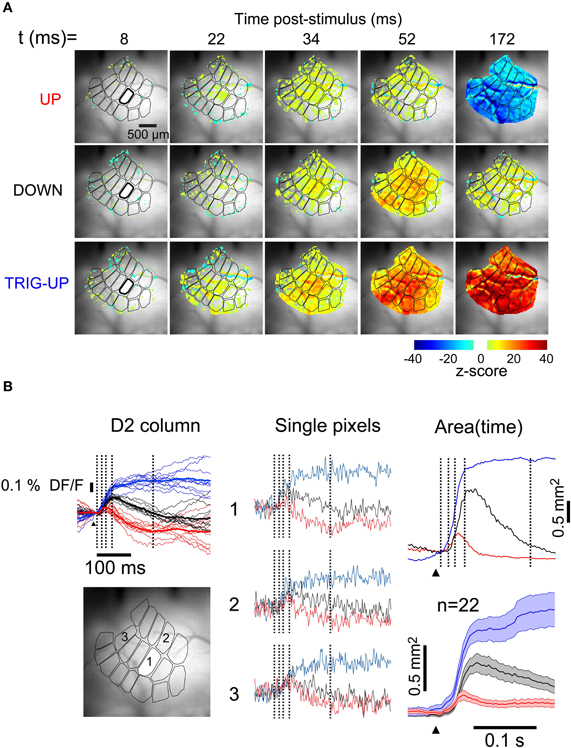
Figure 4. Spatiotemporal profile of whisker response is dependent on brain state. (A) Snapshots at five consecutive times during responses to identical deflections of the D2 whisker. Top row: in up-state. Middle row: in down-state, early. Bottom row: in down-state, late, triggering an up-state. Image series were averaged from 10 single trials for each state. (B) (Left) Fluorescence traces from the stimulated barrel of the same three recordings, color corresponds to labels at left of image series in A. Vertical lines indicate times of frames in A. Thin lines: individual trials. Thick lines: average of thin lines. (Middle) Single pixel traces in the different states. Locations indicated on grayscale frame at bottom left. (Right, upper panel) Thresholded depolarized areas as a function of time. Vertical lines indicate times of frames in A. (Right, lower panel) Average depolarized areas as a function of time (n = 22 experiments). Shaded area indicates ± SEM.
Clear responses with these same basic features were visible in state-averaged recordings from single pixels (529 μm2, Figure 4B, middle column). To quantify the differences in the spatial spread of the responses, we measured the total depolarized area (Figure 4B, right column, see “Methods”) as a function of time. In the representative example of Figure 4, the depolarized area of the response during the down-state reached a maximum of 62% of the visible barrel cortex (1.4 mm2 at 56 ms (Figure 4B, right, black trace). In contrast, in the up-state the depolarized area was smaller (Figure 4B, right, red trace), consistent with a previous report (Petersen et al., 2003b), reaching a maximum of 24% of the visible barrel cortex 0.45 mm2 at 40 ms. This depolarizing response was followed by a hyperpolarization encompassing the entire visible barrel cortex by 150 ms (top row, rightmost frame). Finally, the depolarization of the triggered-up state reached 0.93 mm2 by 34 ms, and extended over 1.6 mm2 by 150 ms (Figure 4B, right, blue trace). Only the response in the up-state had a significant hyperpolarizing component. The average of the population (n = 22) measurement of depolarized area is shown in Figure 4B. Because the triggered up-state responses consist almost entirely of self-generated recurrent activity in cortex, their spatiotemporal properties are not comparable with those of the other sensory responses. Therefore, we will not consider the triggered-up state responses further. Thus, the remaining analysis will be concerned only with responses during up-states and responses during down-states that did not trigger an up-state.
Inspection of the up-state responses in images such as those shown in Figure 4A suggested that despite being fewer in number, activated pixels in the up-state were distributed across a large portion of the visible barrel cortex, suggesting that the number of barrel columns activated may not significantly differ across states. Such an observation would imply that, rather than “sharpening” a simple sensory representation, depolarization of the cortical network would instead function to make the representation sparser while remaining distributed. In order to quantify and compare the number of responding barrel columns across states we averaged the fluorescent signal inside each barrel column area (see “Methods”). We counted as responding barrel columns (n = 30 whisker responses in 20 mice) those in which fluorescence transient values crossed an arbitrary threshold expressed in units of standard deviation (SD, z-scores) of the prestimulus baseline (Figure 5). Because varying threshold revealed a difference in the number of barrels showing a response, we systematically explored the effect of detection threshold in the comparison between up-and down-states. As expected, the number of barrels included in the response decreased with increasing threshold (Figure 5A). More importantly, the effect of increasing threshold was parallel between up- and down-states (Figure 5A, red and black trace, respectively); for all thresholds in which there was a difference there were more barrels responding in the down-state. At a threshold of 3SD, all barrels included in the image were responding in both states. But even at 5SD most of the barrels responded during both down- and up-states. We quantified the difference between up- and down-states by measuring the threshold level at which the number of barrel-columns participating in the response crossed below half of its maximum. Because we converted response amplitudes into z-scores (response amplitude divided by prestimulus SD), we refer to this value as z1/2. In all experiments, z1/2 was lower for the up-state than for the down-state. The population average of the ratio of z1/2 between up and down-state was 0.40 ± 0.03 (Figure 5B, mean and SEM indicated by the red circle with error bars).
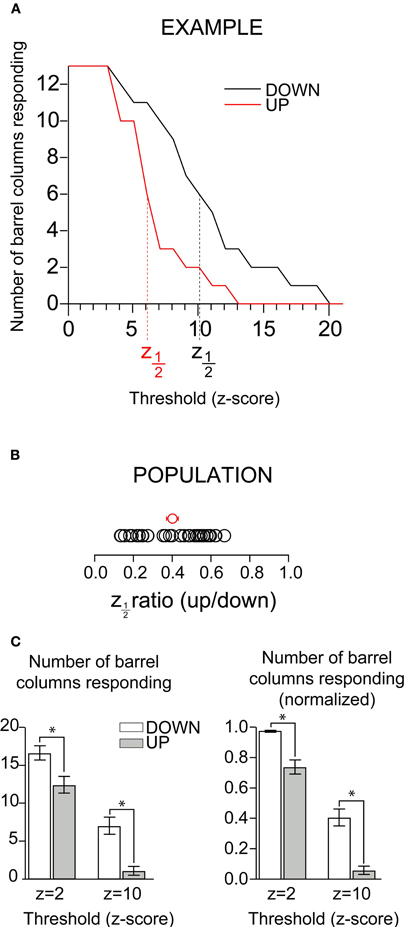
Figure 5. Columnar extent of depolarizing responses in up and down-states. (A) Count of participating barrels as a function of chosen fluorescence (z-score) threshold for down-(black) and up-(red) states in an example experiment. Vertical dotted line indicates a z1/2 of 1. (B) Up-state z1/2 values for all experiments (each normalized to the corresponding down-state); red dot indicates mean. (C) Raw (left) and normalized (right) column counts for minimal response (z = 2) and large response (z = 10) thresholds in up- and down- states. Statistically significant differences between up and down-state counts (Wilcoxon Signed Rank Test, p < 0.01) are indicated with the *.
To compare the number of depolarizing columns between the up- and down-states for the population, we arbitrarily chose two thresholds, one low (z = 2) and one high (z = 10). (Figure 5C, left). When the threshold was 2SD above background noise (minimal response, z = 2 in Figure 5C), we observed that the majority of barrel columns participated in responses in both up and down states, and the difference between the two states was statistically significant (Wilcoxon Signed Rank Test, p < 0.01). The column counts at lower threshold values showed that some degree of depolarizing response propagated over most of the imaged area in both the up- and down-states. Thus, at the level of barrel columns, responses in both the up- and the down-states spread over almost the entire barrel cortex. By combining pixels into a barrel column signal, we decreased the noise and became able to resolve a smaller response. The number of responding columns in the up-state is greater than what has been implied by previous work (Petersen et al., 2003b), a difference we attribute to an increase in sensitivity over previous work due to (1) binning pixels over a columnar area and (2) recent improvements in CCD technology. Because the entire barrel field could not be imaged in all experiments, we normalized the number of responsive barrels by the total number of imaged barrels in order to better compare population data between states (Figure 5C, right); the effects were unchanged. When the threshold was increased to 10 SD above background noise, fewer columns responded in both up- and down-states, but the decrease was greater in the up-state (decrease was from 98% to 41% in the down-state, and from 74% to 6.3% in the up-state).
Responses to Two Whiskers
Because under natural conditions many whiskers are stimulated simultaneously, and because single whisker responses have been shown to influence one another, we extended our context-based analysis to multiwhisker responses. In a subset of experiments (8/30), we threaded two adjacent whiskers into the glass of the same piezoelectric stimulator. This had no effect on the average columnar extent of responses in either the up- or the down-state. We mapped the peak response in units of SD (z-scores) at all pixel locations and superimposed the histologically determined barrel map onto these maps; this showed that in both states there were statistically significant responses in all columns (Figure 6A, color scale starts at 2SD). The same effect is seen in the barrel-column averaged pixel traces (Figure 6A, bottom panels). We averaged the extent of columnar responses as for single-whisker responses and found the same effect (Figure 6B). In all subsequent data analysis, single and multiple whisker responses are pooled. This strong sublinearity of the summation of responses from more than one whisker when activated at a negligible time interval is consistent with our earlier detailed study of multiwhisker response interactions (Civillico and Contreras, 2006).
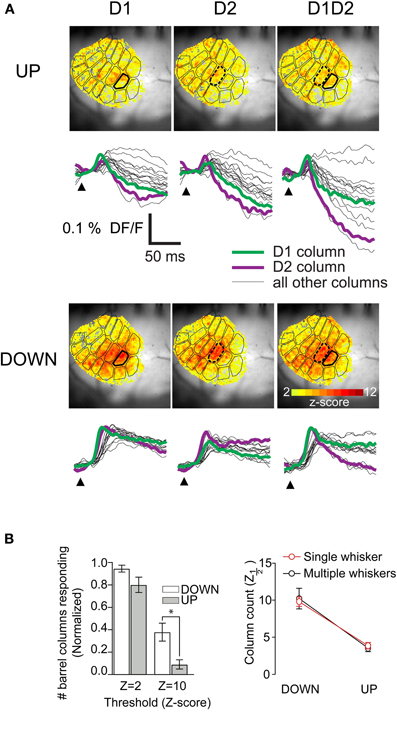
Figure 6. Absence of significant differences between the columnar extent of two-whisker and one-whisker responses.(A) Maps of peak response at each pixel over 40 ms poststimulus in response to the indicated whisker deflections in down- and up-states. Peak maps were constructed from averages of 15 recordings per state. (B) (Left) Barrel-column-averaged traces from same example as A. Statistically significant differences between up and down-state counts (Wilcoxon Signed Rank Test, p < 0.01) are indicated with the *. (Right) Comparison of z1/2 values in down- and up-states for single whisker and multiwhisker experiments.
Spatial Asymmetry in the Depolarizing Response
We compared barrel-column averaged traces from different parts of the barrel field and detected a consistent asymmetry in spatial distribution of response amplitude in the up-state only (Figure 7A). In the example of Figure 7A, after stimulation of D2 during the up-state, the peak amplitude of the response in the D1 column was 50% less than that in the D2 column, whereas the amplitude was unchanged from D2 to D3. This effect was not seen in the down-state. There was a similar but less pronounced effect along the arc axis: in the down-state, the responses in C2 and E2 were the same size as in D2 (Figure 7A, left). However, in the up-state, the response in the E2 column was 5% larger, whereas that in the C2 column was 5% smaller. This result shows that in the up-state, responses were asymmetric with respect to direction of propagation.
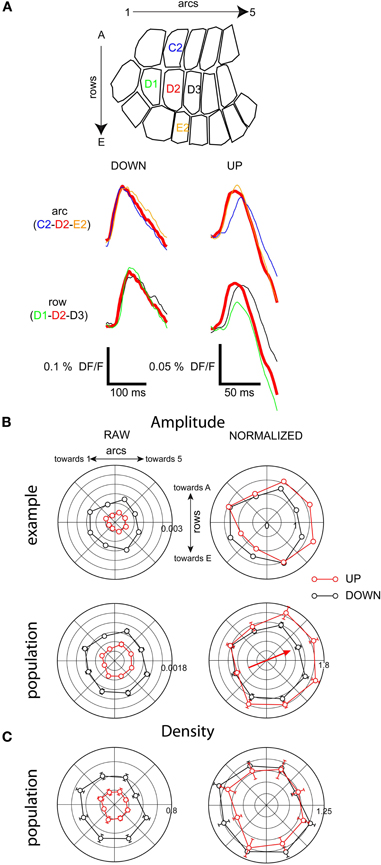
Figure 7. Depolarizing response amplitude distribution is not homogeneous in the up-state. (A) Barrel-column-averaged traces from a cross-shaped subregion of the barrel field, with the stimulated whisker (D2) at the center. Top: along row-axis comparison. Bottom: along arc-axis comparison. (B) Radial plot of response amplitude; same experiment as A. (C) Population radial plot of response density.
We quantified this asymmetry of propagation by binning the barrel field into eight radial quadrants with the stimulated whisker at the center, and generating polar plots of response amplitude (Figures 7B and C). We normalized the polar plots in order to compare their shapes (see “Methods”). The bias toward higher numbered arcs seen in the example traces (Figure 7A) is clear in the normalized barrel column polarity plot for this example (Figure 7B, upper panel) and was also clear in the entire population of barrel column-averaged recordings (Figure 7B, lower panel). In the direction of maximum asymmetry (indicated by the arrow in 7B) the average response in the preferred propagation direction was 1.6 times greater than the anti-preferred direction in the up-state vs. 1.3 times greater in the anti-preferred direction in the down-state.
The asymmetry in amplitude of the barrel-averaged responses could be due to a larger number of responding pixels within the barrel or to a greater response from the same number of pixels. Thus, we measured the percentage of responding pixels (response density) within all imaged barrel-columns as a function of time and plotted the value as radial averages in the same way as with the response amplitude above (Figure 7). Up-state responses used a smaller percentage of the barrels (averaging 20% vs. 60% in the down-state), consistent with the more granular responses in the up-state images shown in Figures 4 and 6. There was no significant polarity to the peak densities of responses indicating that the asymmetry in the spatial distribution of barrel column-averaged signals during up-state responses (Figure 7B) is due to differences in amplitude and not to differences in the number of responding pixels within each barrel-column.
We also examined the polarity of the response time course. There was no significant polarity to the onset latency (Figure 8, left). Rise times, however, were significantly longer in the down-state toward the A row and lower-numbered arcs. In the up-state the rise times were more evenly distributed (Figure 8, middle). The initial slopes of responses were significantly larger in the down-row direction in both up- and down-states, but the effect was more pronounced in the up-state (Figure 8, right). In summary, the population depolarizing responses at the subthreshold level show greater asymmetry when the network is depolarized: the depolarizing response spreads preferentially along the rows toward higher-numbered arcs.
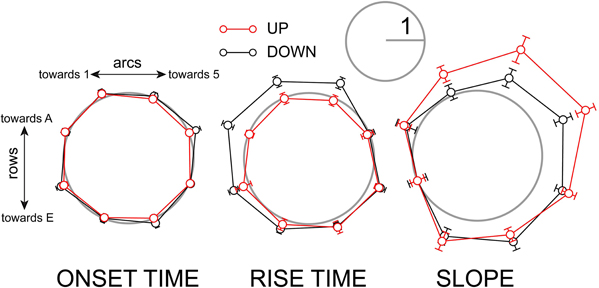
Figure 8. Polarity of depolarizing response timing is accentuated in the up-state. Left: population radial plot of response onset time. Middle: population radial plot of response rise time. Right: population radial plot of response slope. Before averaging, data from individual experiments were normalized to the smaller of the two values on the axis of maximum anisotropy as described in Methods. The gray circles have a radius of 1 on this scale.
Spatial Asymmetry of the Response Hyperpolarization
We next studied how subsequent whisker deflections would be differentially affected by the state of the network. Previous studies have demonstrated strong suppression of whisker responses by a combination of well-known postsynaptic cellular mechanisms (Coombs et al., 1955; Llinas et al., 1974; Simons, 1985; Simons and Carvell, 1989; Holt and Koch, 1997; Moore and Nelson, 1998; Higley and Contreras, 2003, 2005; Civillico and Contreras, 2006). Subtractive effects are due to a reduction in the peak level of a subsequent response due to the lowering of the baseline caused by a preceding response. As shown by the two examples in Figure 9A, whisker responses during the up-state were followed by a sharp hyperpolarization below baseline. We measured this hyperpolarization at 100 ms after a single stimulus and found that it had a consistent spatial pattern across experiments (Figure 9B). It appeared first over the barrel columns corresponding to more ventral whiskers (the D and E row), where it also reached its largest amplitude (see barrel traces in Figure 9A).
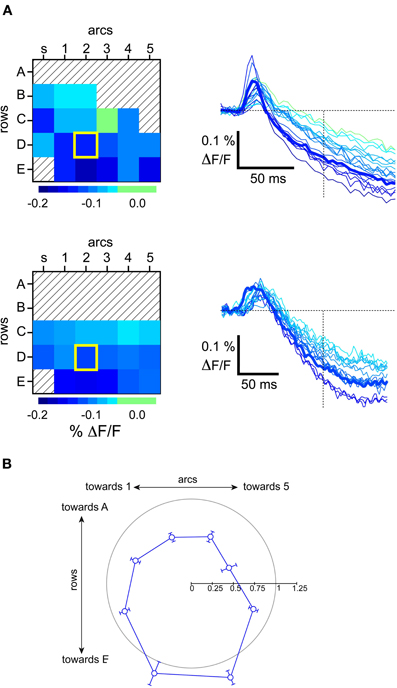
Figure 9. Polarity of hyperpolarizing response observed in the up-state. (A) Examples of barrel-column maps from individual experiments showing the level of hyperpolarizing VSD signal at the indicated time after a stimulus, and the corresponding VSD traces. Principal barrel column corresponding to the deflected whisker is outlined with a thick yellow square. (B) Population average of the direction of inhibition. Angles are measured from the barrel corresponding to the first stimulated whisker. Before averaging, data from individual experiments were normalized to the hyperpolarizing level observerd in the stimulated whisker's barrel-column trace. The gray circle has a radius of 1 on this scale.
This spatial pattern did not appear as so-called “surround inhibition” (Derdikman et al., 2003, their Figure 6), since the wave moved indiscriminately across the stimulated whisker's barrel. In other words, the stimulated whisker's barrel participated in the wave at the same time as its neighbors, rather than after a delay or not at all, as in what is often described as a “surround” response. To demonstrate this, the average values in Figure 9B were normalized to the level of the stimulated whisker's barrel. We note that many values in the surround have normalized values less than 1, indicating that the spatial pattern of inhibition was greater at the center than in many of the surround locations. Thus, whisker deflection-triggered inhibition resembles more a wave than an annulus around the principal barrel. As expected, the hyperpolarizing wave was not observed in the down-state, most likely due to the hyperpolarized membrane potential that characterizes this state (Steriade et al., 1993a,c).
Finally, to measure the effects of network state on input integration, we performed experiments in which a second whisker was deflected 100 ms after the first one. This interstimulus interval produces the strongest whisker-to-whisker suppression (Civillico and Contreras, 2006) and seems equivalent to the 20 ms interval in the anesthetized rat (Simons, 1985; Shimegi et al., 1999, 2000; Higley and Contreras, 2003). We quantified the suppression of the second response by calculating a TR, as the magnitude of the response following the first whisker, divided by the size of the response alone (Figure 10). A complete suppression of the second response gives a TR of 0 while an unchanged second response will result in a TR of 1. Values of TR above 1 indicate response facilitation. Unlike single-cell experiments, these experiments produce values of TR for the entire spatial extent of the barrel field. As in the previous analyses, we binned the barrel field into eight radial quadrants so as to compute averaged TR values as a function of angular position with respect to the second stimulated barrel-column. An example of this analysis for a single experiment is shown in Figure 10A (barrel maps at left, polar plot at right). The origin of the polar plot is the location of the second stimulated whisker's barrel. The angular location of whisker 1 relative to whisker 2 is indicated “w1” and in this example corresponded to 225° (positive angles moving counterclockwise, origin at right). The outer radius of the polar plot corresponds to a TR of 1, indicating no suppression. All angular locations relative to the second stimulated whisker showed some degree of suppression (TR <1) in both the up- and down-states (consistent with our previous study (Civillico and Contreras, 2006) in which trials were not sub-averaged by state). Suppression was greater in the down-state. However, the spatial pattern of suppression shown in the barrel maps (Figure 10A, left and middle columns) was similar in the up- and down-states: suppression was greatest in the part of the barrel field corresponding to the ventral posterior whiskers (arcs 1,2, rows D,E), and decreased in a gradient toward the barrels corresponding to more dorsal and more anterior whiskers. In the example shown the direction of greatest suppression corresponds to the direction of the previously stimulated whisker's barrel. When many angular plots were averaged with the whisker 1 directions aligned (n = 10, Figure 10B, left), suppression was clearly seen to be biased in the direction of whisker 1 (indicated by “w1” and arrow on polar plot). However, when the radial TR plots were rotated and re-averaged to be oriented to the barrel field map (i.e., with w1 directions pointing in their original various directions), the directional bias of suppression, rather than disappearing, became even more pronounced (Figure 10B, right). This indicates that the effect was not entirely caused by the location of the previously stimulated whisker in either up- or down-states, but rather appeared to be yet another intrinsic polarity of the barrel field, possibly related to the row bias observed with the single-whisker responses.
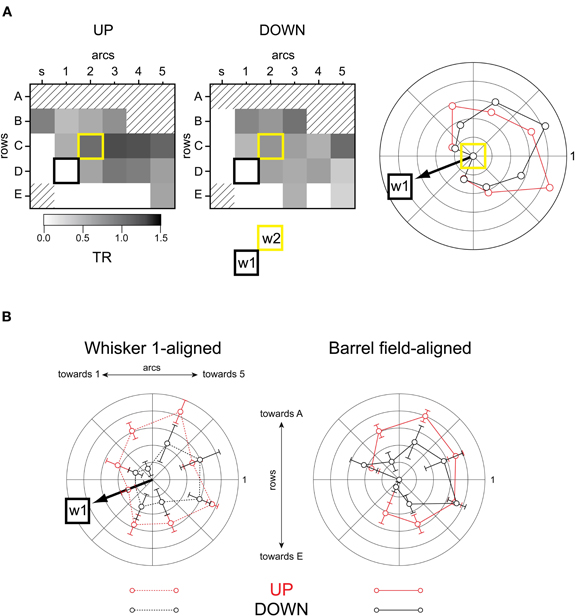
Figure 10. Spatial pattern of suppression.(A) Example experiment. Barrel maps of suppression (TR). First whisker's barrel: black square. Second whisker's barrel: yellow square. Polar plot at right compares angular direction of suppression between up- and down-states. The outer radius of the polar plot corresponds to a TR of 1, indicating no suppression (see Results). (B) Population measurements of suppression by angle (TR). Left: up-state vs down-state, angles aligned to whisker 1. Right: up-state vs down-state, angles aligned to barrel field. The outer radius of the polar plot corresponds to a TR of 1, indicating no suppression (see Results).
Discussion
In this study, we examined the effect of ongoing network activity on the spatiotemporal properties of population responses measured with VSD imaging. We used LFP and MUA recordings in the anesthetized mouse to confirm the presence of two well-defined network states in our preparation and to characterize the phase dependence of the interaction between the sensory stimulus and the ongoing oscillation. We found important variability in the slow oscillation, for which we accounted in our analysis. We observed that down-state stimuli could trigger a transition to the up-state only after the refractory period following each cycle of the oscillation. We excluded responses triggering up-states from the analysis of down-state responses because triggered up-states mainly consist of self-generated recurrent cortical activity. After classifying VSD trials by state using the simultaneous LFP recordings, we compared the spatiotemporal properties of the sensory responses and their interactions across the entire barrel field between up- and down-states.
In the up-state, whisker deflections triggered a distributed depolarization which was smaller in amplitude and area than that observed in the down-state, but nonetheless involved most of the barrel field. The spatial distribution of whisker-driven excitation during the up-state was characterized by (1) fewer barrel columns, (2) lower response density (smaller number of pixels per responding barrel column) and (3) asymmetrical amplitude distribution across the barrel field with higher response amplitude along the row-axis toward higher numbered arcs, with no matching change in response density. Although fewer columns showed high-amplitude responses in the up-state, using barrel-column averaged VSD signals we found that most columns participated in the responses in both states. As expected, this meant that we observed little change in number of participating columns when comparing one and two-whisker responses. In the up-state, but not in the down-state, response depolarization was followed by a spatially distributed hyperpolarizing response, which propagated along the arc-axis, preferentially toward the A row. Finally, we examined the state-dependence of the extensively studied phenomenon of cross-whisker suppression. At a 100 ms deflection interval, we found that suppression showed an asymmetry similar to that of the up-state depolarizing response which was apparently independent of the relative locations of stimulated whiskers. This asymmetry was not dependent on network state.
The Slow Oscillation
The dynamic cellular relationships in cortex and thalamus during the slow oscillation have been extensively characterized with single and dual intracellular recordings in vivo (Steriade et al., 1993a; Amzica and Steriade, 1995; Contreras and Steriade, 1995; Contreras et al., 1996) and in cortical (Sanchez-Vives and McCormick, 2000) and thalamic (Blethyn et al., 2006) slices in vitro. It is known that in the up-state most cortical and thalamic cells are depolarized by ∼10–20 mV relative to the down-state, that they receive barrages of synaptic input in which excitatory and inhibitory drive are balanced (Compte et al., 2003; Shu et al., 2003a; Haider et al., 2006), and that the power in the gamma band (20–50 Hz) of intracellular Vm and extracellularly recorded LFP activity is increased (Steriade et al., 1996). This high-frequency activity is synchronous only over short distances (Steriade and Amzica, 1996), in contrast to the long-range synchrony of the slow oscillations (Amzica and Steriade, 1995; Destexhe et al., 1999). Both experimental and modeling studies have shown that the input resistance of cortical cells is lowered by the increased synaptic drive during depolarized states (Destexhe et al., 2003; Shu et al., 2003b; Sachdev et al., 2004 but see Waters and Helmchen, 2006).
The Slow Oscillation and Evoked Responses
The effect on evoked responses of ongoing transitions between up- and down-states has been studied with intracellular and whole-cell patch recordings and has led to conflicting results. Single cell responses to electrical stimulation in cat motor cortex (Timofeev et al., 1996; Rosanova and Timofeev, 2005), to visual stimulation in cat visual cortex (Azouz and Gray, 1999) and to electrical stimulation of white matter in slices in vitro (Shu et al., 2003b) have shown a higher spike output probability during up-states compared to down-states. Conversely, responses to whisker deflection in mouse (Petersen et al., 2003b) and rat (Sachdev et al., 2004; Hasenstaub et al., 2007) barrel cortex have shown a decreased firing probability. While depolarization during the up-state brings neurons closer to firing threshold, seemingly increasing the probability of spike firing, decreases in input resistance and increases in spike threshold (Sachdev et al., 2004) have the opposite effect, decreasing spike probability; thus, the issue remains unresolved. Sensory responsiveness of single cells has also been studied in the activated state that results from brainstem electrical stimulation (Timofeev et al., 1996; Castro-Alamancos, 2004; Aguilar and Castro-Alamancos, 2005). In this activated state, cortical cells are even more depolarized than during the up-state of the slow oscillation, and the decrease in input resistance caused by the barrage of synaptic input may be partially counterbalanced by an increase in input resistance resulting from the closing of potassium channels by muscarinic action of acetylcholine (Curro Dossi et al., 1991; Steriade et al., 1991; McCormick, 1992).
We observed that some down-state sensory responses appeared to trigger an up-state transition and demonstrated that this was in fact the case. For this analysis we assumed no causal link between sensory stimuli and state transitions, and simply quantified various interval lengths. Because of the variability across preparations, it was necessary to use normalized interval lengths (Figure 2D). We observed that, in a given preparation, considering all LFPs aligned on up-to-down transitions, as time moves forward the first events encountered are stimuli which are not associated with a down-to-up transition; these are followed later in time by stimuli which are associated with a down-to-up transition; and finally these are followed in time by spontaneous down-to-up transitions. In other words, with reference to the examples depicted in Figure 2C, the “green” intervals in a given preparation were consistently shorter than the “blue” intervals, which in turn were consistently shorter than the “red” intervals. Our interpretation of this is as follows: during a down-state, an underlying time-dependent process proceeds which will eventually result in the next up-state. When this process has reached a certain point, it can be accelerated by a sensory stimulus. When the process reaches a certain further point, even in the absence of a stimulus, the up-state will occur spontaneously. Such a process has been shown in detail in slices of entorhinal cortex and further confirmed by a large scale network model (Cunningham et al., 2006).
State Dependence: Depolarizing Responses
The responses during down-states were larger in amplitude and spatial extent than those during up-states. However, the responses during up-states were not limited to the activated barrel and spread over the majority of the barrel field. This result is in contrast with a previous VSD study in vivo comparing whisker responses during up- and down-states under anesthesia, in which responses during up-states did not spread and remained confined within the principal barrel (Petersen et al., 2003b). The large area of the whisker-evoked depolarization during up-states that we report here was nevertheless significantly smaller than during down-states. More importantly, the depolarizing responses during up-states were much sparser than during down-states, i.e., fewer pixels responded within each barrel column. Because the density of active pixels was higher in the principal barrel, it is likely that the use of strong spatial filtering may create an image of responses confined to the principal barrel. We also note the possibility that our single-trial responses may have been tightly focused in variable locations, resulting in an apparent sparse and distributed response in the multitrial average. The results obtained with other methods in this system including intracellular recordings (Moore and Nelson, 1998), and current source density probes (Roy et al., 2011) would seem to contradict this possibility, however.
An important methodological difference between our results and the study of Petersen et al. (2003b) is our separation of responses during down-states according to whether an up-state was triggered or not. Our data show that triggered up-states will slowly and consistently propagate throughout the barrel cortex creating a long-lasting response (see Figure 4) with sustained neuronal discharge (see Figure 3). In contrast, responses during down-states (that do not trigger an up-state), although similarly widespread in space, are more transient in time. This is an important distinction because the transitions between up- and down-states are all-or-none and involve recurrent activity that is independent of the response to the whisker deflection. Thus, the most informative basis for comparison with the responses during the up-state is provided by the subset of down-state responses which are not associated with an up-state transition (see Figure 4 for a comparison of the three types of responses).
A recent VSD imaging study in the mouse in vivo (Ferezou et al., 2006) extended our understanding of the state-dependence of sensory responses by including recordings during states of quiet waking and active exploration. Using a combination of VSD imaging and whole cell recording in mouse in vivo, the study of Ferezou et al. (2006) showed that, surprisingly, responses to a passive whisker deflection were longer-lasting and more spatially widespread during quiet waking than during isoflurane anesthesia (∼90 ms vs ∼40 ms on average). Furthermore, the same widespread pattern of activation was observed during active exploration only when the whisker deflection was caused by self-generated movement. In contrast, small passive deflections during active exploration triggered spatially restricted responses. In the 2006 study, Ferezou et al. did not distinguish up- and down-states during anesthesia; however, we note that isoflurane is less often associated with clear slow oscillations. Furthermore, the most important finding of that study was the widespread depolarization observed in whisker responses during active exploration. This corresponds well with the widespread distribution which we observed during up-states and strongly suggests that up-states bear some similarity to the active waking state.
In agreement with the Ferezou et al. (2006) study discussed above, extracellular studies in chronically implanted rats performing a discrimination task (Krupa et al., 2004) showed that the spike output due to active whisking during discrimination is prolonged (over 200 ms in all cortical layers) compared with the few millisecond brief discharges caused by a passive whisker deflection presented during the task when the rat is not moving its whiskers. However, in contrast with VSD results (Petersen et al., 2003a,b; Ferezou et al., 2006; our results) brief responses to passive whisker stimulation were similar to those obtained during anesthesia (Krupa et al., 2004). Discounting possible species differences (rat vs. mouse), these apparent discrepancies could be simply due to the fact that the VSD signal reflects subthreshold depolarization and does not provide information about which areas of cortex are actually spiking and for how long. Therefore, the studies of single neurons, together with the VSD results discussed above and our own results shown here and elsewhere (Civillico and Contreras, 2005, 2006), demonstrate that, regardless of brain state, sensory-driven spiking is superimposed on a larger basin of subthreshold depolarization. Studies using combinations of extracellular spike recordings over large areas of barrel cortex are necessary to fully understand the dynamic spatiotemporal transformation between synaptic inputs and intrinsic dendritic depolarization on one hand and spike output on the other.
An earlier study of state dependence of visual responses using VSDs in the anesthetized cat primary visual cortex (Arieli et al., 1996) found that most of the trial-to-trial variability was due to the initial state, which was defined as a single 3.5 ms frame of the optical recording, and that a “template” average response added to the initial state provided a good prediction of the whole response in each trial. Therefore, that study showed that if the sensory response is small enough the spatiotemporal dynamics of the brain is entirely dominated by the large fluctuations caused by anesthesia.
State Dependence: Hyperpolarizing Responses
There is a remarkable correspondence between the barrel-column-averaged VSD signals in the up- and down-states described here, and the averaged intracellular PSPs recorded at corresponding resting potentials in the supragranular and granular layers of rat barrel cortex (Wilent and Contreras, 2004, their Figures 5 and 8). This is expected given that the resting potential of all cortical cells is depolarized by 10–20 mV in the up-state (Steriade et al., 1993a). Derdikman et al. (2003) reported a hyperpolarizing response following a depolarizing response to whisker deflection and attributed this observation to the use of the blue dye RH1692. Contrary to their interpretation, we associate the same observation with the depolarization of cortical cells in the up-state. The shift to more depolarized Vms decreases the driving force for excitatory inputs and increases the driving force for inhibitory inputs. Thus, we suggest that the presence of the hyperpolarizing “tail” in the VSD signal is dependent on the depolarization of cortical cells, and therefore on the Vm during the up- or down-state (or the general level of anesthesia in a less bistable state). Sachdev et al. (2004) demonstrated these changes in driving force using intracellular recordings, and we have characterized the population spatiotemporal effect on the supragranular network in the present work. Furthermore, we did not observe that the presence of hyperpolarization was associated with the nature of the stimulus, since it was observed in response to both piezoelectric whisker deflections, as well as deflections of single whiskers with directed air puffs. Thus visualization of hyperpolarization did and does not require the use of an RH169x dye, but simply that the preparation be in the right state, as determined during the experiment by concurrent LFP recordings.
An open question of great importance and related to the above discussion is whether such strong and widespread hyperpolarization occurs in the active whisking animal since the discharges of single neurons in all layers are very prolonged (>200 ms, Krupa et al., 2004) and the available VSD studies during active whisking did not report hyperpolarizing responses (Ferezou et al., 2006).
Distributed Representation of Sensory Responses
Responses during up-states had a smaller depolarizing footprint despite the fact that neurons were presumably closer to spiking threshold. If the spread of activation depends only on spike probability, defined as proximity to spike threshold, it is reasonable to predict a much more widespread activation during the up-state. Since the issue of neuronal responsiveness during up-states is not resolved (see above), we suggest that the large inhibition that accompanies responses in the up-state plays an important role in shaping the spatiotemporal properties of whisker responses.
Our data showing a large spread of responses during up-states agrees with the widespread activation recorded with VSDs in rodent barrel cortex under isoflurane anesthesia, during quiet waking and during active exploration (Ferezou et al., 2006, 2007). The observation that, even during active tactile exploration, sensory responses initiate in the corresponding principal barrel and then spread over large portions of the barrel cortex (Ferezou et al., 2006) is key to the concept that the information carried by whisker deflections is highly distributed and represented by complex spatiotemporal patterns of activation. How these distributed spatiotemporal patterns in cortical layers 2/3 are decoded into meaningful images of the world is a fundamental open question in neuroscience.
The first mapping of sensory responses in mammalian neocortex using VSDs was done in rat somatosensory and visual cortex and showed widespread activation throughout the cortex in response to small stimuli (Orbach et al., 1985). Noticeably, in that study, responses to two distant whiskers were clearly segregated on the surface of the barrel cortex as recorded by the photodiode array, but responses in visual cortex spread over the entire imaged area. Large spread of activation by small stimuli was subsequently shown using VSDs in the monkey primary visual cortex (Grinvald et al., 1994). In the primary visual cortex of the cat, waves of supra and subthreshold activity are evoked by local visual stimuli (Bringuier et al., 1999; Jancke et al., 2004; Benucci et al., 2007) and full screen drifting gratings generate widespread responses that contain information about both specific and non-specific properties of the stimulus (Sharon and Grinvald, 2002). A recent VSD study in cat V1 (Sharon et al., 2007) showed that the response to small drifting gratings of varying orientation consisted of a large activated area, the cortical response field, characterized by an orientation-independent plateau of activity on top of which one to three orientation-dependent peaks of activity emerged. Importantly, spiking activity was only observed at the peaks of activation. Furthermore, such results have been extended to the orientation domain (Chavane et al., 2011). Thus, in the visual system, as in barrel cortex, sparse and distributed firing is superimposed on a widespread basin of depolarization. Furthermore, as in the present study, a large area of cortex is “biased” in its integrative properties due to the presence of this large subthreshold plateau of depolarization.
In visual cortex, imaging studies with intrinsic signals (Grinvald et al., 1986) or VSDs (Bonhoeffer and Grinvald, 1991; Bonhoeffer et al., 1995; Maldonado et al., 1997) revealed several superimposed maps including retinotopy, orientation, and spatial frequency selectivity. In contrast, imaging studies in barrel cortex have only focused on the spatial location of the stimulus; stimulus properties such as direction or frequency of whisker deflection have not been systematically studied. However, extracellular studies in rat barrel cortex have provided some evidence for the existence of such maps, although the spatial resolution of the resulting maps is a function of the number of cells in the study and is inherently low even with a large number of recordings. One study suggested the presence of direction-selective vertical domains within each barrel akin to orientation columns in visual cortex (Andermann and Moore, 2006), while another study provided evidence of a putative map of frequency preference with isofrequency columns extending along the representation of arcs (Andermann et al., 2004). In the auditory system, the very existence of tonotopic maps is a matter of debate (reviewed in Schreiner and Winer, 2007).
The distributed nature of responses to sensory stimuli complements the observed broad tuning of individual neurons to stimulus properties such as location. Together, these two classes of observations imply that large numbers of neurons respond to many stimulus parameters. However, response properties vary with cell type and laminar location, two parameters not accessible to VSD imaging. Therefore, generating models of information encoding by distributed activity which satisfy both optical and single-cell electrophysiological data is a phenomenally complex task.
The large spread of activation is in agreement with the large receptive fields (RFs) of single cells in L2/3 of barrel cortex (Moore and Nelson, 1998; Zhu and Connors, 1999; Kwegyir-Afful et al., 2005; Roy et al., 2011). However, while the widespread propagation of activation in L2/3 is attributed to the long horizontal connections in L2/3 (Laaris et al., 2000; Laaris and Keller, 2002; Petersen et al., 2003a), the large RFs in barrel cortex are in large part due to subthalamic mechanisms (Timofeeva et al., 2004). Thus, lesions of the spinal trigeminal nucleus (pars intermedia) render neurons in the principal nucleus and their targets in VPm monowhisker-responsive. How the RFs of individual cells relate to the spread of subthreshold activation demonstrated with VSDs is unknown and will require extremely difficult experimental studies, if not major advances in experimental technologies and analytical methods.
Pooling Algorithms
A key aspect of our study is that the spatial analysis is based on columnar counts rather than single pixels. We binned pixels over the outline of columns based on L4 cytochrome oxidase staining. Given the sparse yet widespread nature of the response during the up-state, we reasoned that a more accurate description of the response was to count the columns with activity above a significance threshold. In doing so, we emphasize the information carried by individual columns rather than individual cells. Neurons with similar selectivity are generally organized in vertical columns spanning the cortical depth (Rose and Mountcastle, 1954; Mountcastle, 1957, 1997). One appealing solution to the problem of decoding whisker position is the use of pooling of neuronal responses according to spatial and temporal rules (Darian-Smith et al., 1973; Zohary et al., 1994). Using an information-theoretic formalism to analyze single whisker responses recorded from many neurons simultaneously, Panzeri et al. (2003) concluded that pooling can be an effective strategy to decode stimulus location when restricted to individual columns. Pooling conserves all the information conveyed by an intracolumnar neuronal population (Panzeri et al., 2003) with very little redundancy due to the very low firing rates (Petersen et al., 2002) and allows for summation of activity at the postsynaptic target. In this schema, the most relevant attribute of the firing neuron is its columnar location. The present study is the first to provide a quantification of whisker responses based on column counts and demonstrate the largely distributed nature of responses both in up and down-states.
Asymmetries
Excitation in barrel cortex has been shown to propagate preferentially along the rows for both spontaneous and sensory evoked activity, and was observed to be similar during anesthesia and during quiet waking (Petersen et al., 2003a). Here we report an additional asymmetry in the distribution of depolarization present only during the up-state, consisting of a preferential propagation along the rows toward higher numbered arcs. The asymmetry in whisker-evoked response propagation has been attributed to a bias in the large axonal arborizations of L2/3 neurons along the row axis (Petersen et al., 2003b). Such long range intrinsic connections characterize L2/3 in all sensory cortices, including visual (Fisken et al., 1975; Gilbert and Wiesel, 1979; Rockland and Lund, 1982; Martin and Whitteridge, 1984), auditory (Read et al., 2001; Atencio and Schreiner, 2010) and somatosensory (Keller and Carlson, 1999; Lubke and Feldmeyer, 2007). Biases in horizontal connectivity have been shown in visual cortex where they support feature-specific connectivity between distant neurons (Ts'o et al., 1986; Ts'o and Gilbert, 1988). Interestingly, in similarity with our results, in the visual cortex there are also clear asymmetries in the spread of activation caused by a small stimulus. For example, in cat visual cortex the spread of activation is approximately two-fold larger along the axis orthogonal to the ocular dominance columns (Grinvald et al., 1994), though it is important to note that this effect may originate from anisotropic retinotopy (difference in horizontal and vertical scales), in which case it is not a property of cortical processing per se. The idea that increased inhibition in the up-state could sculpt cortical response properties finds further support in a study (Wörgötter et al., 1998) which found sharper RFs in cat V1 during desynchronized EEG epochs, analogous to the up-state of the slow oscillation.
Because the resting level of cells in the up-state is likely to be closer to that in the awake animal, we suggest that the polarities in signal propagation which we observe in the up-state could play a computational role in the behaving animal. We propose that such consistent asymmetry could participate in the processing of whisker-evoked activity by introducing a bias toward the smaller whiskers at the front of the snout. Our results demonstrate the critical importance of ongoing network activity on the dynamics of sensory responses and their integration. Finally, similarly to the asymmetric suppression shown in our results, in cat visual cortex VSD imaging has shown that suppression by surround stimuli is stronger for stimuli with matched orientation than for those with orthogonal orientation (Grinvald et al., 1994). The functional significance of such asymmetries for higher-level processing remains largely unknown.
Conflict of Interest Statement
The authors declare that the research was conducted in the absence of any commercial or financial relationships that could be construed as a potential conflict of interest.
Acknowledgments
The authors are grateful to Esther Garcia de Yebenes for histology, and to members of the Contreras lab for helpful discussions. This work was funded by NIH Conte Center grant P50-MH-064045 and R01 EY020765, and by The Human Frontier Science Program Organization and the David and Lucille Packard Foundation.
References
Aguilar, J. R., and Castro-Alamancos, M. A. (2005). Spatiotemporal gating of sensory inputs in thalamus during quiescent and activated states. J. Neurosci. 25, 10990–11002.
Aksay, E., Major, G., Goldman, M. S., Baker, R., Seung, H. S., and Tank, D. W. (2003). History dependence of rate covariation between neurons during persistent activity in an oculomotor integrator. Cereb. Cortex 13, 1173–1184.
Amzica, F., and Steriade, M. (1995). Short- and long-range neuronal synchronization of the slow (<1 Hz) cortical oscillation. J. Neurophysiol. 73, 20–38.
Andermann, M. L., and Moore, C. I. (2006). A somatotopic map of vibrissa motion direction within a barrel column. Nat. Neurosci. 9, 543–551.
Andermann, M. L., Ritt, J., Neimark, M. A., and Moore, C. I. (2004). Neural correlates of vibrissa resonance; band-pass and somatotopic representation of high-frequency stimuli. Neuron 42, 451–463.
Arieli, A., Sterkin, A., Grinvald, A., and Aertsen, A. (1996). Dynamics of ongoing activity: explanation of the large variability in evoked cortical responses. Science 273, 1868–1871.
Atencio, C. A., and Schreiner, C. E. (2010). Columnar connectivity and laminar processing in cat primary auditory cortex. PloS One 5:e9521. doi: 10.1371/journal.pone.0009521
Azouz, R., and Gray, C. M. (1999). Cellular mechanisms contributing to response variability of cortical neurons in vivo. J. Neurosci. 19, 2209–2223.
Benucci, A., Frazor, R. A., and Carandini, M. (2007). Standing waves and traveling waves distinguish two circuits in visual cortex. Neuron 55, 103–117.
Blethyn, K. L., Hughes, S. W., Toth, T. I., Cope, D. W., and Crunelli, V. (2006). Neuronal basis of the slow (<1 Hz) oscillation in neurons of the nucleus reticularis thalami in vitro. J. Neurosci. 26, 2474–2486.
Bonhoeffer, T., and Grinvald, A. (1991). Iso-orientation domains in cat visual cortex are arranged in pinwheel-like patterns. Nature 353, 429–431.
Bonhoeffer, T., Kim, D. S., Malonek, D., Shoham, D., and Grinvald, A. (1995). Optical imaging of the layout of functional domains in area 17 and across the area 17/18 border in cat visual cortex. Eur. J. Neurosci. 7, 1973–1988.
Brazier, M. A. B. (1961). A History of the Electrical Activity of the Brain; the First Half-Century. New York, NY: MacMillan.
Bringuier, V., Chavane, F., Glaeser, L., and Fregnac, Y. (1999). Horizontal propagation of visual activity in the synaptic integration field of area 17 neurons. Science 283, 695–699.
Brumberg, J. C., Pinto, D. J., and Simons, D. J. (1996). Spatial gradients and inhibitory summation in the rat whisker barrel system. J. Neurophysiol. 76, 130–140.
Carvell, G. E., and Simons, D. J. (1988). Membrane potential changes in rat SmI cortical neurons evoked by controlled stimulation of mystacial vibrissae. Brain Res. 448, 186–191.
Castro-Alamancos, M. A. (2004). Dynamics of sensory thalamo- cortical synaptic networks during information processing states. Prog Neurobiol. 74, 213–247.
Chavane, F., Sharon, D., Jancke, D., Marre, O., Fregnac, Y., and Grinvald, A. (2011). Lateral spread of orientation selectivity in V1 is controlled by intracortical cooperativity. Front. Syst. Neurosci. 5:4. doi: 10.3389/fnsys.2011.00004
Civillico, E. F., and Contreras, D. (2005). Comparison of responses to electrical stimulation and whisker deflection using two different voltage-sensitive dyes in mouse barrel cortex in vivo. J. Membrane Biol 208, 171–182.
Civillico, E. F., and Contreras, D. (2006). Integration of evoked responses in supragranular cortex studied with optical recordings in vivo. J. Neurophysiol. 96, 336–351.
Cohen, L. B., and Salzberg, B. M. (1978). Optical measurement of membrane potential. Rev. Physiol. Biochem. Pharmacol. 83, 35–88.
Cohen, L. B., Salzberg, B. M., and Grinvald, A. (1978). Optical methods for monitoring neuron activity. Annu. Rev. Neurosci. 1, 171–182.
Compte, A., Sanchez-Vives, M. V., McCormick, D. A., and Wang, X. J. (2003). Cellular and network mechanisms of slow oscillatory activity (<1 Hz) and wave propagations in a cortical network model. J. Neurophysiol. 89, 2707–2725.
Contreras, D., and Steriade, M. (1995). Cellular basis of EEG slow rhythms: a study of dynamic corticothalamic relationships. J. Neurosci. 15, 604–622.
Contreras, D., and Llinas, R. (2001). Voltage-sensitive dye imaging of neocortical spatiotemporal dynamics to afferent activation frequency. J. Neurosci. 21, 9403–9413.
Contreras, D., Timofeev, I., and Steriade, M. (1996). Mechanisms of long-lasting hyperpolarizations underlying slow sleep oscillations in cat corticothalamic networks. J. Physiol. 494(Pt 1), 251–264.
Coombs, J. S., Eccles, J. C., and Fatt, P. (1955). The electrical properties of the motoneurone membrane. J. Physiol. 130, 291–325.
Cunningham, M. O., Pervouchine, D. D., Racca, C., Kopell, N. J., Davies, C. H., Jones, R. S. G., Traub, R. D., and Whittington, M. A. (2006). Neuronal metabolism governs cortical network response state. Proc. Natl. Acad. Sci. U.S.A. 103, 5597–5601.
Curro Dossi, R., Pare, D., and Steriade, M. (1991). Short-lasting nicotinic and long-lasting muscarinic depolarizing responses of thalamocortical neurons to stimulation of mesopontine cholinergic nuclei. J. Neurophysiol. 65, 393–406.
Darian-Smith, I., Johnson, K. O., and Dykes, R. (1973). “Cold” fiber population innervating palmar and digital skin of the monkey: responses to cooling pulses. J. Neurophysiol. 36, 325–346.
DeFelipe, J., and Jones, E. G. (2010). “Neocortical microcircuits,” in Handbook of Brain Microcircuits eds G. M. Sheperd and S. Grillner (New York, NY: Oxford University Press, Inc), 5–14.
Derdikman, D., Hildesheim, R., Ahissar, E., Arieli, A., and Grinvald, A. (2003). Imaging spatiotemporal dynamics of surround inhibition in the barrels somatosensory cortex. J. Neurosci. 23, 3100–3105.
Destexhe, A., Contreras, D., and Steriade, M. (1999). Spatiotemporal analysis of local field potentials and unit discharges in cat cerebral cortex during natural wake and sleep states. J. Neurosci. 19, 4595–4608.
Destexhe, A., Rudolph, M., and Pare, D. (2003). The high-conductance state of neocortical neurons in vivo. Nat. Rev. Neurosci. 4, 739–751.
Devor, A., Dunn, A. K., Andermann, M. L., Ulbert, I., Boas, D. A., and Dale, A. M. (2003). Coupling of total hemoglobin concentration, oxygenation, and neural activity in rat somatosensory cortex. Neuron 39, 353–359.
Douglas, R., Markram, H., and Martin, K. (2004). “Neocortex,” in The Synaptic Organization of the Brain, 5th edn, ed G. M. Sheperd (New York, NY: Oxford University Press, Inc), 499–558.
Ego-Stengel, V., Melloe Souza, T., Jacob, V., and Shulz, D. E. (2005). Spatiotemporal characteristics of neuronal sensory integration in the barrel cortex of the rat. J. Neurophysiol. 93, 1450–1467.
Ferezou, I., Bolea, S., and Petersen, C. C. (2006). Visualizing the cortical representation of whisker touch: voltage-sensitive dye imaging in freely moving mice. Neuron 50, 617–629.
Ferezou, I., Haiss, F., Gentet, L. J., Aronoff, R., Weber, B., and Petersen, C. C. (2007). Spatiotemporal dynamics of cortical sensorimotor integration in behaving mice. Neuron 56, 907–923.
Fisken, R. A., Garey, L. J., and Powell, T. P. (1975). The intrinsic, association and commissural connections of area 17 on the visual cortex. Philos. Trans. R. Soc. Lond. B Biol. Sci. 272, 487–536.
Frostig, R. D., Lieke, E. E., Ts’o, D. Y., and Grinvald, A. (1990). Cortical functional architecture and local coupling between neuronal activity and the microcirculation revealed by in vivo high-resolution optical imaging of intrinsic signals. Proc. Natl. Acad. Sci. U.S.A. 87, 6082–6086.
Gilbert, C. D., and Wiesel, T. N. (1979). Morphology and intracortical projections of functionally characterised neurones in the cat visual cortex. Nature 280, 120–125.
Grinvald, A., Lieke, E. E., Frostig, R. D., and Hildesheim, R. (1994). Cortical point-spread function and long-range lateral interactions revealed by real-time optical imaging of macaque monkey primary visual cortex. J. Neurosci. 14, 2545–2568.
Grinvald, A., Lieke, E., Frostig, R. D., Gilbert, C. D., and Wiesel, T. N. (1986). Functional architecture of cortex revealed by optical imaging of intrinsic signals. Nature 324, 361–364.
Haider, B., Duque, A., Hasenstaub, A. R., and McCormick, D. A. (2006). Neocortical network activity in vivo is generated through a dynamic balance of excitation and inhibition. J. Neurosci. 26, 4535–4545.
Hasenstaub, A., Sachdev, R. N., and McCormick, D. A. (2007). State changes rapidly modulate cortical neuronal responsiveness. J. Neurosci. 27, 9607–9622.
Higley, M. J., and Contreras, D. (2003). Nonlinear integration of sensory responses in the rat barrel cortex: an intracellular study in vivo. J. Neurosci. 23, 10190–10200.
Higley, M. J., and Contreras, D. (2005). Integration of synaptic responses to neighboring whiskers in rat barrel cortex in vivo. J. Neurophysiol. 93, 1920–1934.
Hirata, A., and Castro-Alamancos, M. A. (2011). Effects of cortical activation on sensory responses in barrel cortex. J. Neurophysiol. 105, 1495–1505.
Holt, G. R., and Koch, C. (1997). Shunting inhibition does not have a divisive effect on firing rates. Neural Comput. 9, 1001–1013.
Jancke, D., Chavane, F., Naaman, S., and Grinvald, A. (2004). Imaging cortical correlates of illusion in early visual cortex. Nature 428, 423–426.
Keller, A., and Carlson, G. C. (1999). Neonatal whisker clipping alters intracortical, but not thalamocortical projections, in rat barrel cortex. J. Comp. Neurol. 412, 83–94.
Kim, D. S., Duong, T. Q., and Kim, S. G. (2000). High-resolution mapping of iso-orientation columns by fMRI. Nat. Neurosci. 3, 164–169.
Kleinfeld, D., and Delaney, K. R. (1996). Distributed representation of vibrissa movement in the upper layers of somatosensory cortex revealed with voltage-sensitive dyes. J. Comp. Neurol. 375, 89–108.
Konnerth, A., Obaid, A. L., and Salzberg, B. M. (1987). Optical recording of electrical activity from parallel fibres and other cell types in skate cerebellar slices in vitro. J. Physiol. 393, 681–702.
Krupa, D. J., Wiest, M. C., Shuler, M. G., Laubach, M., and Nicolelis, M. A. (2004). Layer-specific somatosensory cortical activation during active tactile discrimination. Science 304, 1989–1992.
Kwegyir-Afful, E. E., Bruno, R. M., Simons, D. J., and Keller, A. (2005). The role of thalamic inputs in surround receptive fields of barrel neurons. J. Neurosci. 25, 5926–5934.
Laaris, N., Carlson, G. C., and Keller, A. (2000). Thalamic-evoked synaptic interactions in barrel cortex revealed by optical imaging. J. Neurosci. 20, 1529–1537.
Laaris, N., and Keller, A. (2002). Functional independence of layer IV barrels. J. Neurophysiol. 87, 1028–1034.
Llinas, R., Baker, R., and Precht, W. (1974). Blockage of inhibition by ammonium acetate action on chloride pump in cat trochlear motoneurons. J. Neurophysiol. 37, 522–532.
Lubke, J., and Feldmeyer, D. (2007). Excitatory signal flow and connectivity in a cortical column: focus on barrel cortex. Brain Struct. Funct. 212, 3–17.
Major, G., and Tank, D. (2004). Persistent neural activity: prevalence and mechanisms. Curr. Opin. Neurobiol. 14, 675–684.
Maldonado, P. E., Godecke, I., Gray, C. M., and Bonhoeffer, T. (1997). Orientation selectivity in pinwheel centers in cat striate cortex. Science 276, 1551–1555.
Martin, K. A., and Whitteridge, D. (1984). Form, function and intracortical projections of spiny neurones in the striate visual cortex of the cat. J. Physiol. 353, 463–504.
McCormick, D. A. (1992). Neurotransmitter actions in the thalamus and cerebral cortex and their role in neuromodulation of thalamocortical activity. Prog. Neurobiol. 39, 337–388.
Moore, C. I., and Nelson, S. B. (1998). Spatio-temporal subthreshold receptive fields in the vibrissa representation of rat primary somatosensory cortex. J. Neurophysiol. 80, 2882–2892.
Mountcastle, V. B. (1957). Modality and topographic properties of single neurons of cat's somatic sensory cortex. J. Neurophysiol. 20, 408–434.
Obaid, A. L., Loew, L. M., Wuskell, J. P., and Salzberg, B. M. (2004). Novel naphthylstyryl-pyridium potentiometric dyes offer advantages for neural network analysis. J. Neurosci. Methods 134, 179–190.
Orbach, H. S., Cohen, L. B., and Grinvald, A. (1985). Optical mapping of electrical activity in rat somatosensory and visual cortex. J. Neurosci. 5, 1886–1895.
Panzeri, S., Petroni, F., Petersen, R. S., and Diamond, M. E. (2003). Decoding neuronal population activity in rat somatosensory cortex: role of columnar organization. Cereb. Cortex 13, 45–52.
Petersen, C. C., and Sakmann, B. (2001). Functionally independent columns of rat somatosensory barrel cortex revealed with voltage-sensitive dye imaging. J. Neurosci. 21, 8435–8446.
Petersen, C. C., Grinvald, A., and Sakmann, B. (2003a). Spatiotemporal dynamics of sensory responses in layer 2/3 of rat barrel cortex measured in vivo by voltage-sensitive dye imaging combined with whole-cell voltage recordings and neuron reconstructions. J. Neurosci. 23, 1298–1309.
Petersen, C. C., Hahn, T. T., Mehta, M., Grinvald, A., and Sakmann, B. (2003b). Interaction of sensory responses with spontaneous depolarization in layer 2/3 barrel cortex. Proc. Natl. Acad. Sci. U.S.A. 100, 13638–13643.
Petersen, R. S., Panzeri, S., and Diamond, M. E. (2002). Population coding in somatosensory cortex. Curr. Opin. Neurobiol. 12, 441–447.
Poulet, J. F., and Petersen, C. C. (2008). Internal brain state regulates membrane potential synchrony in barrel cortex of behaving mice. Nature 454, 881–885.
Read, H. L., Winer, J. A., and Schreiner, C. E. (2001). Modular organization of intrinsic connections associated with spectral tuning in cat auditory cortex. Proc. Natl. Acad. Sci. U.S.A. 98, 8042–8047.
Rockland, K. S., and Lund, J. S. (1982). Widespread periodic intrinsic connections in the tree shrew visual cortex. Science 215, 1532–1534.
Rosanova, M., and Timofeev, I. (2005). Neuronal mechanisms mediating the variability of somatosensory evoked potentials during sleep oscillations in cats. J. Physiol. 562, 569–582.
Rose, J. E., and Mountcastle, V. B. (1954). Activity of single neurons in the tactile thalamic region of the cat in response to a transient peripheral stimulus. Bull. Johns Hopkins Hosp. 94, 238–282.
Roy, N. C., Bessaih, T., and Contreras, D. (2011). Comprehensive mapping of whisker-evoked responses reveals broad, sharply tuned thalamocortical input to layer 4 of barrel cortex. J. Neurophysiol. 105, 2421–2437.
Sachdev, R. N., Ebner, F. F., and Wilson, C. J. (2004). Effect of subthreshold up and down states on the whisker-evoked response in somatosensory cortex. J. Neurophysiol. 92, 3511–3521.
Salzberg, B. M. (1989). Optical recording of voltage changes in nerve terminals and in fine neuronal processes. Annu. Rev. Physiol. 51, 507–526.
Sanchez-Vives, M. V., and McCormick, D. A. (2000). Cellular and network mechanisms of rhythmic recurrent activity in neocortex. Nat. Neurosci. 3, 1027–1034.
Schreiner, C. E., and Winer, J. A. (2007). Auditory cortex mapmaking: principles, projections, and plasticity. Neuron 56, 356–365.
Sharon, D., and Grinvald, A. (2002). Dynamics and constancy in cortical spatiotemporal patterns of orientation processing. Science 295, 512–515.
Sharon, D., Jancke, D., Chavane, F., Na’aman, S., and Grinvald, A. (2007). Cortical response field dynamics in cat visual cortex. Cereb. Cortex 17, 2866–2877.
Shimegi, S., Ichikawa, T., Akasaki, T., and Sato, H. (1999). Temporal characteristics of response integration evoked by multiple whisker stimulations in the barrel cortex of rats. J. Neurosci. 19, 10164–10175.
Shimegi, S., Akasaki, T., Ichikawa, T., and Sato, H. (2000). Physiological and anatomical organization of multiwhisker response interactions in the barrel cortex of rats. J. Neurosci. 20, 6241–6248.
Shoham, D., Glaser, D. E., Arieli, A., Kenet, T., Wijnbergen, C., Toledo, Y., Hildesheim, R., and Grinvald, A. (1999). Imaging cortical dynamics at high spatial and temporal resolution with novel blue voltage-sensitive dyes. Neuron 24, 791–802.
Shu, Y., Hasenstaub, A., and McCormick, D. A. (2003a). Turning on and off recurrent balanced cortical activity. Nature 423, 288–293.
Shu, Y., Hasenstaub, A., Badoual, M., Bal, T., and McCormick, D. A. (2003b). Barrages of synaptic activity control the gain and sensitivity of cortical neurons. J. Neurosci. 23, 10388–10401.
Simons, D. J. (1983). Multi-whisker stimulation and its effects on vibrissa units in rat SmI barrel cortex. Brain Res. 276, 178–182.
Simons, D. J. (1985). Temporal and spatial integration in the rat SI vibrissa cortex. J. Neurophysiol. 54, 615–635.
Simons, D. J., and Carvell, G. E. (1989). Thalamocortical response transformation in the rat vibrissa/barrel system. J. Neurophysiol. 61, 311–330.
Speckmann, E. J., Elger, C. E., and Gorji, A. (2011). “Neurophysiologic basis of EEG and DC potentials,” in Niedermeyer's Electroencephalography eds D. L. Schomer and F. H. Lopes da Silva (Philadelphia, PA: Lippincott Williams and Wilkins), 17–32.
Steriade, M. (1997). Synchronized activities of coupled oscillators in the cerebral cortex and thalamus at different levels of vigilance [published erratum appears in Cereb. Cortex 1997 Dec 7, 779]. Cereb. Cortex 7, 583–604.
Steriade, M. (2000). Corticothalamic resonance, states of vigilance and mentation. Neuroscience 101, 243–276.
Steriade, M., and Amzica, F. (1996). Intracortical and corticothalamic coherency of fast spontaneous oscillations. Proc. Natl. Acad. Sci. U.S.A. 93, 2533–2538.
Steriade, M., Nunez, A., and Amzica, F. (1993a). A novel slow (<1 Hz) oscillation of neocortical neurons in vivo: depolarizing and hyperpolarizing components. J. Neurosci. 13, 3252–3265.
Steriade, M., NuÑez, A., and Amzica, F. (1993b). Intracellular analysis of relations between the slow (<1 Hz) neocortical oscillation and other sleep rhythms of the electroencephalogram. J. Neurosci. 13, 3266–3283.
Steriade, M., Dossi, R. C., Pare, D., and Oakson, G. (1991). Fast oscillations (20–40 Hz) in thalamocortical systems and their potentiation by mesopontine cholinergic nuclei in the cat. Proc. Natl. Acad. Sci. U.S.A. 88, 4396–4400.
Steriade, M., Contreras, D. Curro Dossi, R., and Nunez, A. (1993c). The slow (<1 Hz) oscillation in reticular thalamic and thalamocortical neurons: scenario of sleep rhythm generation in interacting thalamic and neocortical networks. J. Neurosci. 13, 3284–3299.
Steriade, M., Contreras, D., Amzica, F., and Timofeev, I. (1996). Synchronization of fast (30–40 Hz) spontaneous oscillations in intrathalamic and thalamocortical networks. J. Neurosci. 16, 2788–2808.
Timofeev, I., Contreras, D., and Steriade, M. (1996). Synaptic responsiveness of cortical and thalamic neurones during various phases of slow sleep oscillation in cat. J. Physiol. 494, 265–278.
Timofeeva, E., Lavallee, P., Arsenault, D., and Deschenes, M. (2004). Synthesis of multiwhisker-receptive fields in subcortical stations of the vibrissa system. J. Neurophysiol. 91, 1510–1515.
Ts’o, D. Y., and Gilbert, C. D. (1988). The organization of chromatic and spatial interactions in the primate striate cortex. J. Neurosci. 8, 1712–1727.
Ts’o, D. Y., Gilbert, C. D., and Wiesel, T. N. (1986). Relationships between horizontal interactions and functional architecture in cat striate cortex as revealed by cross-correlation analysis. J. Neurosci. 6, 1160–1170.
Waters, J., and Helmchen, F. (2006). Background synaptic activity is sparse in neocortex. J. Neurosci. 26, 8267–8277.
Webber, R. M., and Stanley, G. B. (2004). Nonlinear encoding of tactile patterns in the barrel cortex. J. Neurophysiol. 91, 2010–2022.
Wilent, W. B., and Contreras, D. (2004). Synaptic responses to whisker deflections in rat barrel cortex as a function of cortical layer and stimulus intensity. J. Neurosci. 24, 3985–3998.
Wörgötter, F., Suder, K., Zhao, Y., Kerscher, N., Eysel, U. T., and Funke, K. (1998). State-dependent receptive field restructuring in the visual cortex. Nature 396, 165–168.
Yuste, R., Tank, D. W., and Kleinfeld, D. (1997). Functional study of the rat cortical microcircuitry with voltage-sensitive dye imaging of neocortical slices. Cereb. Cortex 7, 546–558.
Zhu, J. J., and Connors, B. W. (1999). Intrinsic firing patterns and whisker-evoked synaptic responses of neurons in the rat barrel cortex. J. Neurophysiol. 81, 1171–1183.
Keywords: barrel cortex, mouse, in vivo, voltage sensitive dyes, ongoing activity, spatiotemporal dynamics, network state
Citation: Civillico EF and Contreras D (2012) Spatiotemporal properties of sensory responses in vivo are strongly dependent on network context. Front. Syst. Neurosci. 6:25. doi: 10.3389/fnsys.2012.00025
Received: 27 November 2011; Accepted: 26 March 2012;
Published online: 13 April 2012.
Edited by:
Per E. Roland, Karolinska Institute, SwedenReviewed by:
M. Gustavo Murer, Universidad de Buenos Aires, ArgentinaFrédéric Chavane, Centre National de la Recherche Scientifique, France
Copyright: © 2012 Civillico and Contreras. This is an open-access article distributed under the terms of the Creative Commons Attribution Non Commercial License, which permits non-commercial use, distribution, and reproduction in other forums, provided the original authors and source are credited.
*Correspondence: Diego Contreras, Department of Neuroscience, University of Pennsylvania School of Medicine, 215 Stemmler Hall, Philadelphia, PA 19104-6074, USA. e-mail: diegoc@mail.med.upenn.edu