Antecedent occipital alpha band activity predicts the impact of oculomotor events in perceptual switching
- 1Okanoya Emotional Information Project, Exploratory Research for Advanced Technology, Japan Science and Technology Agency, Wako-shi, Japan
- 2Emotional Information Joint Research Laboratory, RIKEN Brain Science Institute, Wako-shi, Japan
- 3Laboratory for Perceptual Dynamics, Experimental Psychology Unit, Faculty of Psychological and Educational Sciences, KU Leuven, Leuven, Belgium
Oculomotor events such as blinks and saccades transiently interrupt the visual input and, even though this mostly goes undetected, these brief interruptions could still influence the percept. In particular, both blinking and saccades facilitate switching in ambiguous figures such as the Necker cube. To investigate the neural state antecedent to these oculomotor events during the perception of an ambiguous figure, we measured the human scalp electroencephalogram (EEG). When blinking led to perceptual switching, antecedent occipital alpha band activity exhibited a transient increase in amplitude. When a saccade led to switching, a series of transient increases and decreases in amplitude was observed in the antecedent occipital alpha band activity. Our results suggest that the state of occipital alpha band activity predicts the impact of oculomotor events on the percept.
Introduction
Oculomotor behavior such as blinking and saccades are prominent in visual perception. We spontaneously blink our eyes every few seconds. The role of blinking goes beyond merely moistening the eyes; among other things, blinking reflects the deployment of attentional resources. For example, blinking frequency decreases when cognitive demand increases (Veltman and Gaillard, 1998). Also, blinking tends to occur at breakpoints of attention (Nakano et al., 2009; Nakano and Kitazawa, 2010) and may have an active role in the disengagement of attention (Nakano et al., 2013).
Saccadic eye movements occur with a similar intensity; several times per second we spontaneously shift our gaze from one location to the next. Saccades are closely associated with visual attention. For example, the allocation of spatial attention is tightly time-locked to saccade execution (Filali-Sadouk et al., 2010). Neuroimaging studies have shown that attention and saccade planning share common neural substrates in the frontal and parietal areas (Corbetta et al., 1998; Nobre et al., 2000). Attention modulates the content of our percept; when a certain part within the visual input is selectively attended, the corresponding information is enhanced (Chelazzi et al., 2001).
Although both blinking and saccades are tightly associated with attentional processes and cause transient changes in retinal stimulation, we are seldomly aware of this. Sensitivity to visual input normally is actively suppressed during blinking and saccades (Volkmann et al., 1980; Burr et al., 1994; Bristow et al., 2005). The blink and saccadic suppression mechanisms, in combination with the constructive abilities of perception (Koenderink et al., 2012), explain why our visual experience remains continuous across transient interruption of visual input by blinking.
However, recent studies suggested that both blinking and saccades could have an impact on our visual experience. Blinking could, for instance, trigger illusory motion in the Rotating Snakes illusion (Otero-Millan et al., 2012). These authors showed that, besides blinking, also microsaccades led to the perception of illusory motion. Together, these results indicate that oculomotor events sometimes lead to visual transients affecting the percept. Other such effects have been reported in the case of multistable perception. For example, in one of our previous studies, we found that some, but not all, blinking and saccades led to perceptual switching in an ambiguous figure (Nakatani et al., 2011). Perceptual switching is the phenomenon that a percept switches spontaneously between possible interpretations of an ambiguous figure (e.g., Attneave, 1971; Leopold and Logothetis, 1999; Ito et al., 2003; Parker and Krug, 2003; Nakatani and van Leeuwen, 2005, 2006; Nakatani et al., 2011, 2012).
Why is it that some oculomotor events lead to changes in our visual percept, whereas others do not? We propose that the ones that lead to changes are preceded by a shift in visual attention. Attention modulates the content of our percept by selectively enhancing an attended part within the visual input (Chelazzi et al., 2001). We, therefore, expect that attention-related brain signals predict whether oculomotor events have an influence on the percept. With new analyses on previously reported data about oculomotor behavior and the electroencephalogram (EEG) in perceptual switching (Nakatani et al., 2011), we show that preceding occipital alpha band activity predicts the impact on the percept of blinks or saccades.
Materials and Methods
Participants
Six participants (aged 21–34 years) participated in this study. Participants gave their written informed consent to the study. The Research Ethics Committee of the RIKEN had approved our procedures.
Experimental Design
Since some of the results from the present study have been published earlier; here we report only the main characteristics of the design. For further details, see Nakatani et al. (2011). The experiment consisted of two conditions: a perceptual switching condition and a stimulus initiated condition (Nakatani et al., 2011). Each lasted 240 s and both conditions were presented in counterbalanced order within a session. In the perceptual switching condition, a Necker cube (Figure 1) was continuously presented as a white line-drawing, subtending 5° of visual angle, on a black ground. The stimulus was shown at eye-height in a sound proof room with reduced ceiling illumination. Since perceptual switching may fail to occur if participants know only one of the possible interpretations of an ambiguous figure (Rock et al., 1994), in order to assure that all participants started with equal information, they were advised before the experiment that the Necker cube could be seen in two alternative orientations, which are referred to here as “downward” and “upward” orientation. Participants pressed a response button corresponding to the perceived switching direction, i.e., from upward to downward or vice versa. They had been instructed to do so whenever their visual percept of the Necker cube reversed but not when it merely became inconsistent or vague. The stimulus initiated condition was a control condition, which is not relevant for the present paper. Three sessions separated by a break were conducted for each participant.

Figure 1. Necker cube used as visual stimulus in our experiment. The stimulus was presented as a white line-drawing on a black ground. The visual angle of presentation was 5.0°. The stimulus was continuously presented for 240 s.
Measurements of Oculomotor Events and EEG
Oculomotor events (blinks and saccades) were measured with an SR Research Eyelink system in three participants and an SR Research Eyelink 1000 system in the others. Both are video-based eye-tracking systems. As the SR Research Eyelink system was broken halfway during our study, we used the SR Research Eyelink 1000 system for the remaining participants. We presented the stimulus to both eyes, and measured oculomotor events (in particular, blinks and saccades) from the dominant eye.
Simultaneously with oculomotor events, we also measured EEG. Disk-type Ag/AgCl electrodes were placed on O1, O2, P3, Pz, P4, F3, Fz, and F4 recording sites in accordance with the international 10/20 system (Jasper, 1958). When the SR Research Eyelink 1000 system was used for oculomotor events measurement, it was possible to place additional electrodes on C3, Cz, and C4 recording sites. Reference and ground electrodes were placed on left and right ears of each participant, respectively. Vertical and horizontal electrooculogram (EOG) were also recorded. Sampling frequency was 500 Hz.
EEG Analysis
We used independent component analysis (Hyvärinen and Oja, 2000) to reduce oculomotor artifacts in EEG recordings. Using the FastICA algorithm (Hyvärinen and Oja, 1997), we decomposed the EEG and EOG recordings into independent components. We then reconstructed the EEG recordings after we removed components that had larger correlation with vertical or horizontal EOG than with EEG.
In order to analyze EEG in the time-frequency domain, we applied a continuous wavelet transform to EEG. The mother function of the wavelet transform was the complex Gabor function g(t),
where α = 0.5. The size of the mother function was about 5 cycles. Wavelet coefficients of a signal x(t), each channel of EEG, were obtained as follows:
where g(t)* is the complex conjugate of a complex Gabor function, and t and f indicate time and frequency, respectively. We then obtained EEG amplitude |W (t, f)| in the time-frequency domain.
After the continuous wavelet transform, we calculated average waveforms of EEG amplitude that were aligned with oculomotor events of interest for each participant. We used trial average data per participant for the following statistical analyses.
To detect EEG episodes that were associated with oculomotor events preceding perceptual switching (pre-switch oculomotor events), we conducted two types of comparisons. First, we compared average waveforms of EEG amplitude with a baseline amplitude. We defined a separate baseline amplitude for each frequency. The baseline amplitude was the mean amplitude at each frequency calculated from the entire 12 min of EEG recorded from the three experimental sessions. Second, we compared average waveforms of EEG amplitude aligned with pre-switch oculomotor events with average waveforms of EEG amplitude aligned with no-switch oculomotor events. For statistical comparison, we applied the bootstrap resampling method (see below in this section) to the EEG activity that preceded the oculomotor events. To avoid massive multiple comparison, we divided the time-frequency domain into relatively large segments. The size of each segment was 50 ms in width and 1 Hz in height (see Figure 2B) and the amplitude of each segment was defined by the mean amplitude within the segment. When a certain EEG episode was statistically different in amplitude of the average waveform compared to the baseline, we considered that this episode was associated with the oculomotor event of interest. Furthermore, we considered that the episode occurred in relation to a pre-switch oculomotor event when its average waveform in pre-switch oculomoter events was statistically different from that in no-switch oculomotor events.
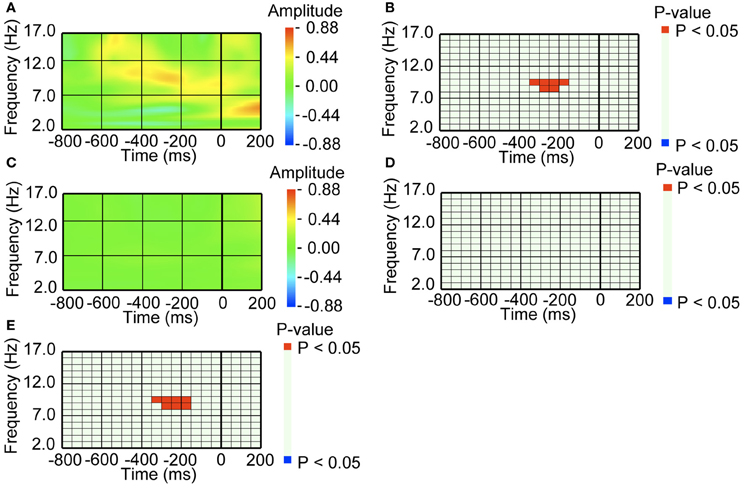
Figure 2. An amplitude increase in occipital alpha band activity preceded blinking, when blinking was followed by perceptual switching. (A) Average waveform of the occipital recordings (O2) aligned with the pre-switch blinkings that were followed by perceptual switching. The amplitude was Z-transformed, and the amplitude zero indicates baseline amplitude. (B) Statistical difference between average waveform aligned with the pre-switch blinkings and baseline amplitude. The colors red and blue denote that amplitude was larger in average waveform or baseline amplitude, respectively (P < 0.05). (C) Average waveform of the occipital recordings (O2) aligned with the no-switch blinkings that were not followed by perceptual switching. The amplitude was Z-transformed, and the amplitude zero indicates baseline amplitude. (D) Statistical difference between average waveform aligned with the no-switch blinkings and baseline amplitude. The colors red and blue denote that amplitude was larger in average waveform or baseline amplitude, respectively (P < 0.05). (E) Statistical difference between average waveform aligned with pre-switch blinks and average waveform aligned with the no-switch blinks. The colors red and blue denote that amplitude was larger in the pre-switch blinking-related average waveform or the no-switch blinking-related average waveform, respectively (P < 0.05).
For graphic representation of average waveforms in the Results section, we used Z-transformed amplitude. We used mean and standard deviation of EEG amplitude calculated from 12 min of whole recordings for Z-transform. As baseline amplitude used for statistical testing was 0 in the Z-transformed amplitude, this makes it easier to observe whether EEG amplitude increased or decreased in relation to oculomotor events of interest. We applied Z-transform to un-averaged EEG amplitude |W (t, f)|. We calculated average waveforms of Z-transformed amplitude that were aligned with oculomotor events of interest for each participant, and then calculated average waveforms across participants. We graphed the average waveforms across participants.
We applied the bootstrap resampling method (Efron, 1979; Efron and Tibshirani, 1986), in order to evaluate the statistical significance of differences in parameters of interest between two data sets (Nakatani et al., 2011). This method is a non-parametric approach and, therefore, there is no need to assume that the parameters of interest follow the normal distribution. When we compare two data sets xiA and xiB, we first calculate the difference between them as follows:
where i is the integer number that takes from 1 to n to identify individual participants, and n is the number of participants (n = 6, in this study). Then, we calculated group average of xidiff. That is,
The null hypothesis to be tested is that there is no difference between the two data sets. That is,
We generated bootstrap parameters for that satisfy the null hypothesis. The distribution of these bootstrap parameters is used to evaluate the statistical significance of . We first generated the bootstrap parameters for each participant,
As the group average of x*idiff, is 0, the bootstrap parameters satisfy the null hypothesis. With the bootstrap resampling method (Efron, 1979; Efron and Tibshirani, 1986), we estimated the distribution of , that can be considered as the distribution of in case it satisfies the null hypothesis, and obtained a Monte Carlo approximation of the p-value for .
To deal with the multiple comparison problem, we used a cluster-based permutation test (Bullmore et al., 1999; Maris and Oostenveld, 2007; Groppe et al., 2011). This method is a non-parametric approach, suitable to detect broadly distributed effects (Groppe et al., 2011). We ignored all segments of the time-frequency domain of which the test statistic, , does not exceed a pre-determined threshold, equaling an uncorrected p-value of 1%. The remaining segments were composed into clusters by grouping together adjacent segments on the time-frequency domain. We calculated the mean value of test statistic for each cluster, in order to define a cluster-level value for the test statistic. The most extreme cluster-level value of the test statistic was used for permutation procedures, in order to derive a distribution for the null hypothesis. Same as in statistical testing with the bootstrap resampling method, the null hypothesis was: zero difference between the two data sets. The corrected p-value of each cluster was derived from its ranking in the null hypothesis distribution, and then each segment of the cluster was assigned the p-value of the entire cluster. We considered significant those segments of which the corrected p-value exceeded the 5% level. From hereon, corrected significance levels only will be reported.
For our analyses, we used custom scripts written in C (gcc compiler version 4.2.1 on MacOSX 10.6.8).
Temporal Distributions of Saccadic Probabilities
To investigate the relationship between blinking and saccades, we calculated temporal distributions of saccadic probabilities in alignment to onsets of blinking of interest. Choosing onsets of blinking of interest as the reference (0 ms), if certain types of saccades are time-locked to these blinks, this would be revealed by a peak in the aligned saccade frequency temporal distribution. Likewise, if certain types of saccades are systematically omitted in a time-locked fashion, the distribution would show a dip. We calculated the occurrence probability of saccades within 100 ms width bin with 50 ms overlap and obtained average probabilities across participants.
Results
In our previous study (Nakatani et al., 2011), about 5% of blinking occurred in a short period in which blinking was temporarily increased, about 1000 ms prior to a switching response. Such pre-switch blinks were followed by a transient amplitude increase of theta band activity. The switches showed a larger than average bias to the interpretation of the Necker cube that individual participants preferred. About 150 ms prior to a switching response, ~5% of saccades occurred in a short period in which saccade frequency was temporarily increased. Such pre-switch saccades were preceded by a transient amplitude increase of theta band activity. The direction of the saccades was systematically related to the interpretation of the Necker cube after the switch. For the blinks and saccades occurring in these two specific intervals, we here investigated the EEG activity prior to these events.
For the pre-switch blinking, alpha band activity (around 10 Hz) over the occipital area exhibited an increase in amplitude around 250 ms before the onset of the blink (Figure 2A). The increase was significant at P < 0.05 level, compared to baseline amplitude (Figure 2B). In the same intervals prior to no-switch blinks, i.e., blinks that were not followed by perceptual switching, the occipital area did not exhibit such amplitude increase (Figures 2C,D). We also directly compared the pre-switch blinking-related EEG with the no-switch blinking-related EEG, and found that the amplitude increase was specific to the pre-switch blink-related EEG (Figure 2E).
To investigate whether the amplitude increase over occipital areas was due to an eye-movement artifact, we compared saccade probabilities between pre-switch and no-switch blinks (Figure 3A). Around the time when the occipital area exhibited an amplitude increase in relation to pre-switch blinks, no difference in saccade probabilities between pre-switch and no-switch blinks was observed (P = 0.740 > 0.05, for the 300–250 ms interval prior to blinking onset). Saccade probabilities were significantly larger, however, in the interval between the occipital alpha band activity and blinking onset in pre-switch blinks, compared with no-switch blinks (P = 0.048 < 0.05 for the 200–150 ms prior to blinking).
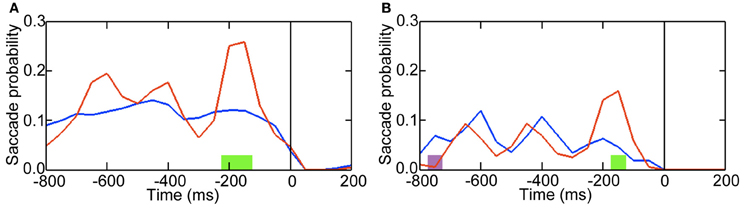
Figure 3. Probabilities of preceding saccades transiently increased when blinking led to perceptual switching. Time 0 indicates onset of blinking. (A) The color red denotes saccade probabilities when blinking led to a switch response (button press) approx. 1000 ms after blinking. Blue denotes saccade probabilities when blinking did not lead to a switch response. Green denotes periods that exhibited increased saccade probabilities when blinking led to a switch response (P < 0.05). (B) The color red denotes the probabilities of the pre-blink saccades whose directions were consistent with the preferred interpretation of the Necker cube after the switch. Blue denotes the probabilities of the pre-blink saccades whose directions were inconsistent with the preferred interpretation. Green denotes periods that exhibited increased probabilities of the pre-blink saccades whose directions were consistent with the preferred interpretation (P < 0.05). Purple denotes periods that exhibited increased probabilities of the pre-blink saccades whose directions were inconsistent with the preferred interpretation (P < 0.05).
These pre-blink saccades potentially constitute an even earlier oculomotor predictor of an ensuing switch than the subsequent blink. As they preceded pre-switch blinking that occurred 1000 ms before switch responses, they clearly differ in their timing from the pre-switch saccades currently under investigation. In our previous study (Nakatani et al., 2011) leftward (130–240°) pre-switch saccades tended to be followed by perceptual switching to a downward interpretation of the Necker; switching to an upward interpretation tended to follow rightward (300–60°) pre-switch saccades (in a polar coordinate system with right = 0°, top = 90°, left = 180°, bottom = 270°). If the present, earlier pre-blink saccades reflect the switching process, we may expect that the same relationship holds; the direction of the pre-blink saccades was expected to be associated with the preferred interpretation of the Necker cube after a switch, because the pre-switch blinks led to perceptual switching to the preferred interpretation (Nakatani et al., 2011). Downward interpretation was the preferred one for five out of six participants and upward interpretation was the preferred one for other one participant (Nakatani et al., 2011). As shown in Figure 3B, indeed this relationship was evident in our data. We may conclude that these pre-blink saccades reflect the ensuing switch in a manner similar to the pre-switch saccades.
We next analyzed the EEG activity before the pre-switch saccades, that occurred 150 ms before switch responses (Nakatani et al., 2011). For the pre-switch saccades, the occipital area exhibited an increase in the alpha band (around 10 Hz) 650 ms before and a decrease in the higher alpha band (around 11 Hz) 150 ms before the onset of the saccade, compared to baseline amplitude (Figures 4A,B). The lower theta band (around 5 Hz) activity before 400 ms also exhibited increased amplitude, as we had observed in our previous study (Nakatani et al., 2011). In contrast, for the no-switch saccades, the occipital area did not exhibit such amplitude in- and decrease (Figures 4C,D). We also directly compared the pre-switch saccade-related EEG with the no-switch saccade-related EEG, and found that the amplitude in- and decrease were specific to the pre-switch saccade-related EEG (Figure 4E).
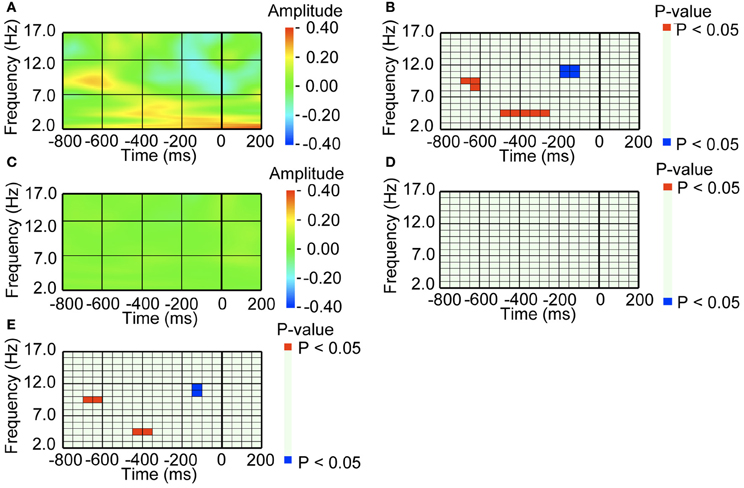
Figure 4. A series of amplitude increase and decrease in occipital alpha band activity preceded saccade, when saccade was followed by perceptual switching. (A) Average waveform of the occipital recordings (O2) aligned with the pre-switch saccades that were followed by perceptual switching. The amplitude was Z-transformed, and the amplitude zero indicates baseline amplitude. (B) Statistical difference between average waveform aligned with the pre-switch saccades and baseline amplitude. The colors red and blue denote that amplitude was larger in average waveform or baseline amplitude, respectively (P < 0.05). (C) Average waveform of the occipital recordings (O2) aligned with the no-switch saccades that were not followed by perceptual switching. The amplitude was Z-transformed, and the amplitude zero indicates baseline amplitude. (D) Statistical difference between average waveform aligned with the no-switch saccades and baseline amplitude. The colors red and blue denote that amplitude was larger in average waveform or baseline amplitude, respectively (P < 0.05). (E) Statistical difference between average waveform aligned with pre-switch saccades and average waveform aligned with the no-switch saccades. The colors red and blue denote that amplitude was larger in the pre-switch saccade-related average waveform or the no-switch saccade-related average waveform, respectively (P < 0.05).
The mother wavelet used in continuous wavelet transform of EEG had a width of 5 cycles. At 10 Hz, EEG in a width of 500, 250 ms before and 250 ms after, could affect amplitude at time of interest in time-frequency domain. To check whether amplitude in- or decrease before pre-switch oculomotor events were due to some part of oculomotor events bleeding in to the pre-oculomotor events activity, we applied the same analyses with a mother wavelet, of which the width was 3 cycles; we obtained similar results (see Figures A1, A2 of Appendix).
Discussion
We analyzed the properties of EEG episodes preceding the onset of eye-blinks and saccades. Occipital alpha band activity prior to blinks and saccades was predictive of whether these would lead to subsequent switching of perceived orientation in the Necker cube. When the occipital alpha band activity exhibited increased amplitude, blinks led to perceptual switching, and when it exhibited an increase followed by a decrease in amplitude, the saccades led to perceptual switching.
Alpha band activity at occipital sites has been associated with attentional deployment. For example, an anticipatory shift of visual attention to a target decreases the amplitude of alpha band activity in cortical areas tuned to the newly attended location (Sauseng et al., 2005; Yamagishi et al., 2005, 2008; Thut et al., 2006; Rihs et al., 2009), suggesting that a decrease in alpha reflects facilitation of future visual processing. On the other hand, cortical areas that are tuned to unattended locations exhibited increased alpha amplitude (Worden et al., 2000; Sauseng et al., 2005; Kelly et al., 2006; Rihs et al., 2007), suggesting that this reflects active inhibition of task-irrelevant processing (Klimesch et al., 1999, 2007). Thus, a sequence of increased and decreased alpha band activity would contribute to the deployment of visual spatial attention through disengaging and shifting of attention, respectively.
Attentional deployment might facilitate perceptual switching. According to the focal-feature hypothesis (Toppino, 2003), different focal regions within an ambiguous figure favor one perception of an ambiguous figure over another, by selectively enhancing a certain part within the visual input (Chelazzi et al., 2001).
Both blinks and saccades are associated with attentional process. Blinkings tend to occur at breakpoints of attention (Nakano et al., 2009; Nakano and Kitazawa, 2010) and are involved in the process of attentional disengagement (Nakano et al., 2013). Thus, the combination of amplitude increase of the alpha band activity and blinking would reflect the disengagement of attention to initiate the process of perceptual switching. On the other hand, saccades are associated with the reallocation of spatial attention (Filali-Sadouk et al., 2010). The combination of amplitude decrease of the alpha band activity and saccade might reflect the shift of attention that elicits the process of perceptual switching.
Our observations were correlational and therefore we cannot point out a causal relationship between occipital alpha band activity and perceptual switching. It is possible that the alpha band activity appeared time-locked to blinks or saccades with no functional role in the switching process. Based on a number of studies about the alpha band activity and attentional deployment (Worden et al., 2000; Sauseng et al., 2005; Yamagishi et al., 2005, 2008; Kelly et al., 2006; Thut et al., 2006; Rihs et al., 2007, 2009), we suggest, nevertheless, that the presently observed amplitude modulation of the alpha band activity was associated with attentional processes that play an active role in perceptual switching.
In our previous study (Nakatani et al., 2011), we discussed possible relationships between pre-switch oculomotor events and posterior theta band (around 5 Hz) activity. The pre-switch blinks occurred 1000 ms prior to switching responses. The theta band activity appeared 400 ms after the blinks. Pre-switch saccades occurred 150 ms prior to switching responses. Here, the theta band activity appeared 400 ms before the saccades. The posterior theta band activity was also observed in the control condition, where presented stimuli were switched from one to other. As the theta band activity followed changes of presented stimuli, we considered it to reflect the change of percept. Taken together current findings and previous findings, we may describe the processes of perceptual switching as follows.
In the case of pre-switch blinking, first a disengagement of attention occurs, reflected by the amplitude increase of the alpha band activity. The subsequent blink facilitates the detachment of attention from a part of the Necker cube that corresponds to the current percept. This process is more likely to be observed during the non-preferred interpretation of the Necker cube, as blinks tend to be followed by a switch to the preferred interpretation. Saccades that occur between the amplitude increase of the alpha band activity and the pre-switch blinks likewise facilitate detachment of attention by shifting the gaze from an attended location to other location. After attentional disengagement, the process of changing the percept is reflected by the theta band activity. In the case of the pre-switch saccade, first a disengagement of attention occurs, reflected by amplitude increase of the alpha band activity 600 ms before saccades. Second, the process of changing the percept is reflected by the theta band activity. Then, the shift of attention occurs to facilitate the change of percept, reflected by amplitude decrease of the alpha band activity and saccade whose direction was associated with the interpretation of the Necker cube after the switch (Nakatani et al., 2011), and it leads to perceptual switching.
In conclusion, we pointed out that preceding occipital alpha band activity predicts the impact of oculomotor events on current percept during perception of an ambiguous figure. Our results suggest that spontaneous oculomotor events dynamically play an active role in perceptual organization.
Conflict of Interest Statement
The authors declare that the research was conducted in the absence of any commercial or financial relationships that could be construed as a potential conflict of interest.
Acknowledgments
Cees van Leeuwen is supported by an Odysseus Grant from the Flemish Organization for Science FWO.
References
Bristow, D., Haynes, J. D., Sylvester, R., Frith, C. D., and Rees, G. (2005). Blinking suppresses the neural response to unchanging retinal stimulation. Curr. Biol. 15, 1296–1300.
Bullmore, E. T., Shckling, J., Overmeyer, S. O., Rabe-Hesketh, S., Taylor, E., and Bramer, M. J. (1999). Global, voxel, and cluster tests, by theory and permutation, for a difference between two groups of structural MR images of the brain. IEEE Trans. Med. Imaging 18, 32–42.
Burr, D. C., Morrone, M. C., and Ross, J. (1994). Selective suppression of the magnocellular visual pathway during saccadic eye movements. Nature 371, 511–513.
Chelazzi, L., Miller, E. K., Duncan, J., and Desimone, R. (2001). Responses of neurons in macaque area V4 during memory-guided visual search. Cereb. Cortex 11, 761–772.
Corbetta, M., Akbudak, E., Conturo, T. E., Snyder, A. Z., Ollinger, J. M., Drury, H. A., et al. (1998). A common network of functional areas for attention and eye movements. Neuron 21, 761–773.
Efron, B., and Tibshirani, R. (1986). Bootstrap methods for standard errors, confidence intervals, and other measures of statistical accuracy. Stat. Sci. 1, 54–77.
Filali-Sadouk, N., Castet, E., Oliver, E., and Zenon, A. (2010). Similar effect of cueing conditions on attentional and saccadic temporal dynamics. J. Vis. 10, 21, 1–13.
Groppe, D., Urbach, T. P., and Kutas, M. (2011). Mass univariate analysis of event-related brain potentials/fields I: a critical tutorial review. Psychophysiology 48, 1711–1725.
Hyvärinen, A., and Oja, E. (1997). A fast fixed-point algorithm for independent component analysis. Neural Comput. 9, 1482–1492.
Hyvärinen, A., and Oja, E. (2000). Independent component analysis: algorithms and applications. Neural Netw. 13, 411–430.
Ito, J., Nikolaev, A. R., Luman, M., Aukes, M. F., Nakatani, C., and van Leeuwen, C. (2003). Perceptual switching, eye movements, and the bus paradox. Perception 32, 681–698.
Jasper, H. H. (1958). The ten-twenty electrode system of the international federation. Electroenceph. Clin. Neurophysiol. 10, 371–375.
Kelly, S. P., Lalor, E. C., Reilly, R. B., and Foxe, J. J. (2006). Increases in alpha oscillatory power reflect an active retinotopic mechanism for distracter suppression during sustained visuo-spatial attention. J. Neurophysiol. 95, 3844–3851.
Klimesch, W., Doppelmayr, M., Schwaiger, J., Auinger, P., and Winkler, T. (1999). ‘Paradoxical’ alpha synchronization in a memory task. Brain Res. Cogn. Brain Res. 7, 493–501.
Klimesch, W., Sauseng, P., and Hanslmayr, S. (2007). EEG alpha oscillations: the inhibition-timing hypothesis. Brain Res. Rev. 53, 63–88.
Koenderink, J., Richards, W., and van Doorn, A. (2012). Space-time disarray and visual awareness. i-Perception 3, 159–162.
Leopold, D. A., and Logothetis, N. K. (1999). Multistable phenomena: changing views in perception. Trends Cogn. Sci. 3, 254–264.
Maris, E., and Oostenveld, R. (2007). Nonparametric statistical testing of EEG- and MEG-data. J. Neurosci. Methods 15, 177–190.
Nakano, T., Kato, M., Morito, Y., Itoi, S., and Kitazawa, S. (2013). Blink-related momentary activation of the default mode network while viewing videos. Proc. Natl. Acad. Sci. U.S.A. 110, 702–706.
Nakano, T., and Kitazawa, S. (2010). Eyeblink entrainment at breakpoints of speech. Exp. Brain Res. 205, 577–581.
Nakano, T., Yamamoto, Y., Kitajo, K., Takahashi, T., and Kitazawa, S. (2009). Synchronization of spontaneous eyeblinks while viewing video stories. Proc. Biol. Sci. 276, 3635–3644.
Nakatani, H., Orlandi, N., and van Leeuwen, C. (2011). Precisely timed oculomotor and parietal EEG activity in perceptual switching. Cogn. Neurodyn. 5, 399–409.
Nakatani, H., Orlandi, N., and van Leeuwen, C. (2012). Reversing as a dynamic process variability of Ocular and brain events in perceptual switching. J. Conscious. Stud. 19, 117–140.
Nakatani, H., and van Leeuwen, C. (2005). Individual differences in perceptual switching rates; the role of occipital alpha and frontal theta band activity. Biol. Cybern. 93, 343–354.
Nakatani, H., and van Leeuwen, C. (2006). Transient synchrony of distant brain areas and perceptual switching in ambiguous figures. Biol. Cybern. 94, 445–457.
Nobre, A. C., Gitelman, D. R., Dias, E. C., and Mesulam, M. M. (2000). Covert visual spatial orienting and saccades: overlapping neural system. Neuroimage 11, 210–216.
Otero-Millan, J., Macknik, S. L., and Martinez-Conde, S. (2012). Microsaccades and blinks trigger illusory rotation in the “Rotating Snakes” illusion. J. Neurosci. 32, 6043–6051.
Parker, A. J., and Krug, K. (2003). Neuronal mechanisms for the perception of ambiguous stimuli. Curr. Opin. Neurobiol. 13, 433–439.
Rihs, T. A., Michel, C. M., and Thut, G. (2007). Mechanisms of selective inhibition in visual spatial attention are indexed by alpha-band EEG synchronization. Eur. J. Neurosci. 25, 603–610.
Rihs, T. A., Michel, C. M., and Thut, G. (2009). A bias for posterior alpha-band power suppression versus enhancement during shifting versus maintenance of spatial attention. Neuroimage 22, 190–199.
Rock, I., Hall, S., and Davis, J. (1994). Why do ambiguous figures reverse? Acta Psychol. 87, 33–59.
Sauseng, P., Klimesch, W., Stadler, W., Schabus, M., Doppelmayr, M., Hanslmayr, S., et al. (2005). A shift of visual spatial attention is selectively associated with human EEG alpha activity. Eur. J. Neurosci. 22, 2917–2926.
Thut, G., Nietzel, A., Brandt, S. A., and Pascual-Leone, A. (2006). Alpha-band electroencephalographic activity over occipital cortex indexes visuospatial attention bias and predicts visual target detection. J. Neurosci. 26, 9494–9502.
Toppino, T. C. (2003). Reversible-figure perception: mechanisms of intentional control. Percept. Psychophys. 65, 1285–1295.
Veltman, J. A., and Gaillard, A. W. (1998). Physiological workload reactions to increasing levels of task difficulty. Ergonomics 41, 656–669.
Volkmann, F. C., Riggs, L. A., and Moore, R. K. (1980). Eyeblinks and visual suppression. Science 207, 900–990.
Yamagishi, N., Callan, D. E., Anderson, S. J., and Kawato, M. (2008). Attentional changes in pre-stimulus oscillatory activity within early visual cortex are predictive of human visual performance. Brain Res. 1197, 115–122.
Yamagishi, N., Goda, N., Callan, D. E., Anderson, S. J., and Kawato, M. (2005). Attentional shifts towards an expected visual target alter the level of alpha-band oscillatory activity in the human calcarine cortex. Brain Res. Cogn. Brain Res. 25, 799–809.
Worden, M. S., Foxe, J. J., Wang, N., and Simpson, G. V. (2000). Anticipatory biasing of visuospatial attention indexed by retinotopically specific alpha-band electroencephalography increases over occipital cortex. J. Neurosci. 20, RC63.
Appendix
The mother wavelet used in the continuous wavelet transform of EEG had a width of 5 cycles. At 10 Hz, oculomotor behavior in a width of 500, 250 ms before and 250 ms after, could affect amplitude of EEG at the time of interest. To check whether amplitude increase or decrease before pre-switch oculomotor events were due to some part of oculomotor event-related activity bleeding in to the pre-oculomotor events activity, we applied the same analyses with a mother wavelet of which the width was 3 cycles. Figure A1 is for amplitude of EEG prior to blinks, and Figure A2 is for amplitude of EEG prior to saccades. The results are similar to those obtained with a 5-cycles wavelet analysis.
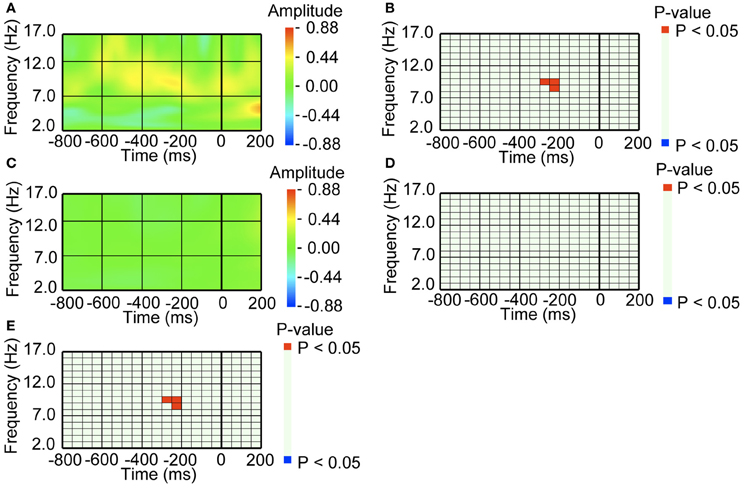
Figure A1. EEG amplitude preceding blinking, when the mother wavelet with a size of 3 cycles was used for the continuous wavelet transform. (A) Average waveform of the occipital recordings (O2) aligned with the pre-switch blinks. Amplitude was Z-transformed, and the amplitude zero constitutes the baseline. (B) Statistical difference between average waveform aligned with the pre-switch blinks and baseline amplitude. The colors red and blue denote that amplitude was larger in the average waveform or baseline amplitude, respectively (P < 0.05). (C) Average waveform of the occipital recordings (O2) aligned with the no-switch blinks. The amplitude was Z-transformed, and zero indicates baseline amplitude. (D) Statistical difference between average waveform aligned with the no-switch blinks and baseline amplitude. The colors red and blue denote that amplitude was larger in average waveform or baseline amplitude, respectively (P < 0.05). (E) Statistical difference between the average waveform aligned with the pre-switch blinks and the average waveform aligned with the no-switch blinks. The colors red and blue denote that amplitude was larger in the pre-switch blinking-related average waveform or the no-switch blinking-related average waveform, respectively (P < 0.05).
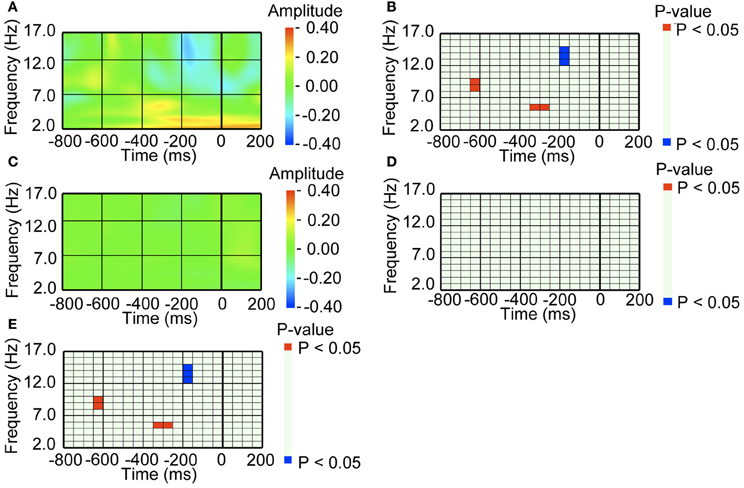
Figure A2. EEG amplitude preceding a saccade, when a mother wavelet with a size of 3 cycles was used for the continuous wavelet transform. (A) Average waveform of the occipital recordings (O2) aligned with the pre-switch saccades that were followed by perceptual switching. The amplitude was Z-transformed, and the amplitude zero indicates baseline amplitude. (B) Statistical difference between average waveform aligned with the pre-switch saccades and baseline amplitude. The colors red and blue denote that amplitude was larger in the average waveform or baseline amplitude, respectively (P < 0.05). (C) Average waveform of the occipital recordings (O2) aligned with the no-switch saccades. The amplitude was Z-transformed, and the amplitude zero indicates baseline amplitude. (D) Statistical difference between average waveform aligned with the no-switch saccades and baseline amplitude. The colors red and blue denote that amplitude was larger in average waveform or baseline amplitude, respectively (P < 0.05). (E) Statistical difference between the average waveform aligned with the pre-switch saccades and the average waveform aligned with the no-switch saccades. The colors red and blue denote that amplitude was larger in the pre-switch saccade-related average waveform or the no-switch saccade-related average waveform, respectively (P < 0.05).
Keywords: ambiguous figures, Necker cube, perception, electroencephalogram (EEG), blinking, saccade
Citation: Nakatani H and Van Leeuwen C (2013) Antecedent occipital alpha band activity predicts the impact of oculomotor events in perceptual switching. Front. Syst. Neurosci. 7:19. doi: 10.3389/fnsys.2013.00019
Received: 01 February 2013; Accepted: 08 May 2013;
Published online: 24 May 2013.
Edited by:
Artem Belopolsky, Vrije Universiteit Amsterdam, NetherlandsReviewed by:
Natasha Sigala, University of Sussex, UKEelke Spaak, Donders Institute for Brain, Cognition, and Behaviour, Netherlands
Copyright © 2013 Nakatani and Van Leeuwen. This is an open-access article distributed under the terms of the Creative Commons Attribution License, which permits use, distribution and reproduction in other forums, provided the original authors and source are credited and subject to any copyright notices concerning any third-party graphics etc.
*Correspondence: Hironori Nakatani, Okanoya Emotional Information Project, Exploratory Research for Advanced Technology, Japan Science and Technology Agency, 2-1 Hirosawa, Wako-shi, Saitama 351-0198, Japan. e-mail: hnakatani@brain.riken.jp