Biogas cook stoves for healthy and sustainable diets? A case study in Southern India
 Tal Lee Anderman1*
 Ruth S. DeFries2
 Stephen A. Wood2,3
 Roseline Remans3,4
 Richie Ahuja1
Shujayath E. Ulla5
Richie Ahuja1
Shujayath E. Ulla5
- 1Environmental Defense Fund, San Francisco, CA, USA
- 2Department of Ecology, Evolution, and Environmental Biology, Columbia University, New York, NY, USA
- 3Agriculture and Food Security Center, The Earth Institute, Columbia University, New York, NY, USA
- 4Bioversity International, Addis Ababa, Ethiopia
- 5Department of Social Work, St. Joseph’s College, Bangalore, India
Alternative cook stoves that replace solid fuels with cleaner energy sources, such as biogas, are gaining popularity in low-income settings across Asia, Africa, and South America. Published research on these technologies focuses on their potential to reduce indoor air pollution and improve respiratory health. Effects on other cooking-related aspects, such as diets and women’s time management, are less understood. In this study, in southern India, we investigate if using biogas cook stoves alters household diets and women’s time management. We compare treatment households who are supplied with a biogas cook stove with comparison households who do not have access to these stoves, while controlling for several socio-economic factors. We find that diets of treatment households are more diverse than diets of comparison households. In addition, women from treatment households spend on average 40 min less cooking and 70 min less collecting firewood per day than women in comparison households. This study illustrates that alongside known benefits for respiratory health, using alternative cook stoves may benefit household diets and free up women’s time. To inform development investments and ensure these co-benefits, we argue that multiple dimensions of sustainability should be considered in evaluating the impact of alternative cook stoves.
Introduction
Alternative cook stoves are becoming increasingly popular in low-income settings across Asia, Africa, and South America (1). These stoves replace solid fuels, such as wood, animal dung, and crop residue, with cleaner energy sources such as biogas. Yet an estimated 2.6 billion people still cook with solid fuels, with more than 95% of them in Asia and Sub-Saharan Africa (1). Household air pollution from openly combusting solid fuels indoors has been cited as the third largest risk of premature mortality, responsible for more than 108 million disability-adjusted life-years (2–5). Reducing usage of solid fuels through, for example, biogas cook stoves is therefore crucial to avoid the more than 4.3 million deaths attributed to household indoor air pollution annually (2, 3, 6).
Serious health consequences are an important reason to address the challenge of transitioning households away from openly combusting solid fuels. Yet many economic, technological, and cultural obstacles can deter households from making these changes including, for example, a lack of affordable alternative energy options and cultural preferences for traditional fuel sources (4, 7–9).
In recent years, there has been a surge in efforts to promote alternative cook stoves (10, 11). These efforts include replacing traditional solid cooking fuels with cleaner energy sources, such as liquid petroleum gas (LPG) and biogas. Other options include rocket stoves, which improve heat-use efficiency thereby reducing the amount of fuel required, and gasifier stoves, which more thoroughly combust particulate matter to reduce net emissions (12). Organizations such as the Global Alliance for Clean Cookstoves, which has almost 400 partners in 36 countries, support the financing and deployment of these technologies.
The main body of existing literature focuses on the effect of alternative cook stoves on respiratory health. Evidence shows that using alternative cook stoves significantly reduces indoor air pollution, including concentrations of particulate matter and carbon monoxide (13–17). A plethora of studies illustrate the link between reductions in indoor air pollution and improved respiratory health (18–24). Additional research provides insights on best practices for the distribution and promotion of alternative cook stoves by carefully considering cultural, physical, and economic barriers to adoption (4, 7, 8, 25–29).
Taking together the existing literature, there is a clear knowledge gap in how changing cooking technologies influences other aspects related to cooking, such as dietary patterns and women’s time management. In nutrition science, diet diversity is well established as a key component of a quality diet (30–34). Studies have shown that higher individual diet diversity relates to higher micronutrient intake for children (35–38), adolescents (39), and adults (30, 31, 40). Household diet diversity is used as an indicator for household access to a variety of foods (41).
We hypothesize that changing the type of cook stove a household uses could trigger shifts in the diversity of foods they consume (42). For example, because cooks have more control over temperature and cooking time with an alternative stove, they might choose to add different items to their meals that were previously too time-consuming or posed too high a spoilage risk because of uncontrollable stove temperatures. Similarly, families may have avoided preparing foods with longer cooking times, such as certain legumes, to save fuel wood, or to avoid creating indoor air pollution. Changing cooking technologies may also shift household expenditures and time management, allowing greater access to a diversity of foods.
Similar to the effects on diet diversity, little research has investigated how households manage their time depending on the cooking technology they use (43, 44). We hypothesize that because alternative cook stoves require less or no wood, the use of these stoves reduces the amount of time that households, particularly women, need to spend on firewood collection. In addition, the time required to cook could also be reduced because of better heat control. We hypothesize that such time-savings can free up time for other activities, such as income generation or relaxation.
To test these two hypotheses – the effect of alternative cook stoves on diet diversity and women’s time management – we use a case study of biogas cook stoves in southern India.
Biogas cook stoves are fueled through anaerobic digestion of dung, which takes place in an anaerobic digester belowground (45). One product of this digestion (methane) is piped to the house to fuel a cook stove, while the remaining content (known as slurry) flows out of the digester and can be used as fertilizer (45).
India is an important case study because roughly 70% of the population lives in rural communities and more than 75% of those rural households (over 750 million people) rely on traditional solid fuels for cooking (3, 11, 46, 47). In these regions, household air pollution is responsible for over 550,000 premature deaths of poor women and children each year (6, 10, 48, 49). The country has employed a variety of strategies to address this significant public health risk, including subsidizing biogas cook stoves (10, 11). At present, there are many biogas cook stove development projects operating throughout India (10, 11). However, to our knowledge, this is the first study that looks into the effect of these biogas cook stoves on diet diversity and time allocation.
Materials and Methods
Ethics Statement
This study has been reviewed and approved by the Chair of the Columbia University Institutional Review Board-Morningside (IRB Protocol #AAAK9905). Following IRB-approved directions for this study, each head of household that participated provided voluntary informed consent, either in writing or through authorization of a portrait photograph taken of them by an enumerator.
Study Area and Sampling Design
We analyzed household-level data for members of the Agricultural Development and Training Society (ADATS) in the state of Karnataka in southern India. ADATS is a membership-based organization of smallholder households that pool capital to address financial needs. Operating out of the town of Bagepalli, 100 km north of Bangalore, ADATS has about 30,000 participating families in over 1,000 villages in five panchayats (Indian self-governments at the village level) in the Kolar district of Karnataka (Figure 1) (50, 51). ADATS’ work spans multiple sectors, including adult literacy, alternative energy development, agriculture, child education, public health, legal aid, and mitigation of climate change.
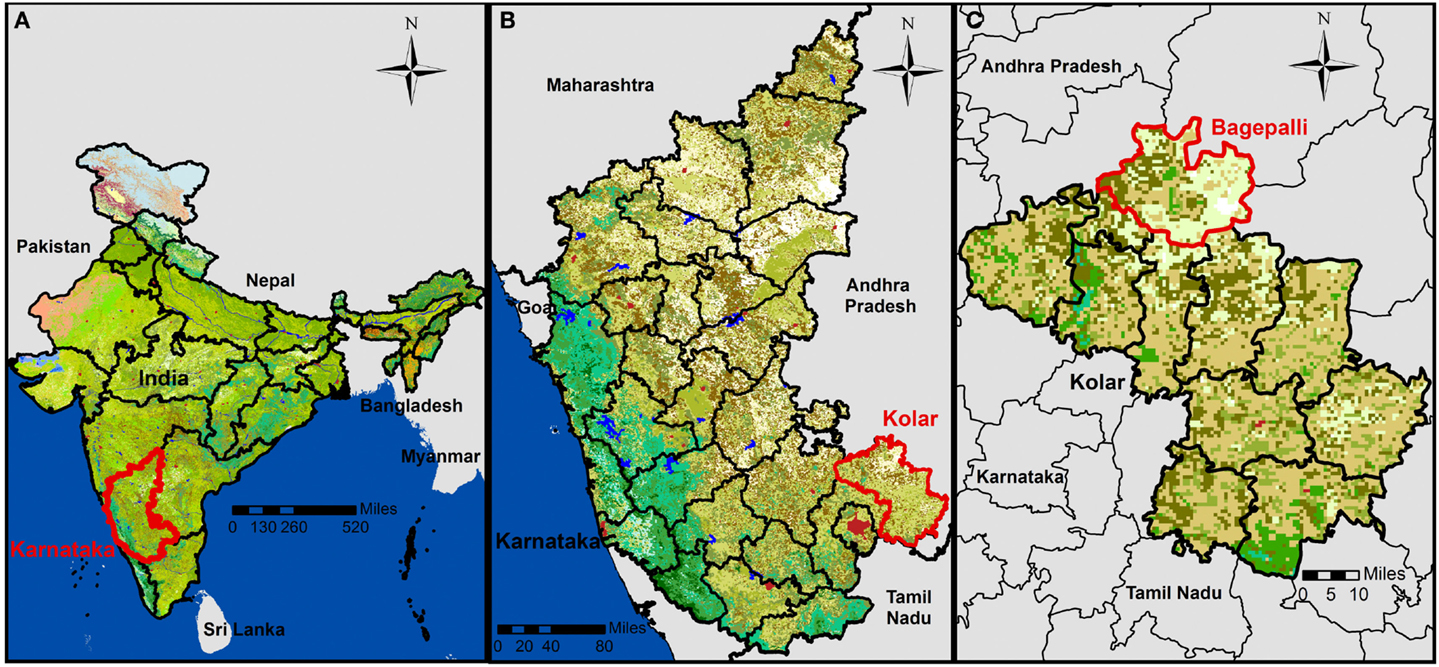
Figure 1. Map depicting (A) the study area in the state of Karnataka, India; (B) in the district of Kolar; (C) in the Bagepalli panchayat. Created in ArcGIS using external data (50–53).
We surveyed 199 households in 15 ADATS member villages (Figure 2; Table S1 in Supplementary Material) from the Bagepalli panchayat in the Kolar district of Karnataka (Figure 1) (51–53). The Bagepalli panchayat skirts the southern border of the Rayalaseema desert. The terrain is semi-arid and drought prone, with rainfall averaging 560 mm/year (54). The majority of families in the region are labor workers, while a few tend their own agricultural plots.
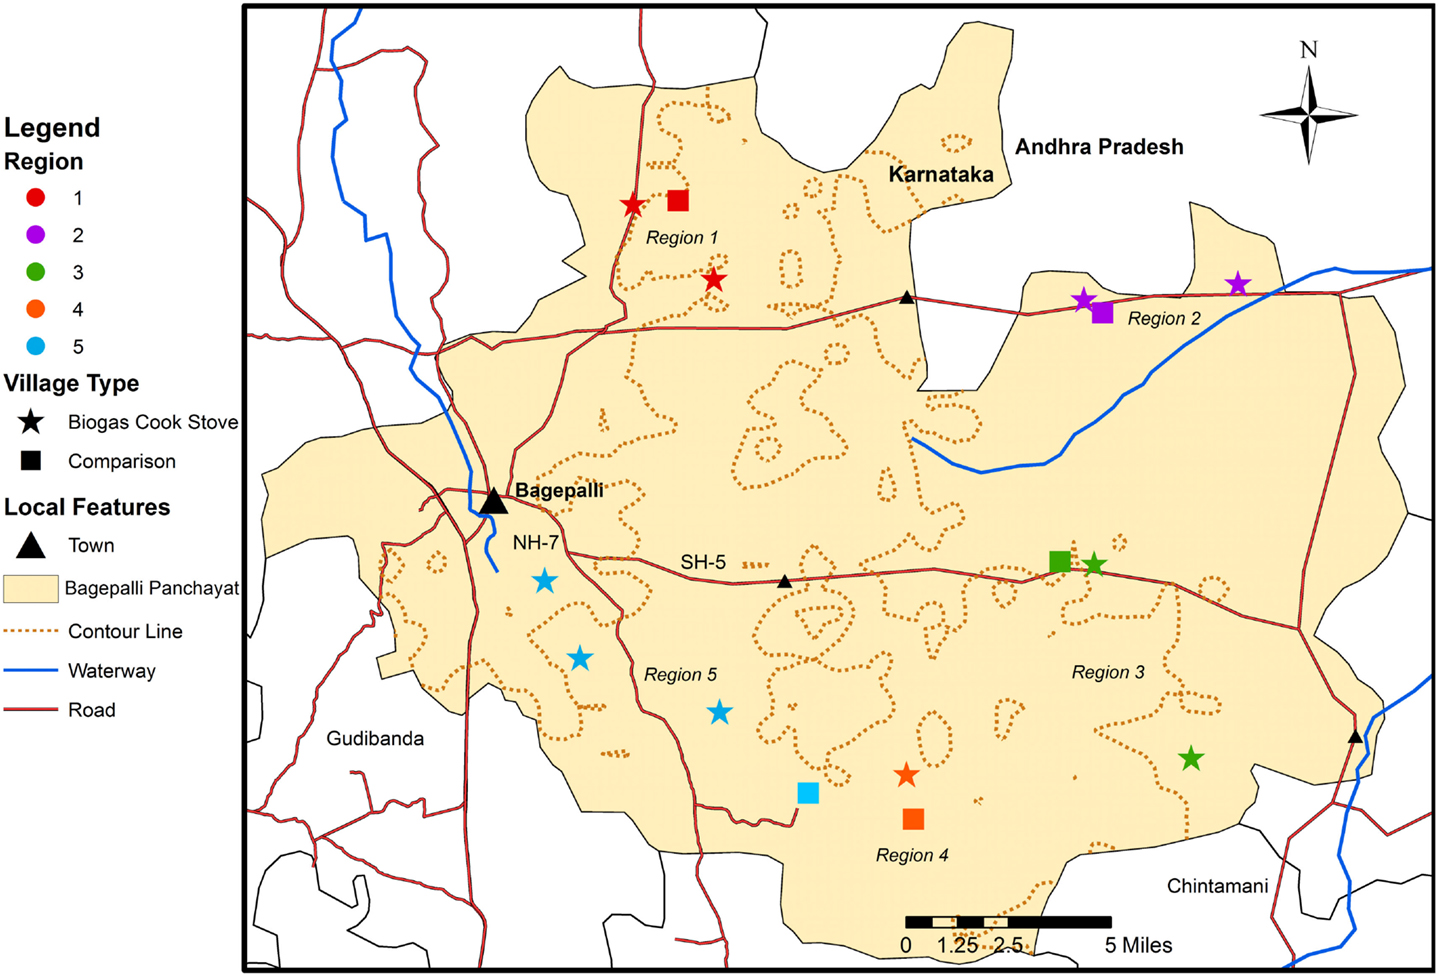
Figure 2. Map illustrating the distribution of the study’s 10 villages with biogas cook stoves and five villages used as comparisons. Created in ArcGIS using external data (50–53).
Data from households using biogas cook stoves (the “treatment” group) were collected for families in 10 villages participating in the Bagepalli clean development mechanism (CDM) Biogas Programme. Half of the households in each selected village were randomly chosen for surveying using a random number generator. The Programme is an ADATS project launched in 2006 that built 5,500 biogas cook stove units in 128 villages. All ADATS member households in villages that could run a biogas cook stove – meaning that they had a cow, yard space, and the ability to dig a deep hole for the anaerobic digester – were given the option to obtain a stove. All stove materials were provided for free by ADATS.
A second set of five villages in the Bagepalli panchayat that did not have biogas cook stoves (but were still part of ADATS) were also surveyed to provide reference data (the “comparison” group). Due to disparities between the number of treatment and comparison households, all eligible households in comparison villages were surveyed. Comparison villages were chosen based on (1) their having been unable to dig the hole needed to construct the digester for the biogas cook stoves because of large subsurface rocks, (2) their physical proximity to the 10 randomly selected treatment villages, (3) their participation in ADATS, therefore receiving other wide-ranging benefits of membership, and (4) their having households that owned a cow and had adequate yard space and would have thus been able to run a stove when the Biogas Programme was launched in 2006, and when surveys were enumerated in 2013.
All households without a biogas cook stove (the comparison group) used a wood-burning stove inside the house to cook. Some households used multiple cook stoves. Five comparison households used a kerosene stove. No other alternative cook stoves were used in the comparison or treatment groups. Two treatment households used a firewood stove alongside their biogas unit. Whether a household owned a biogas, firewood, and/or kerosene stove is included in each of our models.
Data Collection and Indicators
Data for this study (summarized in Table 1; available in Supplementary Material) were gathered from January to March 2013. A survey (Supplementary Material) was administered to 199 households, with the female household head acting as the main respondent. Of the 10 villages with biogas cook stoves, 141 households were surveyed. Fifty-eight households were surveyed from the five comparison villages. We used several metrics to assess the relationship between ownership of a biogas cook stove and co-benefits for household diet diversity and time savings (Table 1).
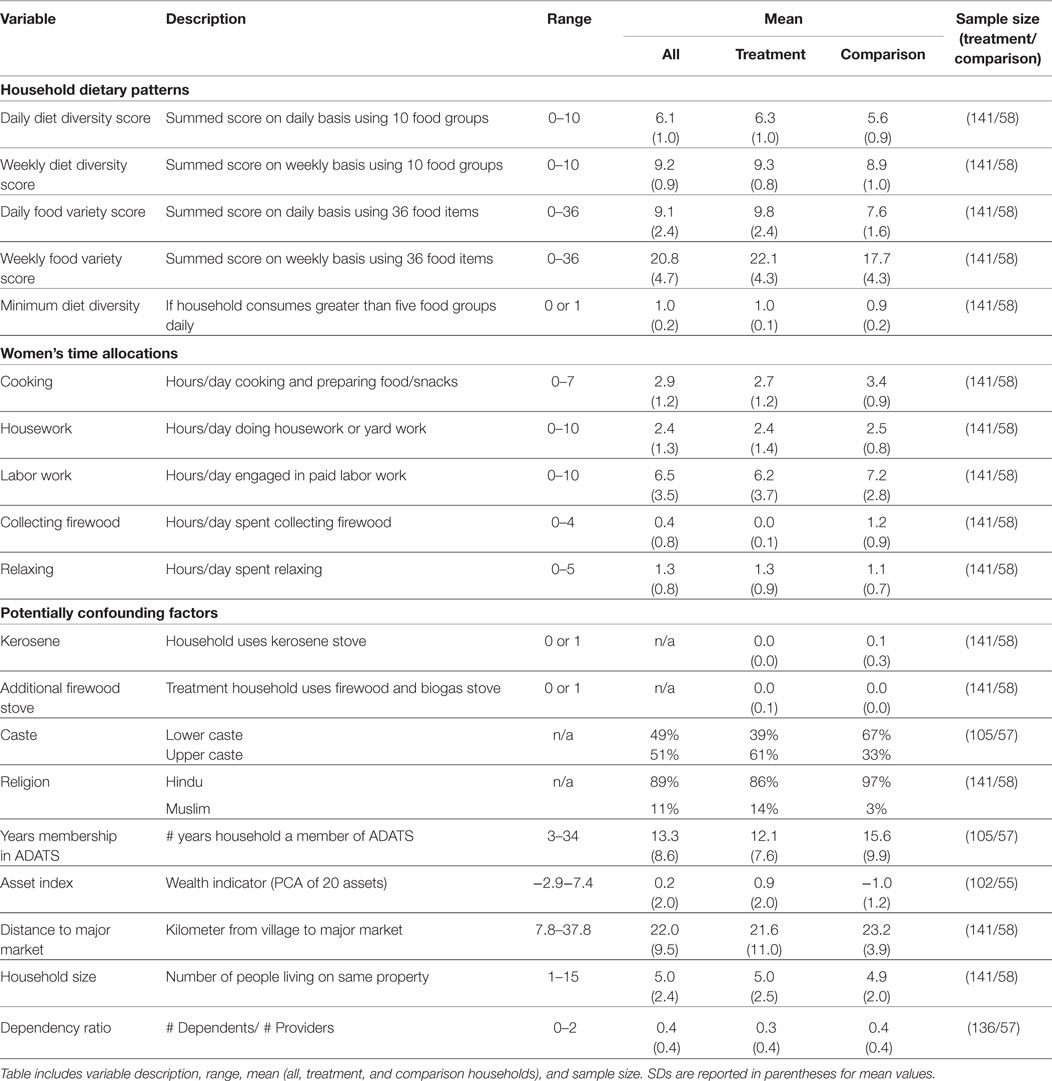
Table 1. Synthesis of study variable characteristics, including variables for household dietary patterns, women’s time allocations, and a set of potentially confounding factors.
To generate a diet diversity score, which measures the variety of food groups consumed over a given time period, we asked the female household head to report on the household’s diet using a semi-quantitative food frequency survey. This included reporting the frequency (times per day, week, month, or year) that the household consumed 36 locally available food items (Tables S2 and S3 in Supplementary Material) (41, 55).
These foods were categorized into 10 food groups following the women’s diet diversity score as outlined by the Food and Nutrition Technical Assistance III Project (FANTA) and the Food and Agriculture Organization of the United Nations (FAO) (Table S2 in Supplementary Material): starchy staples, beans and peas, nuts and seeds, dairy, flesh foods, eggs, Vitamin A-rich dark green leafy vegetables, other Vitamin A-rich fruits and vegetables, other vegetables, and other fruit (55). Each food item received a value based on how often it was reportedly consumed (0 = never; 1 = once a week; 7 = once a day, and all other values scaled accordingly). These values were then summed across food groups for each household. By applying cut-offs in one-point increments, we established diet diversity scores that reflect the number of food groups – ranging from 0 to 10 – that households consumed on a daily (Day Diet Diversity Score) and weekly (Week Diet Diversity Score) basis.
The reported frequency of consuming the food items categorized into food groups for the diet diversity score were also used to generate a food variety score. The food variety score gives equal weight to the consumption of each of the 36 food items by summing the consumption frequencies of all items, rather than dividing the items into groups (41). The food variety score ranges from 0 to 36 food items consumed on a daily (Day Food Variety Score) and weekly (Week Food Variety Score) basis. The food variety score is also a proxy for diet quality (37). It complements the diet diversity score by offering insight into the number of different food items accessible, thus also providing a measure of household resilience. Because it has greater variation than the diet diversity score, it is more sensitive to differences between households.
The daily diet diversity score was also used to categorize diets according to a threshold suggested by FAO and FANTA as the women’s minimum diet diversity score (55). This yes/no indicator, in comparison to the range of values in the diet diversity and food variety scores, reflects if households have reached a minimum diet diversity threshold by consuming at least 5 out of 10 food groups on a daily basis (55). FAO and FANTA established the women’s minimum diet diversity score to reflect the finding that women consuming foods from five or more of the 10 food groups in the diet diversity score have a greater likelihood of meeting their micronutrient needs than women consuming foods from fewer food groups (55, 56).
Our second set of response variables quantified how much time female heads of households spent cooking, doing housework, doing paid labor work, collecting firewood, and relaxing during a workday. By having the female household head (respondent) map out her daily activities via a 24-h recall, we calculated the time she spent each day on these five activities. Each activity was analyzed independently.
A third set of data, including demographic, cultural, and socio-economic variables, was collected and used to account for other potentially confounding factors in our analysis. A household’s total size and its’ dependency ratio indicated household demographics. Household size was reported as the aggregate number of people dwelling on one property. The dependency ratio divided the number of household members between 0 and 14 and over 65 years of age by the number between 15 and 64 years of age (57). A larger value indicates higher dependency within the household. Cultural characteristics were represented by binary variables for a household’s religion (Hindu or Muslim) and caste. A range of the 14 castes, including Muslims, present in our study were grouped into upper and lower castes in consultation with local authorities.
Socio-economic variables were represented by a household’s duration of membership in ADATS, distance to a major market, and wealth. The distance on navigable roads between each village and the area’s major market was calculated using Google Maps (58). Wealth was measured using an asset index, which aggregates household stocks with different units (e.g., livestock, landholdings, and household appliances) to generate a wealth ranking between households in a study population (59–61). Many development economists now advocate the use of household welfare measures based on assets to assess poverty, given fewer biases related to respondent recall errors, survey seasonality, and measurement error (60). We collected data on household reported ownership of 20 asset indicators (Table S4 in Supplementary Material) (59). We then used a principal component analysis (PCA) to generate weights for each of the 20 assets. The first principal component in the analysis is the linear combination of the assets that explains the greatest sample variance in the data. The index itself is a summation of asset ownership, weighted by each asset’s contribution to the explanation of total variance relative to the first principal component (61). The asset index serves as a comparative measure of poverty; each household’s poverty ranking is relative to the study population used in the PCA (60). Research on the relative merit of different asset indices, including a metric of structured income, shows that the PCA-based asset index used here offers the best indication of the relative socio-economic position of each household, and therefore of local wealth distributions and orderings, in a study population (59, 60).
After initial surveys, a basic qualitative module was performed to enhance our understanding of community perceptions on household diet diversity, women’s allocations of time, and any other changes respondents experienced in association with owning a biogas cook stove (62–67). The informal focus group discussions were conducted in March 2013 in two villages with biogas cook stoves that were randomly selected from the 10 treatment villages. Through this random selection, the focus groups were held with the female household heads of surveyed households in one village in Region 1 and one village in Region 5 (see Figure 2). Because of the informal nature and structure of the focus groups, these discussions were only used to gain feedback on the preliminary trends and results found in the quantitative analysis, and to give back to the community by informing them about the expected outcomes of the research.
Analysis
All statistical analyses were conducted in STATA (version 13) (68). Separate mixed models with fixed effects were run for each of the response variables. The 15 villages surveyed were grouped into five regions based on the geographic distribution of the villages, with two to three biogas cook stove and one comparison village per region (Figure 2). Individual villages were also applied as a grouping factor. However, the limitations in sample size per village made it difficult to interpret results from this grouping, which was therefore not used in the final analysis. Because comparison villages were intentionally selected based on requirements, such as geographic location and an inability to construct biogas cook stoves, a mixed model with fixed effects grouped by region was applied to account for possible non-random undocumented socio-economic or spatial village-level grouping effects. To further account for potential non-random effects, we applied robust clustering of standard error at the village level. This lowered the residuals in each of our models, measured through root mean square error (RMSE).
Throughout our analysis, continuous predictor variables were standardized by two standard deviations (SDs), binary predictor variables were centered, and response variables were left unstandardized (69). This standardization procedure was used to ensure that variables were expressed in common units so that correlation coefficients within each model could be compared. The data were tested for outliers using Cook’s Distance. Cook’s Distance was calculated for each model and, using the standard cut-off value of 1 (70), did not identify any outliers. Collinearity between variables was systematically checked using variance inflation factors (VIF); results indicated that there were no instances of collinearity as outlined in Results.
To add robustness to testing the assumption that our study population was analogous despite natural variations in household characteristics, we also ran the analysis on a subset of the population selected using propensity score matching (PSM). PSM is one approach to tackle the possibility of selection bias in choosing a treatment population. It addresses this issue by identifying a subset of the comparison group that is similar to the treatment group in all relevant pretreatment characteristics. Within this population subset, then, differences in outcomes between the comparison and treatment groups can be more easily attributed to the treatment itself (71, 72). We used a probit regression model to calculate the propensity score for each household, which estimates the probability of a household participating in the treatment given its observed covariates (72, 73). We included the following equally weighted covariates to calculate the propensity score: asset index, caste, religion, household size, dependency ratio, and duration of membership in ADATS (72, 73). When applying this structure to our data, the balancing property was satisfied. We then identified the population with a region of common support across all covariates by removing households with a propensity score smaller than the minimum or larger than the maximum of the opposite group (71, 72). This selected 19 households (13 comparison and 6 treatment households) that fell outside the region of common support and were thus removed for the supplementary analysis, bringing the population subset to 138 households out of the original 157. All models were run on this population subset as described in Section “Results.”
Results
Description of Household Characteristics
The 199 households in 15 villages analyzed in this study present a range of socio-economic, cultural, and geographic characteristics (Table 1; Table S1 in Supplementary Material).
Hypothesis 1: households with biogas cook stoves have a more diverse diet as compared to households without the stoves
To test our first hypothesis, we assess the relationship between household diet diversity and ownership of a biogas cook stove using a set of mixed models with fixed effects, which allows us to control for various socio-economic variables (Table 2). We consistently find a significant relationship between diet diversity and cook stove technology, independent of the type of diversity metric used (daily or weekly diet diversity or food variety score) – households that use a biogas cook stove have a more diverse diet than households that use a firewood stove.
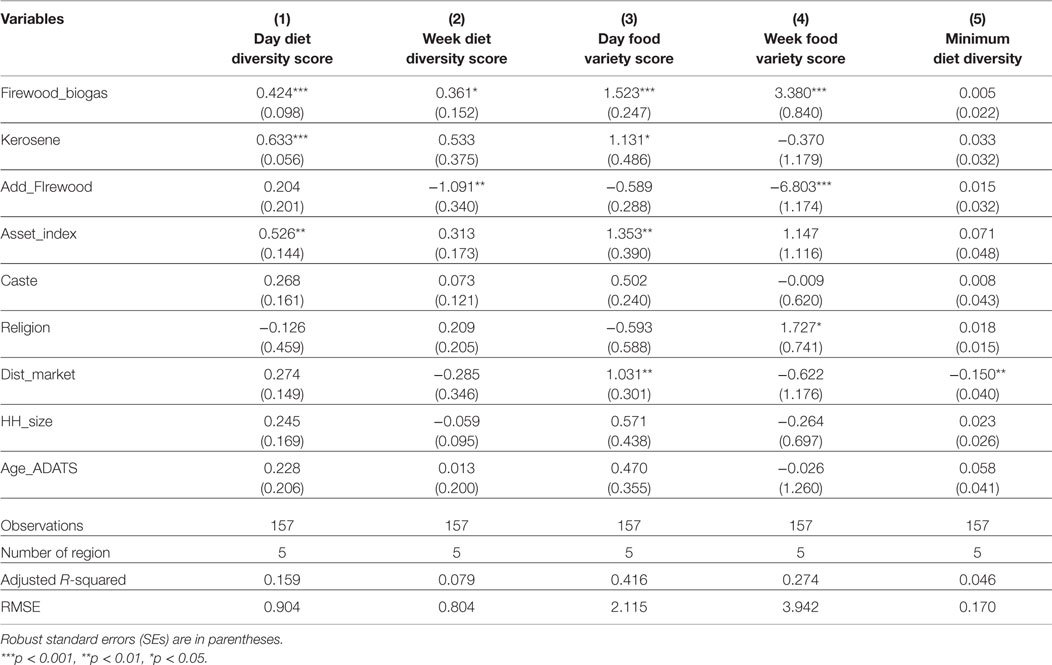
Table 2. Mixed model with fixed effects grouped by region for the daily and weekly diet diversity score and food variety score, and the minimum diet diversity score. Biogas cook stove ownership reported as a binary variable with comparison households (0) and treatment households (1).
One particular food item or food group does not explain the differences observed in diet diversity between treatment and comparison households. Instead, the difference is related to the treatment households’ higher average consumption of several food groups. Starchy staples, beans and peas, Vitamin A fruits and vegetables, and other vegetables are the most frequently consumed food groups in both populations (Figure 3; Table S3 in Supplementary Material). However, treatment households consume the following food groups significantly more frequently on a daily basis: starchy staples, nuts and seeds, dairy, flesh foods, Vitamin A fruits and vegetables, and other fruits (Figure 3; Table S3 in Supplementary Material). In the context of the local situation, where nuts and seeds, flesh foods, green leafy vegetables, and eggs are among the least consumed items in general (Table S3 in Supplementary Material), this higher consumption of a variety of food groups by households with a biogas cook stove can add important nutritional diversity to the diet.
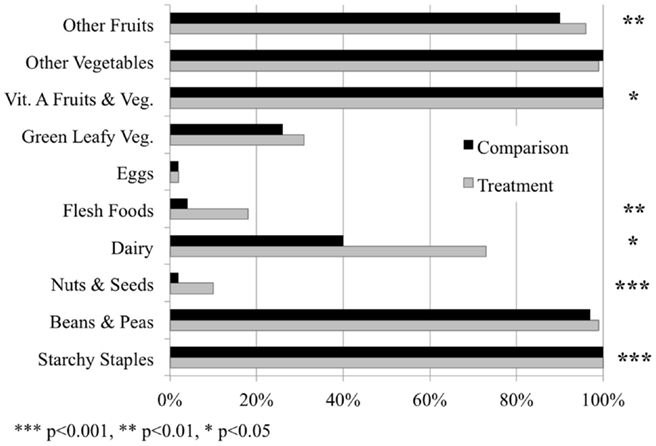
Figure 3. The percentage of households consuming each of the 10 food groups in the diet diversity score on a daily basis in the treatment and comparison populations, respectively. Significant differences in the consumption of food groups between the two populations represented by asterisks, based on analyses from mixed models with fixed effects.
For the minimum diet diversity score, there was not a significant difference between the proportion of treatment and comparison households meeting the diet diversity cut-off of consuming five food groups daily. We do, however, observe that a household’s distance to a major market is a significant determining factor in reaching the diversity cut-off; households that were further from a major market less frequently consumed five or more of the 10 food groups each day (Table 2). This finding is consistent with other recent studies (74).
The analysis did not experience problems with collinearity (all VIF values <1.23). Furthermore, all models were run on the data subset identified as comparable through PSM, and results were consistent with the full sample analysis (Table S5 in Supplementary Material).
Hypothesis 2: women in households with biogas cook stoves have different time allocations than women without the stoves
As with the first hypothesis, we test the relationship between a female household head’s allocations of time and ownership of a biogas cook stove using mixed models with fixed effects (Figure 4; Table 3). None of the models experienced problems with collinearity (all VIF values <1.22). The models were also run on the data subset identified as comparable through PSM, and results were consistent with the full sample analysis (Table S6 in Supplementary Material).
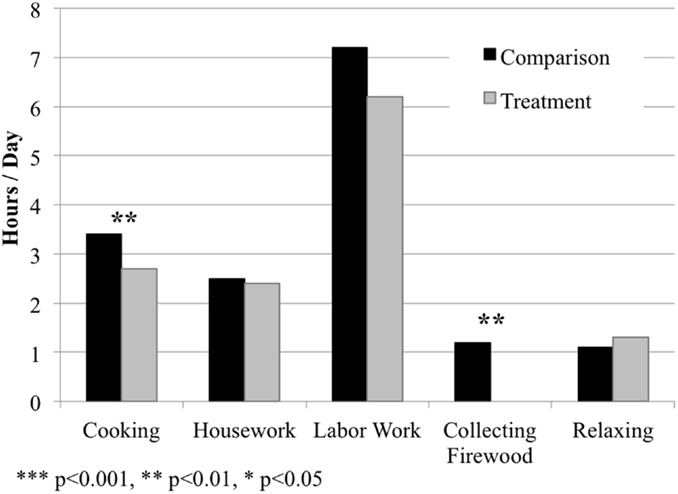
Figure 4. The amount of time female household heads spent cooking, doing housework, doing labor work, collecting firewood, and relaxing per day in the treatment and comparison populations, respectively. Values presented as mean hours spent per day on each activity. Significant differences in respondent time allocations between the two populations represented by asterisks, based on analyses from mixed models with fixed effects (see Table 3).
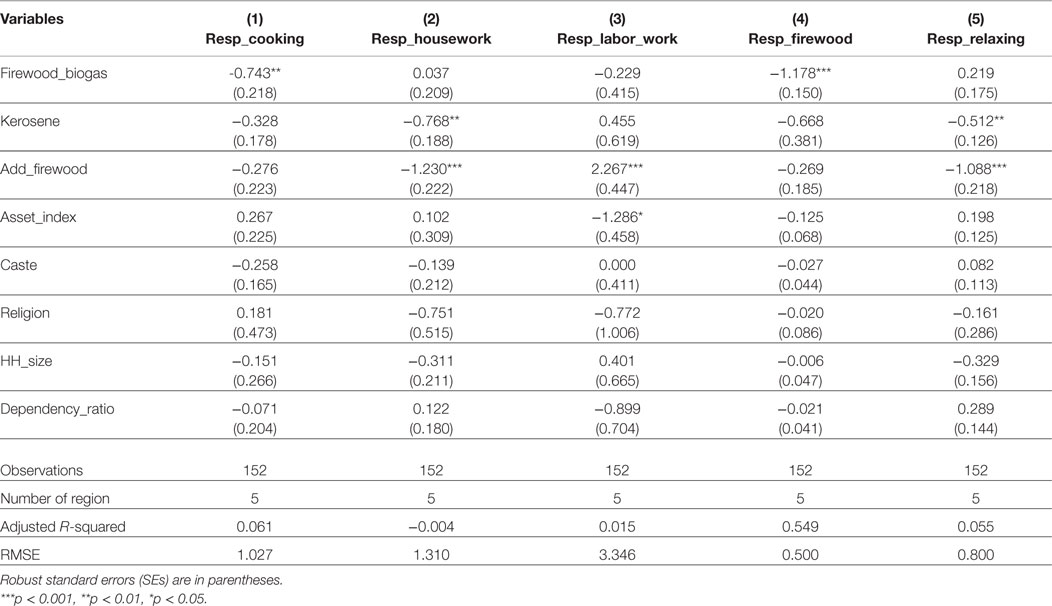
Table 3. Mixed model with fixed effects grouped by region for female household heads’ allocations of time for five activities: cooking, housework, labor work, collecting firewood, and relaxing. Biogas cook stove ownership reported as a binary variable with comparison households (0) and treatment households (1).
Results clearly show that women in households with a biogas cook stove spend significantly less time cooking and collecting firewood than women in comparison households (Table 3; Table S6 in Supplementary Material). No significant effects of owning a biogas cook stove were found on time spent doing housework, labor work, or relaxing.
Respondents from the comparison group reported spending, on average, about 0.7 more hours (~40 min) cooking and 1.2 more hours (~70 min) collecting firewood per day than respondents from the treatment group (Tables 1 and 3). This implies that women with biogas cook stoves save, on average, roughly 2 h per day just by owning these stoves. This presents an opportunity cost: while there is no guarantee of how they use the freed time, respondents with a biogas cook stove have the opportunity to re-allocate their freed time toward other activities, such as income generation, while respondents from comparison households do not have this opportunity.
Figure 4 and Table 1 further illustrate that women’s time allocations vary significantly between the treatment and comparison populations. Women with biogas cook stoves spend on average more time relaxing and less time cooking, collecting firewood, doing housework, and doing labor work than women from comparison households. However, our current findings do not provide in-depth insights or clear patterns on how women in treatment households use their extra time.
Insights from focus group discussions
Focus group discussions provide further insight on the relationships observed in the quantitative models. First, women confirmed that households with a biogas cook stove have more diverse diets. The cooking efficiency and consumer friendly nature of the stoves were mentioned as major reasons behind this trend. Because the fuel source is now self-sufficient, burning without the constant need to maintain an adequate flame, women are able to multi-task while cooking. This allows them both to add more food items to a single dish and to diversify the type and quantity of dishes included in a meal.
Furthermore, women in the focus groups communicated a variety of other positive outcomes from owning a biogas cook stove. Specifically, they indicated that risks of collecting firewood – including thorns, snakes, and harassment from men – were considerably reduced because of the biogas cook stoves. They also reported that indoor fires – caused, for example, by a sari catching fire from the wood-burning stove – happened far less frequently with the new technology. Finally, they noted that having households in the region that used biogas cook stoves decreased total wood use in the area, leaving more available for families continuing to use wood-burning stoves.
Discussion
Our quantitative and qualitative results indicate that households with access to a biogas cook stove have more diverse diets than households without the stoves (Figure 3; Table 2; Tables S3 and S5 in Supplementary Material). Results also indicate that women with a biogas cook stove spend less time cooking and collecting firewood (Figure 4; Table 3; Table S6 in Supplementary Material). This study therefore provides evidence of two distinct co-benefits of biogas cook stove interventions in the Bagepalli panchayat.
Several mechanisms may explain why diets are more diverse among households that own a biogas cook stove. Women described how using a biogas cook stove allowed them to multi-task while cooking, which in turn facilitated their ability to prepare a larger variety of items for a given meal. Women also described a range of further benefits from owning a biogas cook stove, including fire safety inside the house and decreased risks from collecting firewood.
Additional factors that may have contributed to the higher diet diversity among biogas cook stove users include the ability to adjust cooking temperatures and the elimination of indoor air pollution. With a wood-burning stove, it is difficult to control or predict stovetop temperatures. As a result, cooking more heat-sensitive dishes such as meat or fish can be challenging, and women using traditional fuel sources may have chosen to avoid these dishes, given the consequent spoilage risk involved. With a biogas cook stove, dishes with longer cooking times, such as rice could be cooked in a structured timeframe, thus facilitating the ease of cooking these other items. Given the difficulties and time involved in collecting firewood, dishes with longer cooking times may have also been cooked less frequently prior to owning a biogas cook stove in an effort to conserve wood.
Furthermore, several studies have illustrated that cooking with firewood produces larger amounts of particulate matter and carbon monoxide than alternative cook stoves (13–16). In line with this existing evidence (13, 18, 19, 21–24, 75), women in our study often reported concern about the impact of indoor air pollution on the health of their families. For households without a biogas cook stove, the health risk related to extensive cooking might limit their food choices. This information is purely anecdotal, as our study did not collect data specifically to examine this possible explanation. Further studies can provide more insights on these household decisions and behaviors.
It is important to note that the diet diversity of a household is mainly interpreted as an indicator of food access and can have little bearing on the nutrient intake of individuals in the household, where intra-household distribution of food plays an important role (34). Investigating effects on individual diet diversity will shed further light on the nutritional impact of biogas cook stoves.
Respondents with biogas cook stoves also spent significantly less time cooking and collecting firewood – approximately 2 h per day – than respondents relying on firewood stoves (Figure 4; Tables 1 and 3; Table S6 in Supplementary Material). This indicates an opportunity cost to women relying on wood-burning stoves. Female household heads with biogas stoves have the option to put their additional time toward, for example, income generation and relaxation. The value of these activities cannot be underestimated, especially given the strains of the desert climate, and that local employment often includes intense agricultural labor. Collectively, time saved by cooking on a biogas rather than wood stove becomes a significant additional benefit of this technological intervention.
Households in the treatment and comparison groups varied in certain socio-economic and cultural characteristics, such as caste and assets. PSM sought to account for these differences, by running the models on a subset of the study population that were equally likely to have received the treatment effect according to a collection of equally weighted variables (72). Results run on this data subset were robust with those using the full sample population.
Currently, there is a dearth of studies evaluating outcomes, such as diet diversity and time management, when considering the impact of alternative cook stoves (76, 77), and multiple reports have called for further research (76, 78–80). We hope that the promising results described in this paper will encourage other research and development initiatives to expand their set of impact indicators when studying the use of improved cook stoves. This will facilitate a more comprehensive understanding of the benefits and disadvantages of biogas and other alternative cook stove projects.
Conclusion
In this study, we sought to evaluate two co-benefits of a biogas cook stove project in southern India. Results indicate that owning a biogas cook stove has a significant positive correlation with household diet diversity (31, 81–83). Female heads of households with a biogas cook stove also reported spending approximately two less hours cooking and collecting firewood per day. These women have the option of putting their freed time toward other activities, such as income generation and relaxation, presenting an opportunity cost to families continuing to rely on solid fuel for cooking.
Currently, low- and middle-income countries continue to extensively use solid fuels for energy intensive activities, such as cooking. Given today’s severe global health burden from openly combusting solid fuels, it is critical to explore alternative energy sources and their implications for families transitioning to new types of cook stoves (2, 4, 5, 12). While results from this analysis may be situation specific, the positive relationships observed underscore the importance of quantifying environmental, social, and economic advantages and disadvantages of household-level technological interventions, in order to better align incentives for rural development and to understand the net merit of these technologies for participating communities.
Author Contributions
TA, RD, and RA conceived and designed the experiments; TA and SU performed the experiments; TA, RD, SW, and RR analyzed the data; all authors contributed to the writing of this paper.
Conflict of Interest Statement
The authors declare that the research was conducted in the absence of any commercial or financial relationships that could be construed as a potential conflict of interest.
Acknowledgments
Environmental Defense Fund provided the funding for this study. The authors would like to thank the Agricultural Development and Training Society (ADATS) and its members for their cooperation and constant assistance in conducting this research. The ADATS panchayat leaders as well as directors Ram and Mario Esteves deserve our heartfelt thanks for their active participation and guidance. Finally, we would like to thank Steven Hamburg, K. Kritee, Filip Tetaert, Tara Sriram, Mukhaem Pasha, and Abid Pasha for comments on this manuscript.
Supplementary Material
The Supplementary Material for this article can be found online at https://www.frontiersin.org/article/10.3389/fnut.2015.00028
References
2. Lim SS, Vos T, Flaxman AD, Danaei G, Shibuya K, Adair-Rohani H, et al. A comparative risk assessment of burden of disease and injury attributable to 67 risk factors and risk factor clusters in 21 regions, 1990-2010: a systematic analysis for the Global Burden of Disease Study 2010. Lancet (2012) 380(9859):2224–60. doi: 10.1016/S0140-6736(12)61766-8
3. Smith KR, Bruce N, Balakrishnan K, Adair-Rohani H, Balmes J, Chafe Z, et al. Millions dead: how do we know and what does it mean? Methods used in the comparative risk assessment of household air pollution. Annu Rev Public Health (2014) 35(1):185–206. doi:10.1146/annurev-publhealth-032013-182356
4. Haines A, Smith KR, Anderson D, Epstein PR, McMichael AJ, Roberts I, et al. Policies for accelerating access to clean energy, improving health, advancing development, and mitigating climate change. Lancet (2007) 370(9594):1264–81. doi:10.1016/S0140-6736(07)61257-4
5. World Health Organization. World Health Statistics 2010. Statistics DoHa, editor. Geneva: World Health Organization (2010).
6. World Health Organization. Burden of Disease from Household Air Pollution for 2012. Public Health SaEDoH, editor. Geneva: World Health Organization (2014).
7. Mobarak AM, Dwivedi P, Bailis R, Hildemann L, Miller G. Low demand for nontraditional cookstove technologies. Proc Natl Acad Sci U S A (2012) 109(27):10815–20. doi:10.1073/pnas.1115571109
8. Hanna R, Duflo E, Greenstone M. Up in Smoke: The Influence of Household Behavior on the Long-Run Impact of Improved Cooking Stoves. Cambridge, MA: Center for International Development, Harvard University (2012).
9. Reddy S, Painuly JP. Diffusion of renewable energy technologies – barriers and stakeholders’ perspectives. Renew Energy (2004) 29(9):1431–47. doi:10.1016/j.renene.2003.12.003
10. Venkataraman C, Sagar AD, Habib G, Lam N, Smith KR. The Indian National Initiative for Advanced Biomass Cookstoves: the benefits of clean combustion. Energy Sustain Dev (2010) 14(2):63–72. doi:10.1016/j.esd.2010.04.005
11. Bansal M, Saini R, Khatod D. Development of cooking sector in rural areas in India – a review. Renew Sustain Energ Rev (2013) 17:44–53. doi:10.1016/j.rser.2012.09.014
12. Anenberg S. Technology: clean stoves benefit climate and health. Nature (2012) 490(7420):343. doi:10.1038/490343e
13. Singh A, Tuladhar B, Bajracharya K, Pillarisetti A. Assessment of effectiveness of improved cook stoves in reducing indoor air pollution and improving health in Nepal. Energy Sustain Dev (2012) 16(4):406–14. doi:10.1016/j.esd.2012.09.004
14. Balakrishnan K, Parikh J, Sankar S, Padmavathi R, Srividya K, Venugopal V, et al. Daily average exposures to respirable particulate matter from combustion of biomass fuels in rural households of Southern India. Environ Health Perspect (2002) 110(11):1069–75. doi:10.1289/ehp.021101069
15. Clark ML, Peel JL, Burch JB, Nelson TL, Robinson MM, Conway S, et al. Impact of improved cookstoves on indoor air pollution and adverse health effects among Honduran women. Int J Environ Health Res (2009) 19(5):357–68. doi:10.1080/09603120902842705
16. Chowdhury Z, Le LT, Al Masud A, Chang KC, Alauddin M, Hossain M, et al. Quantification of indoor air pollution from using cookstoves and estimation of its health effects on adult women in Northwest Bangladesh. Aerosol Air Qual Res (2012) 12(4):463–U229. doi:10.4209/aaqr.2011.10.0161
17. Smith KR, Dutta K, Chengappa C, Gusain PPS, Berrueta OM, Victor B, et al. Monitoring and evaluation of improved biomass cookstove programs for indoor air quality and stove performance: conclusions from the Household Energy and Health Project. Energy Sustain Dev (2007) 11(2):5–18. doi:10.1016/S0973-0826(08)60396-8
18. Romieu I, Riojas-Rodriguez H, Marron-Mares AT, Schilmann A, Perez-Padilla R, Masera O. Improved biomass stove intervention in rural Mexico impact on the respiratory health of women. Am J Respir Crit Care Med (2009) 180(7):649–56. doi:10.1164/rccm.200810-1556OC
19. Agrawal S. Effect of indoor air pollution from biomass and solid fuel combustion on prevalence of self-reported asthma among adult men and women in India: findings from a nationwide large-scale cross-sectional survey. J Asthma (2012) 49(4):355–65. doi:10.3109/02770903.2012.663030
20. Smith KR, Uma R, Kishore V, Zhang J, Joshi V, Khalil M. Greenhouse implications of household stoves: an analysis for India. Annu Rev Energy Environ (2000) 25(1):741–63. doi:10.1146/annurev.energy.25.1.741
21. Perez-Padilla R, Perez-Guzman C, Baez-Saldana R, Torres-Cruz A. Cooking with biomass stoves and tuberculosis: a case control study. Int J Tuberc Lung Dis (2001) 5(5):441–7.
22. Norman R, Barnes B, Mathee A, Bradshaw D; South African Comparative Risk Assessment Collaborating Group. Estimating the burden of disease attributable to indoor air pollution from household use of solid fuels in South Africa in 2000. S Afr Med J (2007) 97(8):764–71.
23. Diaz E, Smith-Sivertsen T, Pope D, Lie RT, Diaz A, McCracken J, et al. Eye discomfort, headache and back pain among Mayan Guatemalan women taking part in a randomised stove intervention trial. J Epidemiol Community Health (2007) 61(1):74–9. doi:10.1136/jech.2006.043133
24. Hawley B, Volckens J. Proinflammatory effects of cookstove emissions on human bronchial epithelial cells. Indoor Air (2013) 23(1):4–13. doi:10.1111/j.1600-0668.2012.00790.x
25. Kim JE, Popp D, Prag A. The clean development mechanism and neglected environmental technologies. Energy Policy (2013) 55:165–79. doi:10.1016/j.enpol.2012.11.049
26. Jeuland MA, Pattanayak SK. Benefits and costs of improved cookstoves: assessing the implications of variability in health, forest and climate impacts. PLoS One (2012) 7(2):e30338. doi:10.1371/journal.pone.0030338
27. Jagadish KS. The development and dissemination of efficient domestic cook stoves and other devices in Karnataka. Curr Sci (2004) 87(7):926–31.
28. Bailis R, Cowan A, Berrueta V, Masera O. Arresting the killer in the kitchen: the promises and pitfalls of commercializing improved cookstoves. World Dev (2009) 37(10):1694–705. doi:10.1016/j.worlddev.2009.03.004
29. Mukhopadhyay R, Sambandam S, Pillarisetti A, Jack D, Mukhopadhyay K, Balakrishnan K, et al. Cooking practices, air quality, and the acceptability of advanced cookstoves in Haryana, India: an exploratory study to inform large-scale interventions. Glob Health Action (2012) 5:1–13. doi:10.3402/gha.v5i0.19016
30. Foote JA, Murphy SP, Wilkens LR, Basiotis PP, Carlson A. Dietary variety increases the probability of nutrient adequacy among adults. J Nutr (2004) 134(7):1779–85.
31. Ruel MT. Operationalizing dietary diversity: a review of measurement issues and research priorities. J Nutr (2003) 133(11 Suppl 2):3911S–26S.
32. Lock K, Smith RD, Dangour AD, Keogh-Brown M, Pigatto G, Hawkes C, et al. Health, agricultural, and economic effects of adoption of healthy diet recommendations. Lancet (2010) 376(9753):1699–709. doi:10.1016/S0140-6736(10)61352-9
33. De Onis M, Blössner M. The World Health Organization global database on child growth and malnutrition: methodology and applications. Int J Epidemiol (2003) 32(4):518–26. doi:10.1093/ije/dyg099
34. UNICEF. Tracking Progress on Child and Maternal Nutrition: A Survival and Development Priority. New York, NY: Division of Communication, UNICEF (2009).
35. Hatloy A, Torheim L, Oshaug A. Food variety Ð a good indicator of nutritional adequacy of the diet? A case study from an urban area in Mali, West Africa. Eur J Clin Nutr (1998) 52:891–8. doi:10.1038/sj.ejcn.1600662
36. Ruel M, Graham J, Murphy S, Allen L. Validating Simple Indicators of Dietary Diversity and Animal Source Food Intake that Accurately Reflect Nutrient Adequacy in Developing Countries. University of California at Davis, CA: Report for Global Livestock CRSP (2004).
37. Steyn N, Nel J, Nantel G, Kennedy G, Labadarios D. Food variety and dietary diversity scores in children: are they good indicators of dietary adequacy? Public Health Nutr (2006) 9(05):644–50. doi:10.1079/PHN2005912
38. Kennedy GL, Pedro MR, Seghieri C, Nantel G, Brouwer I. Dietary diversity score is a useful indicator of micronutrient intake in non-breast-feeding Filipino children. J Nutr (2007) 137(2):472–7.
39. Mirmiran P, Azadbakht L, Esmaillzadeh A, Azizi F. Dietary diversity score in adolescents – a good indicator of the nutritional adequacy of diets: Tehran lipid and glucose study. Asia Pac J Clin Nutr (2004) 13(1):56–60.
40. Ogle BM. Wild Vegetables and Micronutrient Nutrition: Studies on the Significance of Wild Vegetables in Women’s Diets in Vietnam. Uppsala: Uppsala Universitet (2001). 59 p.
41. Swindale A, Bilinsky P. Household Dietary Diversity Score (HDDS) for Measurement of Household Food Access: Indicator Guide. Washington, DC: Food and Nutrition Technical Assistance Project (2006).
42. FAO, WFP, IFAD. The State of Food Insecurity in the World 2012. Rome: Food and Agriculture Organization of the United Nations (2012).
43. Nagbrahmam D, Sambrani S. Women’s drudgery in firewood collection. Econ Polit Wkly (1983) 18(1/2):33–8.
44. Ilahi N. The Intra-Household Allocation of Time and Tasks: What Have We Learnt from the Empirical Literature? Washington, DC: World Bank, Development Research Group/Poverty Reduction and Economic Management Network (2000). p. 7–9.
45. Dhingra R, Christensen ER, Liu Y, Zhong B, Wu CF, Yost MG, et al. Greenhouse gas emission reductions from domestic anaerobic digesters linked with sustainable sanitation in rural China. Environ Sci Technol (2011) 45(6):2345–52. doi:10.1021/es103142y
46. World DataBank. World Development Indicators. World Bank (2013) [cited 2013 Jul 29]. Available from: http://databank.worldbank.org/data/home.aspx
47. World Health Organization. Household Air Pollution Exposure: Population Using Solid Fuels (Estimates). Global Health Observatory Data Repository, editor. Geneva: World Health Organization (2012).
48. World Health Organization. Burden of Disease: Deaths from Household Air Pollution. Global Health Observatory Data Repository, editor. Geneva: World Health Organization (2012).
49. World Health Organization. Clean Household Energy Can Save People’s Lives. Global Health Observatory Data Repository, editor. Geneva: World Health Organization (2014).
50. Global Land Cover 2000 database [Internet] (2003). Available from: https://ec.europa.eu/jrc/en/scientific-tool/global-land-cover
51. Global Administrative Areas [Internet]. GADM Database of Global Administrative Areas (2009) [cited 2013 November 21]. Available from: http://www.gadm.org
52. OpenStreetMap [Internet] (2013). Available from: http://www.openstreetmap.org
53. Digital Terrain Elevation Data (DTED) Level 0 – India [Internet]. GeoCommunity (2013) [cited 2013 November 25]. Available from: http://data.geocomm.com/
54. Encyclopaedia Britannica. Karnataka. In: Ghori GK, editor. Encyclopaedia Britannica Online. Online ed. Chicago, IL: Encyclopædia Britannica Inc. (2013).
55. FAO/FANTA. Introducing the Minimum Dietary Diversity – Women (MDD-W), Global Dietary Diversity Indicator for Women. Washington, DC: Food and Nutrition Technical Assistance Project (2014).
56. World Health Organization. Indicators for Assessing Infant and Young Child Feeding Practices: Part 1 Definitions. Geneva: World Health Organization (2010).
57. The World Bank. Age Dependency Ratio (% of Working-Age Population). World Development Indicators. The World Bank (2014). Web. 2 May 2015. Available from: http://data.worldbank.org/indicator/SP.POP.DPND (2014).
59. Filmer D, Pritchett LH. Estimating wealth effects without expenditure data – or tears: an application to educational enrollments in states of India*. Demography (2001) 38(1):115–32. doi:10.2307/3088292
60. Michelson H, Muñiz M, DeRosa K. Measuring socio-economic status in the millennium villages: the role of asset index choice. J Dev Stud (2013) 49(7):917–35. doi:10.1080/00220388.2013.785525
61. McKenzie DJ. Measuring inequality with asset indicators. J Popul Econ (2005) 18(2):229–60. doi:10.1007/s00148-005-0224-7
62. Chung K. Identifying the Food Insecure: The Application of Mixed-Method Approaches in India. Washington, DC: International Food Policy Research Institute (1997).
63. Carvalho S, White H. Combining the Quantitative and Qualitative Approaches to Poverty Measurement and Analysis: The Practice and the Potential. Washington, DC: World Bank (1997).
64. Vargas S, Penny ME. Measuring food insecurity and hunger in Peru: a qualitative and quantitative analysis of an adapted version of the USDA’s Food Insecurity and Hunger Module. Public Health Nutr (2010) 13(10):1488–97. doi:10.1017/S136898000999214X
65. Maxwell DG. Can Qualitative and Quantitative Methods Serve Complementary Purposes for Policy Research? Washington, DC: International Food Policy Research Institute (1998).
66. Marsland N, Wilson I, Abeyasekera S, Kleih U. Socioeconomic Methodologies for Natural Resources Research: Best Practice Guidelines [Internet]. Chatham: Natural Resources Institute, The University of Greenwich (2001).
67. United Nations World Food Programme. Comprehensive Food Security and Vulnerability Analysis Guidelines. Rome: United Nations World Food Programme (2009). 2009 p.
69. Gelman A. Scaling regression inputs by dividing by two standard deviations. Stat Med (2008) 27(15):2865–73. doi:10.1002/sim.3107
70. Cook RD, Weisberg S. Residuals and Influence in Regression. New York, NY: Chapman and Hall (1982).
71. Caliendo M, Kopeinig S. Some practical guidance for the implementation of propensity score matching. J Econ Surv (2008) 22(1):31–72. doi:10.1111/j.1467-6419.2007.00527.x
72. Dehejia RH, Wahba S. Propensity score-matching methods for nonexperimental causal studies. Rev Econ Stat (2002) 84(1):151–61. doi:10.1162/003465302317331982
73. Becker S, Ichino A. Estimation of average treatment effects based on propensity scores. Stata J (2002) 2(4):358–77.
74. Hirvonen K, Hoddinott J. Agricultural Production and Children’s Diets: Evidence from Rural Ethiopia. Washington, DC: International Food Policy Research Institute (2014) [Dec, 2014. Report No].
75. Smith KR, Samet JM, Romieu I, Bruce N. Indoor air pollution in developing countries and acute lower respiratory infections in children. Thorax (2000) 55(6):518–32. doi:10.1136/thorax.55.6.518
76. Wallmo K, Jacobson SK. A social and environmental evaluation of fuel-efficient cook-stoves and conservation in Uganda. Environ Conserv (1998) 25(2):99–108. doi:10.1017/S0376892998000150
77. Shailaja R. Women, energy and sustainable development. Energy Sustain Dev (2000) 4:45–64. doi:10.1016/S0973-0826(08)60231-8
78. Aggarwal R, Chandel S. Emerging energy scenario in Western Himalayan state of Himachal Pradesh. Energy Policy (2010) 38(5):2545–51. doi:10.1016/j.enpol.2010.01.002
79. DeFries R, Pandey D. Urbanization, the energy ladder and forest transitions in India’s emerging economy. Land Use Policy (2010) 27(2):130–8. doi:10.1016/j.landusepol.2009.07.003
80. Lewis JJ, Pattanayak SK. Who adopts improved fuels and cookstoves? A systematic review. Environ Health Perspect (2012) 120(5):637–45. doi:10.1289/ehp.1104194
81. Arimond M, Ruel MT. Dietary diversity is associated with child nutritional status: evidence from 11 demographic and health surveys. J Nutr (2004) 134(10):2579–85.
82. Kant AK. Indexes of overall diet quality: a review. J Am Diet Assoc (1996) 96(8):785–91. doi:10.1016/S0002-8223(96)00217-9
Keywords: alternative cook stove, biogas cook stove, diet diversity, nutrition, time allocation, time savings, India
Citation: Anderman TL, DeFries RS, Wood SA, Remans R, Ahuja R and Ulla SE (2015) Biogas cook stoves for healthy and sustainable diets? A case study in Southern India. Front. Nutr. 2:28. doi: 10.3389/fnut.2015.00028
Received: 09 June 2015; Accepted: 27 August 2015;
Published: 16 September 2015
Edited by:
Luca Fernando Ruini, Barilla, ItalyReviewed by:
Eda Bozkir, Kirklareli University, TurkeyPenelope Anne Field, University of Otago, New Zealand
Copyright: © 2015 Anderman, DeFries, Wood, Remans, Ahuja and Ulla. This is an open-access article distributed under the terms of the Creative Commons Attribution License (CC BY). The use, distribution or reproduction in other forums is permitted, provided the original author(s) or licensor are credited and that the original publication in this journal is cited, in accordance with accepted academic practice. No use, distribution or reproduction is permitted which does not comply with these terms.
*Correspondence: Tal Lee Anderman, Environmental Defense Fund, 123 Mission Street, San Francisco, CA 94105, USA, tal.anderman@gmail.com