
- 1Department of Animal and Avian Sciences, University of Maryland, College Park, MD, USA
- 2Bovine Functional Genomics Laboratory, USDA-ARS, Beltsville, MD, USA
Background: Previous molecular characterizations of mammary stem cells (MaSC) have utilized fluorescence-activated cell sorting or in vitro cultivation of cells from enzymatically dissociated tissue to enrich for MaSC. These approaches result in the loss of all histological information pertaining to the in vivo locale of MaSC and progenitor cells. Instead, we used laser microdissection to excise putative progenitor cells and control cells from their in situ locations in cryosections and characterized the molecular properties of these cells. MaSC/progenitor cells were identified based on their ability to retain bromodeoxyuridine for an extended period.
Results: We isolated four categories of cells from mammary epithelium of female calves: bromodeoxyuridine label retaining epithelial cells (LREC) from basal (LRECb) and embedded layers (LRECe), and epithelial control cells from basal and embedded layers. Enriched expression of genes in LRECb was associated with stem cell attributes and identified WNT, TGF-β, and MAPK pathways of self renewal and proliferation. Genes expressed in LRECe revealed retention of some stem-like properties along with up-regulation of differentiation factors.
Conclusion: Our data suggest that LREC in the basal epithelial layer are enriched for MaSC, as these cells showed increased expression of genes that reflect stem cell attributes; whereas LREC in suprabasal epithelial layers are enriched for more committed progenitor cells, expressing some genes that are associated with stem cell attributes along with those indicative of cell differentiation. Our results support the use of DNA label retention to identify MaSC and also provide a molecular profile and novel candidate markers for these cells. Insights into the biology of stem cells will be gained by confirmation and characterization of candidate MaSC markers identified in this study.
Introduction
In female mammals, growth and development of mammary glands occur primarily postnatally, with mammary function in the mature animal being tightly coupled to reproductive strategy. This dictates cycles of mammary growth, differentiation, lactation, and regression, during which mammary stem cells (MaSC) provide for the lineages of luminal and basal (myoepithelial) epithelial cells in the ducts and alveoli. Although mice have provided the primary model for study of mammary growth and development, a single model species cannot provide comprehensive knowledge. Because mammary glands of prepubertal calves have a tissue architecture resembling that of the prepubertal human breast more closely than does mouse (Capuco et al., 2002), cows provide an additional experimental model for human breast development. Increased knowledge of MaSC is directly applicable to agriculture and the development of management schemes to enhance the lifetime productivity of dairy cows and other species.
A method that has been used to identify MaSC is based upon the capacity of these cells to retain 5-bromo-2′-deoxyuridine (BrdU) labeled DNA for an extended period (Kenney et al., 2001; Welm et al., 2002; Smith, 2005; Capuco, 2007). Retention of labeled DNA strands may be attributed to the ability of stem cells to retain the parental DNA strand during asymmetric cell division (Cairns, 1975) or to quiescence of the stem cell population such that the DNA label is not diluted by frequent cell divisions (Klein and Simons, 2011). During rapid mammary growth in the mouse, label retaining epithelial cells (LREC) appear to retain label by asymmetric distribution of DNA strands, as evidenced by a rapid proliferation index of the LREC (Smith, 2005). During periods of low mammary proliferation, quiescence of the stem cell population may account for retention of label. LREC are enriched in populations that exhibit MaSC capacity, i.e., the ability to regenerate mammary epithelium upon transplantation into the cleared mammary fat pad of syngeneic mice (Welm et al., 2002).
We previously reported that LREC in mammary epithelium of calves were localized in the basal layer (LRECb) and in the embedded (LRECe) layers between the basal and luminal cells of a multilayered epithelium (Capuco, 2007; Capuco et al., 2009). The LREC in bovine mammary gland appeared to have a modest proliferation rate in which 5.4% of LREC co-expressed Ki-67 (Capuco, 2007). LRECb were estrogen receptor-α (ESR1) -negative and hypothesized to be MaSC, whereas the LRECe were a mixed population of ESR1-positive and -negative cells that were hypothesized to be progenitor cells (Capuco, 2007; Capuco et al., 2009). The estrogen receptor status of MaSC is of considerable interest because of the importance of estrogens for MaSC function, mammary ductal growth, and tumorigenesis. MaSC of mouse and human are ESR1-negative (Anderson and Clarke, 2004; Asselin-Labat et al., 2006; Sleeman et al., 2007; Lamarca and Rosen, 2008).
Morphological evidence suggests that MaSC are basally localized within the mammary epithelium, typically underlain by cytoplasmic extensions of epithelial cells and in close proximity to ESR1-positive epithelial cells (Smith and Chepko, 2001; Brisken and Duss, 2007). However, MaSC have not been fully characterized due to technical limitations inherent in stem cell identification and in isolation of cells from known locations within the mammary epithelium. Based on fluorescence-activated cell sorting with multiple biomarkers and use of mammary transplantation methods to evaluate multi-lineage potency, Shackleton, Stingl, and colleagues obtained and characterized a population of cells, from enzymatically dispersed mammary tissue, that was enriched for MaSC (Shackleton et al., 2006; Stingl et al., 2006). Critical to the success of this pioneering approach was use of markers to deplete the population of hematopoietic (CD45 and TER119) and endothelial cells (CD31), as well as markers to select epithelial cells (CD29, CD49f), likely from a basal location, that expressed heat stable antigen (CD24). Another approach utilized for enrichment and characterization of human MaSC involved characterization of mammary epithelial cells that possess multipotency potential in vitro (Dontu et al., 2003).
Cell sorting techniques have also been applied to suspensions of bovine mammary cells in an attempt to enrich for MaSC. Motyl et al. (2011) isolated and evaluated gene expression in a population of mammary cells that were isolated on the basis of SCA1 expression and showed up-regulation of genes that are characteristic of hematopoietic cells. However, because accompanying micrographs clearly show that most SCA1-positive cells were in the mammary stroma and methods to enrich for mammary epithelial cells were not employed, the gene expression profile likely cannot be attributed to MaSC. Furthermore, previous research indicates the likelihood of hematopoietic cells populating the mammary stem cell niche is highly unlikely (Niku et al., 2004). Research by Martignani et al. (2010) utilized aldehyde dehydrogenase (ALDH) activity as a selection criterion for cell sorting and demonstrated that cells with low ALDH activity were capable of regenerating functional structures of mammary epithelium within collagen gels implanted beneath the kidney capsule of immunodeficient mice. This latter study not only provides data pertaining to characteristics of bovine bipotent progenitor cells, but validates a means to assess such potency. Most recently, Rauner and Barash (2012) used the multiparameter cell sorting technique developed for enrichment of murine MaSC (Shackleton et al., 2006) to obtain and characterize four populations of mammary epithelial cells from dissociated bovine mammary gland. The differentiation and growth potential of the cells were assessed by in vitro colony formation and mammosphere assays. This study confirmed many of the general aspects of MaSC/progenitor cells evident in mouse and human studies. The four populations included putative bovine MaSC (CD24medCD49fpos) that were bipotent (myoepithelial and luminal) and possessed a high growth rate; basal bipotent progenitors with medium growth rate and low sphere generating potential; luminal unipotent progenitors with low growth rate; and luminal unipotent cells with very limited proliferative activity. Although putative MaSC typically possessed little or no ALDH activity, as reported previously (Martignani et al., 2010), 0.4% of total viable cells expressed high ALDH activity, which they hypothesized represent the MaSC population.
In addition to issues pertaining to the isolation of MaSC from a mixed suspension of mammary cells, all previous studies have evaluated MaSC after removing them from their stem cell niche, i.e., the microenvironment of surrounding signaling molecules and other non-cellular components that support stem cell function and survival. We have taken an approach that retains histological information by characterizing gene expression in putative MaSC directly after their in situ excision from the mammary epithelium. The histological location of all cells interrogated was known.
In the present study, putative stem and progenitor cells (LREC) were identified and excised from cryosections using laser microdissection. It must be recognized that identification of putative MaSC and progenitor cells on the basis of long-term retention of DNA label is to select the cells based upon their life-history (i.e., the extent of label retention represents an integration of the cell’s past proliferation and differentiation events). Consequently, one would anticipate that selecting putative MaSC and progenitor cells based on label retention is likely to represent enrichment for these cell populations. In this study, LREC and neighboring epithelial control (non-LREC) cells were excised from two different locations: basal and embedded layers of the mammary epithelium. We hypothesized that LRECb are enriched for MaSC whereas LRECe are enriched for more committed progenitor cells, and that by comparing the transcriptomes of these cells with neighboring control cells we would obtain molecular profiles and biomarkers for MaSC and progenitor cells. Results are consistent with these hypotheses and provide novel candidate markers for MaSC and progenitor cells.
Materials and Methods
Experimental Animals and Mammary Tissue
Use of animals for this study was approved by the Beltsville Agricultural Research Center’s Animal Care and Use Committee. Tissues for this study were obtained from five Holstein heifers at approximately 5 months of age (4.8 ± 0.05, mean ± SE). At approximately 3 months of age, heifers were injected intravenously with BrdU (Sigma-Aldrich Co., St. Louis, MO, USA) for five consecutive days. BrdU was administered in a saline solution containing 20 mg BrdU/ml (0.9% sodium chloride; pH 8.2) at a dosage of 5 mg/kg body weight, as described previously (Capuco, 2007). Heifers were sacrificed humanely at the Beltsville Agricultural Research Center abattoir 45 days after the last BrdU injection. Mammary tissue (∼5 mm × 5 mm × 5 mm) was collected from the outer parenchymal region (region in close proximity to the border with mammary fat pad) of a rear mammary gland. Individual samples were immediately embedded in OCT compound (Sakura, Torrance, CA, USA), frozen in liquid nitrogen vapor and stored at −80°C until use.
Cryosections of 8 μm thickness were thaw-mounted on ultraviolet-irradiated PEN slides (Leica AS, Wetzlar, Germany) and stored at −80°C until BrdU immunostaining and laser microdissection within 8 days. Mammary tissues harvested for histological validation of microarray data were fixed overnight in 10% neutral buffered formalin at 4°C and then stored in 70% ethanol until further processing. Tissues were then dehydrated and embedded in paraffin according to standard techniques and sectioned at 5 μm thickness onto Superfrost-plus™ slides (Erie Scientific Co., Portsmouth, NH, USA).
BrdU Immunostaining to Identify Putative MaSC
Putative MaSC were identified as those cells in cryosections that retained BrdU label (Figure 1D), visualized using an optimized method for BrdU immunostaining that retains RNA quality in tissue cryosections (Choudhary et al., 2010). Sections were individually processed immediately before laser microdissection. The cryosections were fixed in acetone/polyethylene glycol 300 (9:1 v/v) at −20°C for 2 min and air dried for 1 min and then incubated with 0.5% methyl green for 2 min at room temperature (RT). After a brief wash (10 s) with nuclease-free phosphate buffered saline (nfPBS), 400 μl of a pre-warmed solution of 70% deionized formamide in nfPBS was pipetted onto the tissue and the section incubated at 60°C for 4 min. The section was washed with antibody dilution buffer (nfPBS with 1% normal goat serum and 0.1% triton-X 100) at 4°C on a metal plate kept on ice to prevent re-annealing of DNA strands and then incubated with mouse monoclonal anti-BrdU antibody conjugated to Alexa 488 (Clone PRB-1, 1:10 dilution, Molecular Probes, Carlsbad, CA, USA) for 5 min at RT in the dark. The section was washed briefly before counterstaining with propidium iodide (2.5 μg/μl in nfPBS). Finally, the slide was washed with nuclease-free water (10 s), dehydrated in ascending concentrations of ethanol and air dried before laser microdissection.
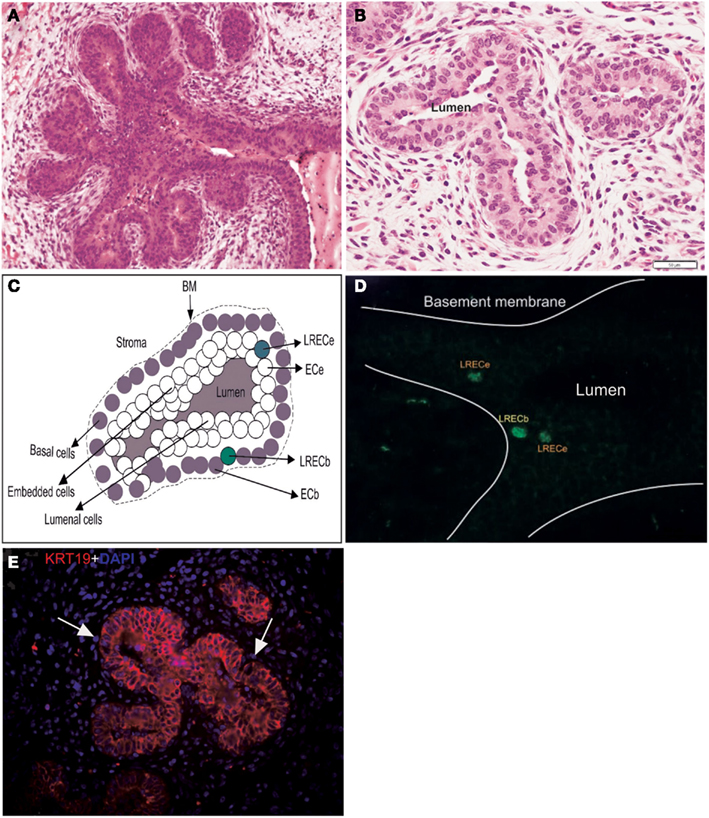
Figure 1. Characteristics and dissection of the mammary epithelium of a prepubertal heifer. (A,B) Micrographs of the terminal ductular units of a prepubertal bovine mammary gland illustrating the arborescent nature of these terminal ducts and their multilayered epithelium. (C) Diagrammatic representation of the mammary epithelium illustrating the four classes of cells dissected. BM, basement membrane. (D) Micrograph of cryosections stained for BrdU antigen prior to laser microdissection, localization of LRECb and LRECe are depicted. (E) Micrograph of epithelium of terminal ductular unit stained for KRT19. The basal layer consists of cells that are predominantly KRT19-negative.
Laser Microdissection and cDNA Amplification
Immediately after staining, sections were examined and cells excised with a laser microdissection system equipped for epifluorescence microscopy (Leica AS-LMD, Mannheim, Germany). The laser setting was determined empirically and dissection performed using the 40× objective. We dissected 6–13 cells per category per heifer. For each animal, cells in a given category were collected into the cap of a 0.2 ml thin-walled PCR tube (Biozyme Scientific GmbH, Hess Oldendorf, Germany). Total processing time for immunostaining and microdissection was less than 1 h, and only one slide was processed at a time. Four categories of cells were dissected: LREC from basal (LRECb) and embedded layers (LRECe), and epithelial control cells from basal (ECb) and embedded layers (ECe). Cells within the cap were dissolved in 2 μl of lysis buffer (WT-Ovation™ One-Direct RNA Amplification System; NuGEN Technologies, Inc., San Carlos, CA, USA). The tube was capped and centrifuged for 1 min at 14,000 × g, after which the tube and contents were vortexed gently for 30 s and centrifuged briefly before placing on ice. First stand cDNA synthesis and amplification reaction were carried out using Ribo-SPIA-based methodology according to the manufacturer’s recommendations. Concentrations of amplified cDNA were determined spectrophotometrically (ND-1000, NanoDrop Technologies, Rockland, DE, USA). A known amount of high quality RNA (250 pg) was used as positive control for cDNA amplification. Nuclease-free water was used as a no-template control for cDNA amplification. The amplified cDNA was evaluated using RNA Nano-chips to estimate the median fragment size (Agilent Technologies, Palo Alto, CA, USA). Median fragment size for amplified samples was similar to the positive control and fell within the expected range of 100–300 bp, whereas products for the no-template control were <50 bp.
Microarray Analysis
Oligonucleotide microarray analysis was performed using a custom bovine microarray (Nimblegen, Inc., Madison, WI, USA) as described previously (Li et al., 2006). The bovine microarray consisted of 86,191 unique 60-mer oligonucleotides, representing 45,383 bovine sequences. The array design was based upon a TIGR assembly (release 11.0 from 2004). However, all 60-mer oligonucleotides on the array were annotated against current bovine RefSeq databases as well as the latest version of ENSEMBL bovine gene build v65.0 (released on December 20111). After hybridization, scanning, and image acquisition, the data were extracted from the raw images using NimbleScan software (NimbleGen). A total of 21 microarrays (five animals × four categories of cells, and no-template amplification control) were used. Relative signal intensities (log2) for each feature were generated using the robust multi-array average algorithm (Irizarry et al., 2003) and data were processed based on the quantile normalization method (Bolstad et al., 2003). Only oligos that provided hybridization signal intensities for samples that exceeded 3× the signal intensity obtained with the no-template amplification control (water blank) were included in the analysis. Furthermore, only sample signal intensities exceeding twice the array background intensity (mean of lowest 3% of oligo intensities) were considered for analysis.
P values were calculated using a modified t-test. Fold changes were calculated as the ratio of the means of background-adjusted, normalized fluorescent intensity of cells of interest to their respective controls. Group-wise comparisons were performed in accordance with recommendations of the Microarray Quality Control project (Shi et al., 2006, 2008) based on t-test (P < 0.05) followed by fold change (twofold as a cutoff) to determine significance. These criteria were shown to achieve a balance of reproducibility, sensitivity, and specificity, using single or multiple microarray platforms (Shi et al., 2006, 2008; Chin et al., 2009, 2010; Wang et al., 2011). Based upon these criteria, genes that were differentially expressed were then subjected to pathway analysis (IPA, Ingenuity Systems2).
The microarray data discussed in this publication have been deposited in NCBI’s Gene Expression Omnibus (Edgar et al., 2002) and are accessible through GEO Series accession number GSE315413.
Realtime Quantitative RT-PCR
Realtime quantitative RT-PCR (qRT-PCR) was performed using aliquots of amplified cDNA from all animals and an IQ SYBR Green Supermix kit (Bio-Rad Laboratories, Hercules, CA, USA). Each reaction was performed in a 25 μl reaction volume containing 200 nM of each amplification primer and 2 ng of cDNA. The amplification was performed in a Bio-Rad iCycler using the following protocol: 95°C – 60 s; 45 cycles of 94°C – 15 s, 61°C – 30 s, and 72°C – 30 s. A melting curve analysis was performed for each primer pair. Standards were prepared from PCR amplicons purified using the QIAquick purification kit (Qiagen Inc., Valencia, CA, USA). Product concentrations were determined using the Agilent 2100 BioAnalyzer and DNA 500 kits (Agilent Technologies) and diluted to contain 1 × 10² to 1 × 10⁸ molecules/μl. Quantity of cDNA in unknown samples was calculated from the appropriate external standard curve run simultaneously with samples.
Immunohistochemistry
Paraffin sections were dewaxed in xylene and hydrated in a graded series of ethanol to phosphate buffered saline (PBS, pH 7.4). Tissue sections were quenched with 3% H2O2 in PBS for 10 min and then washed in PBS. Antigen retrieval was performed by incubation with 70% formamide in PBS at 60°C for 5 min, or microwave heating in 10 mM Tris containing 1 mM EDTA, pH 9.0 (5 min heat, 5 min rest, 5 min heat, 25 min cooling). Sections were blocked with casein (CAS-block™, Invitrogen, Carlsbad, CA, USA). Primary antibodies NR5A2, NUP153, and HNF4A (Abcam Inc., Cambridge, MA, USA) were used at 1:200 dilution and FNDC3B (Santa Cruz, Santa Cruz, CA, USA) at 1:50. Sections were incubated with primary antibody for 2 h at RT or overnight at 4°C. After washing in PBS, sections were incubated with horseradish peroxidase-conjugated broad spectrum secondary antibody (ImmPRESS anti-mouse/anti-rabbit, Vector Labs, Burlingame, CA, USA). Positively labeled cells were visualized brown or purple using 3,3′-diaminobenzidine or ImmPACT VIP (Vector Labs), respectively. Slides were washed and then counterstained with hematoxylin or methyl green.
To determine if cells expressing FNDC3B were LREC, dual antigen labeling was performed. Tissue sections were processed as described earlier and incubated with mouse monoclonal BrdU antibody (Clone BMC 9318, 2 μg/ml; Roche Diagnostics Corp., Indianapolis, IN, USA) for 2 h at RT. Sections were then incubated with vector ImmPRESS anti-mouse polymer detection reagent (Vector Labs) for 20 min, followed by washing in PBS. BrdU was detected by incubation for 10 min with the chromagen 3,3′-diaminobenzidine. Sections were then washed in deionized water. Peroxidase activity was quenched for a second time with 3% H2O2 in PBS, followed by washings with water. Sections were blocked with casein and then incubated overnight at 4°C with FNDC3B rabbit polyclonal antibody (1:50 dilution), washed, and then incubated with horseradish peroxidase-conjugated broad spectrum secondary antibody. Sections were washed with PBS and FNDC3B staining was visualized after incubation with a contrast purple chromogen, ImmPACT™ VIP peroxidase substrate (Vector Labs). Sections were washed in deionized water, counterstained with 0.5% aqueous methyl green (Vector Labs), differentiated in 0.05% acetic acid/acetone, washed dehydrated in ethanol, cleared in xylene, and mounted in DPX (Sigma). Omission of primary antibodies was used for negative controls.
Immunofluorescence staining was performed, as described previously (Capuco, 2007), to determine the ESR1 status of LREC by assessing the co-localization of BrdU and ESR1.
Results
Identification of LREC in the Terminal Ductular Units of Bovine Mammary Gland
During the period of ductal morphogenesis, the prepubertal mammary gland grows allometrically and mammary ducts expand into the surrounding mammary fat pad (Capuco et al., 2002; Meyer et al., 2006). The terminal ductular units of the prepubertal mammary gland, which are prevalent at this time, are arborescent structures composed of a multilayered epithelium (Capuco et al., 2002; Figures 1A,B). One approach, which we have utilized, to identify putative stem cells is based on the observation that somatic stem cells often retain labeled DNA strands for a prolonged period after initial labeling with tritiated thymidine or BrdU (Potten et al., 1978; Bickenbach, 1981). In mice, intestinal crypt cells (Potten et al., 2002), muscle satellite cells (Conboy et al., 2007), and putative MaSC (Welm et al., 2002; Smith, 2005) retain labeled DNA. Although long-term retention of BrdU does not appear to be a universal marker for somatic stem cells, it appears to provide a means for identifying putative stem/progenitor cells in mammary gland. After staining BrdU-labeled cells in cryosections without compromising RNA quality (Choudhary et al., 2010), we employed laser microdissection to collect LREC from basal and embedded layers of the mammary epithelium, along with appropriate control cells (Figures 1C,D). The transcriptome of these cells was interrogated by microarray analysis, from which we based our characterization of these interesting LREC in bovine mammary gland.
Transcriptomes of LRECb vs. ECb
To evaluate the hypothetical stem cell nature of LRECb, we compared the transcript profiles of LRECb vs. neighboring control cells (ECb). This analysis identified 605 genes that were differentially expressed between these two cell types (Table S1 in Supplementary Material). Of these, 476 corresponded to genes that were functionally annotated in the Ingenuity Pathway Analysis database. Differentially expressed genes were involved in pathways linked to cancer, gene expression, cell growth and proliferation, and cell death (Table S2 in Supplementary Material). A number of genes with documented relevance to MaSC were identified in this analysis (Tables 1 and 2). Low expression of ESR1 and high expression of ALDH 3B1 (ALDH3B1) in LRECb were consistent with MaSC character. Similar to the situation in mouse and human, putative bovine MaSC (LRECb) appear to be ESR1-negative (Capuco et al., 2009; Figures 7E,F), and increased ALDH activity is consistent with MaSC/progenitor character (Douville et al., 2009; Martignani et al., 2010; Rauner and Barash, 2012). Increased abundance of HNF4A, NR5A2, NES, TERF1, NUP153, and FNDC3B mRNA and decreased abundance of X-chromosome inactivation factor (XIST) in LRECb are noteworthy (Table 1 and Table S1 in Supplementary Material). Hepatocyte nuclear factor (HNF4A) is a liver stem cell transcription factor (Battle et al., 2006; Delaforest et al., 2011), NR5A2 is a pluripotency transcription factor analogous to OCT4 (Heng et al., 2010), Nestin (NES) is a neural stem cell marker (Wiese et al., 2004), and TERF1 (Telomeric repeat binding factor 1) is a marker for human and mouse embryonic stem cells (Ginis et al., 2004). FNDC3B has been characterized as a marker of proliferation and cell migration. The absence or very low abundance of XIST, in LRECb is consistent with MaSC identity, as absence of XIST expression and low XIST expression have been associated with hematopoietic stem and progenitor cells, respectively (Savarese et al., 2006). Transcripts of several genes that are involved in epigenetic modification of chromatin were also enriched in LRECb. Relative to ECb, LRECb expressed a greater number of transcription regulators, zinc fingers, and nuclear transporters (e.g., NUP153, IPO13). Importin 13 (IPO13) is a nucleocytoplasmic transport protein, which may serve as a marker for corneal epithelial progenitor cells (Wang et al., 2009). Because elements of the nuclear pore complex and importin are frequently down-regulated following cell differentiation (Yasuhara et al., 2009), increased expression of NUP153 and IPO13 in LRECb suggests that LRECb are undifferentiated epithelial cells. Recent research by Sherley and colleagues was undertaken to discover biomarkers for distributed stem cells, based upon identification of genes that are tightly coupled to asymmetric self renewal of cells in culture (Noh et al., 2011). Among the genes identified by these researchers, expression of EPHX1, MTBP, COL11A1, and ARHGAP was increased in LRECb in the current experiment. Finally, expression of cytokeratin markers was consistent with expression by MaSC. The basal epithelial cells were KRT19-negative (Figure 1E), and transcriptome analysis indicated that KRT5 was strongly down-regulated in LRECb, consistent with MaSC (Petersen and Polyak, 2010). Transcripts for fibroblast growth factors (FGF1, FGF2, FGF10), insulin-like growth factor-2 (IGF2) and follistatin (FST) were also enriched in LRECb. Overall, the gene expression profile of LRECb is consistent with MaSC character (Tables 1 and 2).
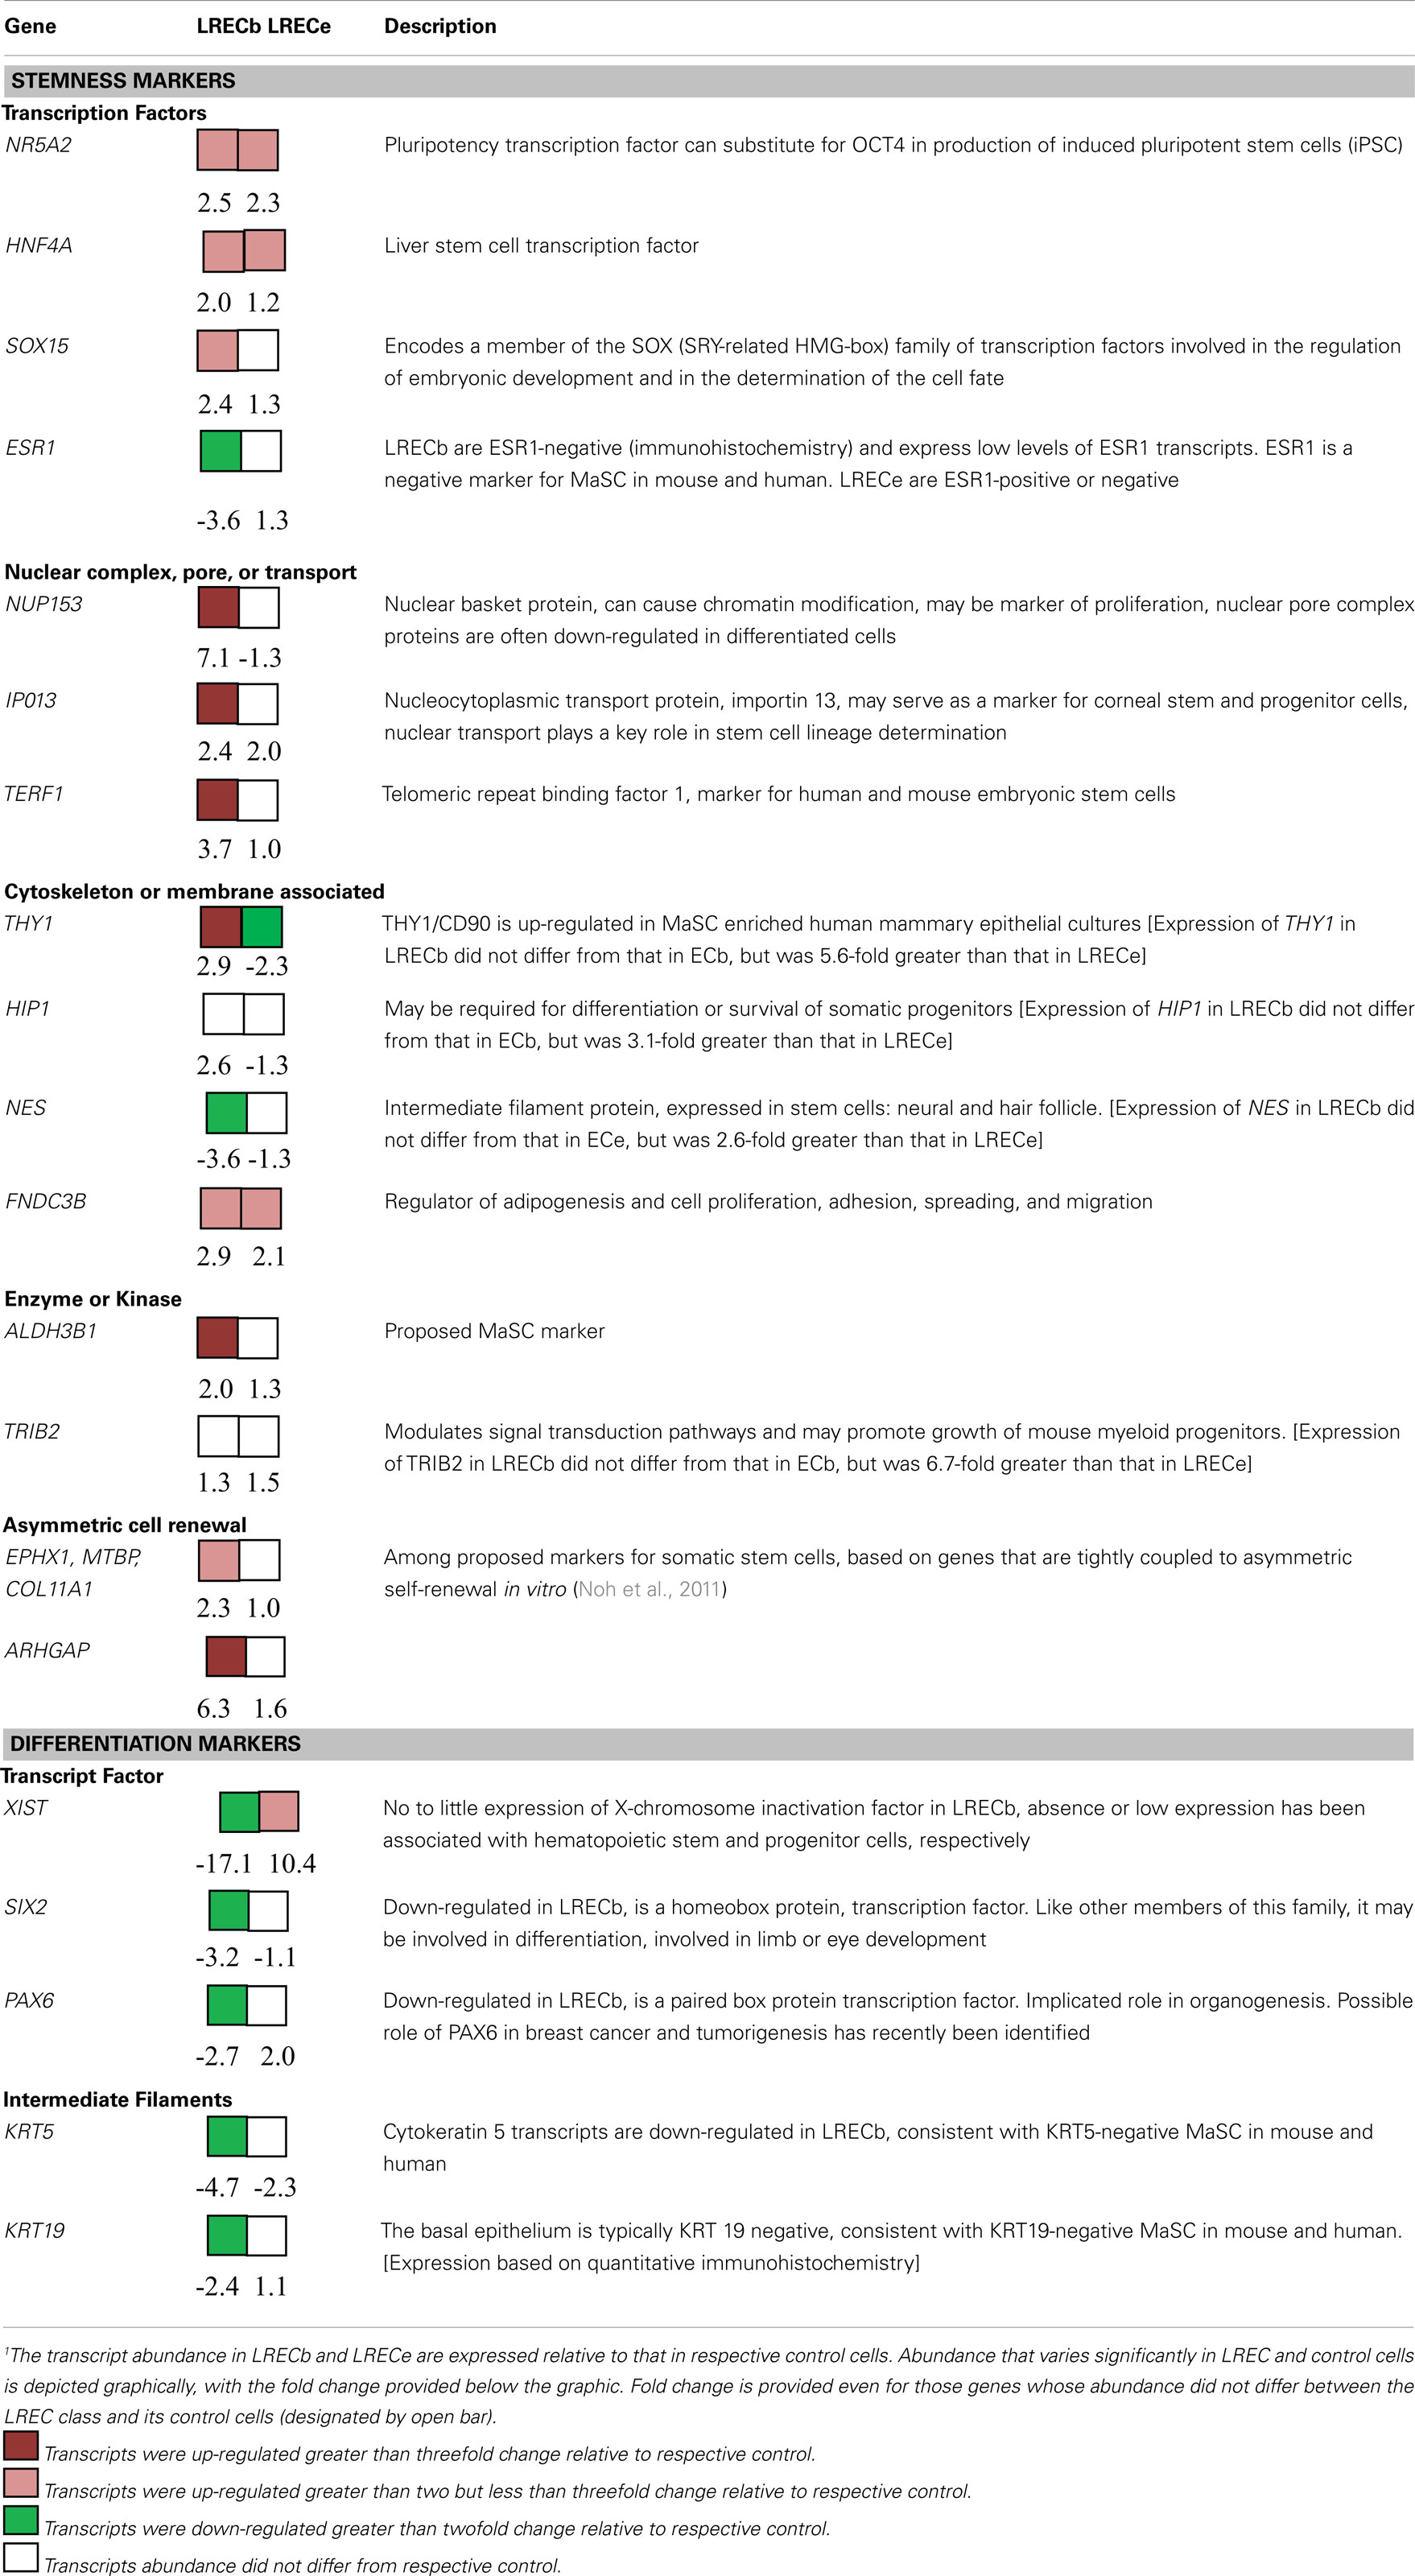
Table 1. Attributes of LREC in prepubertal bovine mammary epithelium1.
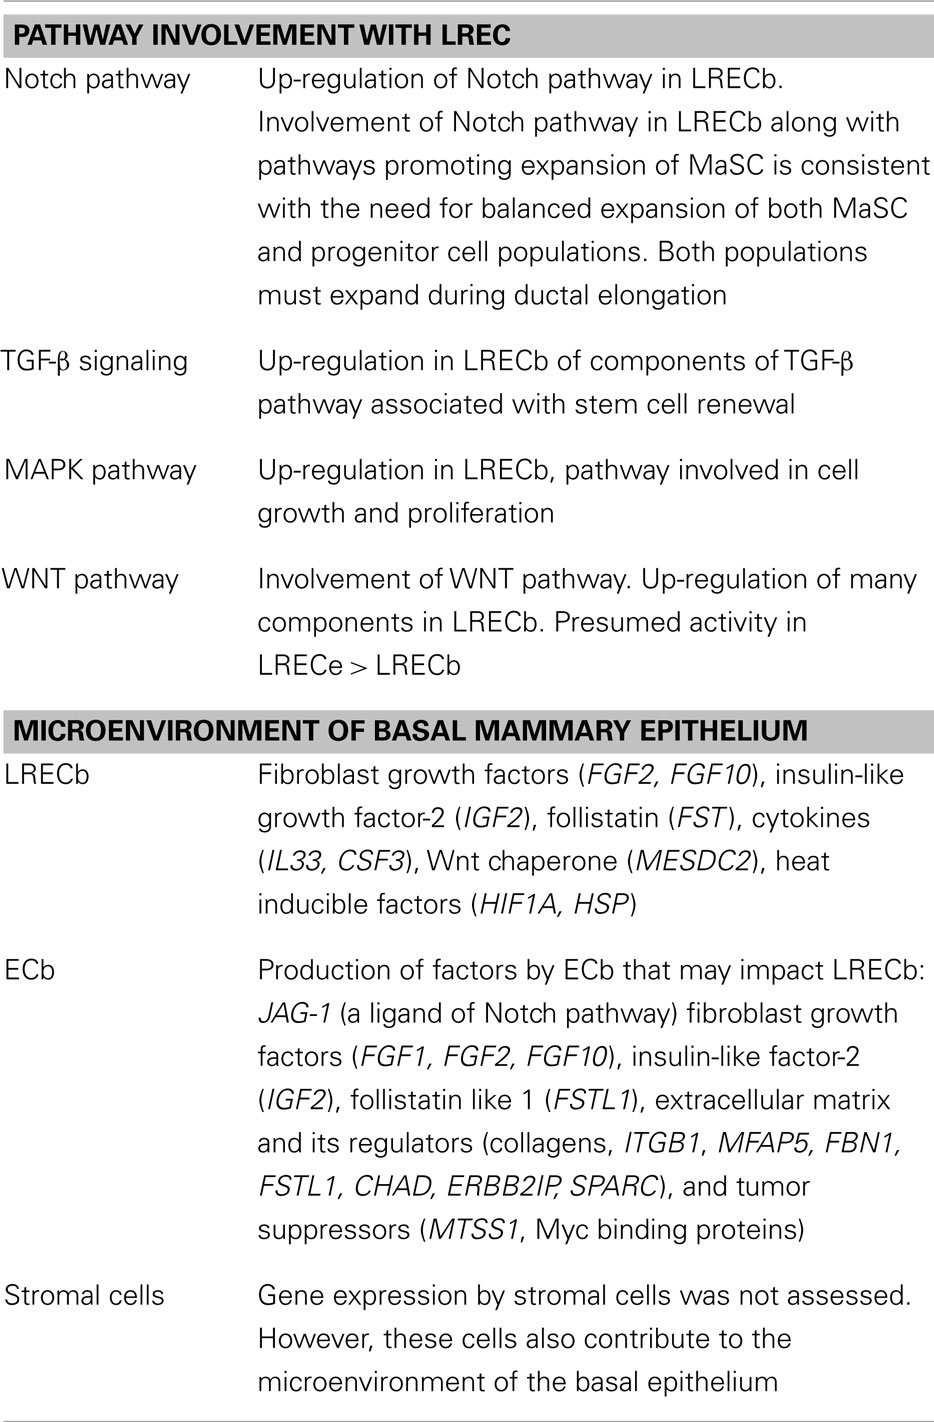
Table 2. Pathways in LREC and microenvironment of the basal mammary epithelium.
Further evidence in support of the stem cell nature of LRECb comes from biological pathway analysis of differentially expressed genes. Ingenuity Pathway Analysis of genes that were differentially expressed in LRECb and ECb revealed biological processes and networks that were highly significant. (Significance of a biologically relevant network of genes was expressed in IPA score, which was derived from P-value and indicates likelihood of the focused genes in a network being found together due to random chance. The IPA score is expressed as the negative log of the P-value.) The most significant networks associated with LRECb related to cellular growth and proliferation (Figure 2A, IPA score = 58), and cell cycle and post translational modification (Figure 2B, IPA score = 34). The network of cellular growth and proliferation (Figure 2A) contains a single module with HNF4A, up-regulated in LRECb, as the hub. Down-regulation of developmental genes like SIX2 and XIST suggests that LRECb are undifferentiated cells. KEGG pathway analysis using DAVID (Huang da et al., 2009) revealed that genes which were differentially expressed in LRECb vs. ECb reflected up-regulation of several pathways. These included the MAPK pathway (FGF1, FGF2,FGF10, TAOK3, BRAF, ATF4, CREB, HSPA8, PDGFB, CDC25B), a pathway involved in cellular growth and proliferation, and the WNT (DVL2, PPP2R5E, SMAD4) and TGF-β (FST and SMAD4) pathways, which are associated with stem cell renewal (Esmailpour and Huang, 2008; Mazumdar et al., 2010). In contrast to other members of the WNT pathway, HOXA9 was strongly down-regulated in LRECb.
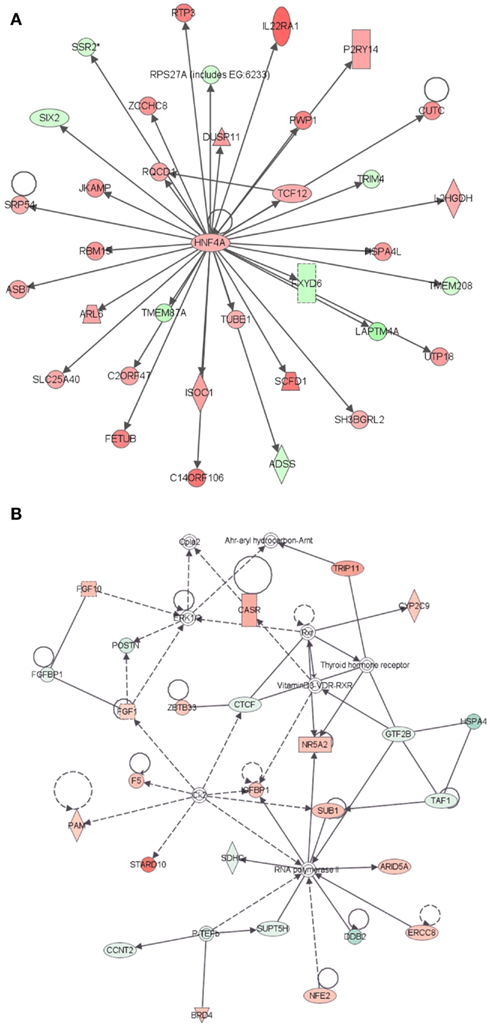
Figure 2. Ingenuity Pathway Analysis (IPA) of genes differentially expressed in LRECb vs. ECb. Genes that were differentially expressed in LRECb vs. ECb were imported into IPA software, which revealed the involvement of several networks pertinent to LRECb. Network (A) pertains to cellular growth and proliferation and shows a single module with HNF4A at its hub. Network (B) relates to cell cycle and post translational modification. Red color denotes up-regulation in LRECb and green color denotes down-regulation in LRECb relative to control cells. The IPA legend is shown in Figure A1 in Appendix.
Transcriptomes of LRECe vs. ECe
Comparison of transcriptome profiles of LRECe and neighboring ECe identified 101 functionally annotated genes that were differentially expressed (Table S1 in Supplementary Material) and supports classification of LRECe as progenitor cells (Table 1). The most significant network associated with these genes was related to cancer (Figure 3A, IPA score = 51), followed by a network associated with DNA replication, recombination and repair (Figure 3B, IPA score = 36) that contained a HNF4A module. Conservation of the HNF4A module in LRECe and LRECb suggests a hierarchical similarity between LRECe and LRECb; although HNF4A transcripts were not significantly up-regulated in LRECe and genes involved in this module differed between the two categories of LREC. Enriched expression of NR5A2 and FNDC3B in both LRECe and LRECb (vs. ECe and ECb, respectively) provides another line of evidence for the similarity of LREC in basal and embedded epithelial layers. KEGG pathway analysis (DAVID) of transcripts that were up-regulated in LRECe vs. ECe identified up-regulation of the WNT pathway (DVL3, ADCY6, CAMK2D) and down-regulation of an inhibitor of the WNT pathway, (CAMK2N1).
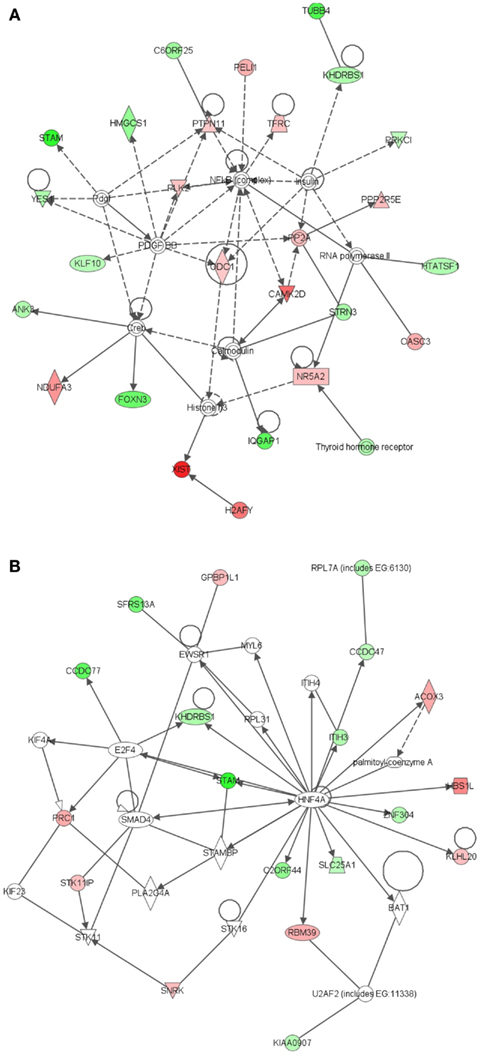
Figure 3. Ingenuity Pathway Analysis (IPA) of genes differentially expressed in LRECe vs. ECe. Genes that were differentially expressed in LRECe vs. ECe were imported into IPA software, which revealed the involvement of several networks pertinent to LRECb. Network (A) relates to cancer. Network (B) pertains to DNA replication, recombination and repair and contains a HNF4A module. Red color denotes up-regulation in LRECe and green color denotes down-regulation in LRECe relative to control cells. The IPA legend is shown in Figure A1 in Appendix.
Transcriptomes of LRECb vs. LRECe
To evaluate the relative characteristics of LRECb and LRECe, transcript profiles for these cells were compared. We identified 269 genes that were differentially expressed in LRECb vs. LRECe (Table S1 in Supplementary Material). Relatively high expression of stem cell markers, growth, and survival factors, DNA repair enzymes and low expression of apoptotic genes and differentiation markers supported greater “stemness” of LRECb vs. LRECe (Tables 1– 3). The molecular profile of LRECb included increased abundance of transcripts for stem cell markers (NR5A2, NES, THY1), as well as cell survival and proliferation factors (IGF2, FGF2, FGF10, HSPB6, LAMC1, CSF3, FST, IL33, MESDC2, AGT). Additionally, enriched expression of cell adhesion molecules (CADM3, NCAM1, AOC3), and a number of cell surface markers (ANXA6, CCR1, CCR4, CXCR4, DRD2, GNB4, GRB14, SAT2, SDPR, THY1/CD90, TRIB2) were noted in LRECb. THY1 has been used as a marker for hematopoietic progenitor cells (Goldschneider et al., 1978; Craig et al., 1993), mesenchymal stem cells (Gargett et al., 2009), and mammary cancer stem cells (Diehn et al., 2009). The LRECe displayed increased expression of XIST, splicing factor arginine/serine-rich 5 (SFRS5), THAP domain containing apoptosis associated protein 3 (THAP3), and calcium/calmodulin-dependent protein kinase II delta (CAMK2D). Increased expression of glucose metabolic enzymes, glucose phosphate isomerase (GPI), and UDP-glucose pyrophosphorylase 2 (UGP2) was also evident in LRECe vs. LRECb. KEGG pathway analysis (DAVID) revealed up-regulation of the Notch pathway in LRECb (DVL2 an inhibitor of the pathway is down-regulated, CAMK2D and MAML3 are up-regulated).
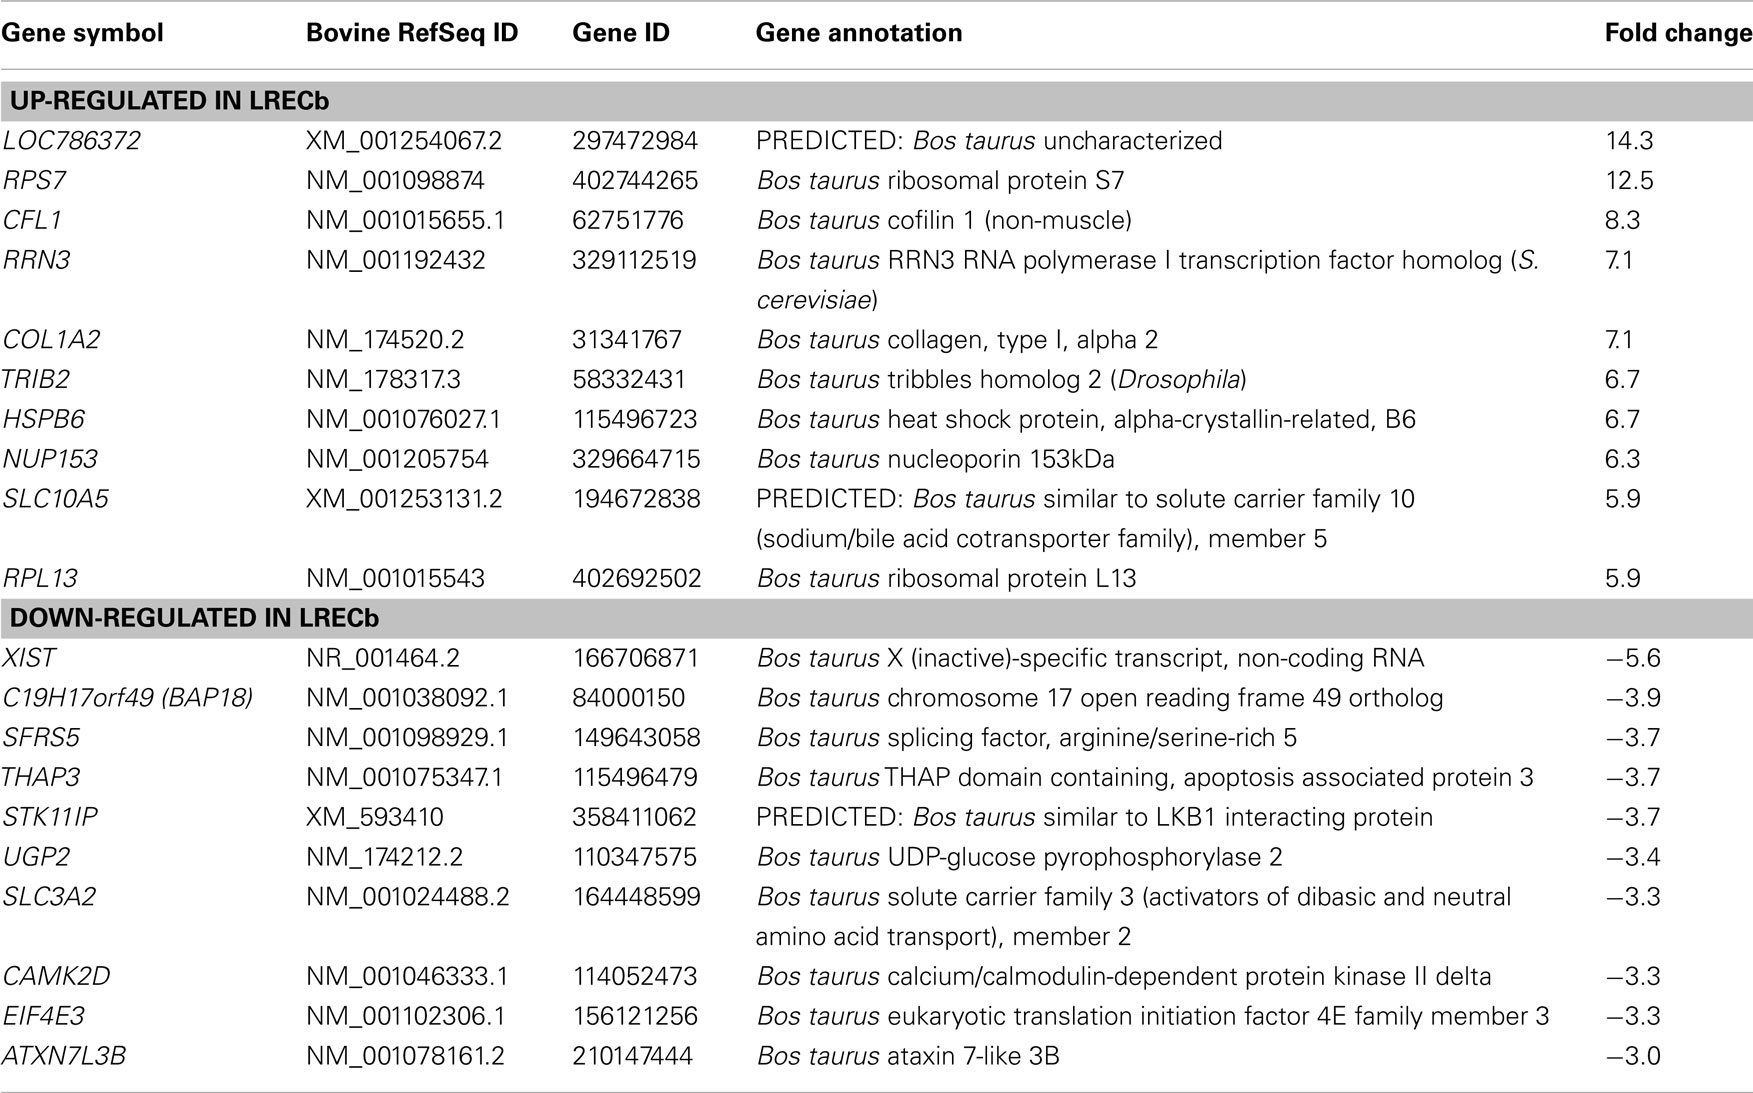
Table 3. Top 10 up-regulated and down-regulated genes in LRECb vs. LRECe.
The most significant network associated with genes that were differentially expressed in LRECb vs. LRECe was related to tissue development, cell growth, and proliferation (Figure 4A, IPA score = 43). This network showed up-regulation in LRECb of HIP1, which may be required for differentiation or survival of somatic progenitors, and TRIB2, which modulates signal transduction pathways and may promote growth of mouse myeloid progenitors. This was followed by a network associated with tissue injury (Figure 4B, IPA score = 34), featuring up-regulation of a heat shock protein module in LRECb. The top three canonical pathways identified by IPA for genes that were preferentially expressed by LRECb (LRECb vs. LRECe) pertained to: the mitotic roles of polo-like kinases, cleavage, and polyadenylation of pre-mRNA, and chemokine signaling. Because polo-like kinases are key centrosome regulators and asymmetric localization of polo-kinase promotes asymmetric division of adult stem cells (Rusan and Peifer, 2007), the polo-like kinase pathway may be particularly noteworthy.
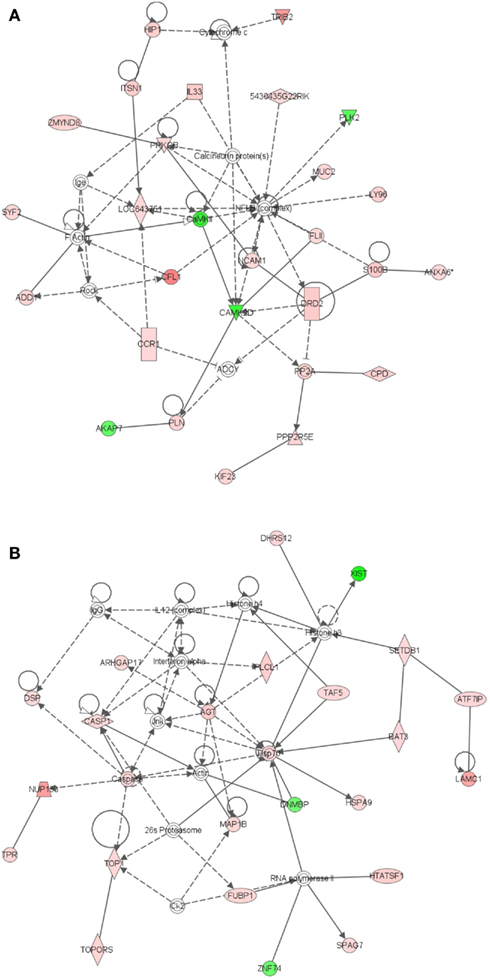
Figure 4. Ingenuity Pathway Analysis (IPA) of genes differentially expressed in LRECb vs. LRECe. Genes that were differentially expressed in LRECb vs. LRECe were imported into IPA software, which revealed the involvement of several networks pertinent to LRECb. Network (A) pertains to tissue development, cell growth and proliferation. Network (B) is associated with tissue injury and contains a heat shock protein module that was up-regulated in LRECb. Red color denotes up-regulation in LRECb and green color denotes down-regulation in LRECb relative to control cells. The IPA legend is shown in Figure A1 in Appendix.
Transcriptomes of ECb vs. ECe
Epithelial cells isolated from basal and embedded layers exhibited transcriptome profiles that were consistent with their location. Analysis identified 317 genes that were differentially expressed (Table S1 in Supplementary Material), 263 of which were functionally annotated. Among these, ECb expressed increased transcript levels for cell structural and motility genes, including actin (ACTA2), myosin (MYH8, MYO6, MRCL3), SPTBN1 (actin cross linking scaffold protein), and TSPAN31. Transcripts for JAG-1 (ligand of Notch pathway) and FST like 1 (FSTL1) were enriched in basal epithelium. The enriched expression of integrin-β1 (ITGB1) within ECb was consistent with its use as a marker to isolate MaSC (Shackleton et al., 2006), most likely to enrich the sorted population for basal epithelial cells. Additionally, a number of heat shock proteins (HSPA8, HSPA4, HSP90AB1), peptidases (USP4, USP16, USP25, PSMD14, MME), ribosomal proteins, translational regulators, components of the ECM and its regulators (collagens, MFAP5, FBN1, FSTL1, CHAD, ERBB2IP, SPARC), and tumor suppressors [MYCBP2, and MTSS1 (LOC788499)] were also up-regulated in ECb. However, transcripts of membrane transporters (AP1M1, APOE, AQP7, SLC13A3, SLC38A3, TMED3, CLCN3) were more highly expressed in ECe than ECb. Thus, control cells harvested from basal and from embedded layers within the mammary epithelium possess different characteristics and appear to represent two distinct cell populations.
To better understand key biological processes occurring in basal and embedded epithelium, we utilized Ingenuity Pathway Analysis to generate gene networks and canonical pathways for genes that are differentially expressed between ECb and ECe. All identified networks (networks of endocrine system development and function, cancer, cell cycle, tissue development) were highly significant as measured by IPA score (ranges from 35 to 42). The identified network for endocrine development and function, lipid metabolism (Figure 5A) features an estrogen signaling module, peptidase, Ubiquitination, and ubiquitin modules. The identified network for cancer (Figure 5B) contains two heat shock protein modules. The canonical pathways identified by IPA analysis were protein ubiquitination, hypoxia signaling, and clathrin mediated endocytosis. Extrinsic growth factors and regulators, and hypoxia inducing factor have been identified as molecules prevalent in the stem cell niche (Li and Xie, 2005; Mazumdar et al., 2010), transcripts for these molecules are expressed in the basal epithelium (Table 2; Figure 6).
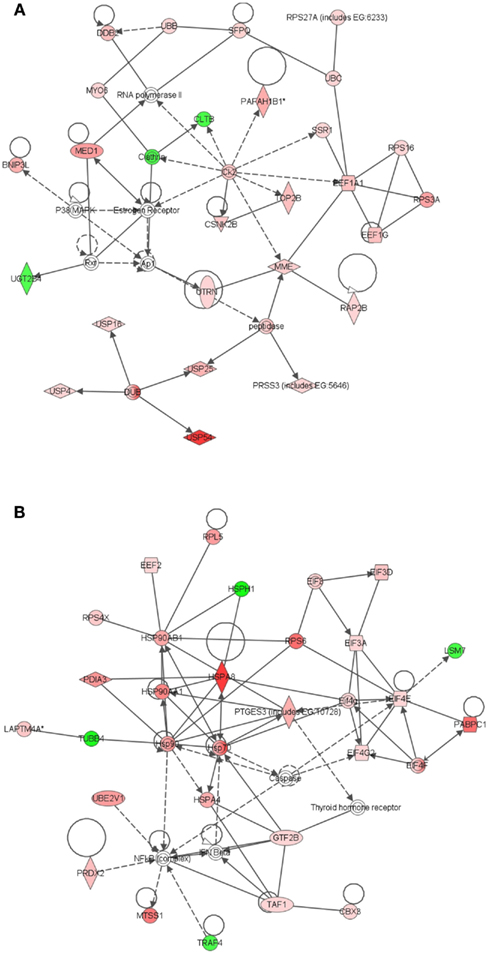
Figure 5. Ingenuity Pathway Analysis (IPA) of genes differentially expressed in ECb vs. ECe. Genes that were differentially expressed in ECb vs. ECe were imported into IPA software, which revealed the involvement of several networks pertinent to ECb. Network (A) pertains to endocrine development and function, lipid metabolism. Network (B) is associated with cancer and contains two heat shock protein modules. Red color denotes up-regulation in LRECb and green color denotes down-regulation in LRECb relative to control cells. The IPA legend is shown in Figure A1 in Appendix.
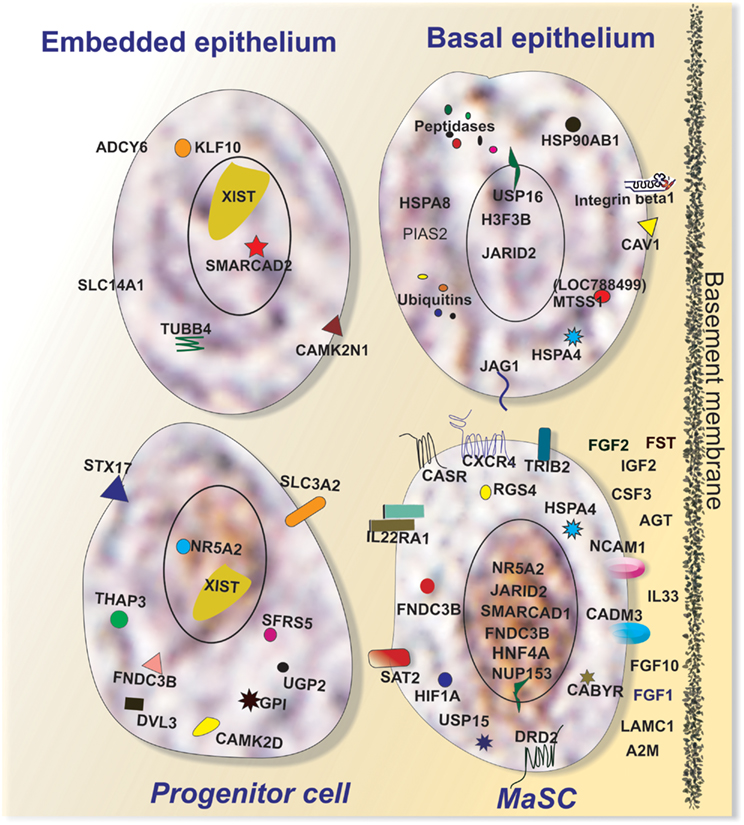
Figure 6. Characteristics of putative MaSC (LRECb) and progenitor cells (LRECe). Putative MaSC (LRECb) are localized in the basal epithelium in a stem cell niche characterized as hypoxic but an environment enriched for extracellular growth factors, tumor suppressors for regulating MaSC function. LRECb exhibit enriched expressions of adhesion molecules and a variety of potential MaSC biomarkers including HNF4A and the pluripotency marker, NR5A2. Putative progenitor cells (LRECe) also express NR5A2 but at a reduced level along with increased expression of differentiation factors including XIST. Key features of control cells (non-LREC) in the basal and embedded epithelial layers are also depicted.
Immunohistochemical and Realtime RT-PCR Evaluation of Potential Novel LRECb and LRECe Markers
Genes that are highly expressed in LRECb and LRECe may provide novel markers for MaSC and progenitor cells. Those that were evaluated by immunohistochemistry were: NR5A2, NUP153, FNDC3B, and HNF4A. NR5A2 is a pluripotency gene that aids in inducing somatic cells into pluripotency (iPSC; Heng et al., 2010). NUP153 is a nuclear basket protein that can cause chromatin modification (Vaquerizas et al., 2010), and FNDC3B is a regulator of adipogenesis and cell proliferation, adhesion, spreading, and migration (Nishizuka et al., 2009). HNF4A may serve as a stem cell regulator (Battle et al., 2006; Koh et al., 2010; Delaforest et al., 2011) and was identified as a key pathway component by IPA analysis of expression data for LRECb and LRECe. Transcripts for NR5A2, NUP153, FNDC3B, and HNF4A were more abundant in LRECb than in control cells, with a general expression pattern of LRECb > LRECe > EC).
Immunohistochemical analysis showed that 1–6% of epithelial cells expressed these potential markers. In agreement with transcript abundance, positive cells in the basal epithelium were more intensely stained than those in suprabasal locations. The abundance and localization of NR5A2, NUP153, FNDC3B, and HNF4A-positive cells (Figures 7A–D) were similar to that of LRECs. Co-localization studies showed that LREC expressed these markers. Surprisingly, expression of FNDC3B was not limited to the cytoplasmic compartment of the cell. Expression of FNDC3B was found to be cytoplasmic (arrows) and nuclear (arrowheads) and co-expressed with BrdU in approximately half of the LRECb (Figure 7G), which is consistent with its possible utility as a marker for putative MaSC/progenitor cells. Co-localization studies also confirmed our previous finding (Capuco, 2007; Capuco et al., 2009) that LRECb are ESR1-negative and LRECe are composed of populations of ESR1-negative and ESR1-positive cells (Figures 7E,F). Because of their potential utility for cell sorting, we also identified transcripts that encoded surface proteins and were up-regulated in LRECb (SAT2, CXCR4, SDPR, RTP3, CASR, GNB4, and DRD2); however, we have not evaluated the suitability of these membrane markers. Preliminary immunohistochemistry results showed that CXCR4 and CASR are expressed by a small number of epithelial cells.
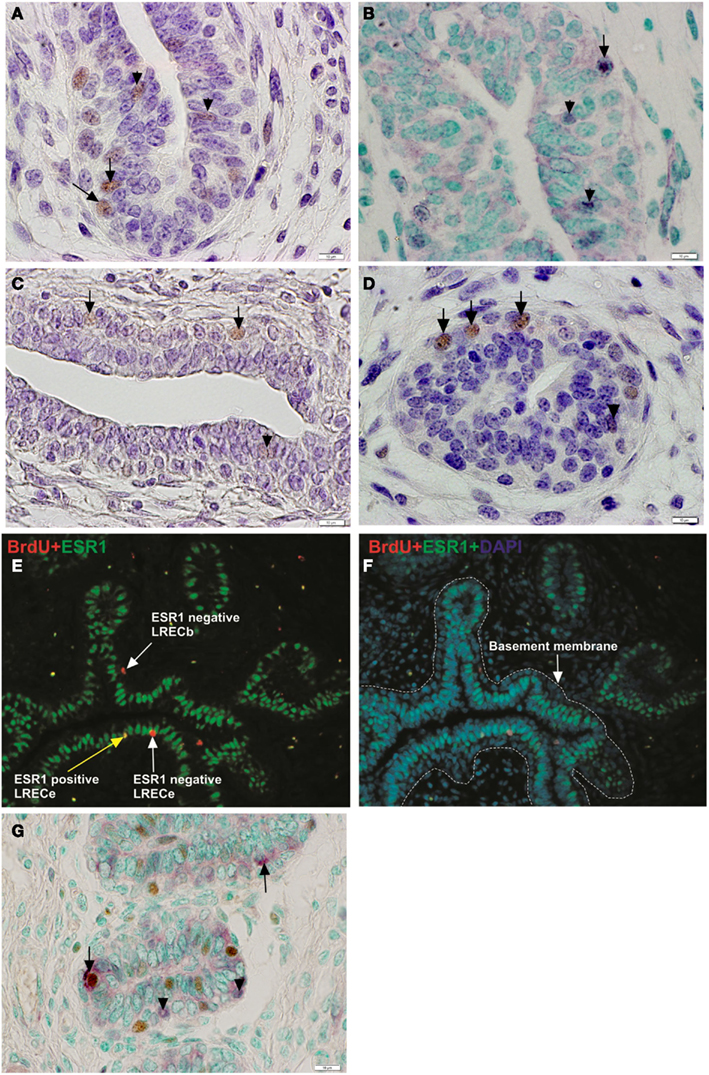
Figure 7. Immunohistochemical localization of potential mammary stem/progenitor cell markers. (A–D) Consistent with transcriptome data, cells that were positive for these novel markers were more strongly labeled (brown nuclei) in the basal layer of mammary epithelium than in the embedded layers. Solid arrows designate labeled nuclei of basal cells and arrow heads designate labeled nuclei of embedded epithelial cells. NR5A2 (A), NUP153 (B), FNDC3B (C), HNF4A (D). (E,F) Immunofluorescent micrograph demonstrating the ESR1 status of LREC. LRECb were ESR1-negative and LRECe were a mixed population of ESR1-negative and ESR1-positive cells. (G) Co-localization of FNDC3B (purple) and BrdU. FNDC3B was expressed in the nucleus (arrow) and cytoplasm (arrowhead) of LRECb (brown). Scale bar, 10 μm.
Realtime RT-PCR was employed to confirm microarray results for expression of transcripts for novel LREC-derived markers (NR5A2, NUP153, FNDC3B) and the differentiation factor XIST at the transcriptome level. Patterns of expression were very similar for RT-PCR and microarray analysis (Figures 8A–C). Both analyses showed that expression of the potential MaSC/progenitor cell markers was increased in LRECb and, with the exception of NUP153, in LRECe vs. their respective controls. Expression of these markers was greater in LRECb vs. LRECe by microarray analysis, but NR5A2 expression was not greater in LRECb vs. LRECe when assessed by realtime RT-PCR. Consistent with the undifferentiated state of putative MaSC, there was little to no expression of the differentiation factor XIST in LRECb, and there was lower expression of XIST in LRECb than in LRECe by both methodologies. Expression of XIST non-coding RNA was less in LRECe than in control cells as assessed by RT-PCR, but greater when assessed by microarray hybridization. Overall, the utility of microarray data for detecting LREC-derived markers for putative MaSC/progenitor cells was supported by realtime RT-PCR and by immunohistochemistry.
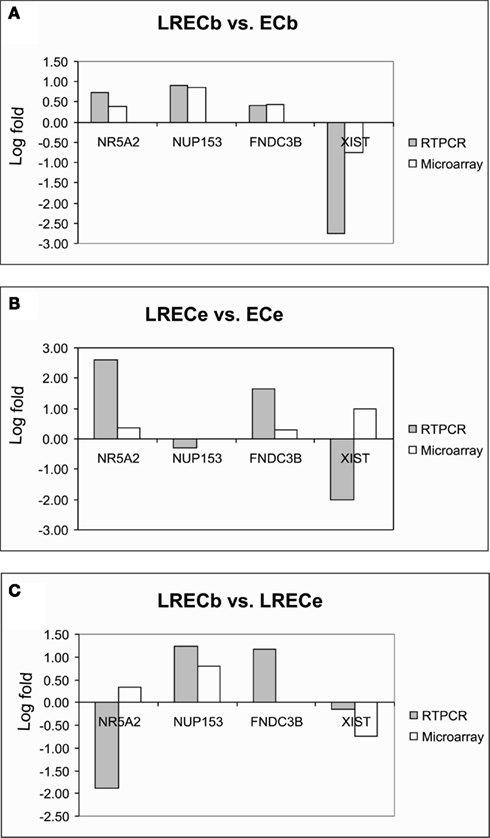
Figure 8. Quantitative RT-PCR and microarray analysis of selected genes. Concordance of gene expression patterns between microarray and qRT-PCR for key genes. (A) LRECb vs. ECb; (B) LRECe vs. ECe; (C) LRECb vs. LRECe. Data are expressed as fold change (log10) relative to indicated comparisons.
Discussion
In this study, we employed the long-term retention of BrdU-labeled DNA to identify putative MaSC/progenitor cells during the period of ductal morphogenesis in the prepubertal mammary gland. However, it must be understood that retention of labeled DNA represents an integration of a cell’s past proliferation and differentiation events and may not reflect that cell’s current status. This is particularly relevant when assessing individual cells within a population, e.g., expression of lineage markers by LREC. Nonetheless, we hypothesized that LREC are enriched for MaSC/progenitor cells. In particular, we hypothesized that LRECb are enriched for MaSC and LRECe are enriched for progenitor cells.
When comparing gene expression in LREC and control cells it is important to consider the proliferative status of these cells. A difference in the proliferative status of the two populations may impose differences in gene expression between the populations that are reflective of their relative cell cycle activity rather than cell lineage. To determine the extent to which LREC proliferate during ductal morphogenesis in the prepubertal bovine mammary gland, we evaluated expression of nuclear proliferation antigens. In the present experiment, we found that approximately 13% of LREC and 15% of control cells in the present experiment expressed PCNA (data not shown). In previous studies, we evaluated the Ki-67 labeling index in calves at an equivalent stage of mammary development to those in the present experiment and reported that 5.4% of LREC expressed Ki-67 (Capuco, 2007) and that 5–8% of total epithelial cells expressed Ki-67 (Capuco et al., 2004). Thus, the proliferation status of LREC, control cells and the overall epithelial population appear to be similar and not likely to unduly influence interpretation of gene expression data.
To address our hypothesis that LRECb are enriched for MaSC and that LRECe are enriched for more committed progenitors, we performed transcriptome analyses on the four populations of bovine mammary epithelial cells obtained by laser microdissection of LREC and EC from basal and embedded layers of the epithelium. Microarray analysis was used to reveal gene signatures for the four categories of mammary epithelial cells: LRECb, LRECe, ECb, and ECe.
The ECb and ECe were distinguishable by the increased abundance, in basal cells, of transcripts for genes encoding structural and motility proteins, extracellular growth factors, extracellular matrix (ECM) proteins, and ECM regulators. Additionally, increased expression of transcripts for heat shock proteins, peptidases, ribosomal proteins, ubiquitins, proteins that provide interaction between the cell and the ECM (caveolin-1, integrin-beta-1), tumor suppressors, and epigenetic modifiers were also characteristic of ECb. Myoepithelial cells, present in the basal layer of mature mammary epithelium, may be a part of the stem cell niche and their paracrine factors may regulate the proliferation, polarity, and motility of mammary epithelial cells (Polyak and Hu, 2005). However, the precise nature of the ECb in a calf is uncertain. Expression of markers for myoepithelial cells in mammary tissue from prepubertal heifers is absent or expressed in a limited fashion (Capuco et al., 2002; Ballagh et al., 2008; Ellis et al., 2012; Safayi et al., 2012).
Transcriptome analysis of LRECb vs. ECb showed that LRECb possess characteristics consistent with those of MaSC (Tables 1 and 2). Our mRNA data indicated a reduced expression of ESR1 and increased expression of ALDH3B1 in LRECb vs. ECb, and immunohistochemistry demonstrated a lack of detectable ESR1 protein in LRECb. Previous studies have demonstrated that mouse (Sleeman et al., 2007) human (Anderson and Clarke, 2004) and putative bovine MaSC are ESR1-negative (Capuco et al., 2009). ALDH1 activity has been used as a stem and progenitor cell marker in several tissues including blood, lung, prostate, pancreas, and breast (Douville et al., 2009). However, 17 isoforms of ALDH have been identified (Sladek, 2003) with different cellular and species expression patterns (Hess et al., 2004). ALDH3B1 is expressed by bovine LRECb. Increased abundance of HNF4A, NR5A2, TERF1, THY1, NUP153, and FNDC3B mRNA and decreased abundance XIST transcripts (non-coding) in LRECb are noteworthy. HNF4A is a hepatic stem cell transcription factor whose associated network was highly up-regulated in LRECb, suggesting a key role in these cells. It is noteworthy that HNF4A has recently been implicated as a regulator of mesenchymal stem cells (Koh et al., 2010). Lack of expression or low expression of XIST has been associated with stem and progenitor cells, respectively, in hematopoietic tissue (Savarese et al., 2006). Subsequently, we evaluated four potentially novel protein markers for stem/progenitor cells (NR5A2, NUP153, FNDC3B, HNF4A) immunohistochemically and found protein expression profiles that were consistent with the observed transcript abundance in LRECb and LRECe. The number of cells expressing these markers was limited and staining intensity of the positive cells was greater for those located in the basal layer of the epithelium.
Because of their potential utility for cell sorting, we identified transcripts that encoded surface proteins and were up-regulated in LRECb. Among the cell surface markers, THY1/CD90 is a proposed marker for mesenchymal, liver, keratinocyte, endometrial, and hematopoietic stem cells. TRIB2 is an oncogene shown to prolong growth of mouse myeloid progenitors (Keeshan et al., 2006). SAT2 is the target of DNA methyltransferase 1 (DNMT1) and an epigenetic modifier, whose methylation status may serve as a marker for cancer prognosis (Jackson et al., 2004). CXCR4 is a receptor for the chemokine, stromal derived factor 1 (SDF-1; Kang et al., 2005). SDF-1 is positively regulated by HIF1A, linking the SDF-CXCR4 axis to hypoxic stress. G-protein signaling proteins such as RGS4, which was up-regulated in LRECb, are negative regulators of the SDF-CXCR4 axis. The pertinence of the SDF-CXCR4 axis to stem cell regulation is the likelihood that mild hypoxic stress induces expansion of the MaSC population analogous to the expansion of breast cancer stem cells (Conley et al., 2012).
Up-regulation of growth factors such as fibroblast growth factors (FGF1, FGF2, FGF10), insulin-like factor-2 (IGF2), FST, laminin (LAMC2), platelet-derived growth factor beta (PDGFB), and plasminogen activator tissue (PLAT) in the basal epithelial layer is consistent with the possible function of these molecules as regulators of MaSC. The role of FGFs in mammary gland development and growth has been demonstrated (Mailleux et al., 2002; Sinowatz et al., 2006). Although our data do not provide evidence for enhanced expression of receptors for these growth factors in LRECb, transcripts for many of these receptors were evident.
Further evidence in support of LRECb being a population of cells that is enriched for MaSC comes from biological pathway analysis of differentially expressed genes. A number of differentially expressed genes (LRECb vs. ECb) were involved in MAPK, WNT, and TGF-β pathways. The MAPK pathway regulates cellular growth and proliferation. WNT and TGF-β pathways are both involved in mammary stem cell renewal. Down-regulation of TGF-β leads to a decline in MaSC number (Petersen and Polyak, 2010). A theme emerging from a variety of data is that stem cells exhibit characteristics of cells under stress (Covello et al., 2006; Mazumdar et al., 2010). An up-regulation of chaperones, ubiquitin/proteasome, DNA repair, and chromatin remodeling in LRECb are consistent with this characteristic and support our hypothesis that LRECb are enriched for MaSC.
Comparison of the transcript profiles of LRECe with those of ECe and LRECb supports classification of LRECe as progenitor cells. As with LRECb, presence of an HNF4A network and BrdU label retaining ability suggest that LRECe possess some stem cell attributes. However, up-regulation of metabolic enzymes and differentiation factors suggest that LRECe are more differentiated than LRECb. XIST is a non-coding RNA that inactivates one of the X-chromosomes in the early embryo and initiates gene repression and defines epigenetic transitions during development. Pluripotency genes (NANOG, OCT4 and SOX2) cooperate to repress XIST (Navarro et al., 2008). Our mRNA data revealed low expression of XIST in LRECb and greater expression in LRECe and ECb, consistent with classification of LRECb as MaSC and LRECe as progenitor cells (Savarese et al., 2006). Finally, comparison of transcript abundance in LRECb vs. LRECe suggested up-regulation of the Notch pathway in LRECb, implying increased transduction of Notch signals in LRECb. The Notch pathway plays a critical role in cell fate determination of human mammary stem and progenitor cells (Dontu et al., 2004). In murine mammary gland, the Notch pathway constrains MaSC expansion and promotes proliferation and commitment to the luminal lineage (Bouras et al., 2008). Involvement of Notch signaling in putative MaSC (LRECb) along with pathways regulating stem cell expansion is consistent with the need to promote and balance the expansion of both MaSC and luminal epithelial cells during ductal mammogenesis.
Using laser microdissection and RNA-sequencing, Gordon and colleagues evaluated the transcriptomes of progenitor cells and differentiated cells in the gastrointestinal tracts of mice, discerned characteristics of these precursors and compared their molecular properties with those of stem/progenitor cells in other organs (Stappenbeck et al., 2003; Giannakis et al., 2006). The use of laser microdissection was efficacious and led to the identification of characteristics that are shared among various stem cells. Many of the molecular features of gastrointestinal and other adult stem cells that were identified are also evident in mammary LRECb (Table 4), supporting the hypothesis that the LRECb population is enriched for MaSC. Surprisingly, Gene Ontology-based analysis of transcripts that are differentially enriched in LREC and EC were inconsistent with the previously reported conclusion (Doherty et al., 2008) that stem cells exhibit increased expression of genes that are involved in nuclear function and RNA binding, while differentiated cells are enriched for expression of genes that are involved in extracellular space, signal transduction, and the plasma membrane (data not shown).
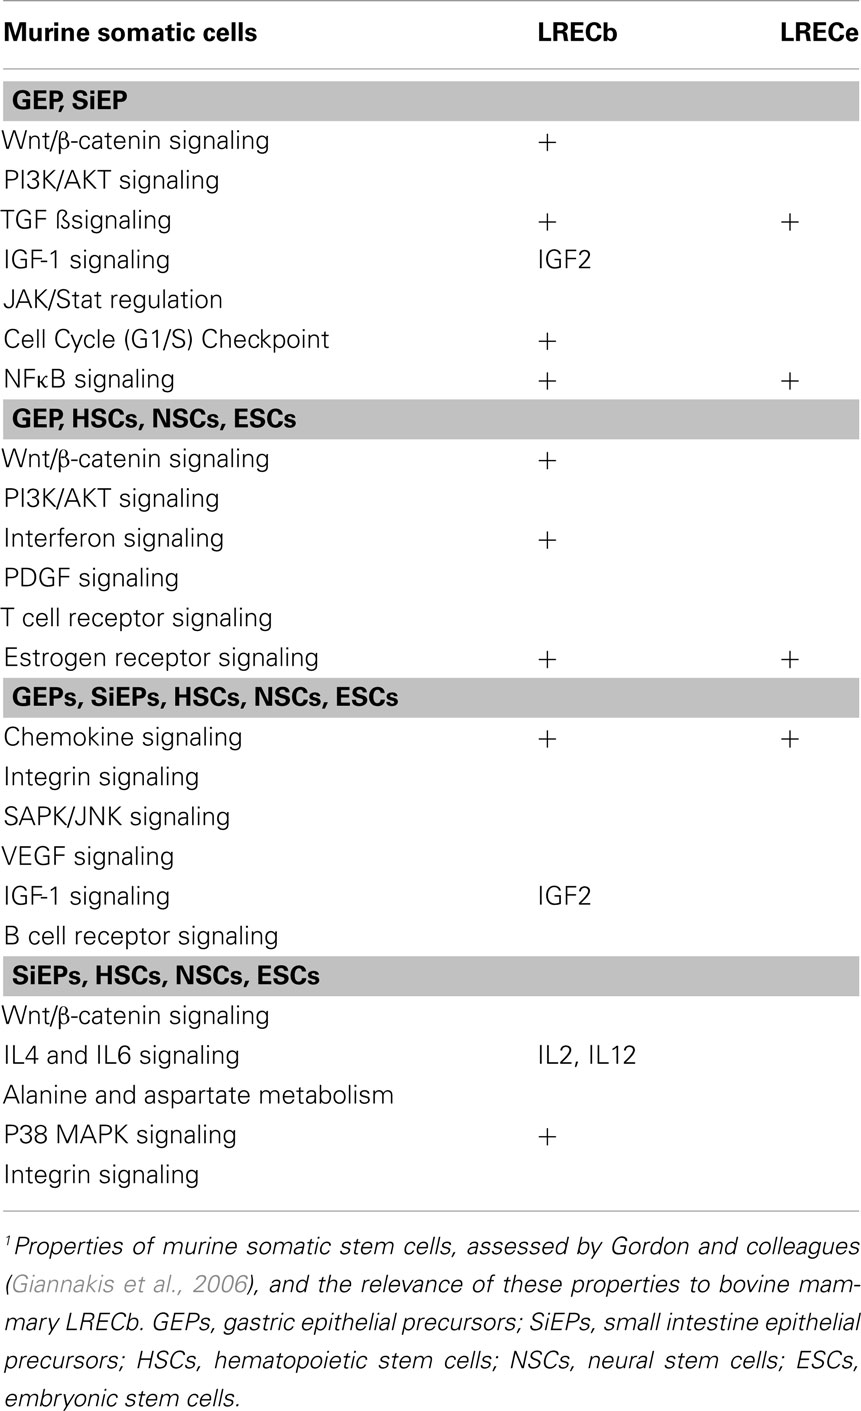
Table 4. Attributes of murine somatic stem cells and bovine mammary LREC1.
Our study provides supportive evidence that the stem cell niche lies in the basal layer of mammary epithelium. In this study, LREC and control cells were isolated from known locations within the mammary epithelium without previously destroying cellular microenvironments. However, LRECb were probably not in direct contact with the stroma, but were likely insulated by underlying cytoplasmic extensions from surrounding cells. The dissected LREC and control cells were adjacent or in close proximity to allow evaluations of potential cross-talk between putative MaSC and neighboring cells. Although potential signals were evident, additional research is necessary to elucidate such cross-talk. Furthermore, this analysis cannot account for signals that are derived from adjacent stromal cells, which were not interrogated. Microarray analyses of LRECb and LRECe identified features of LRECb that are reflective of MaSC residing in their stem cell niche. Distinct features of a stem cell niche, as discussed by Li and Xie (2005), are the presence of (1) cell adhesion molecules that provide anchorage for stem cells within the niche, (2) extrinsic factors within the niche that regulate stem cell behavior, and (3) factors that cause asymmetric cell division of the stem cell, that is upon cell division, one daughter cell is maintained in the niche as a stem cell (self renewal) and the other daughter cell leaves the niche to proliferate and differentiate. Recent studies also indicated that a stem cell niche elicits characteristics of hypoxic stress in stem cells, resulting in the induction of proteins of the family of hypoxia inducible transcription factors (HIF), such as HIF1A (up-regulated in LRECb), and targets WNT, OCT4, IGF2 and Notch signaling molecules (Kaufman, 2010; Mazumdar et al., 2010). Mild hypoxia appeared to elicit expansion of mammary tumor stem cells via a mechanism mediated by HIF1A (Conley et al., 2012). In our study, we identified specific cell adhesion molecules, extrinsic growth factors and regulators, factors that promote asymmetric cell division, and hypoxia inducing factor as molecules that are prevalent in the stem cell niche of the basal epithelium (Table 1; Figure 6).
Finally, this research has identified molecular markers that are enriched in LREC. Transcripts encoding the nuclear proteins NR5A2, NUP153, FNDC3B, and HNF4A were identified as potential markers for MaSC, as were transcripts encoding surface proteins SAT2, THY1/CD90, CXCR4, SDPR, RTP3, CASR, GNB4, and DRD2. To our knowledge, none of these proteins have been tested or utilized as MaSC markers. Enrichment for MaSC has been based upon sorting for multiple markers, as no single marker has proved particularly efficacious. The utility of these markers for identification and for sorting of MaSC remains to be evaluated.
Conclusion
Transcriptome analysis of LREC and mammary epithelial cell subpopulations has provided a framework for future studies of normal mammary epithelial cell development and homeostasis, and for the pathobiology of breast cancer. First, our data support the utility of long-term retention of DNA label as a means to identify an enriched population of progenitor cells. The data support the hypothesis that LRECs are enriched for MaSC and progenitor cells, with LRECb being enriched for progenitors with more stemness features (putative MaSC) and LRECe being enriched for more committed progenitors. Second, our data support the contention that the basal layer of the mammary epithelium provides for the MaSC niche. Lastly, we offer the first transcriptome profile of putative MaSC (LRECb) and progenitor cells (LRECe) excised from their in situ locations and we have identified potential novel biomarkers for these cells.
Insights into the biology of stem cells will be gained by further confirmation of candidate MaSC markers proposed by this study. Such confirmation requires an evaluation of the self renewal and differentiation potential of cells expressing these markers. Identification of appropriate biomarkers will provide a means to identify MaSC and will facilitate our understanding of MaSC functions in mammary development, homeostasis, and cancer. Specific cell surface markers will provide a means for future isolation of MaSC and investigations of their biology.
Conflict of Interest Statement
The authors declare that the research was conducted in the absence of any commercial or financial relationships that could be construed as a potential conflict of interest.
Acknowledgments
This work was funded by CRIS no. 1265-3200-083-00D from the USDA Agricultural Research Service and by National Research Initiative Competitive Grant no. 2008-35206-18825 from the USDA National Institute of Food and Agriculture.
Supplementary Material
The Supplementary Material for this article can be found online at http://www.frontiersin.org/Cancer_Genetics/10.3389/fonc.2013.00021/abstract
Table S1. Microsoft excel worksheet listing transcripts whose abundance differs between cell types. Comparisons are: LRECb vs. ECb, LRECe vs. ECe, LRECb vs. LRECe, and ECb vs. ECe.
Table S2. Microsoft Excel worksheet listing genes (partial list) enriched in LRECb vs. control cells (ECb) and their general functional categories.
Footnotes
References
Anderson, E., and Clarke, R. B. (2004). Steroid receptors and cell cycle in normal mammary epithelium. J. Mammary Gland. Biol. Neoplasia 9, 3–13.
Asselin-Labat, M. L., Shackleton, M., Stingl, J., Vaillant, F., Forrest, N. C., Eaves, C. J., et al. (2006). Steroid hormone receptor status of mouse mammary stem cells. J. Natl. Cancer Inst. 98, 1011–1014.
Ballagh, K., Korn, N., Riggs, L., Pratt, S. L., Dessauge, F., Akers, R. M., et al. (2008). Hot topic: prepubertal ovariectomy alters the development of myoepithelial cells in the bovine mammary gland. J. Dairy Sci. 91, 2992–2995.
Battle, M. A., Konopka, G., Parviz, F., Gaggl, A. L., Yang, C., Sladek, F. M., et al. (2006). Hepatocyte nuclear factor 4alpha orchestrates expression of cell adhesion proteins during the epithelial transformation of the developing liver. Proc. Natl. Acad. Sci. U.S.A. 103, 8419–8424.
Bickenbach, J. R. (1981). Identification and behavior of label-retaining cells in oral mucosa and skin. J. Dent. Res. 60 Spec No C, 1611–1620.
Bolstad, B. M., Irizarry, R. A., Astrand, M., and Speed, T. P. (2003). A comparison of normalization methods for high density oligonucleotide array data based on variance and bias. Bioinformatics 19, 185–193.
Bouras, T., Pal, B., Vaillant, F., Harburg, G., Asselin-Labat, M. L., Oakes, S. R., et al. (2008). Notch signaling regulates mammary stem cell function and luminal cell-fate commitment. Cell Stem Cell 3, 429–441.
Brisken, C., and Duss, S. (2007). Stem cells and the stem cell niche in the breast: an integrated hormonal and developmental perspective. Stem Cell. Rev. 3, 147–156.
Capuco, A. V. (2007). Identification of putative bovine mammary epithelial stem cells by their retention of labeled DNA strands. Exp. Biol. Med. (Maywood) 232, 1381–1390.
Capuco, A. V., Dahl, G. E., Wood, D. L., Moallem, U., and Erdman, R. E. (2004). Effect of bovine somatotropin and rumen-undegradable protein on mammary growth of prepubertal dairy heifers and subsequent milk production. J. Dairy Sci. 87, 3762–3769.
Capuco, A. V., Ellis, S., Wood, D. L., Akers, R. M., and Garrett, W. (2002). Postnatal mammary ductal growth: three-dimensional imaging of cell proliferation, effects of estrogen treatment, and expression of steroid receptors in prepubertal calves. Tissue Cell 34, 143–154.
Capuco, A. V., Evock-Clover, C. M., Minuti, A., and Wood, D. L. (2009). In vivo expansion of the mammary stem/progenitor cell population by xanthosine infusion. Exp. Biol. Med. (Maywood) 234, 475–482.
Chin, M. H., Mason, M. J., Xie, W., Volinia, S., Singer, M., Peterson, C., et al. (2009). Induced pluripotent stem cells and embryonic stem cells are distinguished by gene expression signatures. Cell Stem Cell 5, 111–123.
Chin, M. H., Pellegrini, M., Plath, K., and Lowry, W. E. (2010). Molecular analyses of human induced pluripotent stem cells and embryonic stem cells. Cell Stem Cell 7, 263–269.
Choudhary, R. K., Daniels, K. M., Evock-Clover, C. M., Garrett, W., and Capuco, A. V. (2010). Technical note: a rapid method for 5-bromo-2(-deoxyuridine (BrdU) immunostaining in bovine mammary cryosections that retains RNA quality. J. Dairy Sci. 93, 2574–2579.
Conboy, M. J., Karasov, A. O., and Rando, T. A. (2007). High incidence of non-random template strand segregation and asymmetric fate determination in dividing stem cells and their progeny. PLoS Biol. 5:e102. doi: 10.1371/journal.pbio.0050102
Conley, S. J., Gheordunescu, E., Kakarala, P., Newman, B., Korkaya, H., Heath, A. N., et al. (2012). Antiangiogenic agents increase breast cancer stem cells via the generation of tumor hypoxia. Proc. Natl. Acad. Sci. U.S.A. 109, 2784–2789.
Covello, K. L., Kehler, J., Yu, H., Gordan, J. D., Arsham, A. M., Hu, C. J., et al. (2006). HIF-2alpha regulates Oct-4: effects of hypoxia on stem cell function, embryonic development, and tumor growth. Genes Dev. 20, 557–570.
Craig, W., Kay, R., Cutler, R. L., and Lansdorp, P. M. (1993). Expression of Thy-1 on human hematopoietic progenitor cells. J. Exp. Med. 177, 1331–1342.
Delaforest, A., Nagaoka, M., Si-Tayeb, K., Noto, F. K., Konopka, G., Battle, M. A., et al. (2011). HNF4A is essential for specification of hepatic progenitors from human pluripotent stem cells. Development 138, 4143–4153.
Diehn, M., Cho, R. W., Lobo, N. A., Kalisky, T., Dorie, M. J., Kulp, A. N., et al. (2009). Association of reactive oxygen species levels and radioresistance in cancer stem cells. Nature 458, 780–783.
Doherty, J. M., Geske, M. J., Stappenbeck, T. S., and Mills, J. C. (2008). Diverse adult stem cells share specific higher-order patterns of gene expression. Stem Cells 26, 2124–2130.
Dontu, G., Abdallah, W. M., Foley, J. M., Jackson, K. W., Clarke, M. F., Kawamura, M. J., et al. (2003). In vitro propagation and transcriptional profiling of human mammary stem/progenitor cells. Genes Dev. 17, 1253–1270.
Dontu, G., Jackson, K. W., McNicholas, E., Kawamura, M. J., Abdallah, W. M., and Wicha, M. S. (2004). Role of Notch signaling in cell-fate determination of human mammary stem/progenitor cells. Breast Cancer Res. 6, R605–R615.
Douville, J., Beaulieu, R., and Balicki, D. (2009). ALDH1 as a functional marker of cancer stem and progenitor cells. Stem Cells Dev. 18, 17–25.
Edgar, R., Domrachev, M., and Lash, A. E. (2002). Gene Expression omnibus: NCBI gene expression and hybridization array data repository. Nucleic Acids Res. 30, 207–210.
Ellis, S., Akers, R. M., Capuco, A. V., and Safayi, S. (2012). Bovine mammary epithelial cell lineages and parenchymal development. J. Anim. Sci. 90, 1666–1673.
Esmailpour, T., and Huang, T. (2008). Advancement in mammary stem cell research. J Cancer Mol. 4, 131–138.
Gargett, C. E., Schwab, K. E., Zillwood, R. M., Nguyen, H. P., and Wu, D. (2009). Isolation and culture of epithelial progenitors and mesenchymal stem cells from human endometrium. Biol. Reprod. 80, 1136–1145.
Giannakis, M., Stappenbeck, T. S., Mills, J. C., Leip, D. G., Lovett, M., Clifton, S. W., et al. (2006). Molecular properties of adult mouse gastric and intestinal epithelial progenitors in their niches. J. Biol. Chem. 281, 11292–11300.
Ginis, I., Luo, Y., Miura, T., Thies, S., Brandenberger, R., Gerecht-Nir, S., et al. (2004). Differences between human and mouse embryonic stem cells. Dev. Biol. 269, 360–380.
Goldschneider, I., Gordon, L. K., and Morris, R. J. (1978). Demonstration of Thy-1 antigen on pluripotent hemopoietic stem cells in the rat. J. Exp. Med. 148, 1351–1366.
Heng, J. C., Feng, B., Han, J., Jiang, J., Kraus, P., Ng, J. H., et al. (2010). The nuclear receptor Nr5a2 can replace Oct4 in the reprogramming of murine somatic cells to pluripotent cells. Cell Stem Cell 6, 167–174.
Hess, D. A., Meyerrose, T. E., Wirthlin, L., Craft, T. P., Herrbrich, P. E., Creer, M. H., et al. (2004). Functional characterization of highly purified human hematopoietic repopulating cells isolated according to aldehyde dehydrogenase activity. Blood 104, 1648–1655.
Huang da, W., Sherman, B. T., and Lempicki, R. A. (2009). Systematic and integrative analysis of large gene lists using DAVID bioinformatics resources. Nat. Protoc. 4, 44–57.
Irizarry, R. A., Hobbs, B., Collin, F., Beazer-Barclay, Y. D., Antonellis, K. J., Scherf, U., et al. (2003). Exploration, normalization, and summaries of high density oligonucleotide array probe level data. Biostatistics 4, 249–264.
Jackson, K., Yu, M. C., Arakawa, K., Fiala, E., Youn, B., Fiegl, H., et al. (2004). DNA hypomethylation is prevalent even in low-grade breast cancers. Cancer Biol. Ther. 3, 1225–1231.
Kang, H., Watkins, G., Douglas-Jones, A., Mansel, R. E., and Jiang, W. G. (2005). The elevated level of CXCR4 is correlated with nodal metastasis of human breast cancer. Breast 14, 360–367.
Keeshan, K., He, Y., Wouters, B. J., Shestova, O., Xu, L., Sai, H., et al. (2006). Tribbles homolog 2 inactivates C/EBPalpha and causes acute myelogenous leukemia. Cancer Cell 10, 401–411.
Kenney, N. J., Smith, G. H., Lawrence, E., Barrett, J. C., and Salomon, D. S. (2001). Identification of stem cell units in the terminal end bud and duct of the mouse mammary gland. J. Biomed. Biotechnol. 1, 133–143.
Klein, A. M., and Simons, B. D. (2011). Universal patterns of stem cell fate in cycling adult tissues. Development 138, 3103–3111.
Koh, W., Sheng, C. T., Tan, B., Lee, Q. Y., Kuznetsov, V., Kiang, L. S., et al. (2010). Analysis of deep sequencing microRNA expression profile from human embryonic stem cells derived mesenchymal stem cells reveals possible role of let-7 microRNA family in downstream targeting of hepatic nuclear factor 4 alpha. BMC Genomics 11(Suppl. 1):S6. doi:10.1186/1471-2164-11-S1-S6
Lamarca, H. L., and Rosen, J. M. (2008). Hormones and mammary cell fate – what will I become when I grow up? Endocrinology 149, 4317–4321.
Li, L., and Xie, T. (2005). Stem cell niche: structure and function. Annu. Rev. Cell Dev. Biol. 21, 605–631.
Li, R. W., Meyer, M. J., Van Tassell, C. P., Sonstegard, T. S., Connor, E. E., Van Amburgh, M. E., et al. (2006). Identification of estrogen-responsive genes in the parenchyma and fat pad of the bovine mammary gland by microarray analysis. Physiol. Genomics 27, 42–53.
Mailleux, A. A., Spencer-Dene, B., Dillon, C., Ndiaye, D., Savona-Baron, C., Itoh, N., et al. (2002). Role of FGF10/FGFR2b signaling during mammary gland development in the mouse embryo. Development 129, 53–60.
Martignani, E., Eirew, P., Accornero, P., Eaves, C. J., and Baratta, M. (2010). Human milk protein production in xenografts of genetically engineered bovine mammary epithelial stem cells. PLoS ONE 5:e13372. doi:10.1371/journal.pone.0013372
Mazumdar, J., O’Brien, W. T., Johnson, R. S., LaManna, J. C., Chavez, J. C., Klein, P. S., et al. (2010). O2 regulates stem cells through Wnt/beta-catenin signalling. Nat. Cell Biol. 12, 1007–1013.
Meyer, M. J., Capuco, A. V., Ross, D. A., Lintault, L. M., and Van Amburgh, M. E. (2006). Developmental and nutritional regulation of the prepubertal bovine mammary gland: II. Epithelial cell proliferation, parenchymal accretion rate, and allometric growth. J. Dairy Sci. 89, 4298–4304.
Motyl, T., Bierla, J. B., Kozlowski, M., Gajewska, M., Gajkowska, B., and Koronkiewicz, M. (2011). Identification, quantification and transcriptional profile of potential stem cells in bovine mammary gland. Livestock Sci. 136, 136–149.
Navarro, P., Chambers, I., Karwacki-Neisius, V., Chureau, C., Morey, C., Rougeulle, C., et al. (2008). Molecular coupling of Xist regulation and pluripotency. Science 321, 1693–1695.
Niku, M., Ilmonen, L., Pessa-Morikawa, T., and Iivanainen, A. (2004). Limited contribution of circulating cells to the development and maintenance of nonhematopoietic bovine tissues. Stem Cells 22, 12–20.
Nishizuka, M., Kishimoto, K., Kato, A., Ikawa, M., Okabe, M., Sato, R., et al. (2009). Disruption of the novel gene fad104 causes rapid postnatal death and attenuation of cell proliferation, adhesion, spreading and migration. Exp. Cell Res. 315, 809–819.
Noh, M., Smith, J. L., Huh, Y. H., and Sherley, J. L. (2011). A resource for discovering specific and universal biomarkers for distributed stem cells. PLoS ONE 6:e22077. doi:10.1371/journal.pone.0022077
Petersen, O. W., and Polyak, K. (2010). Stem cells in the human breast. Cold Spring Harb. Perspect. Biol. 2, a003160
Polyak, K., and Hu, M. (2005). Do myoepithelial cells hold the key for breast tumor progression? J. Mammary Gland Biol. Neoplasia 10, 231–247.
Potten, C. S., Hume, W. J., Reid, P., and Cairns, J. (1978). The segregation of DNA in epithelial stem cells. Cell 15, 899–906.
Potten, C. S., Owen, G., and Booth, D. (2002). Intestinal stem cells protect their genome by selective segregation of template DNA strands. J. Cell. Sci. 115, 2381–2388.
Rauner, G., and Barash, I. (2012). Cell hierarchy and lineage commitment in the bovine mammary gland. PLoS ONE 7:e30113. doi:10.1371/journal.pone.0030113
Rusan, N. M., and Peifer, M. (2007). A role for a novel centrosome cycle in asymmetric cell division. J. Cell Biol. 177, 13–20.
Safayi, S., Korn, N., Bertram, A., Akers, R. M., Capuco, A. V., Pratt, S. L., et al. (2012). Myoepithelial cell differentiation markers in prepubertal bovine mammary gland: effect of ovariectomy. J. Dairy Sci. 95, 2965–2976.
Savarese, F., Flahndorfer, K., Jaenisch, R., Busslinger, M., and Wutz, A. (2006). Hematopoietic precursor cells transiently reestablish permissiveness for X inactivation. Mol. Cell. Biol. 26, 7167–7177.
Shackleton, M., Vaillant, F., Simpson, K. J., Stingl, J., Smyth, G. K., Asselin-Labat, M. L., et al. (2006). Generation of a functional mammary gland from a single stem cell. Nature 439, 84–88.
Shi, L., Jones, W. D., Jensen, R. V., Harris, S. C., Perkins, R. G., Goodsaid, F. M., et al. (2008). The balance of reproducibility, sensitivity, and specificity of lists of differentially expressed genes in microarray studies. BMC Bioinformatics 9(Suppl. 9):S10. doi:10.1186/1471-2105-9-S9-S10
Shi, L., Reid, L. H., Jones, W. D., Shippy, R., Warrington, J. A., Baker, S. C., et al. (2006). The MicroArray Quality Control (MAQC) project shows inter- and intraplatform reproducibility of gene expression measurements. Nat. Biotechnol. 24, 1151–1161.
Sinowatz, F., Schams, D., Habermann, F., Berisha, B., and Vermehren, M. (2006). Localization of fibroblast growth factor I (acid fibroblast growth factor) and its mRNA in the bovine mammary gland during mammogenesis, lactation and involution. Anat. Histol. Embryol. 35, 202–207.
Sladek, N. E. (2003). Human aldehyde dehydrogenases: potential pathological, pharmacological, and toxicological impact. J. Biochem. Mol. Toxicol. 17, 7–23.
Sleeman, K. E., Kendrick, H., Robertson, D., Isacke, C. M., Ashworth, A., and Smalley, M. J. (2007). Dissociation of estrogen receptor expression and in vivo stem cell activity in the mammary gland. J. Cell Biol. 176, 19–26.
Smith, G. H. (2005). Label-retaining epithelial cells in mouse mammary gland divide asymmetrically and retain their template DNA strands. Development 132, 681–687.
Smith, G. H., and Chepko, G. (2001). Mammary epithelial stem cells. Microsc. Res. Tech. 52, 190–203.
Stappenbeck, T. S., Mills, J. C., and Gordon, J. I. (2003). Molecular features of adult mouse small intestinal epithelial progenitors. Proc. Natl. Acad. Sci. U.S.A. 100, 1004–1009.
Stingl, J., Eirew, P., Ricketson, I., Shackleton, M., Vaillant, F., Choi, D., et al. (2006). Purification and unique properties of mammary epithelial stem cells. Nature 439, 993–997.
Vaquerizas, J. M., Suyama, R., Kind, J., Miura, K., Luscombe, N. M., and Akhtar, A. (2010). Nuclear pore proteins nup153 and megator define transcriptionally active regions in the Drosophila genome. PLoS Genet. 6:e1000846. doi:10.1371/journal.pgen.1000846
Wang, D., Peregrina, K., Dhima, E., Lin, E. Y., Mariadason, J. M., and Augenlicht, L. H. (2011). Paneth cell marker expression in intestinal villi and colon crypts characterizes dietary induced risk for mouse sporadic intestinal cancer. Proc. Natl. Acad. Sci. U.S.A. 108, 10272–10277.
Wang, H., Tao, T., Tang, J., Mao, Y. H., Li, W., Peng, J., et al. (2009). Importin 13 serves as a potential marker for corneal epithelial progenitor cells. Stem Cells 27, 2516–2526.
Welm, B. E., Tepera, S. B., Venezia, T., Graubert, T. A., Rosen, J. M., and Goodell, M. A. (2002). Sca-1(pos) cells in the mouse mammary gland represent an enriched progenitor cell population. Dev. Biol. 245, 42–56.
Wiese, C., Rolletschek, A., Kania, G., Blyszczuk, P., Tarasov, K. V., Tarasova, Y., et al. (2004). Nestin expression – a property of multi-lineage progenitor cells? Cell. Mol. Life Sci. 61, 2510–2522.
Yasuhara, N., Oka, M., and Yoneda, Y. (2009). The role of the nuclear transport system in cell differentiation. Semin. Cell Dev. Biol. 20, 590–599.
Appendix
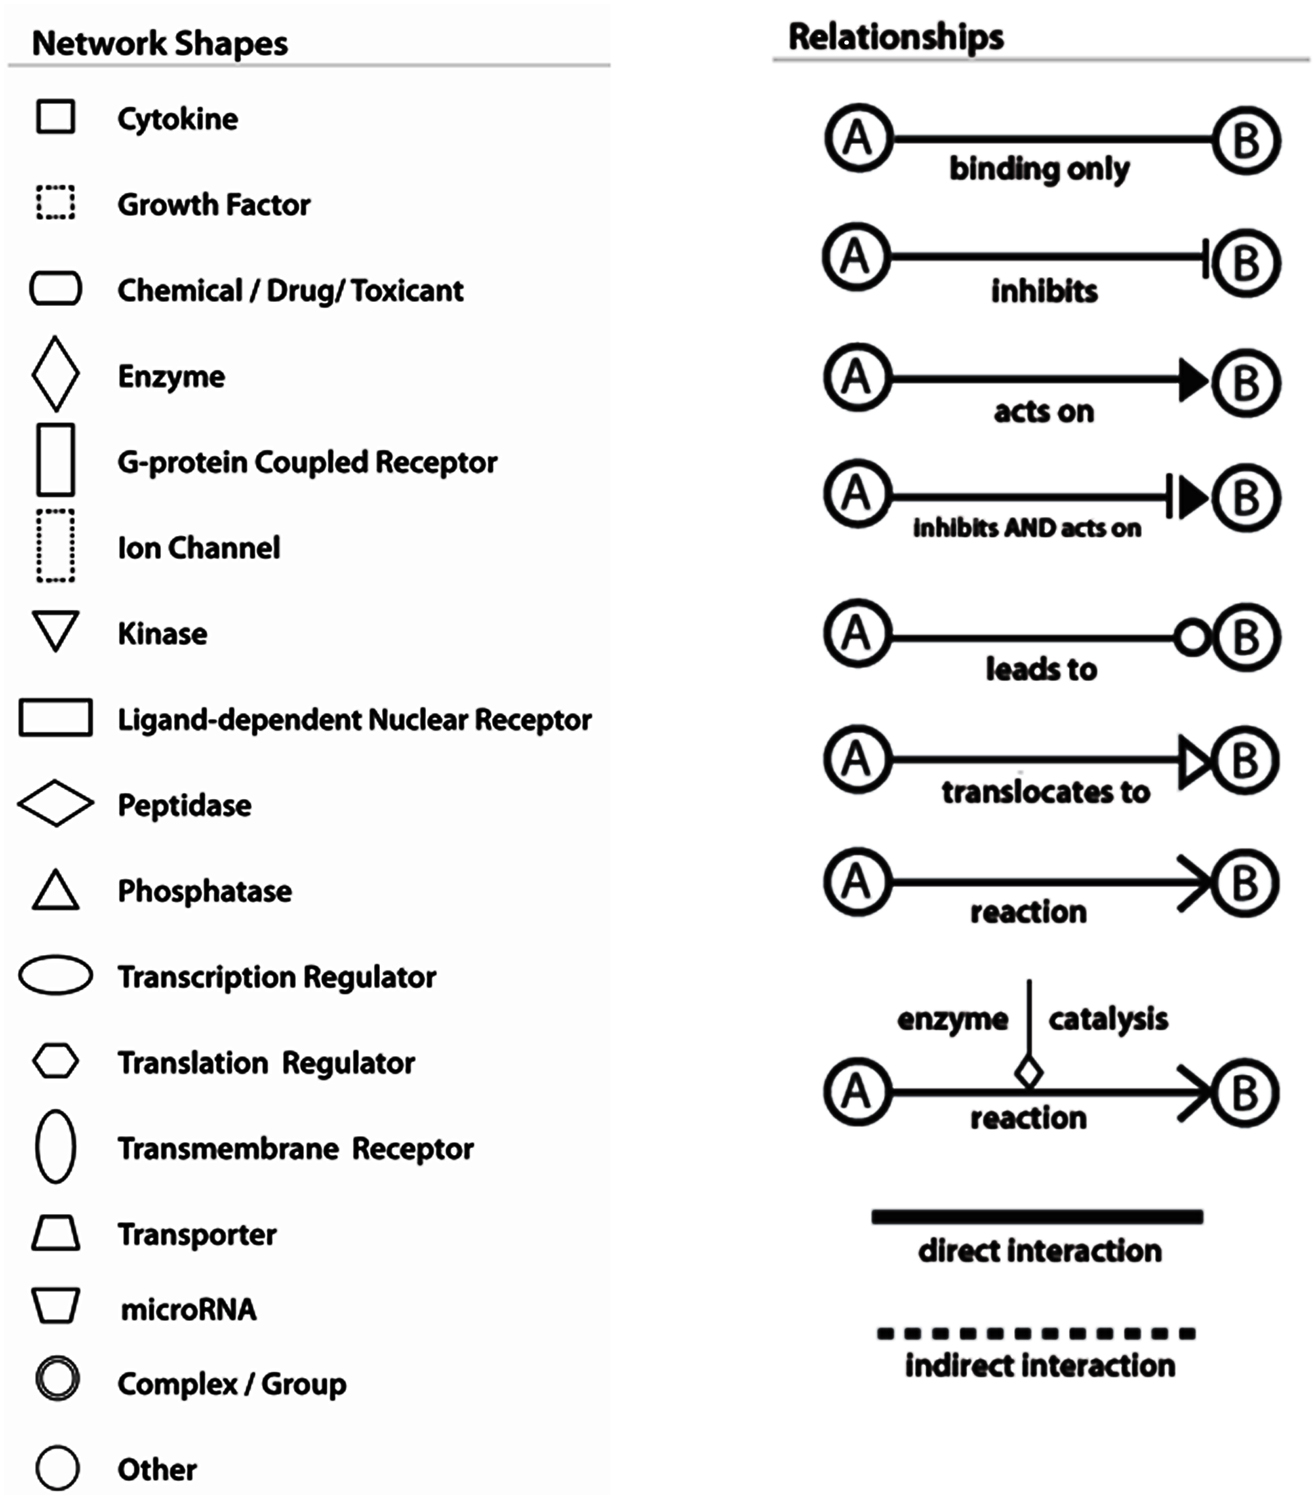
Figure A1. JPG file defining the symbols and relationships depicted in IPA networks.
Keywords: label retention, mammary stem cells, mammary progenitor cells, stem cell markers, laser microdissection
Citation: Choudhary RK, Li RW, Evock-Clover CM and Capuco AV (2013) Comparison of the transcriptomes of long-term label retaining-cells and control cells microdissected from mammary epithelium: an initial study to characterize potential stem/progenitor cells. Front. Oncol. 3:21. doi: 10.3389/fonc.2013.00021
Received: 18 November 2012; Paper pending published: 03 December 2012;
Accepted: 25 January 2013; Published online: 15 February 2013.
Edited by:
James L. Sherley, Boston Biomedical Research Institute, USAReviewed by:
James L. Sherley, Boston Biomedical Research Institute, USAMinsoo Noh, Ajou University, South Korea
Copyright: © 2013 Choudhary, Li, Evock-Clover and Capuco. This is an open-access article distributed under the terms of the Creative Commons Attribution License, which permits use, distribution and reproduction in other forums, provided the original authors and source are credited and subject to any copyright notices concerning any third-party graphics etc.
*Correspondence: Anthony V. Capuco, Bovine Functional Genomics Laboratory, Building 200, Room 14, BARC-East, Beltsville, MD 20705, USA. e-mail: tony.capuco@ars.usda.gov
† Mention of trade names or commercial products in this article is solely for the purpose of providing specific information and does not imply recommendation or endorsement by the US Department of Agriculture. The USDA is an equal opportunity provider and employer.