 Natalie J. Serkova1,2*
 S. Gail Eckhardt2,3
- 1Department of Anesthesiology, University of Colorado Comprehensive Cancer Center, Aurora, CO, USA
- 2Developmental Therapeutics Program, University of Colorado Comprehensive Cancer Center, Aurora, CO, USA
- 3Division of Medical Oncology, Anschutz Medical Center, University of Colorado Denver, Aurora, CO, USA
For several decades, cytotoxic chemotherapeutic agents were considered the basis of anticancer treatment for patients with metastatic tumors. A decrease in tumor burden, assessed by volumetric computed tomography and magnetic resonance imaging, according to the response evaluation criteria in solid tumors (RECIST), was considered as a radiological response to cytotoxic chemotherapies. In addition to RECIST-based dimensional measurements, a metabolic response to cytotoxic drugs can be assessed by positron emission tomography (PET) using 18F-fluoro-thymidine (FLT) as a radioactive tracer for drug-disrupted DNA synthesis. The decreased 18FLT-PET uptake is often seen concurrently with increased apparent diffusion coefficients by diffusion-weighted imaging due to chemotherapy-induced changes in tumor cellularity. Recently, the discovery of molecular origins of tumorogenesis led to the introduction of novel signal transduction inhibitors (STIs). STIs are targeted cytostatic agents; their effect is based on a specific biological inhibition with no immediate cell death. As such, tumor size is not anymore a sensitive end point for a treatment response to STIs; novel physiological imaging end points are desirable. For receptor tyrosine kinase inhibitors as well as modulators of the downstream signaling pathways, an almost immediate inhibition in glycolytic activity (the Warburg effect) and phospholipid turnover (the Kennedy pathway) has been seen by metabolic imaging in the first 24 h of treatment. The quantitative imaging end points by magnetic resonance spectroscopy and metabolic PET (including 18F-fluoro-deoxy-glucose, FDG, and total choline) provide an early treatment response to targeted STIs, before a reduction in tumor burden can be seen.
Introduction
The field of medical oncology has emerged in the 1950s when various chemotherapeutic drugs were used to control cancer cell growth by interfering with the cell cycle and DNA replication. Later, in the 1960s and 1970s, drugs were combined to combat the cancer at different points of the cell cycle. For several decades, cytotoxic chemotherapeutic agents were considered the basis of anticancer treatment for patients with solid tumors and metastatic (systemic) disease. A decrease in tumor burden (tumor size and metastasis size/numbers), assessed by dimensional/volumetric magnetic resonance imaging (MRI) or computed tomography (CT), was considered as a radiological response to a cytotoxic treatment regimen (1, 2).
Recently, the discovery of molecular origins of tumorogenesis led to the introduction of novel targeted agents, the so-called signal transduction inhibitors (STIs), and their translation into the clinic (3–5). By focusing on molecular abnormalities, which are specific to the cancer cell, targeted cancer therapies have a potential to be more effective against cancer and less harmful to normal cells than “standard” chemotherapeutics. STIs are considered a cytostatic (rather than cytotoxic) treatment alternative based on a specific biological inhibition (rather than immediate cell death) (Figure 1). As such, tumor size is not a sensitive end point for the treatment response to STIs; novel physiological imaging end points are desirable (6).
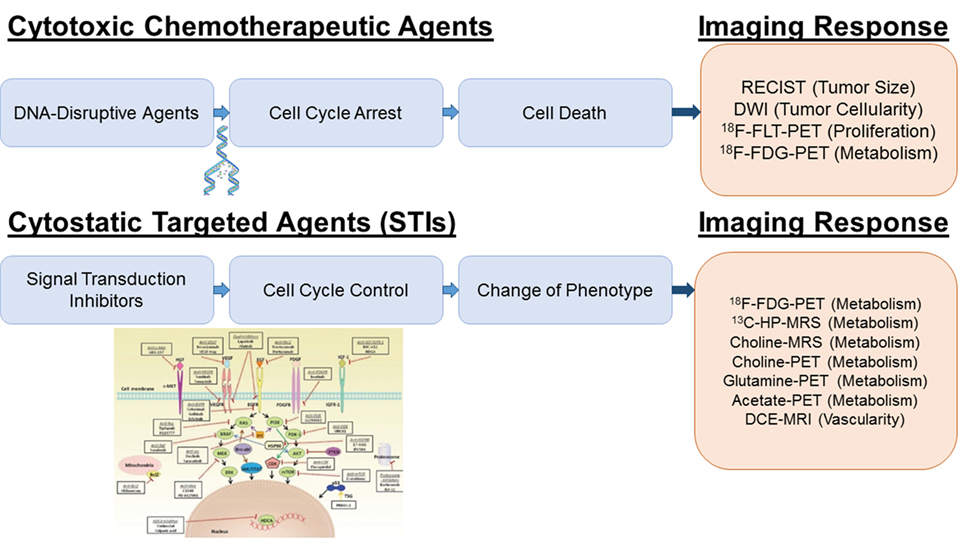
Figure 1. Imaging platforms for treatment response to cytotoxic and cytostatic agents. For DNA disrupting agents (“Cytotoxic Chemotherapeutic Agents”), increased ADC values by DWI and decreased FLT and FDG uptake by PET reflect a cytotoxic treatment response due to the decreased in tumor cellularity, DNA synthesis and metabolism. For receptor tyrosine kinase inhibitors and PI3K/AKT/mTOR inhibition (“STIs”), a specific early decrease in glycolytic activity has been reported; therefore, glucose imaging using hyperpolarized 13C-pyruvate MRSI or FDG-PET is most sensitive. Inhibition of the Kennedy pathway as monitored by decreased total choline MRSI or 11C-/18F-choline PET is a putative marker for the treatment response of Ras/Raf/MEK/MAPK inhibitors. Glutamine and acetate imaging can be useful for c-myc and FASN inhibitors, respectively. For antiangiogenic agents (VEGF/VEGFR2 inhibitors), DCE-MRI is the technique of choice to assess decreased perfusion and vascularity. The picture was partially adapted from Munagala et al. (7).
Anticancer therapies are currently undergoing enormous changes. Unfortunately, this biological revolution in cancer treatment comes at a great expense; the aggregate cost of cancer care rose 60% since 2003 (8, 9). In 2014, the price for each new approved cancer drug exceeded $120,000/year of use. Therefore, the National Cancer Institute (NCI) has currently acknowledged that “there is a tremendous need to incentivize development of validated and accepted diagnostics in order to keep pace with the explosion of new, targeted drugs that are in the pipeline” (10). Advances in oncologic imaging pave the way for rapid optimization of personalized anticancer therapies through the non-invasive assessment of the mechanism of actions, efficacy and resistance development that improve clinical decision making for novel targeted agents beyond the traditional endpoints of morbidity and mortality. Among other radiological platforms, metabolic imaging – based on positron emission tomography (PET) and magnetic resonance spectroscopy (MRS) – is particularly suited for monitoring the treatment response to cytostatic STIs since the signal transduction pathways are directly linked to the aberrant metabolic phenotype exhibited in human malignancies (11–16). Introduced in 1977, 18F-fluoro-deoxy-glucose (FDG)-PET remains the main metabolic imaging technique for the non-invasive assessment of glucose consumption and the Warburg effect (17, 18). The use of PET has been expanded by the introduction of other radiolabeled ligands, such as amino acids and nucleosides. While tracer uptake studies represent the main strength of metabolic PET, 1H-MRS provides complementary metabolic information on major endogenous metabolites (19–21). In the past 10 years, advances in hyperpolarized 13C-MRS allowed for non-invasive assessment of metabolic activities in glucose, lipid, and amino acid metabolism in tumor-bearing animals and humans (22, 23).
Anticancer Treatment Strategies
Cytotoxic Drugs
Herbal and other preparations have been used for cancer treatment already in the Ancient World. The very first attempt to treat leukemia with a chemical agent (potassium arsenite) took place in 1865 by Heinrich Lissauer. Then, a treatment benefit of estrogen in prostate cancer was shown in the early 1940s. Shortly after, nitrogen mustard (mustine), now considered as truly the first chemotherapeutic agent, was discovered and applied for the treatment of lymphomas and other solid tumors. Later, with the elucidation of the double-helical structure of DNA in 1953, it was shown that nitrogen mustard chemically reacts with DNA (24). This discovery had revolutionized the treatment of various cancers and resulted in a rapid development of several cytotoxic chemotherapeutics, which affect the integrity of the cell’s genetic material (25). As such, most of classic chemotherapeutic drugs act in a cytotoxic manner, kill cells that divide rapidly, which includes cancer cells, immune cells, gastrointestinal (GI) tract, hair follicles, and result in a wide range of serious side effects to normal cells with high replication rate, including myelosuppression, GI toxicity, and alopecia (26–28).
Most of the cytotoxic chemotherapeutic drugs affect DNA synthesis or cell division and are commonly divided into four major classes (29–33): (i) mitotic poisons (preventing microtubule functions), (ii) DNA-reacting drugs (chemically modifying DNA as alkalyting agents), (iii) inhibitors of DNA replications (acting as antimetabolites for pyrine, pyrimidine, and thymine synthesis), and (iv) agents that change DNA topology (topoisomerase inhibitors and cytotoxic antibiotics) (Table 1).
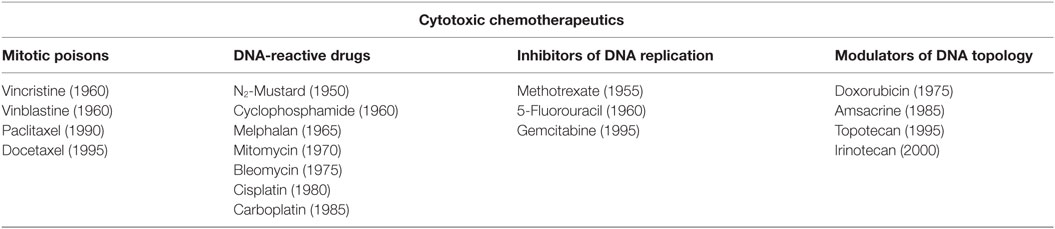
Table 1. Major classes of cytotoxic agents.
Cytostatic Targeted Agents
The discovery of molecular targets has enabled the development of new and potentially more effective treatments for metastatic disease with considerably low toxic side effects (28). Due to our improved understanding of cancer biology and specific onco-pathways that lead to uncontrolled cell proliferation, the main focus of anticancer treatment strategies has shifted from cytotoxic chemotherapies (which lead to cell death) to cytostatic targeted STIs. This has resulted in new requirements for pharmacodynamic markers (including imaging-based end points) for therapy response and resistance development to STIs (34). Oncologic imaging represents an ideal technology to answer these questions non-invasively and in real time (35–37).
Most of the targeted agents interfere with proteins that are involved in signal transduction processes. Progressive disease, the process of tumor growth, angiogenesis, invasion, and metastasis, is largely regulated by circulating growth factors and their binding to receptor tyrosine kinases (38, 39). Inhibition of these signaling pathways as a therapeutic approach has gained a lot of attention and current strategies include: antigrowth factor antibodies, receptor antagonists, anti-receptor monoclonal antibodies, and small-molecule tyrosine kinase inhibitors (24, 40). The use of molecularly targeted anticancer drugs began with the introduction of trastuzumab and imatinib, which target HER2/neu [human epidermal growth factor (EGF) receptor 2] and BCR-ABL (from Philadelphia chromosome)/PDGFR (platelet-derived growth factor receptor)/c-Kit (stem cell growth factor receptor), for the treatment of breast cancer and chronic myeloid leukemia, respectively (41–43). Some of the signal transduction pathways commonly altered in the malignant phenotype include various the upstream receptor tyrosine kinases, such as vascular endothelial growth factor (VEGF), EGF, insulin-like growth factor (IGF1), and PDGF, as well as downstream signaling kinases, specifically, PI3K/AKT/mTOR and Ras/Raf/MEK/MAPK pathways (38, 44–48) (Table 2).
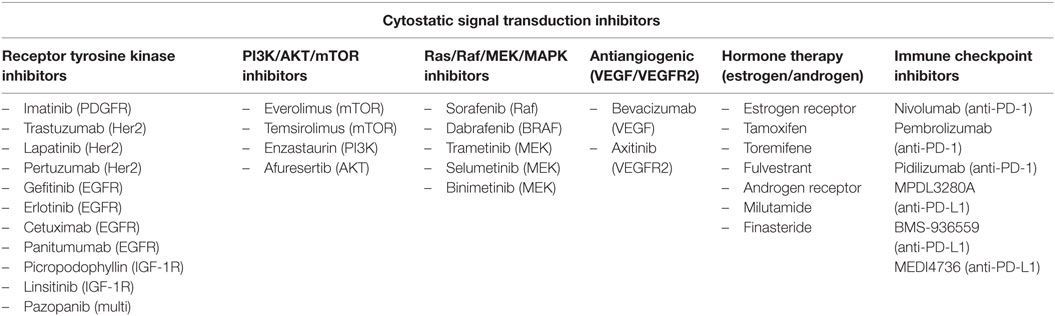
Table 2. Major classes of cytostatic agents.
Imaging Treatment Response
Response Evaluation Criteria in Solid Tumors
In the past, anatomical imaging using plain radiographs, CT, MRI, and ultrasound (US) has been applied to assess the efficacy of cytotoxic chemotherapeutics based on lesion numbers and tumor size. Response evaluation criteria in solid tumors (RECIST) to measure lesion diameters have been the “gold standard” end point for cytotoxic agents for decades (49–51). Once target lesions are measured using single linear summation (lesion diameter by RECIST) or the bilinear volumetric approach [World Health Organization (WHO)], the treatment response is usually assigned as complete response (CR), partial response (PR, >30% linear decrease), stable disease (SD), or progressive disease (PD, >20% linear increase) (52). Since the introduction of the most recent version (RECIST 1.1) in 2009, several weakness areas have been identified, including the absence of potential early indicators of response, such as functional imaging, the scarceness of validation in rare tumors, and the lack of validation for novel targeted agents. As such, attempts to optimize the RECIST criteria are still needed to accurately evaluate tumor responses.
Advanced Imaging of Cytotoxic Response
Introduction of diffusion-weighted imaging (DWI) to assess tumor cellularity was the next step in bringing imaging endpoints from a simple volumetric measurement to a functional assessment of therapy response. Tissues with high cellularity have restricted water diffusion, which can be quantitatively assessed by calculation of water apparent diffusion coefficients (ADC) from DWI, which are considerably low in fast proliferating tumors (53–56). Aggressive tumor and metastatic lesions are repeatedly reported to have ADC values below 1.2 × 10⁻³ mm2/s. A decrease in tumor cellularity and induction of cell death by cytotoxic chemotherapeutics results in increased ADC values, and increased ADC values have been reported as imaging biomarkers for chemotherapy response (57–60). For example, in breast cancer patients, an increase in ADC values in responders (as early as one cycle of neoadjuvant chemotherapy) is a good predictor for the later decrease in MRI tumor diameters (59).
Alternative imaging platforms for cytotoxic response are based on metabolic PET. Malignant tissues are chiefly composed of rapidly dividing cells, which exhibit highly upregulated DNA synthesis. 18F-fluoro-3-deoxy-thymidine (18FLT) is a PET tracer for tumor cell proliferation (based on the high thymidine uptake by proliferating cells in the pyrimidine salvage pathway during S-phase). Although not highly specific (61, 62), a decreased signal intensity in 18FLT-PET can be observed when DNA synthesis is disrupted by chemotherapeutic agents, often simultaneously with a profound DWI response by MRI (63–65). Another PET application is based on the fact that cancer cells use large amounts of glucose as a direct source of energy to permit the exaggerated utilization of amino acids and nucleosides in the synthesis of DNA. The radioactive glucose analog FDG is the most widely used tracer in oncologic PET/CT to assess metabolic cancer aggressiveness based on high glucose uptake and metabolism through high GLUT-1 transporters and hexokinase expression/activity (66). It has been shown that in patients with lung, breast, head-and-neck, esophageal, colorectal cancers, and lymphoma, the standardized uptake values of FDG decrease in responding tumors after one cycle of chemotherapy (18, 67).
Imaging in Radiation Oncology
Radiation therapy is used as part of cancer treatment, mostly in combination with systemic chemotherapy, in roughly 50% of all cancer cases. It is especially effective in head-and-neck, breast, prostate, cervical, and skin cancer, while colorectal cancer, soft tissue sarcomas, and high-grade gliomas usually show only a limited response rate. The posttreatment effects of radiotherapy are attributed to tumor inflammation, cell necrosis and often increased angiogenesis (68, 69). Clinically, FDG-PET/CT is frequently acquired at the baseline for radiation treatment planning since high metabolic activity is regarded as a positive predictive factor for treatment response (70). A profound metabolic response, as detected by decreased FDG uptake values on postradiation PET/CT scans, has correlated with high progression-free survival rates in almost all types of cancer (71–73). Hyperpolarized MRS using [1-13C]-pyruvate also showed a significant decrease in lactate production as early as 96 h after irradiation in orthotopic rat glioma models (74) and colorectal flank xenografts (75).
Metabolic Imaging of Signal Transduction Inhibition
Changes in tumor size, the “gold-standard” of tumor response for cytotoxic chemotherapeutic agents, are often not useful in monitoring therapy response in the first cycles of STI-based therapy. Humanized monoclonal antibodies and small-molecule receptor tyrosine kinase inhibitors have been developed to target epidermal growth factor receptors (EGFR), platelet-derived growth factor receptor (PDGFR), and insulin-like growth factor receptor (IGF-1R), which are overexpressed in a significant number of human malignancies. These inhibitors of the receptor activity include gefitinib, erlotinib, imatinib, cetuximab, and trastuzumab and have the most profound metabolic effects by inhibiting both glucose and choline metabolism, which are two main metabolic hallmarks of cancer (76–78). Therefore, the imaging response to receptor inhibitors has been successfully monitored – both preclinically and clinically – using glucose-based (FDG-PET and hyperpolarized 13C-MRS) (79–89) and choline-based (1H-/31P-MRS and choline-PET) metabolic imaging (90–92). The metabolic response on FDG-PET was seen as early as 8 days after initiation of treatment (93).
Upstream receptor upregulation leads to the downstream activation of two main intracellular onco-pathways: the GTPase Ras/Raf/MEK/MAPK and the lipid kinase PI3K/AKT/mTOR pathways. It has been convincingly shown that the PI3K/AKT/mTOR pathway directly downregulates glucose metabolism: a significant decrease in glucose uptake, lactate production, and glycolytic enzyme expression has been seen with several mTOR (94–97) and PI3K inhibitors (98, 99). 13C-MRSI measurements of the conversion of hyperpolarized [1-13C]-pyruvate into lactate have been used to image the decrease in tumor LDH activity due to the inhibition of the PI3K/AKT/mTOR pathway. Confirming these MRS data, the decreased FDG uptake was seen on PET scans upon mTOR/PI3K inhibition (97, 100, 101). Most recently, the US Centers for Medicare and Medicaid Services (CMS) have approved the coverages of FDG-PET/CT for treatment response in most solid tumors, especially for the treatment strategies based on receptor tyrosine kinase inhibitors and PI3K/AKT/mTOR mediated pathways (88). FDG-PET is intrinsically a quantitative imaging technique for early STI treatment response based on calculations of the standardized uptake value (SUV) of FDG uptake (77, 97). An improved quantification of treatment response based on decreased SUVs has been introduced as the PET response criteria in solid tumors (PERCIST 1.0) (102).
In contrast, MEK inhibitors, with MEK being the main therapeutic target from the Ras/Raf/MEK/MAPK pathway, do not exhibit a considerable glycolytic effect as revealed by FDG-PET and hyperpolarized MRS (64, 103, 104), but significantly reduce choline metabolism (104–106). Choline is a precursor of phosphatidylcholine, the major cell membrane phospholipid. Ras/Raf/MEK/MAPK pathway inhibition leads to the decrease in choline transporters and might also influence the activity of choline kinase (CHKα) leading to a significant decrease of the total choline peak detected by MRS. 11C- or 18F-choline PET/CT can be used to detect a significant decrease in tracer uptake following treatment with various targeted STIs, especially those from the Ras/Raf/MEK/MAPK pathway (107).
While the PI3K/AKT/mTOR pathway is considered to be “glucose-dependent,” recent studies have shown that the MYC oncogene, which encodes a master transcription factor c-Myc, regulates glutamine catabolism to fuel growth and proliferation of cancer cells through upregulating glutaminase (GLS) (108–110). The first success in imaging glutaminase activity by MRS was achieved using hyperpolarized 13C-glutamine (111). Recently, 11C- and 18F-labeled glutamine has been synthesized and successfully utilized for non-invasive PET detection of c-Myc tumors in rodent models (112, 113). In addition, recent in vitro MRS studies with c-Myc overexpressed breast cancer cells showed a significant suppression of glutaminolysis when treated with aminooxyacetate, an inhibitor of aminotransferases involved in amino acid metabolism (114, 115). Several c-Myc inhibitors are now in preclinical testing, and glutamine-PET will be an obvious technique of choice for monitoring metabolic treatment response.
Positron emission tomography measurements of the uptake and trapping of 11C-acetate, due to the increased expression of fatty acid synthase (FASN), have been used to detect prostate cancer and hepatocellular carcinoma – two cancers where FDG-PET evaluations have proven to be challenging or non-effective (116–118). The use of 11C-acetate PET/CT can be useful while assessing treatment response to FASN and fat oxidation inhibitors, such as orlistat and etomoxir, in prostate cancer (119, 120).
Finally, the therapeutic efficacy of antiangiogenic agents targeting the VEGF/VEGFR2 pathway can be monitored using dynamic contrast-enhanced (DCE)-MRI (121–123). The time-dependent signal enhancement on dynamic T1-weighted MRI reflects intratumoral contrast delivery after an intravenous injection of gadolinium contrast and is proportional to tumor perfusion and vascularity. A dramatic decrease in T1-enhancement, calculated as decreased gadolinium transfer constant, Ktrans, or the decreased area under the enhancement curve, AUC, was seen after tumor treatment with VEGF antibodies, such as bevasizumab, or VEGFR2 tyrosine kinase inhibitors.
Imaging of Hormone- and Immune-Based Therapies
In addition to cytotoxic DNA-interfering agents and cytostatic STIs, other classes of anticancer drugs have been developed. The most promising are hormones and hormone antagonists for breast, prostate, and endocrine tumors. 18F-labeled PET tracers for androgen and estrogen receptor imaging have been developed and tested in animal models (124, 125); 18F-fluoro-estradiol (FES) is undergoing clinical trials to monitor early treatment response to aromatase inhibitors, such as tamoxifen and fulvestrant, in ER+ breast cancer patients (126, 127). Finally, the most exciting area in anticancer treatment lies in cancer immunotherapy and novel immunomodulatory targeted agents (128). The inhibitors of the programed cell death receptor PD-1 and its ligands PDL-1, such as nivolumab and pembrolizumab, have recently shown a promising antitumor activity in melanoma and lung cancers and, to some degree, in triple-negative breast cancers (129–131). The most recent report from the phase Ib on pembrolizumab in patients with advanced melanoma clearly demonstrated that conventional RECIST criteria are not appropriate for the adequate assessment of immune response and might underestimate the benefit of the immune checkpoint blockade in 15% of treated patients leading to premature cessation of treatment (132). However, the metabolic aspects of this activated antitumor immune response are still to be elucidated.
Conclusion
For “classic” chemotherapeutic agents, increased ADC values by DWI reflect an early cytotoxic treatment response due to decreased tumor cellularity and are an attractive alternative to volumetric imaging. For novel STIs, physiological and metabolic imaging protocols should be carefully chosen based on a particular signal transduction pathway involved. For receptor tyrosine kinase inhibitors and PI3K/AKT/mTOR inhibition, a specific decrease in glycolytic activity has been reported; therefore, glucose imaging using hyperpolarized 13C-pyruvate MRSI or FDG-PET is most sensitive. Inhibition of the Kennedy pathway as monitored by decreased total choline MRSI or 11C-/18F-choline PET is a putative marker for the treatment response of Ras/Raf/MEK/MAPK inhibitors. For antiangiogenic agents (VEGF/VEGFR2 inhibitors), DCE-MRI is the technique of choice to assess decreased perfusion and vascularity.
Introduction of novel targeted STIs, including immune checkpoint inhibitors, requires a robust validation of novel quantitative imaging end points from PET, MRS, and other supporting imaging platforms that characterize early physiological and metabolic treatment response before a reduction in tumor burden can be seen (6). Using medical imaging to distinguish responders versus non-responders at early time points can contribute to improved tailoring of therapy in individual cancer patients. The new term, radiogenomics, has recently been introduced to link quantitative physiological imaging end points with molecular markers of signal transduction pathway inhibition (133).
Author Contributions
Both the authors listed, have made substantial, direct, and intel-lectual contribution to the work, and approved it for publication.
Conflict of Interest Statement
The authors declare that the research was conducted in the absence of any commercial or financial relationships that could be construed as a potential conflict of interest.
The reviewers M-FP, KG, and BK and handling Editor declared their shared affiliation, and the handling Editor/Specialty Chief Editor states that the process nevertheless met the standards of a fair and objective review.
Funding
This work was supported by the NIH 1UM1 CA186688, P30 CA046934, UL1 TR001082, and R21 CA194477 grants.
References
1. Curran SD, Muellner AU, Schwartz LH. Imaging response assessment in oncology. Cancer Imaging (2006) 6:S126–30. doi:10.1102/1470-7330.2006.9039
2. Marcus CD, Ladam-Marcus V, Cucu C, Bouche O, Lucas L, Hoeffel C. Imaging techniques to evaluate the response to treatment in oncology: current standards and perspectives. Crit Rev Oncol Hematol (2009) 72(3):217–38. doi:10.1016/j.critrevonc.2008.07.012
3. Druker B. Signal transduction inhibition: results from phase I clinical trials in chronic myeloid leukemia. Semin Hematol (2001) 38(3 Suppl 8):9–14. doi:10.1016/S0037-1963(01)90112-X
4. Kelly CM, Power DG, Lichtman SM. Targeted therapy in older patients with solid tumors. J Clin Oncol (2014) 32(24):2635–46. doi:10.1200/JCO.2014.55.4246
5. Alvarez RH, Valero V, Hortobagyi GN. Emerging targeted therapies for breast cancer. J Clin Oncol (2010) 28(20):3366–79. doi:10.1200/JCO.2009.25.4011
6. Brindle K. New approaches for imaging tumour responses to treatment. Nat Rev Cancer (2008) 8(2):94–107. doi:10.1038/nrc2289
7. Munagala R, Aqil F, Gupta RC. Promising molecular targeted therapies in breast cancer. Indian J Pharmacol (2011) 43(3):236–45. doi:10.4103/0253-7613.81497
8. Kantarjian H, Rajkumar SV. Why are cancer drugs so expensive in the United States, and what are the solutions? Mayo Clin Proc (2015) 90(4):500–4. doi:10.1016/j.mayocp.2015.01.014
9. Tefferi A, Kantarjian H, Rajkumar SV, Baker LH, Abkowitz JL, Adamson JW, et al. In support of a patient-driven initiative and petition to lower the high price of cancer drugs. Mayo Clin Proc (2015) 90(8):996–1000. doi:10.1016/j.mayocp.2015.06.001
10. Sawyers CL, van ’t Veer LJ. Reliable and effective diagnostics are keys to accelerating personalized cancer medicine and transforming cancer care: a policy statement from the American Association for Cancer Research. Clin Cancer Res (2014) 20(19):4978–81. doi:10.1158/1078-0432.CCR-14-2295
11. Memmott RM, Dennis PA. Akt-dependent and -independent mechanisms of mTOR regulation in cancer. Cell Signal (2009) 21(5):656–64. doi:10.1016/j.cellsig.2009.01.004
12. Flavin R, Zadra G, Loda M. Metabolic alterations and targeted therapies in prostate cancer. J Pathol (2011) 223(2):283–94. doi:10.1002/path.2809
13. Vander Heiden MG. Targeting cancer metabolism: a therapeutic window opens. Nat Rev Drug Discov (2011) 10(9):671–84. doi:10.1038/nrd3504
14. Shen L, Sun X, Fu Z, Yang G, Li J, Yao L. The fundamental role of the p53 pathway in tumor metabolism and its implication in tumor therapy. Clin Cancer Res (2012) 18(6):1561–7. doi:10.1158/1078-0432.CCR-11-3040
15. Kimmelman AC. Metabolic dependencies in RAS-driven cancers. Clin Cancer Res (2015) 21(8):1828–34. doi:10.1158/1078-0432.CCR-14-2425
16. White E, Mehnert JM, Chan CS. Autophagy, metabolism, and cancer. Clin Cancer Res (2015) 21(22):5037–46. doi:10.1158/1078-0432.CCR-15-0490
17. Herholz K, Coope D, Jackson A. Metabolic and molecular imaging in neuro-oncology. Lancet Neurol (2007) 6(8):711–24. doi:10.1016/S1474-4422(07)70192-8
18. Juweid ME, Cheson BD. Positron-emission tomography and assessment of cancer therapy. N Engl J Med (2006) 354(5):496–507. doi:10.1056/NEJMra050276
19. Bolan PJ, Nelson MT, Yee D, Garwood M. Imaging in breast cancer: magnetic resonance spectroscopy. Breast Cancer Res (2005) 7(4):149–52. doi:10.1186/bcr1202
20. Sardanelli F, Fausto A, Di Leo G, de Nijs R, Vorbuchner M, Podo F. In vivo proton MR spectroscopy of the breast using the total choline peak integral as a marker of malignancy. AJR Am J Roentgenol (2009) 192(6):1608–17. doi:10.2214/AJR.07.3521
21. Glunde K, Ackerstaff E, Mori N, Jacobs MA, Bhujwalla ZM. Choline phospholipid metabolism in cancer: consequences for molecular pharmaceutical interventions. Mol Pharm (2006) 3(5):496–506. doi:10.1021/mp060067e
22. Day SE, Kettunen MI, Gallagher FA, Hu DE, Lerche M, Wolber J, et al. Detecting tumor response to treatment using hyperpolarized 13C magnetic resonance imaging and spectroscopy. Nat Med (2007) 13(11):1382–7. doi:10.1038/nm1650
23. Albers MJ, Bok R, Chen AP, Cunningham CH, Zierhut ML, Zhang VY, et al. Hyperpolarized 13C lactate, pyruvate, and alanine: noninvasive biomarkers for prostate cancer detection and grading. Cancer Res (2008) 68(20):8607–15. doi:10.1158/0008-5472.CAN-08-0749
24. Bates SE, Amiri-Kordestani L, Giaccone G. Drug development: portals of discovery. Clin Cancer Res (2012) 18(1):23–32. doi:10.1158/1078-0432.CCR-11-1001
25. Nygren P; SBU-Group Swedish Council on Technology Assessment in Health Care. What is cancer chemotherapy? Acta Oncol (2001) 40(2–3):166–74. doi:10.1080/02841860151116204
26. Awada A. New cytotoxic agents and molecular-targeted therapies in the treatment of metastatic breast cancer. Forum (Genova) (2002) 12(1):4–15.
27. Esteva FJ, Valero V, Pusztai L, Boehnke-Michaud L, Buzdar AU, Hortobagyi GN. Chemotherapy of metastatic breast cancer: what to expect in 2001 and beyond. Oncologist (2001) 6(2):133–46. doi:10.1634/theoncologist.6-2-133
28. Tol J, Koopman M, Cats A, Rodenburg CJ, Creemers GJ, Schrama JG, et al. Chemotherapy, bevacizumab, and cetuximab in metastatic colorectal cancer. N Engl J Med (2009) 360(6):563–72. doi:10.1056/NEJMoa0808268
29. Crown J, O’Leary M. The taxanes: an update. Lancet (2000) 355(9210):1176–8. doi:10.1016/S0140-6736(00)02074-2
30. Cunningham D, Starling N, Rao S, Iveson T, Nicolson M, Coxon F, et al. Capecitabine and oxaliplatin for advanced esophagogastric cancer. N Engl J Med (2008) 358(1):36–46. doi:10.1056/NEJMoa073149
31. Gianni L, Norton L, Wolmark N, Suter TM, Bonadonna G, Hortobagyi GN. Role of anthracyclines in the treatment of early breast cancer. J Clin Oncol (2009) 27(28):4798–808. doi:10.1200/JCO.2008.21.4791
32. Rivera E, Valero V, Syrewicz L, Rahman Z, Esteva FJ, Theriault RL, et al. Phase I study of stealth liposomal doxorubicin in combination with gemcitabine in the treatment of patients with metastatic breast cancer. J Clin Oncol (2001) 19(6):1716–22.
33. Gokduman K. Strategies targeting DNA topoisomerase I in cancer chemotherapy: camptothecins, nanocarriers for camptothecins, organic non-camptothecin compounds and metal complexes. Curr Drug Targets (2016).
34. Booth CM, Ohorodnyk P, Eisenhauer EA. Call for clarity in the reporting of benefit associated with anticancer therapies. J Clin Oncol (2009) 27(33):e213–4. doi:10.1200/JCO.2009.24.8542
35. Serkova NJ, Garg K, Bradshaw-Pierce EL. Oncologic imaging end-points for the assessment of therapy response. Recent Pat Anticancer Drug Discov (2009) 4(1):36–53. doi:10.2174/157489209787002434
36. El-Deiry WS, Sigman CC, Kelloff GJ. Imaging and oncologic drug development. J Clin Oncol (2006) 24(20):3261–73. doi:10.1200/JCO.2006.06.5623
37. Padhani AR, Miles KA. Multiparametric imaging of tumor response to therapy. Radiology (2010) 256(2):348–64. doi:10.1148/radiol.10091760
38. Mendelsohn J, Baselga J. Epidermal growth factor receptor targeting in cancer. Semin Oncol (2006) 33(4):369–85. doi:10.1053/j.seminoncol.2006.04.003
39. Baselga J. Targeting tyrosine kinases in cancer: the second wave. Science (2006) 312(5777):1175–8. doi:10.1126/science.1125951
40. Benavent M, de Miguel MJ, Garcia-Carbonero R. New targeted agents in gastroenteropancreatic neuroendocrine tumors. Target Oncol (2012) 7(2):99–106. doi:10.1007/s11523-012-0218-9
41. Leyland-Jones B. Trastuzumab: hopes and realities. Lancet Oncol (2002) 3(3):137–44. doi:10.1016/S1470-2045(02)00676-9
42. Druker BJ. Perspectives on the development of imatinib and the future of cancer research. Nat Med (2009) 15(10):1149–52. doi:10.1038/nm1009-1149
43. Druker B. Imatinib (Gleevec) as a paradigm of targeted cancer therapies. Keio J Med (2010) 59(1):1–3. doi:10.2302/kjm.59.1
44. Ellis LM. Antiangiogenic therapy: more promise and, yet again, more questions. J Clin Oncol (2003) 21(21):3897–9. doi:10.1200/JCO.2003.07.977
45. Hegi ME, Rajakannu P, Weller M. Epidermal growth factor receptor: a re-emerging target in glioblastoma. Curr Opin Neurol (2012) 25(6):774–9. doi:10.1097/WCO.0b013e328359b0bc
46. Hirakawa T, Yashiro M, Murata A, Hirata K, Kimura K, Amano R, et al. IGF-1 receptor and IGF binding protein-3 might predict prognosis of patients with resectable pancreatic cancer. BMC Cancer (2013) 13:392. doi:10.1186/1471-2407-13-392
47. Shaw RJ, Cantley LC. Ras, PI(3)K and mTOR signalling controls tumour cell growth. Nature (2006) 441(7092):424–30. doi:10.1038/nature04869
48. Early Breast Cancer Trialists’ Collaborative Group. Effects of chemotherapy and hormonal therapy for early breast cancer on recurrence and 15-year survival: an overview of the randomised trials. Lancet (2005) 365(9472):1687–717. doi:10.1016/S0140-6736(05)66544-0
49. Jaffe CC. Measures of response: RECIST, WHO, and new alternatives. J Clin Oncol (2006) 24(20):3245–51. doi:10.1200/JCO.2006.06.5599
50. Jaffe CC. Response assessment in clinical trials: implications for sarcoma clinical trial design. Oncologist (2008) 13(Suppl 2):14–8. doi:10.1634/theoncologist.13-S2-14
51. Eisenhauer EA, Therasse P, Bogaerts J, Schwartz LH, Sargent D, Ford R, et al. New response evaluation criteria in solid tumours: revised RECIST guideline (version 1.1). Eur J Cancer (2009) 45(2):228–47. doi:10.1016/j.ejca.2008.10.026
52. Chia S, Dent S, Ellard S, Ellis PM, Vandenberg T, Gelmon K, et al. Phase II trial of OGX-011 in combination with docetaxel in metastatic breast cancer. Clin Cancer Res (2009) 15(2):708–13. doi:10.1158/1078-0432.CCR-08-1159
53. Hamstra DA, Rehemtulla A, Ross BD. Diffusion magnetic resonance imaging: a biomarker for treatment response in oncology. J Clin Oncol (2007) 25(26):4104–9. doi:10.1200/JCO.2007.11.9610
54. Padhani AR, Koh DM, Collins DJ. Whole-body diffusion-weighted MR imaging in cancer: current status and research directions. Radiology (2011) 261(3):700–18. doi:10.1148/radiol.11110474
55. Partridge SC, Mullins CD, Kurland BF, Allain MD, DeMartini WB, Eby PR, et al. Apparent diffusion coefficient values for discriminating benign and malignant breast MRI lesions: effects of lesion type and size. AJR Am J Roentgenol (2010) 194(6):1664–73. doi:10.2214/AJR.09.3534
56. Eiber M, Holzapfel K, Ganter C, Epple K, Metz S, Geinitz H, et al. Whole-body MRI including diffusion-weighted imaging (DWI) for patients with recurring prostate cancer: technical feasibility and assessment of lesion conspicuity in DWI. J Magn Reson Imaging (2011) 33(5):1160–70. doi:10.1002/jmri.22542
57. Lee KC, Hamstra DA, Bhojani MS, Khan AP, Ross BD, Rehemtulla A. Noninvasive molecular imaging sheds light on the synergy between 5-fluorouracil and TRAIL/Apo2L for cancer therapy. Clin Cancer Res (2007) 13(6):1839–46. doi:10.1158/1078-0432.CCR-06-1657
58. Padhani AR, Khan AA. Diffusion-weighted (DW) and dynamic contrast-enhanced (DCE) magnetic resonance imaging (MRI) for monitoring anticancer therapy. Target Oncol (2010) 5(1):39–52. doi:10.1007/s11523-010-0135-8
59. Jensen LR, Garzon B, Heldahl MG, Bathen TF, Lundgren S, Gribbestad IS. Diffusion-weighted and dynamic contrast-enhanced MRI in evaluation of early treatment effects during neoadjuvant chemotherapy in breast cancer patients. J Magn Reson Imaging (2011) 34(5):1099–109. doi:10.1002/jmri.22726
60. Ng TS, Wert D, Sohi H, Procissi D, Colcher D, Raubitschek AA, et al. Serial diffusion MRI to monitor and model treatment response of the targeted nanotherapy CRLX101. Clin Cancer Res (2013) 19(9):2518–27. doi:10.1158/1078-0432.CCR-12-2738
61. Zhang CC, Yan Z, Li W, Kuszpit K, Painter CL, Zhang Q, et al. [(18)F]FLT-PET imaging does not always “light up” proliferating tumor cells. Clin Cancer Res (2012) 18(5):1303–12. doi:10.1158/1078-0432.CCR-11-1433
62. Shields AF. PET imaging of tumor growth: not as easy as it looks. Clin Cancer Res (2012) 18(5):1189–91. doi:10.1158/1078-0432.CCR-11-3198
63. Weber WA. Monitoring tumor response to therapy with 18F-FLT PET. J Nucl Med (2010) 51(6):841–4. doi:10.2967/jnumed.109.071217
64. Honndorf VS, Schmidt H, Wiehr S, Wehrl HF, Quintanilla-Martinez L, Stahlschmidt A, et al. The synergistic effect of selumetinib/docetaxel combination therapy monitored by [(18) F]FDG/[(18) F]FLT PET and diffusion-weighted magnetic resonance imaging in a colorectal tumor xenograft model. Mol Imaging Biol (2016) 18(2):249–57. doi:10.1007/s11307-015-0881-1
65. Leyton J, Latigo JR, Perumal M, Dhaliwal H, He Q, Aboagye EO. Early detection of tumor response to chemotherapy by 3’-deoxy-3’-[18F]fluorothymidine positron emission tomography: the effect of cisplatin on a fibrosarcoma tumor model in vivo. Cancer Res (2005) 65(10):4202–10. doi:10.1158/0008-5472.CAN-04-4008
66. Kaira K, Endo M, Abe M, Nakagawa K, Ohde Y, Okumura T, et al. Biologic correlation of 2-[18F]-fluoro-2-deoxy-d-glucose uptake on positron emission tomography in thymic epithelial tumors. J Clin Oncol (2010) 28(23):3746–53. doi:10.1200/JCO.2009.27.4662
67. Shankar LK, Hoffman JM, Bacharach S, Graham MM, Karp J, Lammertsma AA, et al. Consensus recommendations for the use of 18F-FDG PET as an indicator of therapeutic response in patients in National Cancer Institute Trials. J Nucl Med (2006) 47(6):1059–66.
68. Bonner JA, Harari PM, Giralt J, Azarnia N, Shin DM, Cohen RB, et al. Radiotherapy plus cetuximab for squamous-cell carcinoma of the head and neck. N Engl J Med (2006) 354(6):567–78. doi:10.1056/NEJMoa053422
69. Dirix P, Vandecaveye V, De Keyzer F, Stroobants S, Hermans R, Nuyts S. Dose painting in radiotherapy for head and neck squamous cell carcinoma: value of repeated functional imaging with (18)F-FDG PET, (18)F-fluoromisonidazole PET, diffusion-weighted MRI, and dynamic contrast-enhanced MRI. J Nucl Med (2009) 50(7):1020–7. doi:10.2967/jnumed.109.062638
70. Herrera FG, Breuneval T, Prior JO, Bourhis J, Ozsahin M. [(18)F]FDG-PET/CT metabolic parameters as useful prognostic factors in cervical cancer patients treated with chemo-radiotherapy. Radiat Oncol (2016) 11(1):43. doi:10.1186/s13014-016-0614-x
71. Schwarz JK, Siegel BA, Dehdashti F, Myerson RJ, Fleshman JW, Grigsby PW. Tumor response and survival predicted by post-therapy FDG-PET/CT in anal cancer. Int J Radiat Oncol Biol Phys (2008) 71(1):180–6. doi:10.1016/j.ijrobp.2007.09.005
72. Krause BJ, Herrmann K, Wieder H, zum Buschenfelde CM. 18F-FDG PET and 18F-FDG PET/CT for assessing response to therapy in esophageal cancer. J Nucl Med (2009) 50(Suppl 1):89S–96S. doi:10.2967/jnumed.108.057232
73. Schoder H, Fury M, Lee N, Kraus D. PET monitoring of therapy response in head and neck squamous cell carcinoma. J Nucl Med (2009) 50(Suppl 1):74S–88S. doi:10.2967/jnumed.108.057208
74. Day SE, Kettunen MI, Cherukuri MK, Mitchell JB, Lizak MJ, Morris HD, et al. Detecting response of rat C6 glioma tumors to radiotherapy using hyperpolarized [1-13C]pyruvate and 13C magnetic resonance spectroscopic imaging. Magn Reson Med (2011) 65(2):557–63. doi:10.1002/mrm.22698
75. Saito K, Matsumoto S, Takakusagi Y, Matsuo M, Morris HD, Lizak MJ, et al. 13C-MR spectroscopic imaging with hyperpolarized [1-13C]pyruvate detects early response to radiotherapy in SCC tumors and HT-29 tumors. Clin Cancer Res (2015) 21(22):5073–81. doi:10.1158/1078-0432.CCR-14-1717
76. Podo F, Canevari S, Canese R, Pisanu ME, Ricci A, Iorio E. MR evaluation of response to targeted treatment in cancer cells. NMR Biomed (2011) 24(6):648–72. doi:10.1002/nbm.1658
77. Contractor KB, Aboagye EO. Monitoring predominantly cytostatic treatment response with 18F-FDG PET. J Nucl Med (2009) 50(Suppl 1):97S–105S. doi:10.2967/jnumed.108.057273
78. Moestue SA, Engebraaten O, Gribbestad IS. Metabolic effects of signal transduction inhibition in cancer assessed by magnetic resonance spectroscopy. Mol Oncol (2011) 5(3):224–41. doi:10.1016/j.molonc.2011.04.001
79. Na II, Byun BH, Kang HJ, Cheon GJ, Koh JS, Kim CH, et al. 18F-fluoro-2-deoxy-glucose uptake predicts clinical outcome in patients with gefitinib-treated non-small cell lung cancer. Clin Cancer Res (2008) 14(7):2036–41. doi:10.1158/1078-0432.CCR-07-4074
80. Aukema TS, Kappers I, Olmos RA, Codrington HE, van Tinteren H, van Pel R, et al. Is 18F-FDG PET/CT useful for the early prediction of histopathologic response to neoadjuvant erlotinib in patients with non-small cell lung cancer? J Nucl Med (2010) 51(9):1344–8. doi:10.2967/jnumed.110.076224
81. van Gool MH, Aukema TS, Hartemink KJ, Valdes Olmos RA, van Tinteren H, Klomp HM. FDG-PET/CT response evaluation during EGFR-TKI treatment in patients with NSCLC. World J Radiol (2014) 6(7):392–8. doi:10.4329/wjr.v6.i7.392
82. van Gool MH, Aukema TS, Schaake EE, Rijna H, Valdes Olmos RA, van Pel R, et al. Timing of metabolic response monitoring during erlotinib treatment in non-small cell lung cancer. J Nucl Med (2014) 55(7):1081–6. doi:10.2967/jnumed.113.130674
83. Cheyne RW, Trembleau L, McLaughlin A, Smith TA. Changes in 2-fluoro-2-deoxy-d-glucose incorporation, hexokinase activity and lactate production by breast cancer cells responding to treatment with the anti-HER-2 antibody trastuzumab. Nucl Med Biol (2011) 38(3):339–46. doi:10.1016/j.nucmedbio.2010.09.005
84. Krystal GW, Alesi E, Tatum JL. Early FDG/PET scanning as a pharmacodynamic marker of anti-EGFR antibody activity in colorectal cancer. Mol Cancer Ther (2012) 11(7):1385–8. doi:10.1158/1535-7163.MCT-12-0011
85. Su H, Bodenstein C, Dumont RA, Seimbille Y, Dubinett S, Phelps ME, et al. Monitoring tumor glucose utilization by positron emission tomography for the prediction of treatment response to epidermal growth factor receptor kinase inhibitors. Clin Cancer Res (2006) 12(19):5659–67. doi:10.1158/1078-0432.CCR-06-0368
86. Soundararajan A, Abraham J, Nelon LD, Prajapati SI, Zarzabal LA, Michalek JE, et al. 18F-FDG microPET imaging detects early transient response to an IGF1R inhibitor in genetically engineered rhabdomyosarcoma models. Pediatr Blood Cancer (2012) 59(3):485–92. doi:10.1002/pbc.24075
87. Ekman S, Frodin JE, Harmenberg J, Bergman A, Hedlund A, Dahg P, et al. Clinical phase I study with an insulin-like growth factor-1 receptor inhibitor: experiences in patients with squamous non-small cell lung carcinoma. Acta Oncol (2011) 50(3):441–7. doi:10.3109/0284186X.2010.499370
88. McKinley ET, Bugaj JE, Zhao P, Guleryuz S, Mantis C, Gokhale PC, et al. 18FDG-PET predicts pharmacodynamic response to OSI-906, a dual IGF-1R/IR inhibitor, in preclinical mouse models of lung cancer. Clin Cancer Res (2011) 17(10):3332–40. doi:10.1158/1078-0432.CCR-10-2274
89. Kominsky DJ, Klawitter J, Brown JL, Boros LG, Melo JV, Eckhardt SG, et al. Abnormalities in glucose uptake and metabolism in imatinib-resistant human BCR-ABL-positive cells. Clin Cancer Res (2009) 15(10):3442–50. doi:10.1158/1078-0432.CCR-08-3291
90. Klawitter J, Kominsky DJ, Brown JL, Klawitter J, Christians U, Leibfritz D, et al. Metabolic characteristics of imatinib resistance in chronic myeloid leukaemia cells. Br J Pharmacol (2009) 158(2):588–600. doi:10.1111/j.1476-5381.2009.00345.x
91. Klawitter J, Anderson N, Klawitter J, Christians U, Leibfritz D, Eckhardt SG, et al. Time-dependent effects of imatinib in human leukaemia cells: a kinetic NMR-profiling study. Br J Cancer (2009) 100(6):923–31. doi:10.1038/sj.bjc.6604946
92. Glunde K, Serkova NJ. Therapeutic targets and biomarkers identified in cancer choline phospholipid metabolism. Pharmacogenomics (2006) 7(7):1109–23. doi:10.2217/14622416.7.7.1109
93. Stroobants S, Goeminne J, Seegers M, Dimitrijevic S, Dupont P, Nuyts J, et al. 18FDG-Positron emission tomography for the early prediction of response in advanced soft tissue sarcoma treated with imatinib mesylate (Glivec). Eur J Cancer (2003) 39(14):2012–20. doi:10.1016/S0959-8049(03)00073-X
94. Lee SC, Marzec M, Liu X, Wehrli S, Kantekure K, Ragunath PN, et al. Decreased lactate concentration and glycolytic enzyme expression reflect inhibition of mTOR signal transduction pathway in B-cell lymphoma. NMR Biomed (2013) 26(1):106–14.
95. Chaumeil MM, Ozawa T, Park I, Scott K, James CD, Nelson SJ, et al. Hyperpolarized 13C MR spectroscopic imaging can be used to monitor everolimus treatment in vivo in an orthotopic rodent model of glioblastoma. Neuroimage (2012) 59(1):193–201. doi:10.1016/j.neuroimage.2011.07.034
96. Wei LH, Su H, Hildebrandt IJ, Phelps ME, Czernin J, Weber WA. Changes in tumor metabolism as readout for mammalian target of rapamycin kinase inhibition by rapamycin in glioblastoma. Clin Cancer Res (2008) 14(11):3416–26. doi:10.1158/1078-0432.CCR-07-1824
97. Ma WW, Jacene H, Song D, Vilardell F, Messersmith WA, Laheru D, et al. [18F]fluorodeoxyglucose positron emission tomography correlates with Akt pathway activity but is not predictive of clinical outcome during mTOR inhibitor therapy. J Clin Oncol (2009) 27(16):2697–704. doi:10.1200/JCO.2008.18.8383
98. Ward CS, Venkatesh HS, Chaumeil MM, Brandes AH, Vancriekinge M, Dafni H, et al. Noninvasive detection of target modulation following phosphatidylinositol 3-kinase inhibition using hyperpolarized 13C magnetic resonance spectroscopy. Cancer Res (2010) 70(4):1296–305. doi:10.1158/0008-5472.CAN-09-2251
99. Lodi A, Ronen SM. Magnetic resonance spectroscopy detectable metabolomic fingerprint of response to antineoplastic treatment. PLoS One (2011) 6(10):e26155. doi:10.1371/journal.pone.0026155
100. Nogova L, Boellaard R, Kobe C, Hoetjes N, Zander T, Gross SH, et al. Downregulation of 18F-FDG uptake in PET as an early pharmacodynamic effect in treatment of non-small cell lung cancer with the mTOR inhibitor everolimus. J Nucl Med (2009) 50(11):1815–9. doi:10.2967/jnumed.109.065367
101. Maynard J, Ricketts SA, Gendrin C, Dudley P, Davies BR. 2-Deoxy-2-[18F]fluoro-d-glucose positron emission tomography demonstrates target inhibition with the potential to predict anti-tumour activity following treatment with the AKT inhibitor AZD5363. Mol Imaging Biol (2013) 15(4):476–85. doi:10.1007/s11307-013-0613-3
102. Wahl RL, Jacene H, Kasamon Y, Lodge MA. From RECIST to PERCIST: evolving considerations for PET response criteria in solid tumors. J Nucl Med (2009) 50(Suppl 1):122S–50S. doi:10.2967/jnumed.108.057307
103. Lodi A, Woods SM, Ronen SM. MR-detectable metabolic consequences of mitogen-activated protein kinase kinase (MEK) inhibition. NMR Biomed (2014) 27(6):700–8. doi:10.1002/nbm.3109
104. Lodi A, Woods SM, Ronen SM. Treatment with the MEK inhibitor U0126 induces decreased hyperpolarized pyruvate to lactate conversion in breast, but not prostate, cancer cells. NMR Biomed (2013) 26(3):299–306. doi:10.1002/nbm.2848
105. Beloueche-Babari M, Jackson LE, Al-Saffar NM, Workman P, Leach MO, Ronen SM. Magnetic resonance spectroscopy monitoring of mitogen-activated protein kinase signaling inhibition. Cancer Res (2005) 65(8):3356–63.
106. Morelli MP, Tentler JJ, Kulikowski GN, Tan AC, Bradshaw-Pierce EL, Pitts TM, et al. Preclinical activity of the rational combination of selumetinib (AZD6244) in combination with vorinostat in KRAS-mutant colorectal cancer models. Clin Cancer Res (2012) 18(4):1051–62. doi:10.1158/1078-0432.CCR-11-1507
107. Larson SM, Schoder H. New PET tracers for evaluation of solid tumor response to therapy. Q J Nucl Med Mol Imaging (2009) 53(2):158–66.
108. Gao P, Tchernyshyov I, Chang TC, Lee YS, Kita K, Ochi T, et al. c-Myc suppression of miR-23a/b enhances mitochondrial glutaminase expression and glutamine metabolism. Nature (2009) 458(7239):762–5. doi:10.1038/nature07823
109. Dang CV. Rethinking the Warburg effect with Myc micromanaging glutamine metabolism. Cancer Res (2010) 70(3):859–62. doi:10.1158/0008-5472.CAN-09-3556
110. Liu W, Le A, Hancock C, Lane AN, Dang CV, Fan TW, et al. Reprogramming of proline and glutamine metabolism contributes to the proliferative and metabolic responses regulated by oncogenic transcription factor c-MYC. Proc Natl Acad Sci U S A (2012) 109(23):8983–8. doi:10.1073/pnas.1203244109
111. Gallagher FA, Kettunen MI, Day SE, Lerche M, Brindle KM. 13C MR spectroscopy measurements of glutaminase activity in human hepatocellular carcinoma cells using hyperpolarized 13C-labeled glutamine. Magn Reson Med (2008) 60(2):253–7. doi:10.1002/mrm.21650
112. Qu W, Oya S, Lieberman BP, Ploessl K, Wang L, Wise DR, et al. Preparation and characterization of l-[5-11C]-glutamine for metabolic imaging of tumors. J Nucl Med (2012) 53(1):98–105. doi:10.2967/jnumed.111.093831
113. Wu Z, Zha Z, Li G, Lieberman BP, Choi SR, Ploessl K, et al. [(18)F](2S,4S)-4-(3-fluoropropyl)glutamine as a tumor imaging agent. Mol Pharm (2014) 11(11):3852–66. doi:10.1021/mp500236y
114. Korangath P, Teo WW, Sadik H, Han L, Mori N, Huijts CM, et al. Targeting glutamine metabolism in breast cancer with aminooxyacetate. Clin Cancer Res (2015) 21(14):3263–73. doi:10.1158/1078-0432.CCR-14-1200
115. Chakrabarti G, Moore ZR, Luo X, Ilcheva M, Ali A, Padanad M, et al. Targeting glutamine metabolism sensitizes pancreatic cancer to PARP-driven metabolic catastrophe induced by ss-lapachone. Cancer Metabol (2015) 3:12. doi:10.1186/s40170-015-0137-1
116. Leisser A, Pruscha K, Ubl P, Wadsak W, Mayerhofer M, Mitterhauser M, et al. Evaluation of fatty acid synthase in prostate cancer recurrence: SUV of [(11) C]acetate PET as a prognostic marker. Prostate (2015) 75(15):1760–7. doi:10.1002/pros.23061
117. Cheung TT, Ho CL, Lo CM, Chen S, Chan SC, Chok KS, et al. 11C-acetate and 18F-FDG PET/CT for clinical staging and selection of patients with hepatocellular carcinoma for liver transplantation on the basis of Milan criteria: surgeon’s perspective. J Nucl Med (2013) 54(2):192–200. doi:10.2967/jnumed.112.107516
118. Liu DD, Khong PL, Gao Y, Mahmood U, Quinn B, Germain JS, et al. Radiation dosimetry of whole-body dual tracer 18F-FDG and 11C-acetate PET/CT for hepatocellular carcinoma. J Nucl Med (2016) 57(6):907–12. doi:10.2967/jnumed.115.165944
119. Schlaepfer IR, Glode LM, Hitz CA, Pac CT, Boyle KE, Maroni P, et al. Inhibition of lipid oxidation increases glucose metabolism and enhances 2-deoxy-2-[(18)F]fluoro-d-glucose uptake in prostate cancer mouse xenografts. Mol Imaging Biol (2015) 17(4):529–38. doi:10.1007/s11307-014-0814-4
120. Sankaranarayanapillai M, Zhang N, Baggerly KA, Gelovani JG. Metabolic shifts induced by fatty acid synthase inhibitor orlistat in non-small cell lung carcinoma cells provide novel pharmacodynamic biomarkers for positron emission tomography and magnetic resonance spectroscopy. Mol Imaging Biol (2013) 15(2):136–47. doi:10.1007/s11307-012-0587-6
121. Troiani T, Serkova NJ, Gustafson DL, Henthorn TK, Lockerbie O, Merz A, et al. Investigation of two dosing schedules of vandetanib (ZD6474), an inhibitor of vascular endothelial growth factor receptor and epidermal growth factor receptor signaling, in combination with irinotecan in a human colon cancer xenograft model. Clin Cancer Res (2007) 13(21):6450–8. doi:10.1158/1078-0432.CCR-07-1094
122. Yap TA, Arkenau HT, Camidge DR, George S, Serkova NJ, Gwyther SJ, et al. First-in-human phase I trial of two schedules of OSI-930, a novel multikinase inhibitor, incorporating translational proof-of-mechanism studies. Clin Cancer Res (2013) 19(4):909–19. doi:10.1158/1078-0432.CCR-12-2258
123. O’Connor JP, Jackson A, Parker GJ, Roberts C, Jayson GC. Dynamic contrast-enhanced MRI in clinical trials of antivascular therapies. Nat Rev Clin Oncol (2012) 9(3):167–77. doi:10.1038/nrclinonc.2012.2
124. Khayum MA, Doorduin J, Antunes IF, Kwizera C, Zijlma R, den Boer JA, et al. In vivo imaging of brain androgen receptors in rats: a [(18)F]FDHT PET study. Nucl Med Biol (2015) 42(6):561–9. doi:10.1016/j.nucmedbio.2015.02.003
125. Fowler AM, Chan SR, Sharp TL, Fettig NM, Zhou D, Dence CS, et al. Small-animal PET of steroid hormone receptors predicts tumor response to endocrine therapy using a preclinical model of breast cancer. J Nucl Med (2012) 53(7):1119–26. doi:10.2967/jnumed.112.103465
126. Linden HM, Kurland BF, Peterson LM, Schubert EK, Gralow JR, Specht JM, et al. Fluoroestradiol positron emission tomography reveals differences in pharmacodynamics of aromatase inhibitors, tamoxifen, and fulvestrant in patients with metastatic breast cancer. Clin Cancer Res (2011) 17(14):4799–805. doi:10.1158/1078-0432.CCR-10-3321
127. Peterson LM, Kurland BF, Schubert EK, Link JM, Gadi VK, Specht JM, et al. A phase 2 study of 16alpha-[(18)F]-fluoro-17beta-estradiol positron emission tomography (FES-PET) as a marker of hormone sensitivity in metastatic breast cancer (MBC). Mol Imaging Biol (2014) 16(3):431–40. doi:10.1007/s11307-013-0699-7
128. Mahoney KM, Rennert PD, Freeman GJ. Combination cancer immunotherapy and new immunomodulatory targets. Nat Rev Drug Discov (2015) 14(8):561–84. doi:10.1038/nrd4591
129. Ribas A, Hamid O, Daud A, Hodi FS, Wolchok JD, Kefford R, et al. Association of pembrolizumab with tumor response and survival among patients with advanced melanoma. JAMA (2016) 315(15):1600–9. doi:10.1001/jama.2016.4059
130. Sunshine J, Taube JM. PD-1/PD-L1 inhibitors. Curr Opin Pharmacol (2015) 23:32–8. doi:10.1016/j.coph.2015.05.011
131. Swaika A, Hammond WA, Joseph RW. Current state of anti-PD-L1 and anti-PD-1 agents in cancer therapy. Mol Immunol (2015) 67(2 Pt A):4–17. doi:10.1016/j.molimm.2015.02.009
132. Hodi FS, Hwu WJ, Kefford R, Weber JS, Daud A, Hamid O, et al. Evaluation of immune-related response criteria and RECIST v1.1 in patients with advanced melanoma treated with pembrolizumab. J Clin Oncol (2016) 34(13):1510–7. doi:10.1200/JCO.2015.64.0391
Keywords: chemotherapeutics, signal transduction inhibitors, magnetic resonance spectroscopy, positron emission tomography, RECIST
Citation: Serkova NJ and Eckhardt SG (2016) Metabolic Imaging to Assess Treatment Response to Cytotoxic and Cytostatic Agents. Front. Oncol. 6:152. doi: 10.3389/fonc.2016.00152
Received: 05 April 2016; Accepted: 07 June 2016;
Published: 15 July 2016
Edited by:
Zaver Bhujwalla, Johns Hopkins University School of Medicine, USAReviewed by:
Balaji Krishnamachary, Johns Hopkins University, USAMarie-France Penet, Johns Hopkins University School of Medicine, USA
Kristine Glunde, Johns Hopkins University School of Medicine, USA
Copyright: © 2016 Serkova and Eckhardt. This is an open-access article distributed under the terms of the Creative Commons Attribution License (CC BY). The use, distribution or reproduction in other forums is permitted, provided the original author(s) or licensor are credited and that the original publication in this journal is cited, in accordance with accepted academic practice. No use, distribution or reproduction is permitted which does not comply with these terms.
*Correspondence: Natalie J. Serkova, natalie.serkova@ucdenver.edu