Detection and potential utility of C-reactive protein in saliva of neonates
 Anjali Iyengar
 Jessica K. Paulus
 Daniel J. Gerlanc
 Jill L. Maron
- 1Division of Newborn Medicine, Floating Hospital for Children at Tufts Medical Center, Boston, MA, USA
- 2Tufts Medical Center, The Institute for Clinical Research and Health Policy Studies, Boston, MA, USA
- 3Tufts Clinical and Translational Science Institute, Tufts University, Boston, MA, USA
- 4Enplus Advisors Inc., Cambridge, MA, USA
- 5Mother Infant Research Institute (MIRI) at Tufts Medical Center, Boston, MA, USA
Objective: We aimed to detect C-reactive protein (CRP) in neonatal saliva and evaluate its diagnostic utility.
Study Design: Salivary and serum samples (n = 89) were collected from 40 neonates. Salivary CRP levels were determined using an enzyme-linked immunosorbent assay; serum CRP was measured per hospital protocol. Correlation coefficients with 95% confidence intervals and robust linear regression measured association while receiver–operator characteristic curves described the accuracy of salivary CRP in discriminating abnormal serum CRP thresholds of ≥10 and 5 mg/L. Corresponding sensitivities and specificities were calculated for these salivary cutpoints.
Results: The area under the curve for salivary CRP in predicting serum CRP levels of ≥10 and 5 mg/L were 0.81 and 0.76, respectively. The corresponding sensitivity and specificity for raw salivary CRP to discriminate a serum CRP of ≥5 mg/L was 0.54 and 0.95, respectively. The corresponding sensitivity and specificity for raw salivary CRP to discriminate a serum CRP of ≥10 mg/L was 0.64 and 0.94, respectively. A statistically significant correlation was observed between serum and salivary CRP (r = 0.62, p < 0.001).
Conclusion: C-reactive protein is detectable in neonatal saliva and can predict abnormal serum CRP thresholds. Salivary CRP analysis represents a feasible screening tool for detecting abnormal serum CRP levels.
Introduction
C-reactive protein (CRP) is an extensively utilized biomarker for monitoring sepsis, post-surgical complications, and inflammation in the pediatric and neonatal populations (1). Produced in the liver in response to IL-6, CRP levels rise rapidly during infection and/or inflammation (1, 2). However, a current limitation to the usefulness of serial CRP monitoring in the neonatal population is its reliance on frequent blood draws in a vulnerable population with limited blood volumes. Developing a non-invasive assay for the quantification of CRP in neonates could reduce neonatal side-effects and ultimately improve its clinical utility.
Saliva is an excellent biofluid to non-invasively monitor the neonate. Filtered from whole blood in the salivary glands, saliva is an important reservoir of systemic proteins and immunoglobulins, electrolytes, nucleic acids, microorganisms, toxins, and drugs (3). The collection of neonatal saliva for protein analysis is well documented. Studies examining salivary cortisol levels in the sick and preterm infant are plentiful, as are studies examining testosterone, amylase, and various antibody/antigen responses and their association with systemic disease (4–9). Recent animal data have demonstrated the correlation of serum and salivary CRP measurements in both diseased and healthy animals (10). Additionally, there is emerging literature supporting the use of saliva as a surrogate biofluid for serum CRP monitoring in healthy adults (11, 12). However, the clinical utility of salivary CRP monitoring in the newborn is currently unknown. The objective of this study was to determine if salivary CRP was detectable in neonatal saliva and to examine its diagnostic capabilities and limitations in the clinical setting.
Materials and Methods
Study Population
This was a prospective Tufts Medical Center (TMC) Institutional Review Board (IRB) approved study. Parents of infants hospitalized in the TMC Neonatal Intensive Care Unit (NICU) from August 2011 to October 2012 who required serial CRP levels as part of their routine care were asked to participate. There were no exclusion criteria based on gender, genetic disorder, disease process, or clinical status.
Procedures
Neonatal salivary samples were collected within 4–12 h of clinically indicated serum CRP levels. For those infants receiving enteral nutrition, every attempt was made to collect saliva 1 h prior to a feed to avoid breast milk or formula contamination. Salivary samples were collected with protocols previously established in our laboratory (13). Samples were obtained over 5–15 s using a 1 mL syringe, wings removed, attached to low-wall suction. The syringe was weighed pre- and post-salivary collection to determine salivary volume. Saliva was then placed in 65 μL of a protease inhibitor (SigmaFAST™, St. Louis, MO, USA) and RNAprotect Saliva (Qiagen™, Venlo, Limburg, Netherlands) in a 1:10 concentration for salivary protein stabilization (13–15). Samples were vortexed, placed on ice, and subsequently stored at −80°C for several weeks up to 8 months before processing.
Total protein concentration in each sample was determined with the NanoDrop™ Spectrophotometer 1000 (Thermo Fisher Scientific, Inc., Waltham, MA, USA). Salivary CRP concentrations were determined with a commercial electrochemiluminescence immunoassay (MesoScale Discovery™, Rockville, MD, USA) per manufacturer’s instructions. All samples were run in triplicate and plotted against a standard curve for CRP quantification. Serum CRP measurements were determined in the TMC hospital laboratory using the UniCel DxC 600i immunoassay analyzer (Beckman Coulter, Inc., Brea, CA, USA).
Statistical Analysis
Statistical analyses used the SAS statistical package, version 9.2 (SAS Institute, Cary, NC, USA) and R (version 2.15.1). Medians and interquartile ranges were used to summarize demographic and clinical characteristics of the patients. Spearman correlation coefficients and their 95% confidence intervals (CI) were used to measure the association between salivary protein and volume, serum CRP and raw salivary CRP, and serum CRP and salivary CRP normalized with either total protein concentration or volume. All associations fit a robust linear regression model. We minimized the minimum absolute deviations of the residuals (MAD) using the method of iterative least squares (16). This was calculated using the “lm” function in the R Project for Statistical Computing (17).
The discrimination of the salivary CRP levels for predicting abnormal serum CRP levels were calculated and compared using the area under the ROC curve (AUC) and corresponding CI using the method of Delong et al. (18). To examine the practical application of the salivary CRP levels, the sensitivity and specificity, and corresponding 95% CI, using 2000 bootstrap replications, were calculated for cut-offs based on the upper limit of each range. The sensitivities, specificities, and corresponding receiver–operator characteristic (ROC) curves were created using the “pROC” package in R. Optimal salivary CRP cutpoints were determined using Youden’s J-statistic (19). To address the fact that multiple samples were collected from 22 out of 35 of the patients in the study population, an additional sensitivity analysis was conducted on the dataset by randomly selecting one paired measurement from these patients.
Results
There were 40 infants initially enrolled in this study. As designated by the study design, five patients were excluded from the analysis because their salivary samples were obtained >12 h from the associated serum CRP level. Aside from this, no other patients or samples were excluded for any reason. From the remaining 35 patients, 89 salivary samples were ultimately included in the final analysis. Subjects’ gestational ages and birth weights ranged from 23 to 42 weeks and 490 to 3950 g, respectively. The majority of serum CRP levels were obtained for post-operative monitoring (44/89 salivary samples), followed by necrotizing enterocolitis (NEC) or spontaneous intestinal perforation (SIP) (33/89 salivary samples), and infectious disease (12/89 salivary samples) (Table 1).
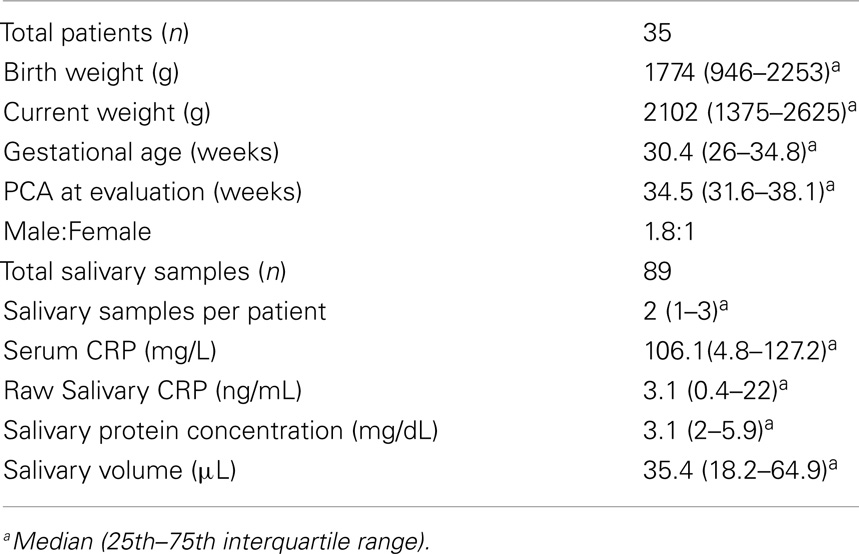
Table 1. Demographic characteristics of study population.
Salivary CRP was detected in 97% of the samples analyzed (86/89) with a median sample volume of 35.4 μL (IQ range = 18.2–64.9 μL). In contrast, the minimal volume needed for the measurement of serum CRP was 200 μL. The median salivary CRP concentration was 3.1 ng/mL (IQ range = 0.4–22 ng/mL); the median serum CRP concentration was 106.1 mg/L (IQ range = 4.8–127.2 mg/L). The lower limit of detection (LLOD) for salivary CRP was 4.5 pg/mL. Intra-assay coefficients of variation (CVs) at low (10 pg/mL) and high (394 474 pg/mL) concentrations were 56 and 9%, respectively. Inter-assay CVs at low (9 pg/mL) and high (752 124 pg/mL) concentrations were both 10%. The CV of all triplicate samples was dependent upon CRP concentration. Samples with CRP concentrations at the lower limit of our assay detection had much higher CVs than samples within range (CVs ranged from 1.9 to 86.7%; Figure 1).
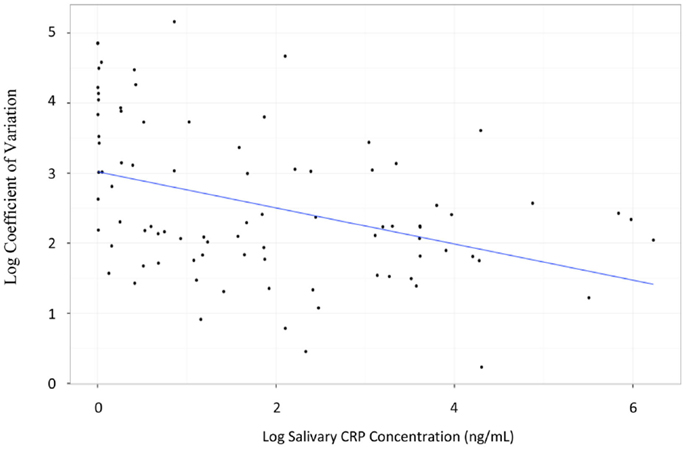
Figure 1. Graph illustrating the logarithmic relationship between coefficient of variation and salivary CRP concentration. The transformation used was log(x) − 1.
There was a statistically significant correlation between serum and raw salivary CRP concentrations [r = 0.62, p < 0.001 (95% CI: 0.47–0.73); Figure 2]. However, given varying volumes of saliva obtained with each sample, we normalized the data. Historically, salivary volume has been used to normalize analyte concentration across samples (20–25). However, in our study, salivary protein concentration was weakly associated with sample volume [r = 0.35, p = 0.01 (95% CI: 0.11–0.55)]. Thus, we examined the relationship of raw salivary CRP levels to protein concentration and volume separately. Raw salivary CRP concentrations were more strongly associated with protein concentration as compared to volume [r = 0.62, p < 0.001 (95% CI: 0.48–0.74) and r = 0.52, p < 0.001 (95% CI: 0.33–0.69)]. Based on these data, we normalized salivary samples using total protein concentration. A statistically significant association was also observed between serum CRP and the protein-adjusted salivary CRP [r = 0.57, p < 0.001 (95% CI: 0.40–0.69)]. Similar associations were seen between serum CRP and raw and protein-adjusted salivary CRP in a sensitivity analysis limited to one randomly selected sample per patient [r = 0.68, p < 0.001 (95% CI: 0.44–0.82) and r = 0.60, p < 0.001 (95% CI: 0.33–0.78), respectively].
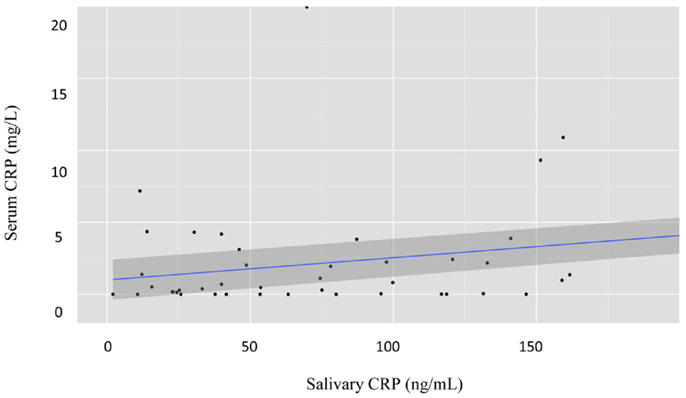
Figure 2. Graph illustrating the estimated parameters from a regression of salivary CRP levels on serum CRP levels. Both salivary CRP and serum CRP were power transformed; salivary CRP was transformed by taking the natural log of salivary CRP (ng/mL) + 1. Serum CRP was transformed using a Box–Cox transformation with a lambda of 0.12; n = 89 salivary samples.
Next, we examined the ability of salivary CRP to predict serum CRP thresholds of ≥5 and 10 mg/L (Figures 3 and 4). Raw salivary CRP demonstrated good diagnostic accuracy at predicting a serum CRP of ≥10 mg/L (AUC = 0.81, 95% CI: 0.72–0.90) and demonstrated fair diagnostic accuracy at predicting a serum CRP of ≥5 mg/L (AUC = 0.76, 95% CI: 0.66–0.87). Protein-adjusted salivary CRP demonstrated fair diagnostic accuracy at predicting a serum CRP of ≥10 and ≥5 mg/L [AUC = 0.78 (95% CI: 0.68–0.87) and 0.75 (95% CI: 0.65–0.86)], respectively. Again, similar AUC results for raw and protein-adjusted salivary CRP were seen in a sensitivity analysis limited to one randomly selected sample per patient. Raw salivary CRP demonstrated good and fair diagnostic accuracy at predicting a serum CRP of ≥10 and 5 mg/L [AUC = 0.86 (95% CI: 0.74–0.99) and 0.78 (95% CI: 0.63–0.93)]. Protein-adjusted salivary CRP demonstrated good and fair diagnostic accuracy at predicting a serum CRP of ≥10 and ≥5 mg/L [AUC = 0.82 (95% CI: 0.67–0.98) and 0.77 (95% CI: 0.61–0.92)].
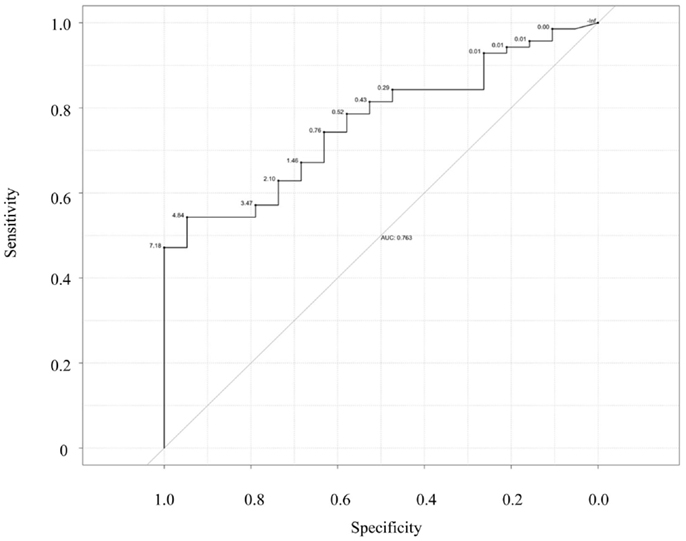
Figure 3. Receiver–operator characteristic (ROC) curve of raw salivary CRP for predicting serum CRP ≥5 mg/L. Sensitivity is plotted against specificity for salivary CRP thresholds between 0 and 7.18 ng/mL; AUC = 0.76.
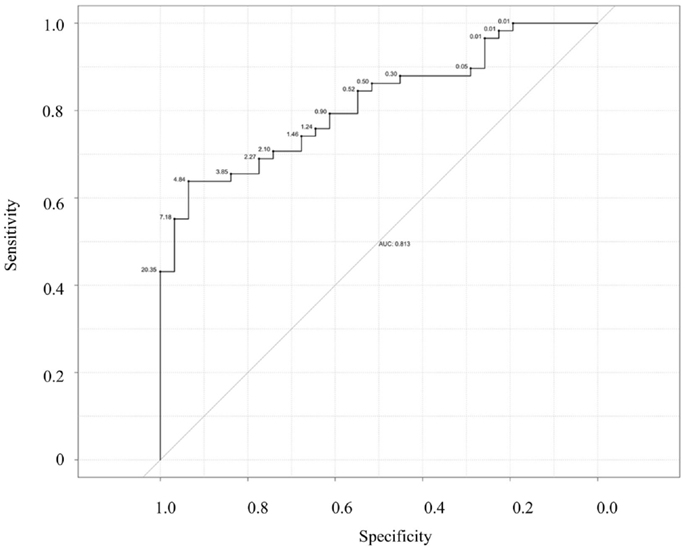
Figure 4. Receiver–operator characteristic (ROC) curve of raw salivary CRP for predicting serum CRP ≥10 mg/L. Sensitivity is plotted against specificity for salivary CRP thresholds between 0.01 and 20.35 ng/mL; AUC = 0.81.
Finally, statistically determined salivary cut-offs were generated optimizing sensitivity and specificity for raw and protein-adjusted salivary CRP. A raw salivary CRP concentration of 4.84 ng/L had a corresponding sensitivity and specificity of 0.64 and 0.94 in accurately predicting a serum CRP level of ≥5 mg/L and a corresponding sensitivity and specificity of 0.54 and 0.95 in accurately predicting a serum CRP of ≥10 mg/L (Table 2). A protein-adjusted salivary CRP concentration of 133.38 ng/mL had a corresponding sensitivity of 0.61 and specificity of 0.84 in accurately predicting a salivary CRP of ≥5 mg/L. A protein-adjusted salivary CRP cut-off of 166.11 ng/mL had a similar sensitivity and specificity (0.67 and 0.84, respectively) in predicting a salivary CRP of ≥10 mg/L.
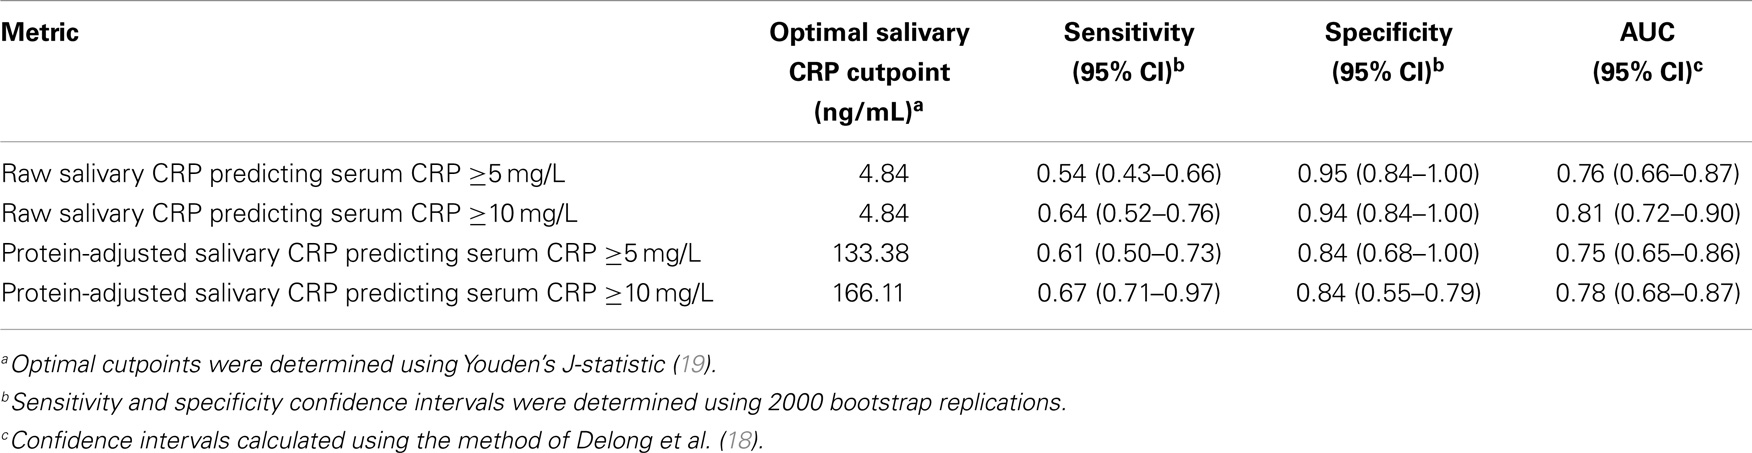
Table 2. Optimal salivary CRP cutpoints associated with maximal sensitivity and specificity in predicting abnormal serum CRP levels.
Discussion
To our knowledge, this is the first study to detect, quantify, and demonstrate that salivary CRP is a good measure of discrimination for clinically relevant serum CRP thresholds. Additionally, we observed the modest yet statistically significant association between CRP measured in neonatal saliva and serum, which has been supported in previously published research in healthy adults and animals (10–12). These data together illustrate the potential of salivary CRP as a routine screening assay for the at-risk newborn.
There is a strong need for better surveillance and monitoring for infants at risk of infection and post-surgical complications. Neonatal sepsis is estimated to occur in 1–21 newborns per 1,000 live births, resulting in significant morbidity and mortality. The risk of periventricular leukomalacia (PVL), a form of white matter brain injury associated with poor neurological and developmental outcomes, increases twofold for every case of neonatal bacterial sepsis (26, 27). Furthermore, estimated sepsis-associated mortality rates are as high as 69% in the premature neonatal population (26). CRP has been previously validated as a non-specific, but nevertheless, informative biomarker for the identification of newborns at risk for these sequelae. Current neonatal care guidelines for sepsis monitoring include frequent invasive surveillance methods and the use of prophylactic antibiotics. Non-invasive salivary diagnostics using a dichotomous variable salivary CRP screening test, could markedly improve our ability to care for these infants by alerting the care-giver to abnormal serum levels without the need for repeated phlebotomy.
Historically, the majority of published salivary reports have used volume and flow rate to normalize salivary analytes across samples (21–23). However, hydration status directly impacts salivary flow, and the use of volume for normalization may not be ideal, particularly in the neonatal population where collection of a standardized volume of saliva may not always be possible (24, 25). We addressed this issue by examining the relationship between salivary CRP levels with total protein concentration and found that raw salivary CRP levels showed the strongest predictive value of an abnormal serum CRP level. While there are obvious advantages to using the raw salivary CRP levels, including a more rapid interpretation of salivary CRP levels, future studies will need to be performed to assess the most accurate and clinically informative normalization method in the newborn.
Our feasibility study provides initial support for the quantification of salivary CRP in neonates using broadly available laboratory-based technology. A limitation of this pilot study is the range of inter- and intra-patient variation. We believe that these findings represent the technical limitations of the assay, specifically at the level of threshold detection. Variation between replicates sharply decreased at higher salivary CRP concentrations compared to samples with lower levels of the biomarker. In developing this non-invasive assay for infants with weights as low 490 g from as little as 2 μL of saliva, it is not unexpected that some of our samples had suboptimal performance. Furthermore, some variability can be attributed to the possible circadian variation observed between serum and salivary CRP, micro-injury to the tissue, localized inflammation of the mucosa, gestational age of the patient, mode of delivery, and salivary gland maturation (12, 27–30). However, emerging analytic devices, such as microfluidic immunosensor chips and lab-on-a-chip devices, have five times the sensitivity of traditional enzyme-linked immunosorbent assays (ELISAs) used in this study, and may be used in multiplex formats to detect dozens of biomarkers simultaneously from a single sample source (31–34). As these technologies continue to evolve, they have the potential to become incorporated into the NICU for rapid non-invasive assessment of the newborn. We believe that the variation seen between sample replicates at the level of detection in our study will be minimized with such platforms and that this current limitation will ultimately not pose as a barrier to integration into clinical care.
In conclusion, we have shown that salivary CRP is readily detectable in the neonate and demonstrates good accuracy at discriminating between clinically relevant serum CRP thresholds. Serial salivary CRP screening of the at-risk patient may represent a feasible and safe alternative to frequent serum sampling by alerting the care-giver to a potential infection, inflammatory process, and/or surgical complication in the neonatal population. Future studies establishing normative values across gestational age and weight, as well as incorporating related protein markers of sepsis and inflammation, may provide even more specific assessment of the at-risk newborn. Ultimately, integrating salivary biomarkers into neonatal care could provide the most effective and minimally invasive approach to accurate sepsis and inflammation screening in this vulnerable population.
Conflict of Interest Statement
The authors have no financial disclosures. This study was supported only by Tufts Medical Center institutional funding. No honorariums were given.
Abbreviations
AUC, area under the curve; CI, confidence intervals; CRP, C-reactive protein; CV, coefficient of variation; ELISA, enzyme-linked immunosorbent assay; IRB, Institutional Review Board; LLOD, lower limit of detection; NEC, necrotizing enterocolitis; NICU, Neonatal Intensive Care Unit; PVL, periventricular leukomalacia; ROC, receiver–operator characteristic; SIP, spontaneous intestinal perforation; TMC, Tufts Medical Center.
References
1. Cetinkaya M, Ozkan H, Koksal N, Celebi S, Hacimustafoglu M. Comparison of serum amyloid A concentrations with those of c-reactive protein and procalcitonin in diagnosis and follow-up of neonatal sepsis in premature infants. J Perinatol (2009) 29:225–31. doi: 10.1038/jp.2008.207
Pubmed Abstract | Pubmed Full Text | CrossRef Full Text | Google Scholar
2. Benitz WE, Han MY, Madan A, Ramachandra P. Serial serum C-reactive protein levels in the diagnosis of neonatal infection. Pediatrics (1998) 102:e41. doi:10.1542/peds.102.4.e41
Pubmed Abstract | Pubmed Full Text | CrossRef Full Text | Google Scholar
3. Li Y, Zhou X, St. John MAR, Wong DT. RNA profiling of cell-free saliva using microarray technology. J Dent Res (2004) 83:199–203. doi:10.1177/154405910408300303
Pubmed Abstract | Pubmed Full Text | CrossRef Full Text | Google Scholar
4. Neu M, Goldstein M, Dexiang G, Laudenslager ML. Salivary cortisol in preterm infants: validation of a simple method for collecting saliva for cortisol determination. Early Hum Dev (2007) 83:47–54. doi:10.1016/j.earlhumdev.2006.04.003
Pubmed Abstract | Pubmed Full Text | CrossRef Full Text | Google Scholar
5. White-Traut RC, Schwertz D, McFarlin B, Kogan J. Salivary cortisol and behavioral state responses of healthy newborn infants to tactile-only and multisensory interventions. J Obstet Gynecol Neonatal Nurs (2009) 38:22–34. doi:10.1111/j.1552-6909.2008.00307.x
Pubmed Abstract | Pubmed Full Text | CrossRef Full Text | Google Scholar
6. Yamamoto AY, Mussi-Pinhata MM, Marin LF, Brito RM, Oliveira PF, Coelho TB. Is saliva as reliable as urine for detection of cytomegalovirus DNA for neonatal screening of congenital CMV infection? J Clin Virol (2006) 36:228–30. doi:10.1016/j.jcv.2006.03.011
Pubmed Abstract | Pubmed Full Text | CrossRef Full Text | Google Scholar
7. Harrison LM, Morris JA, Bishop LA, Lauder RM, Taylor CAM, Telford DR. Detection of specific antibodies in cord blood, infant and maternal saliva and breast milk to staphylococcal toxins implicated in sudden infant death syndrome (SIDS). FEMS Immunol Med Microbiol (2004) 42:94–104. doi:10.1016/j.femsim.2004.06.010
Pubmed Abstract | Pubmed Full Text | CrossRef Full Text | Google Scholar
8. Cho JI, Carlo WA, Su X, McCormick KL. Associations between salivary testosterone and cortisol levels and neonatal health and growth outcomes. Early Hum Dev (2012) 88:789–95. doi:10.1016/j.earlhumdev.2012.05.002
Pubmed Abstract | Pubmed Full Text | CrossRef Full Text | Google Scholar
9. Nogueira RD, Sesso ML, Borges MC, Mattos-Graner RO, Smith DJ, Ferriani VP. Salivary IgA antibody responses to Streptococcus mitis and Streptococcus mutans in preterm and fullterm newborn children. Arch Oral Biol (2012) 57:647–53. doi:10.1016/j.archoralbio.2011.11.011
Pubmed Abstract | Pubmed Full Text | CrossRef Full Text | Google Scholar
10. Gutierrez AM, Martinez-Subiela S, Eckersall PD, Ceron JJ. C-reactive protein quantification in porcine saliva: a minimally invasive test for pig health monitoring. Vet J (2009) 181:261–5. doi:10.1016/j.tvjl.2008.03.021
Pubmed Abstract | Pubmed Full Text | CrossRef Full Text | Google Scholar
11. Dillon MC, Opris DC, Kopanczyk R, Lickliter J, Cornwell HN, Bridges EG, et al. Detection of homocysteine and c-reactive protein in the saliva of healthy adults: comparison with blood levels. Biomark Insights (2010) 5:57–61.
12. Ouellet-Morin I, Danese A, Williams B, Arsenault L. Validation of a high-sensitivity assay for c-reactive protein in human saliva. Brain Behav Immun (2011) 25:640–6. doi:10.1016/j.bbi.2010.12.020
Pubmed Abstract | Pubmed Full Text | CrossRef Full Text | Google Scholar
13. Dietz JA, Johnson KL, Wick HC, Bianchi DW, Maron JL. Optimal techniques for mRNA extraction from neonatal salivary supernatant. Neonatology (2012) 101:55–60. doi:10.1159/000328026
Pubmed Abstract | Pubmed Full Text | CrossRef Full Text | Google Scholar
14. Park NJ, Yu T, Nabili V, Brinkman BM, Henry S, Wang J, et al. RNAprotect saliva: an optimal room-temperature stabilization reagent for the salivary transcriptome. Clin Chem (2006) 52:2303–4. doi:10.1373/clinchem.2006.075598
15. Maron JL, Johnson KJL, Rocke DM, Cohen MG, Liley AJ, Bianchi DW. Neonatal salivary analysis reveals global developmental gene expression changes in the premature infant. Clin Chem (2010) 56:46–9. doi:10.1373/clinchem.2009.136234
Pubmed Abstract | Pubmed Full Text | CrossRef Full Text | Google Scholar
16. Venables WN, Ripley BD. Modern Applied Statistics with S. 4th ed. New York, NY: Springer (2002).
17. R Development Core Team. R: A Language and Environment for Statistical Computing. R Foundation for Statistical Computing (2013). Available from: http://www.R-project.org/
18. DeLong ER, DeLong DM, Clarke-Pearson DL. Comparing the areas under two or more correlated receiver operating characteristic curves: a nonparametric approach. Biometrics (1988) 44:837–45.
19. Youden WJ. Index for rating diagnostic tests. Cancer (1950) 3:32–5. doi:10.1002/1097-0142(1950)3:1<32::AID-CNCR2820030106>3.0.CO;2-3
20. Price DA, Close GC, Fielding BA. Age of appearance of circadian rhythm in salivary cortisol values in infancy. Arch Dis Child (1983) 58:454–6. doi:10.1136/adc.58.6.454
Pubmed Abstract | Pubmed Full Text | CrossRef Full Text | Google Scholar
21. Nelson N, Arbring K, Theodorsson E. Neonatal salivary cortisol in response to heelstick: method modifications enable analysis of low concentrations and small sample volumes. Scand J Clin Lab Invest (2001) 61:287–92. doi:10.1080/00365510152379012
Pubmed Abstract | Pubmed Full Text | CrossRef Full Text | Google Scholar
22. Morelius E, Nelson N, Theodorsson E. Salivary cortisol and administration of concentrated oral glucose in newborn infants: improved detection limit and smaller sample volumes without glucose interference. Scand J Clin Lab Invest (2004) 64:113–8. doi:10.1080/00365510410004452
Pubmed Abstract | Pubmed Full Text | CrossRef Full Text | Google Scholar
23. Donzella B, Talge NM, Smith TL, Gunnar MR. To spear or not to spear: comparison of saliva collection methods. Dev Psychobiol (2008) 50:714–7. doi:10.1002/dev.20340
Pubmed Abstract | Pubmed Full Text | CrossRef Full Text | Google Scholar
24. Walsh NP, Montague JC, Callow N, Rowlands AV. Saliva flow rate, total protein concentration and osmolality as potential markers of whole body hydration status during progressive acute dehydration in humans. Arch Oral Biol (2004) 49:149–54. doi:10.1016/j.archoralbio.2003.08.001
Pubmed Abstract | Pubmed Full Text | CrossRef Full Text | Google Scholar
25. Walsh NP, Laing SJ, Oliver JS, Montague JC, Walters R, Bilzon J. Saliva parameters as potential indices of hydration status during acute dehydration. Med Sci Sports Exerc (2004) 36:1535–42. doi:10.1249/01.MSS.0000139797.26760.06
Pubmed Abstract | Pubmed Full Text | CrossRef Full Text | Google Scholar
26. Stoll BJ, Hansen NI, Adams-Chapman I, Fanaroff AA, Hintz SR, Vohr B, et al. Neurodevelopmental and growth impairment among extremely low-birth weight infants with neonatal infection. JAMA (2004) 292:2357–65. doi:10.1001/jama.292.19.2357
Pubmed Abstract | Pubmed Full Text | CrossRef Full Text | Google Scholar
27. Out D, Hall RJ, Granger DA, Page GG, Woods SJ. Assessing salivary c-reactive protein: longitudinal associations with systemic inflammation and cardiovascular disease risk in women exposed to intimate partner violence. Brain Behav Immun (2012) 26:543–51. doi:10.1016/j.bbi.2012.01.019
Pubmed Abstract | Pubmed Full Text | CrossRef Full Text | Google Scholar
28. Kaapa P, Koistenen E. Maternal and neonatal C-reactive protein after interventions during delivery. Acta Obstet Gynecol Scand (1993) 72:543–6. doi:10.3109/00016349309058160
Pubmed Abstract | Pubmed Full Text | CrossRef Full Text | Google Scholar
29. Turner MA, Power S, Emmerson AJ. Gestational age and the C reactive protein response. Arch Dis Child Fetal Neonatal Ed (2004) 89:F272–3. doi:10.1136/adc.2002.011288
Pubmed Abstract | Pubmed Full Text | CrossRef Full Text | Google Scholar
30. Tucker AS. Salivary gland development. Semin Cell Dev Biol (2007) 18:237–44. doi:10.1016/j.semcdb.2007.01.006
31. Stoll BJ, Hansen N, Fanaroff AA, Wright LL, Carlo WA, Ehrenkranz RA, et al. Late-onset sepsis in very low birth weight neonates: the experience of the NICHD Neonatal Research Network. Pediatrics (2002) 110:285–91. doi:10.1542/peds.110.2.285
Pubmed Abstract | Pubmed Full Text | CrossRef Full Text | Google Scholar
32. Henares TG, Mizutani F, Hisamoto H. Current development in microfluidic immunosensing chip. Anal Chim Acta (2008) 611:17–30. doi:10.1016/j.aca.2008.01.064
33. Christodoulides N, Floriano PN, Miller CS, Ebersole JL, Mohanty S, Dharshan P, et al. Application of microchip assay system for the measurement of C-reactive protein in human saliva. Lab Chip (2005) 5:261–9. doi:10.1039/b414194f
Pubmed Abstract | Pubmed Full Text | CrossRef Full Text | Google Scholar
34. Christodoulides N, Floriano PN, Miller CS, Ebersole JL, Mohanty S, Dharshan P, et al. Lab-on-a-chip methods for point-of-care measurements of salivary biomarkers of periodontitis. Ann N Y Acad Sci (2008) 1098:411–28. doi:10.1196/annals.1384.035
Pubmed Abstract | Pubmed Full Text | CrossRef Full Text | Google Scholar
Keywords: biomarker, C-reactive protein, inflammation, neonates, saliva
Citation: Iyengar A, Paulus JK, Gerlanc DJ and Maron JL (2014) Detection and potential utility of C-reactive protein in saliva of neonates. Front. Pediatr. 2:131. doi: 10.3389/fped.2014.00131
Received: 02 September 2014; Accepted: 06 November 2014;
Published online: 21 November 2014.
Edited by:
Juan Sanchez-Esteban, Alpert Medical School of Brown University, USAReviewed by:
Joseph M. Bliss, Women & Infants Hospital of Rhode Island, USASurendra Sharma, Women and Infants Hospital, USA
Copyright: © 2014 Iyengar, Paulus, Gerlanc and Maron. This is an open-access article distributed under the terms of the Creative Commons Attribution License (CC BY). The use, distribution or reproduction in other forums is permitted, provided the original author(s) or licensor are credited and that the original publication in this journal is cited, in accordance with accepted academic practice. No use, distribution or reproduction is permitted which does not comply with these terms.
*Correspondence: Anjali Iyengar, Division of Newborn Medicine, Floating Hospital for Children at Tufts Medical Center, 800 Washington Street, Boston, MA 02111, USA e-mail: aiyengar@tuftsmedicalcenter.org