
- 1 Dr. Margarete Fischer-Bosch Institute of Clinical Pharmacology, University of Tuebingen, Stuttgart, Germany
- 2 Department of Clinical Pharmacology, Institute of Experimental and Clinical Pharmacology and Toxicology, University Hospital Tuebingen, Tuebingen, Germany
Atorvastatin δ-lactone, a major, pharmacologically inactive metabolite, has been associated with toxicity. In a previous study we showed that polymorphisms of UGT1A3 influence atorvastatin δ-lactone formation. Here we investigated the reverse reaction, atorvastatin δ-lactone hydrolysis, in a human liver bank. Screening of microarray data revealed paraoxonases PON1 and PON3 among 17 candidate esterases. Microsomal δ-lactone hydrolysis was significantly correlated to PON1 and PON3 protein (rs = 0.60; rs = 0.62, respectively; P < 0.0001). PON1 and PON3 were strongly correlated to each other (rs = 0.60) but PON1 was shown to be more extensively glycosylated than PON3. In addition a novel splice-variant of PON3 was identified. Genotyping of 40 polymorphisms within the PON-locus identified PON1 promoter polymorphisms (−108T > C, −832G > A, −1741G > A) and a tightly linked group of PON3 polymorphisms (−4984A > G, −4105G > A, −1091A > G, −746C > T, and F21F) to be associated with changes in atorvastatin δ-lactone hydrolysis and expression of PON1 but not PON3. However, carriers of the common PON1 polymorphisms L55M or Q192R showed no difference in δ-lactone hydrolysis or PON expression. Haplotype analysis revealed decreased δ-lactone hydrolysis in carriers of the most common haplotype *1 compared to carriers of haplotypes *2, *3, *4, and *7. Analysis of non-genetic factors showed association of hepatocellular and cholangiocellular carcinoma with decreased PON1 and PON3 expression, respectively. Increased C-reactive protein and γ-glutamyl transferase levels were associated with decreased protein expression of both enzymes, and increased bilirubin levels, cholestasis, and presurgical exposure to omeprazole or pantoprazole were related to decreased PON3 protein. In conclusion, PON-locus polymorphisms affect PON1 expression whereas non-genetic factors have an effect on PON1 and PON3 expression. This may influence response to therapy or adverse events in statin treatment.
Introduction
Statins are generally well tolerated drugs. Severe adverse events are rare, but hepatotoxicity, myopathy, and rhabdomyolysis are well known. One to 5% of patients develop muscle pain symptoms often leading to discontinuation of treatment (Thompson et al., 2003). A comprehensive explanation for the development of the described adverse events has not yet been found. One plausible mechanism proposes inhibition of an early step of the cholesterol biosynthesis, reducing not only cholesterol as intended, but also production of mevalonate pathway products like ubiquinone (Coenzyme Q10) or isoprenoids/terpenoids (Baer and Wortmann, 2007; Marcoff and Thompson, 2007). On the other hand it was shown that highly metabolized statins like atorvastatin were associated with the highest risk for adverse events (Law and Rudnicka, 2006; Silva et al., 2006). This is further emphasized by reports of increased numbers of adverse events when statins are co-administered with known inhibitors of statin metabolizing enzymes. A striking example is the fibrate gemfibrozil where combinations with cerivastatin have greatly increased the rate of rhabdomyolysis (Neuvonen et al., 2006) due to the inhibitory effect of gemfibrozil and its glucuronide metabolite on CYP2C8 and OATP1B1 dependent metabolism and transport, respectively (Shitara and Sugiyama, 2006). After the death of several people caused by this co-medication, it was decided to withdraw cerivastatin from the market.
Recent observations highlight the role of certain metabolites for adverse events or response to atorvastatin. Hermann et al. (2006) compared the pharmacokinetics of atorvastatin and its metabolites in healthy controls and myopathy patients. Interestingly, myopathy patients had 2.4- and 3.1-fold increased AUC values for atorvastatin-lactone and para-hydroxy-atorvastatin, respectively. Moreover, by assessing the myotoxic potency of atorvastatin and metabolites in primary skeletal muscle cells, it was found that atorvastatin-lactone had a 14-fold higher potency to induce cell-death compared to atorvastatin-acid (Skottheim et al., 2008). These facts point to an involvement of certain metabolites in the development of statin-associated adverse events. Furthermore, atorvastatin is administered as active acid form but like other statins it is also found with nearly equal AUC in its inactive lactone form (Kantola et al., 1998). Both, the acid and the lactone form are substrates of CYP3A4 and CYP3A5, which convert them to the respective para- (pOH) and ortho- (oOH) hydroxy-metabolites. However, due to their higher lipophilicity the lactones are much better substrates with identical (oOH) or even six-fold higher (pOH) Vmax and about 20-fold lower Km, due to better access to the hydrophobic substrate channel of the CYP enzyme near the membrane surface (Jacobsen et al., 2000). It has therefore been suggested that elimination of atorvastatin may proceed primarily via hydroxylation of atorvastatin-lactone and not via hydroxylation of the parent compound (Jacobsen et al., 2000).
We therefore hypothesized that enzymatic conversion between atorvastatin-acid and atorvastatin-lactone and vice versa may constitute an additional level of variation that could in principle be affected by both genetic and non-genetic factors. Conversion of atorvastatin to the lactone has been reported to occur spontaneously at low intestinal pH (Kearney et al., 1993) but proceeds predominantly enzymatically at physiological pH (Goosen et al., 2007). Enzymatic formation was shown to occur via acyl-glucuronidation followed by spontaneous conversion to the lactone (Prueksaritanont et al., 2002). Recently we could show that UDP-glucuronosyltransferase UGT1A3 is the main enzyme responsible for the lactonization of atorvastatin. As a result, UGT1A-polymorphisms affecting UGT1A3 expression were found to significantly increase atorvastatin-lactone formation (Riedmaier et al., 2010).
The reverse reaction, hydrolysis of the lactone to the open acid conformation may happen chemically or enzymatically via esterases or paraoxonases (Testa and Mayer, 2003). Such a conversion by paraoxonase 1 (PON1) has been shown for simvastatin and lovastatin (Billecke et al., 2000) and by paraoxonase 3 (PON3) for lovastatin (Draganov et al., 2005). Hydrolysis of atorvastatin-lactone by these enzymes has not been examined before to the best of our knowledge. The three members of the paraoxonase family, PON1, PON2, and PON3, are primarily lactone hydrolyzing enzymes and share an amino acid identity of ∼65%. The PON1 structure consists of a six-bladed beta-propeller containing two Ca2+ ions necessary for enzyme stability and activity (Draganov, 2010). The activity of PON3 was also found to be Ca2+ dependent (Lu et al., 2006). Polymorphisms of PON1 have been studied extensively in the context of its antioxidative potential in coronary artery disease and stroke (Ranade et al., 2005; Banerjee, 2010; Dahabreh et al., 2010) and most recently an involvement in the generation of the active metabolite of clopidogrel has been proposed (Bouman et al., 2011). Several of the studied polymorphisms indeed affect PON1 expression or activity. A functional promoter polymorphism (−108T > C; rs705379) with variant allele frequency (VAF) of 38.9% in Caucasians was reported to disrupt the binding site for transcription factor Sp1 (Deakin et al., 2003) or AhR (Gouédard et al., 2004). Two coding polymorphisms (Q192R; rs662; VAF = 35.8% in Caucasians; L55M; rs854560; VAF = 39.7% in Caucasians) were shown to change the catalytic activity for several substrates (Costa and Furlong, 2002). Much less is known about the variability of PON3 and potential polymorphic markers for expression and function. Although several promoter polymorphisms were studied in relation to PON1 substrates their functional relevance remained unclear (Marsillach et al., 2009).
In this study, we hypothesized that paraoxonases may play an active role in the hydrolysis of atorvastatin-lactone, and that inter-patient variation in the expression and activity of these enzymes could be a determinant of atorvastatin response and/or toxicity. We investigated this hypothesis in vitro in a large human liver bank. By determining the population variability and using correlation analysis we provide evidence that both PON1 and PON3 contribute to atorvastatin-lactone hydrolysis. Further, we investigated the influence of 40 genetic polymorphisms at the PON-locus as well as of several non-genetic factors on expression and function of these genes. We identified several polymorphisms and haplotypes that are associated with changes in atorvastatin δ-lactone hydrolysis and PON expression. Hence, this comprehensive analysis renders the PON-locus a promising candidate that could influence patients’ response to atorvastatin treatment.
Results
General Role of Enzymatic Lactone Hydrolysis
First experiments based on published results for lovastatin hydrolysis indicated that in human liver microsomes both spontaneous and enzymatic conversion of lovastatin-lactone and atorvastatin-lactone to the acid forms occurs. Enzymatic compared to spontaneous hydrolysis, the latter of which was assessed by identical incubation with heat-inactivated protein fractions, was found to be 1.3-fold higher for lovastatin-lactone and 3.8-fold higher for atorvastatin-lactone in a pooled microsomal fraction (data not shown). In all subsequent analyses with atorvastatin-lactone, control incubations with heat-inactivated protein (95°C, 5 min) were included and the respective background was subtracted.
Variability of Microsomal Atorvastatin-Lactone Hydrolysis
Next we determined enzymatic atorvastatin-lactone hydrolysis in a large number of microsome samples (N = 142). Establishing the atorvastatin-lactone hydrolysis assay, we could show that the activity was increased by approximately 20% by adding 1 mM CaCl2, although these reactions are not depending on co-substrates. Figure 1 shows the variability of atorvastatin-lactone hydrolysis in our cohort of human liver samples. The fraction of enzymatic lactone hydrolysis ranged from 0 to 42% of total atorvastatin-acid formation indicating a large interindividual variability of the enzymatic fraction of the reaction. Comparison of the coefficients of variation revealed similar variability for UGT1A3-dependant lactone formation (Riedmaier et al., 2010) and enzymatic lactone hydrolysis (62 and 54%, respectively). Of note, UGT enzymes are only active in the presence of UDP-glucuronic acid. This cofactor was not included in the atorvastatin-lactone hydrolyzing assay.
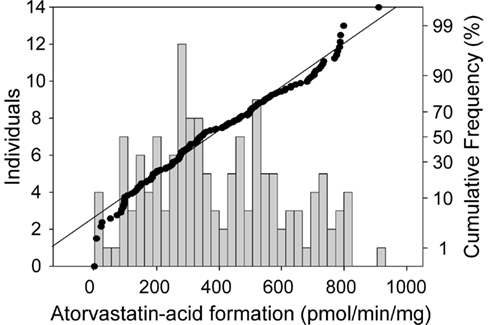
Figure 1. Frequency histogram (left axis) and cumulative frequency (right axis) showing population distribution of the hydrolysis of atorvastatin-lactone (10 μM) to atorvastatin-acid in human liver microsomes (N = 142). Incubations (5 μg of microsomal protein) were performed in the presence of 1 mM CaCl at 37°C for 30 min. Atorvastatin-acid was quantitated by LC–MS/MS analysis.
Candidate Esterase Screening
Our next aim was to identify the enzyme(s) responsible for this conversion. Since several enzymes known to possess esterase activity were possibly involved (Testa and Mayer, 2003), we used mRNA profiling data previously obtained by microarray analysis of the liver samples (Schröder et al., manuscript submitted). Table 1 shows the results of a correlation analysis between mRNA expression data of a selection of candidate esterases and enzymatic atorvastatin-lactone hydrolysis activity in the human livers. The analysis included acetylcholinesterase (ACHE), acyl-CoA thioesterase 1 (ACOT1), albumin (ALB), butyrylcholinesterase (BCHE), carboxyl ester lipase (CEL), carboxylesterase (CES1, 2, 3, 4, 7), paraoxonases (PON1, 2, 3), lysosomal acid, cholesterol esterase (LIPA), and sialic acid acetylesterase (SIAE). Interestingly, this analysis identified PON1 and PON3, already known to be involved in the hydrolysis of simvastatin and lovastatin (Draganov et al., 2005; Suchocka et al., 2006) as the two top candidates. Significant correlations (Holm-adjusted P < 0.05) were also observed for BCHE, CES3 (positive) and PON2, LIPA (negative).
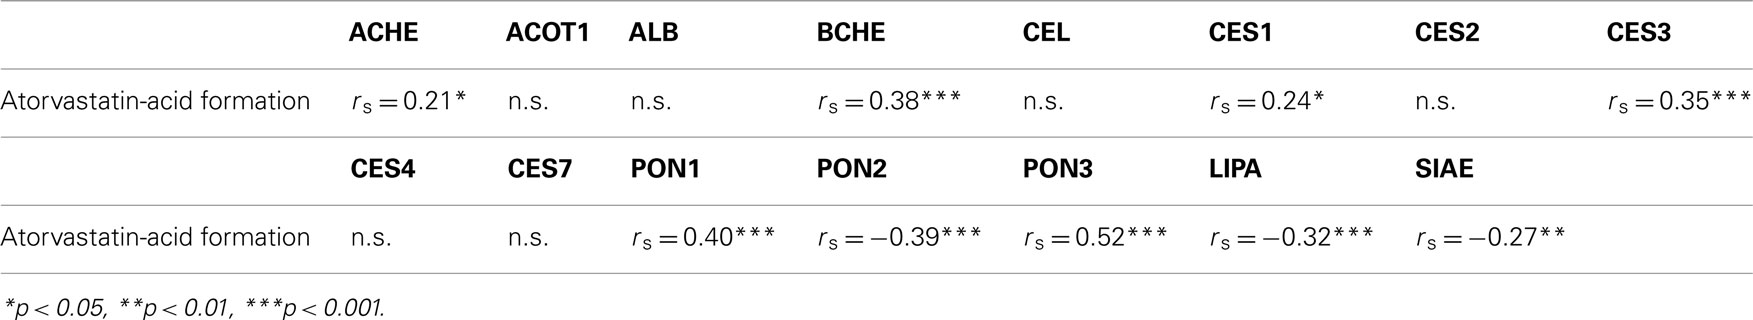
Table 1. Correlation analysis of candidate gene expression and atorvastatin-lactone hydrolysis.
Population Variability of Microsomal PON1 and PON3 Expression
In further experiments we concentrated on PON1 and PON3, because their expression showed the strongest correlation to atorvastatin-lactone hydrolysis. To quantitate mRNA transcripts by real-time PCR, we first carried out RT-PCR experiments to quantitate distinct transcripts described for PON1 (four splice-variants; Ensembl: ENSG00000105852) and PON3 (nine splice-variants; Ensembl: ENSG00000005421). We identified the predicted PON1 and PON3 wild type transcripts and a novel variant PON3 mRNA species, which was shown by sequence analysis to contain an additional exon of 144 bp (corresponding to 48 amino acids) between exons 3 and 4. No other PON3 variants were detected using primers for full-length mRNA amplification in a subset of 20 samples. On average, this splice-variant was 3.1-fold less expressed compared to wild type. When comparing the coefficients of variation, mRNA levels of PON3 wild type and variant were similarly variable (40 and 43%, respectively). Quantification of mRNA expression of PON1 and PON3 by self-designed specific TaqMan assays revealed that PON3 wild type mRNA was on average 5.1-fold higher expressed than PON1 mRNA (for correlations see below). PON1 mRNA had a high coefficient of variation (150%).
Protein expression of PON1 and PON3 was quantified by Western blot analysis using monoclonal primary antibodies. PON1 was identified as a triple band in a range of approximately 35–40 kDa, in agreement with earlier data on purified human serum paraoxonase (Furlong et al., 1991; Gan et al., 1991; Figure 2A). These bands occurred only in human liver microsomes but not in cytosol. PON3, on the other hand, was found as a single band at 38 kDa in human liver microsomes. In cytosolic samples of the same livers as well as in a sample prepared from primary human hepatocytes, two bands at 21 and 35 kDa were identified, whereas the 38-kDa band was absent (Figure 2B). The PON3 variant was not detected. Endoglycosidase treatment was performed to test whether glycosylation was responsible for the various immunoreactive proteins. Treatment of human liver microsomes lead to a shift of the detected bands toward a single 35 kDa band with both antibodies (Figure 2C). This finding suggested that PON1 and PON3 are highly glycosylated proteins in microsomes. Remarkably, the 35 kDa band, presumably representing the unglycosylated PON1 and PON3 forms corresponded to one of the two PON3 bands detected in human liver cytosol and in hepatocytes. The observed microsomal pattern of three bands for PON1 and one band for PON3 corresponded to three reported glycosylation sites (amino acids N226, N252, and N323) on PON1 and one site (N323) on PON3 (Liu et al., 2005). For quantification, the liver samples were analyzed in their glycosylated state and the relevant signals were combined.
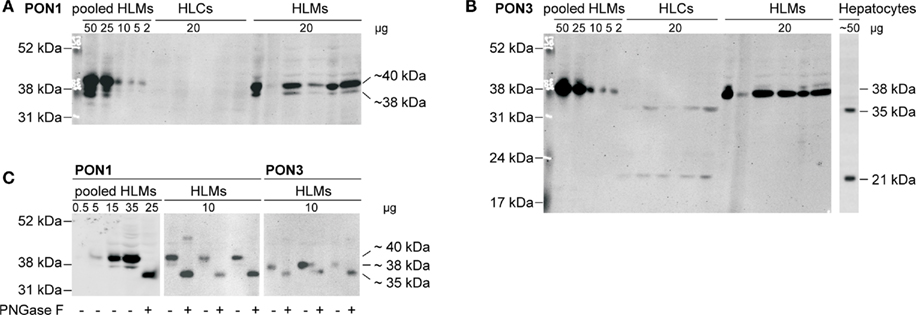
Figure 2. Immunoblots of human liver cytosol (HLCs) and microsomes (HLMs) of livers 1–5 stained with specific antibodies against (A) PON1 and (B) PON3 (performed on identical blot after stripping). Analysis was performed on cytosolic and microsomal fractions of livers 1–5, on a human liver microsome pool (lane 11) and on lysate of primary human hepatocytes. (C) Deglycosylation was performed by analysis with (+) or without (−) pretreatment by endoglycosidase PNGase F.
Taken together, these analyses revealed that both PON1 and PON3 varied considerably with regard to the analyzed phenotypes of expression and atorvastatin-lactone hydrolysis. Table 2 presents an overview of the PON population variability parameters at mRNA and protein/function levels. All measured phenotypes were not normally distributed in our Caucasian liver donor cohort. The coefficient of variation was lowest for PON3 mRNA and activity, higher for PON1 and PON3 protein expression and highest for PON1 mRNA expression.
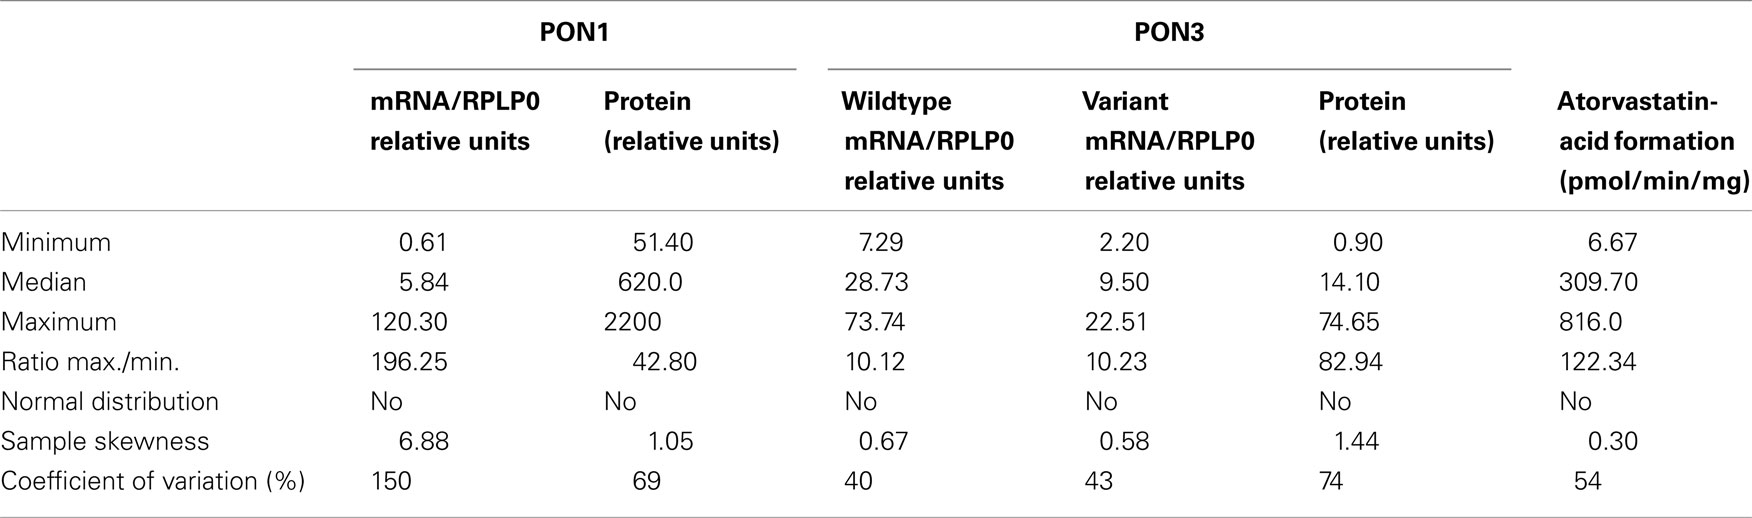
Table 2. Population variability of hepatic PON1 and PON3 expression phenotypes.
Identification of Responsible Hydrolyzing Enzymes by Correlation Analysis
To further substantiate the involvement of PON1 and PON3 in atorvastatin-lactone hydrolysis, correlation analysis was performed. As shown in Table 3, rather strong associations above  ; highlighted cells) were obtained for three parameter-pairs. Most notably, atorvastatin-lactone hydrolysis was correlated with similarly high Spearman coefficients to both, PON1 and PON3 protein expression, indicating that both enzymes contribute approximately equally to the microsomal enzymatic reaction. Furthermore the mRNAs of PON1 and PON3 (wildtype and splice-variant) were also significantly correlated to activity, although with lower Spearman coefficients. Moreover, correlations were also observed between transcripts, as well as between PON1 and PON3 protein indicating co-regulation of these two paraoxonases.
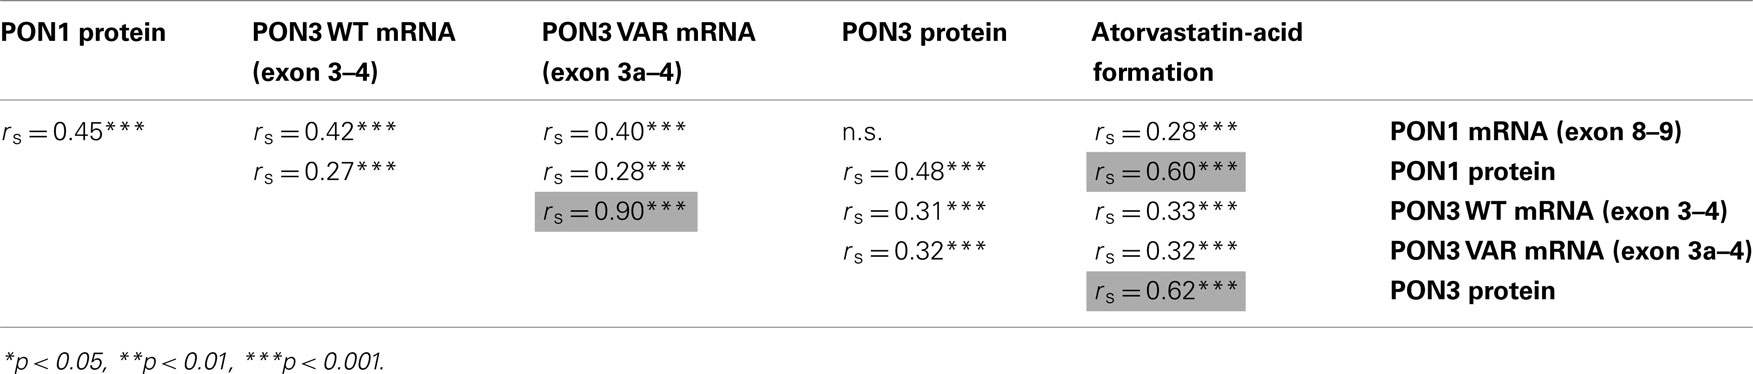
Table 3. Correlation analyses of PON1 and PON3 expression and microsomal atorvastatin-lactone hydrolysis.
Genetic Variability at the PON-Locus
We analyzed the genetic variability at the PON-locus to select known functional SNPs that cover the coding and regulatory regions of the two candidate genes PON1 and PON3. In addition, we included tagging SNPs selected for the less well characterized PON3 gene. In total we genotyped 7 promoter SNPs, 11 coding SNPs, 14 intronic SNPs, and 1 3′UTR polymorphism of PON3 including the selected tagging SNPs. Furthermore three promoter SNPs, two amino acid changing polymorphisms of PON1, and two intergenic polymorphisms located between the two genes were included. A summary of the selected polymorphisms including a comparison of the measured VAF with published data is shown in Table A1 in Appendix. Major frequency deviations were observed for some polymorphisms derived from the Seattle SNP database, probably because only 23 subjects had been included in their analyses. For SNP 19, only data from a Chinese cohort was available and this polymorphism was much more common in our Caucasian population.
Calculation of pairwise LD values at the PON-locus revealed a block of tightly linked polymorphisms comprising the PON3 promoter region, several intronic polymorphisms and the synonymous polymorphisms F21F (rs13226149), and A99A (rs1053275; D′ = 0.88–1.0; r2 = 0.04–1.0; Figure 3). Of note, this block is also linked to the −1741G > A PON1 promoter polymorphism (D′ = 0.49–1.0; r2 = 0.09–0.43). Linkage was also detected between PON1 promoter polymorphisms and L55M (D′ = 0.59–0.87; r2 = 0.14–0.19). PON1 Q192R on the other hand was only linked to L55M (D′ = 0.95; r2 = 0.23), but neither to PON1 promoter polymorphisms nor to polymorphisms of the PON3 linkage block. Linkage was additionally detected between the rare polymorphisms PON3–794C > T, 3′UTR rs17885558 and the intergenic polymorphism rs7778771 (VAF = 1.3%; D′ = 1; r2 = 1).
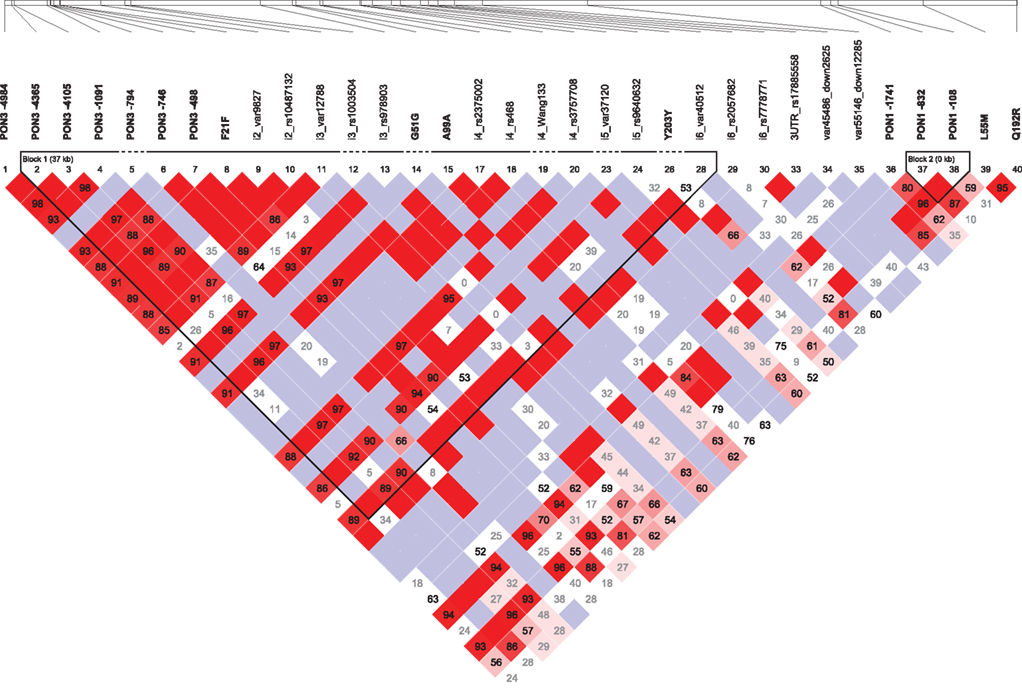
Figure 3. Pairwise linkage disequilibrium is shown for the 40 polymorphisms genotyped in this study. The map was generated using Haploview 4.2. Numbers represent D′ values. D′ = 1: bright red (LOD > 2) or blue (LOD < 2); D′ < 1: shades of pink (LOD > 2) or white (LOD < 2).
Association of PON polymorphisms with PON-related phenotypes
Univariate analysis was carried out for association between single SNP genotypes and the PON phenotypes, atorvastatin-lactone hydrolysis, PON1 and PON3 protein expression (Figures 4–6).
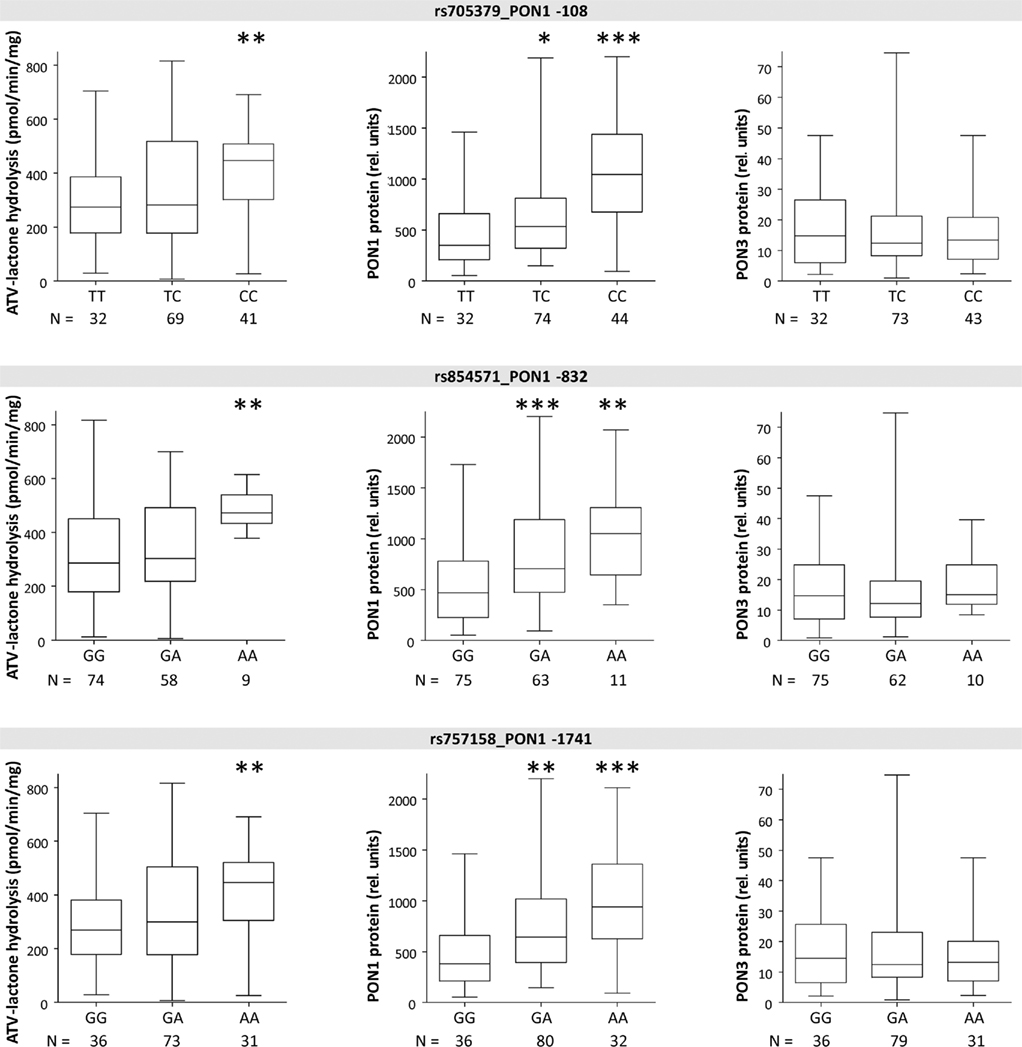
Figure 4. Boxplots of PON1 and PON3 protein expression and microsomal atorvastatin-lactone hydrolysis in liver microsomes for indicated polymorphisms. Heterozygotes and homozygotes of variant allele are compared with homozygotes of reference allele by Wilcoxon–Mann– Whitney-tests significance levels are indicated for P < 0.05 (*), P < 0.01 (**), and P < 0.001 (***).
The three linked PON1 promoter polymorphisms −108T > C, −832G > A, and −1741G > A were associated with significantly increased atorvastatin-lactone hydrolysis (up to 1.1-fold increased median values in heterozygous or 1.6- to 1.7-fold in homozygous carriers, respectively). These changes corresponded to increased PON1 protein (1.5- to 1.7-fold higher in heterozygous and 2.3- to 3.0-fold in homozygous samples, respectively; tested by Wilcoxon–Mann–Whitney, not adjusted for multiple testing) whereas PON3 protein was unchanged in these variants. Similar changes were seen for the corresponding mRNA transcripts (data not shown). Two amino acid changes in PON1, L55M, and Q192R, previously described to affect the kinetics of various substrates (Costa and Furlong, 2002) were not consistently associated with changes in either atorvastatin-lactone hydrolysis or PON1/PON3 protein expression, although there was a trend for decreased PON1 expression in relation to L55M and a trend for increased PON1 expression in relation to Q192R (Figure 5).
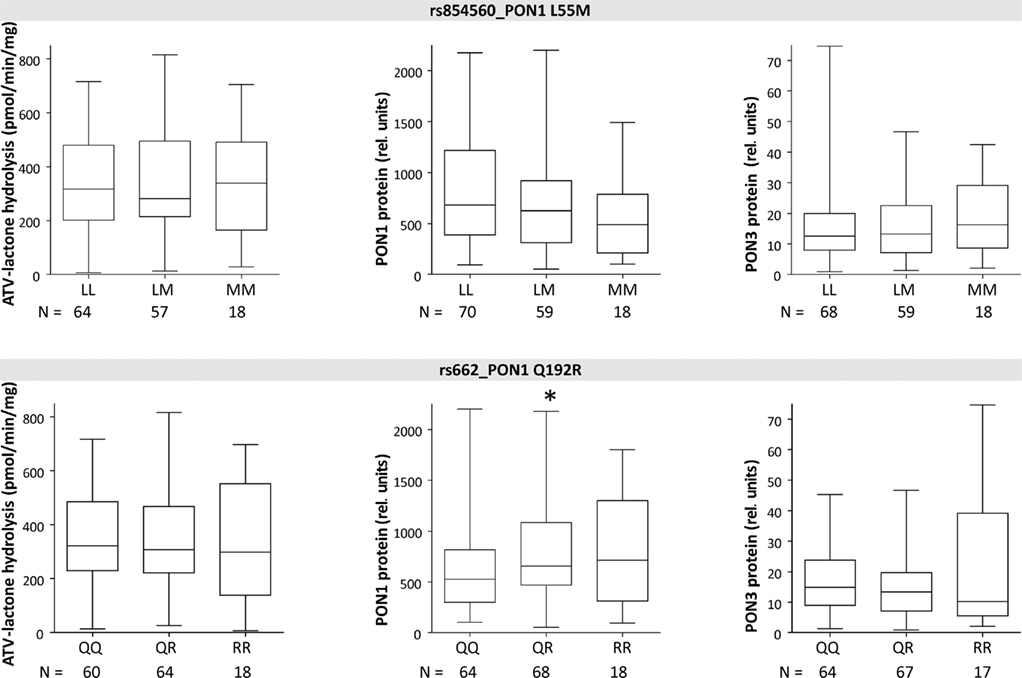
Figure 5. Boxplots of PON1 and PON3 protein expression and microsomal atorvastatin-lactone hydrolysis in liver microsomes for indicated polymorphisms. Heterozygotes and homozygotes of variant allele are compared with homozygotes of reference allele by Wilcoxon–Mann– Whitney-tests significance levels are indicated for P < 0.05 (*), P < 0.01 (**), and P < 0.001 (***).
Linkage analysis of PON3 SNPs revealed F21F (rs13226149) as a suitable marker SNP for a haplotype block comprising several PON3 promoter polymorphisms, A99A (rs1053275), and several intronic variations (Figure 3). F21F was associated with increased atorvastatin-lactone hydrolysis and with increased PON1 protein expression, but not with PON3 expression (Figure 6).
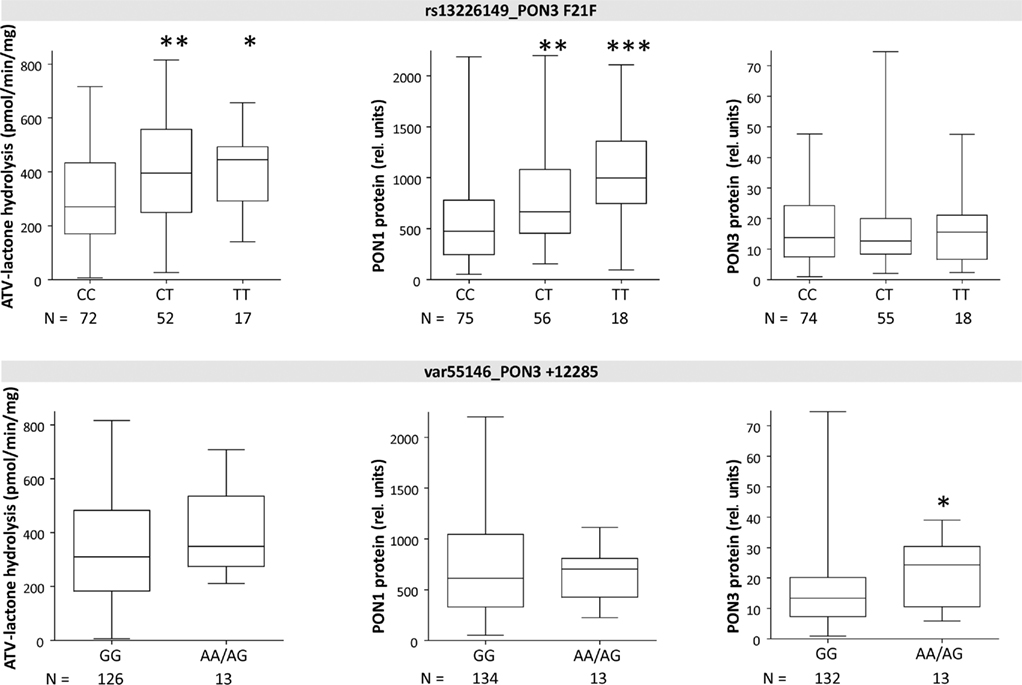
Figure 6. Boxplots of PON1 and PON3 protein expression and microsomal atorvastatin-lactone hydrolysis in liver microsomes for indicated polymorphisms. Heterozygotes and homozygotes of variant allele are compared with homozygotes of reference allele by Wilcoxon–Mann– Whitney-tests significance levels are indicated for P < 0.05 (*), P < 0.01 (**), and P < 0.001 (***).
In contrast to the SNPs above, which were only associated with PON1 expression, the intergenic variation at +12285 (var55146), was associated with 1.8-fold increased PON3 protein but only minimally changed activity or PON1 protein. Because only one homozygote was found for this variant, homozygous and heterozygous carriers were analyzed together (Figure 6).
Analysis of PON-haplotypes and their association with PON-related phenotypes
Based on the SNP genotyping data haplotypes for the PON-locus were deduced. To limit the number of generated haplotypes we only included SNPs with VAF < 2% (see Materials and Methods). Furthermore, because the above analysis revealed that PON3 polymorphisms are associated with changes in PON1 phenotype we defined the haplotypes such that they included both genes and the intergenic region. This lead to the definition of 13 haplotypes with predicted frequencies between 0.022 and 0.206 (Table 4). In order to classify functionally relevant haplotypes, we included the results from the univariate analyses to derive seven major haplotypes. Thus, haplotypes *3 to *7 comprised the PON3 linkage block including F21F and/or PON1 promoter SNPs (Figure 3). Haplotype *2 was defined by the intergenic variant +12285, and *1 comprised all haplotypes lacking these variants. Of note, definition of these haplotypes did not consider the amino acid variants L55M and Q192R, which had no functional influence in this study.
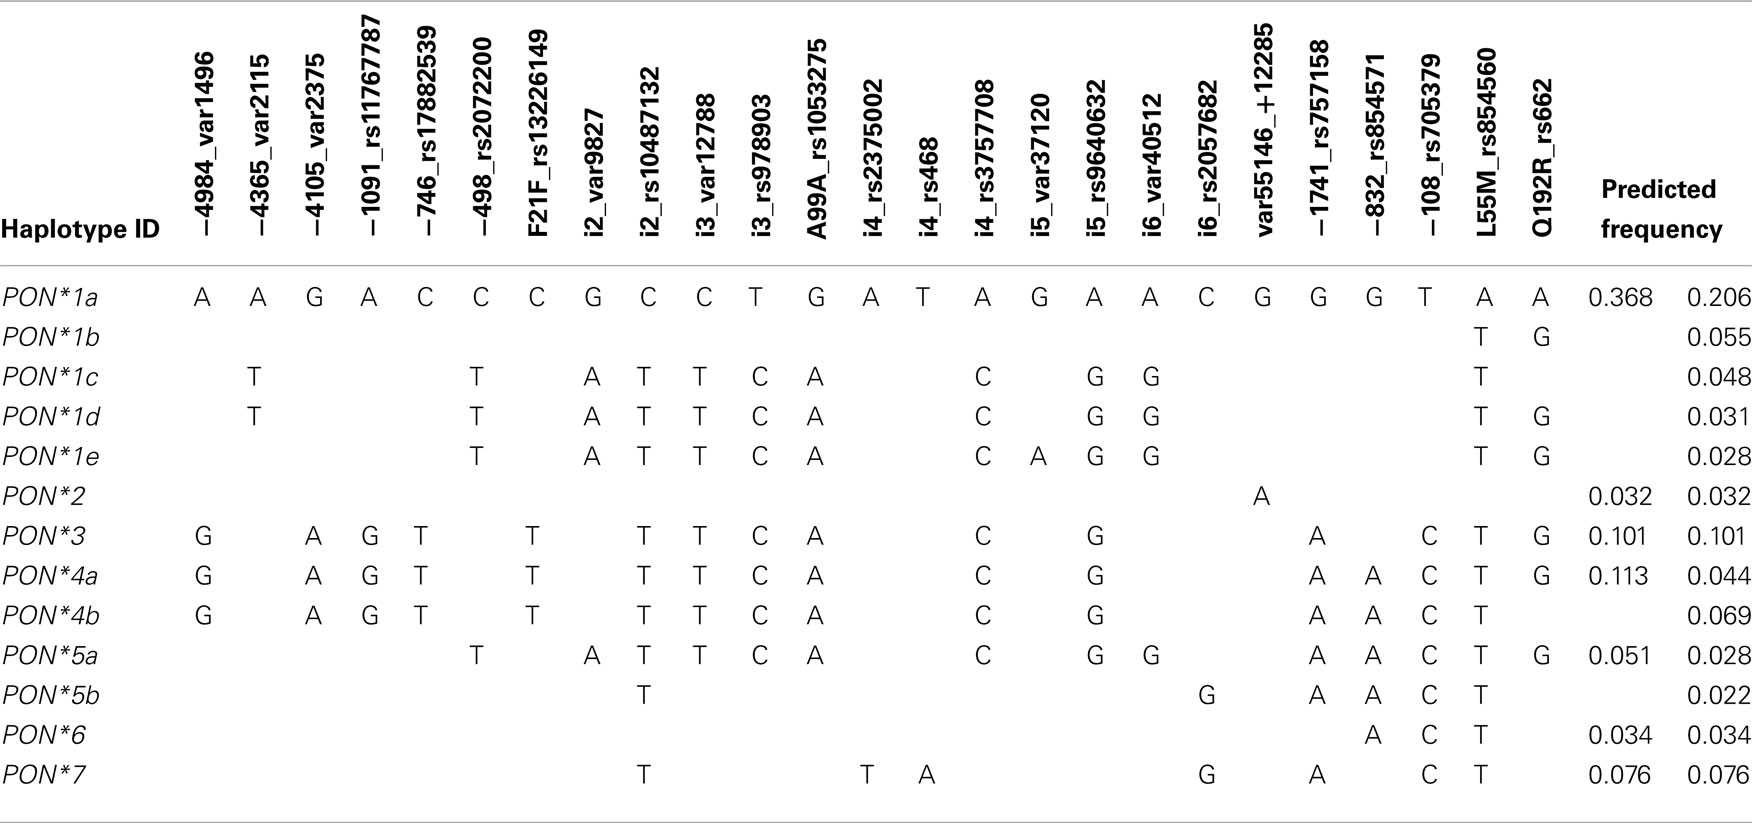
Table 4. Structure of deduced PON-haplotypes.
Association of these seven haplotypes revealed that atorvastatin-lactone hydrolysis was markedly increased in carriers of haplotypes *2 (1.7-fold) and *6 (1.6-fold) as compared to homozygotes of haplotype *1 (Figure 7). Less pronounced but still significant changes were also found between carriers of haplotypes *2, *3, *4, and *6 as compared to heterozygous carriers of *1. PON1 mRNA expression was increased approximately two-fold in *3, *4, *5, *7 and 2.7-fold in the *6 haplotype carriers but only marginally in the *2 haplotype. PON1 protein expression resembled the mRNA pattern with ∼2.1- and 1.6-fold increased expression in *2 and *7, respectively, ∼2-fold increase in *3, *4,*5, and 3.3-fold increase in *6. For PON3 no significant associations were found with respect to these haplotypes, although we noted increased expression of PON3 protein in most carriers of the *2 haplotype, which includes the above mentioned var55146.
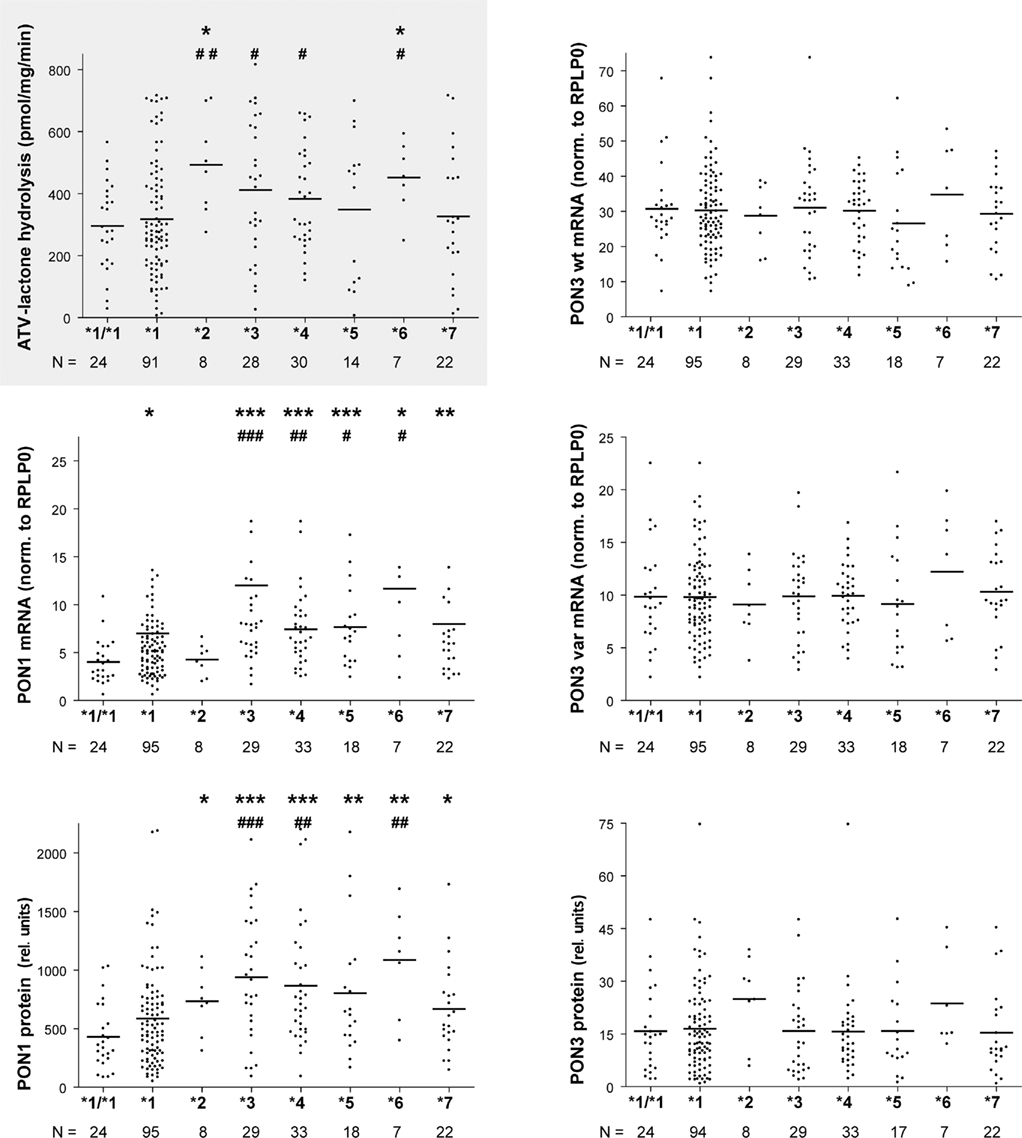
Figure 7. PON-locus haplotype–phenotype relationships in human liver. Atorvastatin-lactone hydrolysis, PON1 and PON3 mRNA and microsomal protein are displayed for the indicated haplotypes. Horizontal lines indicate the median. Wilcoxon–Mann–Whitney-tests were applied to compare *2 to *7 carriers with *1/*1 (marked by *) or *1 carriers (marked by #). Significance levels not adjusted for multiple testing are indicated for P < 0.05 (* or #), P < 0.01 (** or ##), and P < 0.001 (*** or ###). After adjusting for multiple testing *3, *4,*5,*7 against *1/*1 or *3 and*4 against *1 were significantly different on PON1 mRNA level and *2 to *7 against *1/*1 or *3, *4, and *6 against *1 were significantly different on PON1 protein level.
Influence of Non-Genetic Factors and Multivariate Analysis
Univariate analysis revealed that in patients with hepatocellular carcinoma (HCC) compared to patients with metastases PON1 protein expression was decreased 1.3-fold (P < 0.05), whereas in patients with cholangiocellular carcinoma (CCC) compared to patients with metastases, PON3 expression was 1.7-fold decreased (P < 0.05). Interestingly, clinically elevated C-reactive protein (CRP) levels (> 8.2 mg/l) were associated with 2.3-fold lower PON1 (P < 0.01), 2.6-fold lower PON3 (P < 0.01), and 1.7-fold lower atorvastatin-lactone hydrolysis (P < 0.05). Similarly, elevated levels of γ-glutamyl transferase (GGT; >64 in men/>36 in women) were associated with 1.4-fold decreased PON1 and PON3 expression as well as atorvastatin-lactone hydrolysis (P < 0.01). Bilirubin levels higher than 1.2 mg/dl were associated with 1.8-fold decreased PON3 expression (P < 0.01) and 1.3-fold decreased atorvastatin-lactone hydrolysis (P < 0.05). Significant differences between non-cholestasic and cholestatic patients (Nies et al., 2009) were identified for PON3 expression (decreased 1.6-fold, P < 0.01) and atorvastatin-lactone hydrolysis (decreased 1.4-fold, P < 0.05). Presurgical drug exposure to omeprazole or pantoprazole was associated with a significant decrease of PON3 mRNA (1.3-fold, P < 0.05), protein (1.6-fold, P < 0.01), and activity (1.7-fold, P < 0.01) compared to patients receiving no drugs.
Multivariate linear models and step-wise model selection were applied to determine the contribution of polymorphisms and non-genetic factors to atorvastatin-lactone hydrolysis and PON1 and PON3 expression variability. Figure 8 shows the fraction of observed population variability explained by polymorphisms, non-genetic factors, or both. Of the atorvastatin-lactone hydrolysis variability, 15.0% were explained by F21F (rs13226149), PON3-1091A > G promoter polymorphism and the non-genetic factors sex, CRP, γ-glutamyl transferase, and cancer classification. PON1 −108T > C promoter polymorphism together with non-genetic factors (noted in brackets) determined 13.1% of PON1 mRNA (smoking status, cholestasis) and 35.3% of protein expression (sex, smoking status, CRP, γ-glutamyl transferase). PON3 expression appeared to be affected mainly by non-genetic factors, which explained about 20% of protein variance when smoking status, cancer classification, CRP, bilirubin level, γ-glutamyl transferase were considered, whereas mRNA variation could not be explained reasonably.
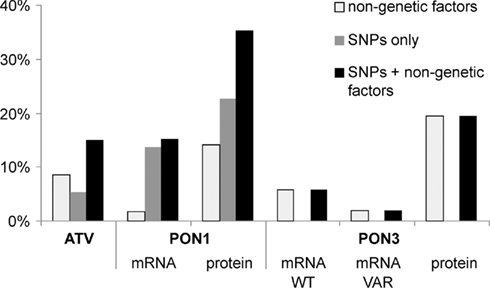
Figure 8. Percentage of total atorvastatin-lactone hydrolysis, PON1, and PON3 expression variation explained by multivariate linear models containing only non-genetic factors (white), only genetic factors (gray), or both (black). The bars indicate the coefficient of determination adjusted for the number of factors in the different models. Linear models were derived by step-wise model selection procedure using Akaike’s information criterion.
Discussion
In this study we aimed to identify the primary enzyme(s) responsible for atorvastatin-lactone hydrolysis in human liver microsomes and to characterize genetic and non-genetic factors of influence. Our results strongly suggest that both PON1 and PON3 contribute to this reaction and to its interindividual variability, which is an important pathway for atorvastatin biotransformation (Figure 9). This conclusion is based on atorvastatin-lactone hydrolysis measurements and population-genetics investigations in a large human liver bank.
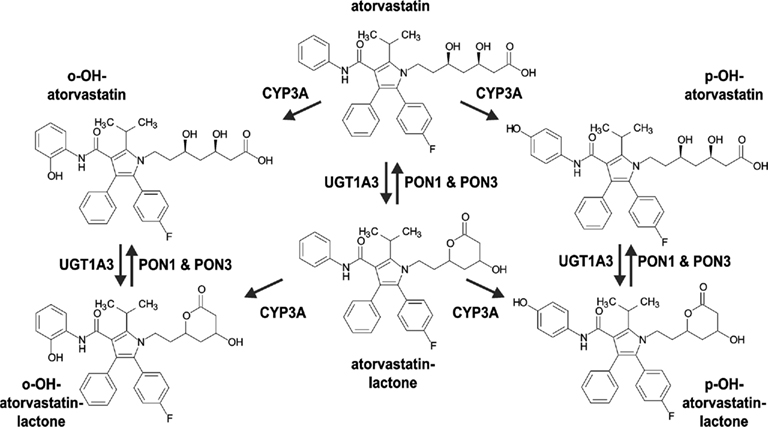
Figure 9. Proposed pathway for the metabolism of atorvastatin in human liver including Hydroxylation by CYP3A enzymes, Lactonization by UGT1A3, and Hydrolysis of Lactones by PON1 and PON3.
Identification and Characterization of PON1 and PON3 in Human Liver
We first screened expression profiles of 17 candidate esterase genes for correlation with atorvastatin-lactone hydrolysis activity, revealing several positively and negatively correlated genes. While PON1 and PON3 showed the strongest correlations, butyrylcholinesterase (BCHE) and carboxylesterase 3 (CES3) were less strong but also positively correlated. Although no information on relative expression of these enzymes in liver exists, BCHE is found in plasma (3 mg/l) in an amount comparable to PON3 (1.8 mg/l) and ∼30-fold lower than PON1 (96 mg/l; Nicolet et al., 2003; Aragones et al., 2011), whereas nothing is known about substrate specificity toward statin-lactones. The negative correlation of PON2 with atorvastatin-lactone hydrolysis seems to point to some degree of co-regulation of the three paraoxonases, as it also correlated negatively with PON1 and PON3 expression data. Although we did not follow up on these other correlated candidate esterase genes, it may be assumed that they contribute to minor extent to the overall hydrolysis reaction in liver.
For PON1 and PON3 we validated these initial correlation results by real-time PCR mRNA quantification based on detailed transcript analyses. These lead to some additional observations on the mRNA level. In contrast to database information, which suggested the existence of up to four and nine transcript variants for PON1 and PON3, respectively, we identified by RT-PCR only a single, so far unknown splice-variant of PON3 with an open reading frame corresponding to 48 additional amino acids. This variant was estimated to be about three-fold less expressed. As it was not detected on western blots, it is most probably either not translated or post-translationally degraded.
At the protein level our work extends previous studies showing PON1 expression in liver (Gonzalvo et al., 1998), by the observation of predominantly microsomal localization of human PON3.The similar correlation of PON1 and PON3 (rs = 0.60 and 0.62, respectively) to atorvastatin lactonase activity was in agreement with Western blots showing comparable signal intensities for PON1 and PON3 in pooled liver microsomes, although absolute quantification could not be performed due to the lack of standards. The combined protein levels of both paraoxonases accounted for ∼46% of the ∼122-fold variability of atorvastatin-lactone hydrolysis in the liver samples.
Furthermore, by absolute quantification of transcript levels we found PON3 normal transcript to be 4.9-fold higher expressed compared to PON1. This finding contrasts to opposite proportions reported for circulating, HDL-bound PON1 and PON3 in the bloodstream of 96 and 1.8 mg/l, respectively (Aragones et al., 2011). A plausible explanation might be strongly favored secretion of PON1 due to its more pronounced glycosylation. This is supported by the fact that N-glycans constitute sorting signals for proteins (André et al., 2009).
PON Genetics and Polymorphisms
Although several SNPs at the PON-locus on chromosome 7 have been previously studied (Wang et al., 2003; Carlson et al., 2006) this is the first study to look at PON1 and PON3 together, which included a thorough genotyping of PON3 through analysis of 35 SNPs covering the whole gene. Evaluation of the linkage patterns of these SNPs enabled us to define 13 PON1–PON3 haplotypes, which could be grouped into seven major haplotypes based on functionally relevant SNPs. Interestingly these did not include the two amino acid variants L55M and Q192R. Crystal structure analysis revealed that Q192R affects the active histidine dyad of PON1 (Harel et al., 2004). However the catalytic consequences are not uniform, as the kinetics of some substrates are accelerated (e.g., paraoxon) whereas others are slowed down (e.g., diazoxon) or not affected (e.g., phenylacetate; Costa and Furlong, 2002). According to our studies in liver microsomes, atorvastatin-lactone belongs to the substrates, which are not affected by either of these two variants.
In contrast to the amino acid variants PON1 promoter polymorphisms had a clear effect on expression of PON1 but not PON3. The most influential SNP for atorvastatin-lactone hydrolysis and PON1 expression appeared to be −108T > C, which explained 23% of PON1 protein expression in liver, in very good agreement with a previous estimation that this SNP accounts for ∼22–25% of variation in PON1 serum expression in white adults (Costa and Furlong, 2002). Functional evidence for −108T > C as a causal variant includes approximately two-fold higher activity of the C-allele in a reporter gene assay (Leviev and James, 2000), presumably due to disruption of a binding site for the transcription factor Sp1 in the T-allele (Deakin et al., 2003), or a binding site for the aryl hydrocarbon receptor, AhR (Gouédard et al., 2004).
Furthermore, carriers of the high-expressor C-allele were found to show reduced LDL oxidation following treatment with atorvastatin or simvastatin, presumably due to PON1 induction via promoter binding of SREBP-2 near to the Sp1 site (Deakin et al., 2003; Sardo et al., 2005). Analysis of statin treatment of our liver donors (N = 7, atorvastatin and simvastatin) revealed indeed a trend toward higher PON1 protein levels in treated vs. untreated PON1-108CC carriers (P = 0.051). On the other hand, protein levels of T-allele carriers on statins were similar or lower than untreated patients with the same allele. Taken together, our findings support –108T > C as a causal variant influencing PON1 expression and inducibility, as well as atorvastatin-lactone hydrolysis.
The other two PON1 promoter polymorphisms −832G > A and −1741G > A were also associated with increased PON1 protein and atorvastatin-lactone hydrolysis. These associations may well be explained by the extensive linkage between the three promoter polymorphisms, although one study reported 1.7-fold higher activity of the −832A allele in a reporter gene assay (Leviev and James, 2000).
Although the common variations analyzed in this study did not affect PON3 expression, one variant located about 12 kb downstream of the last PON3 exon and about 23 kb upstream of PON1 (var55146, VAF = 5%) was associated with increased protein expression of only PON3, and with marginally increased atorvastatin-lactone hydrolysis, but not with altered mRNA. Whether this association is based on the high linkage to six intronic SNPs (Figure 3) or (an) unidentified polymorphism(s) or on a downstream enhancer element of PON3 remains to be clarified. Of interest, most of the identified PON3 promoter and intronic polymorphisms, as well as F21F (rs13226149) and A99A (rs1053275), were part of a block of high linkage not affecting PON3 expression, but clearly increasing the expression of PON1.
On the other hand, as shown by multivariate analysis, non-genetic factors clearly influenced PON3 expression more than polymorphisms (Figure 8). Observed associations with CRP, γ-glutamyl transferase, bilirubin, cholestasis or treatment with omeprazole or pantoprazole leading to decreased PON3 expression have not been described before. However, decreased expression of PON1 in patients with elevated CRP and γ-glutamyl transferase and down-regulation of PON1 expression in response to inflammatory cytokines has been described before (Van Lenten et al., 2001; Han et al., 2006; Mackness et al., 2006; Araoud et al., 2010). PON1 activity has therefore been suggested as a marker for liver impairment (Marsillach et al., 2009). The associations with hepatocellular carcinoma (PON1) and cholangiocellular carcinoma (PON3) also seem to be plausible as paraoxonases have a protective effect against oxidative stress, which plays an important role in chronic liver diseases leading to liver cirrhosis and the development of carcinomas (Camps et al., 2009).
Materials and Methods
Chemicals
Atorvastatin calcium salt, atorvastatin-d5 sodium salt, atorvastatin-lactone, atorvastatin-d5 lactone, lovastatin, lovastatin-d3, lovastatin hydroxy acid sodium salt, and lovastatin-d3 hydroxy acid sodium salt were purchased from Toronto Research Chemicals Inc. (North York, Canada). All other chemicals were obtained at highest available grade from Sigma-Aldrich (St. Louis, MO, USA).
Liver Samples
Liver tissue and corresponding blood samples were previously collected from patients undergoing liver surgery at the Campus Virchow, Humboldt University, Berlin, Germany. All tissue samples were examined by a pathologist and only histologically non-tumorous tissue was used. Clinical patient documentation for all samples included age, sex, medical diagnosis, presurgical medication, liver functions tests, alcohol and smoking habits, and cancer classification. Patients with hepatitis, cirrhosis or chronic alcohol use were excluded. Finally 150 liver samples, from which high quality RNA and complete documentation could be obtained, were included. The preparation of human liver microsomes had been described before (Lang et al., 2001).
Quantification of Atorvastatin-Acid and Lactone
Atorvastatin-lactone hydrolysis was determined in human liver microsomes. Incubation time, substrate concentration, and protein content were chosen with care to guarantee measurements within the linear range for each condition. Separate incubation experiments were always carried out together with a denaturated sample of pooled human liver microsomes to guarantee reproducibility and to subtract non-enzymatic conversion. Incubations were performed with 5 μg of protein in 50 mM Tris HCl, pH 7.4 and 1 mM CaCl2 in a total volume of 100 μl. The reaction was started by adding 10 μM atorvastatin-lactone (dissolved in acetonitrile). Reactions were stopped after 30 min by adding 100 μl ice-cold 250 mM formic acid/acetonitrile and immediate cooling on ice. After adding 10 μM deuterated atorvastatin and atorvastatin-lactone, the samples were centrifuged and analyzed by LC–MS–MS. HPLC separation was performed at 30°C on a XBridge Shield RP18 column using (A) 1 mM formic acid and (B) acetonitrile at a flow rate of 0.4 ml/min for 20 min. MS–MS analysis was performed on an Esquire HCT ultra ion trap mass spectrometer (Bruker Daltonics, Bremen, Germany). Lovastatin hydrolysis was determined under similar conditions using 100 μg pooled HLMs and 50 μM lovastatin for the performed preliminary experiment. As internal standard, deuterated lovastatin-acid and lovastatin-lactone were used. Precursor and product ions (m/z) were ATV (559 and 440.2; 466.2), [2H5]ATV (564 and 445.2; 471.2), ATV-L (541.2 and 448.2), [2H5]ATV-L (546.2 and 453.2), LOV-A (422 and 445.1), [2H3]LOV-A (425 and 448.1), LOV-L (404 and 427.1), [2H3]LOV-L (407 and 430.1). Sodium adducts were used in the quantification of lovastatin and its metabolites. Possible quantification ranged from 0.5 to 500 pmol per sample. Gradient program and MS–MS conditions are available on request.
Immunoblotting
Relative protein quantification of microsomal and cytosolic samples was performed by western blot analysis using monoclonal antibodies against PON1 (sc-59646, Santa Cruz; 1:1000) and PON3 (ab71994, Abcam; 1:2000). Electrophoretic separation of samples in Laemmli-buffer was done on a 10% SDS-polyacrylamide gel. Proteins were transferred by semidry-blotting onto a nitrocellulose membrane. Membranes were blocked for 1 h at room temperature. Primary antibodies were diluted in 1% skim milk-TBST and blots were incubated for 1 h at room temperature or over night at 8°C in this solution. Membranes were washed and incubated (under protection from light) for 30 min at room temperature with the corresponding secondary antibody (1:10000). Finally, membranes were washed again and the ODYSSEY infrared imaging system (LI-COR) was used for detection. Relative quantification was performed based on standard curves of pooled human liver microsomes recorded on each blot. Results were expressed in relation to pooled human liver microsomes. For molecular weight estimation, high range rainbow marker (14.3–220 kDa; Amersham Biosciences) was used. Lysate of primary human hepatocytes was analyzed for PON3 expression applying similar conditions. Immunoblotting of lysate was performed using a LI-COR MPX (Multiplex) Blotter.
Deglycosylation of microsomal samples was performed according to the manufacturer’s protocol by incubation with endoglycosidase PNGase F (New England Biolabs, Ipswich, MA, USA) for 1 h at 37°C after denaturation at 100°C for 10 min. For quantification of microsomal expression, the combined intensity of stained bands in untreated (glycosylated) samples was used.
Quantification of mRNA Expression
Total RNA was prepared from liver tissue by Trizol (Invitrogen, Paisley, FL, USA) extraction and using the RNeasy Mini Kit with on-column DNase treatment (Qiagen, Hilden, Germany) as described previously (Gomes et al., 2009). Only high quality RNA preparations according to Agilent Bioanalyzer (Nano-Lab Chip Kit, Agilent Technologies, Waldbronn, Germany) RIN assignment (>7) were used in this study. Two hundred nanograms of total RNA was amplified and labeled using the Illumina TotalPrep RNA Amplification kit (Ambion Applied Biosystems, Darmstadt, Germany). cRNA quality was assessed by capillary electrophoresis on Agilent 2100 Bioanalyzer (Agilent Technologies). Expression levels of mRNA transcripts were assessed by the Human-6 v3 Expression BeadChips (Illumina, Eindhoven, Netherlands). Hybridization was carried out according to the manufacturer’s instructions. Quantil normalized expression data of the 15 candidate esterases was used in the analysis.
For PCR based quantification, synthesis of cDNA was performed with 1 μg RNA using the TaqMan Reverse Transcription Kit (Applied Biosystems, Darmstadt, Germany) according to the supplier’s instructions. Quantification of PON1, PON3 wildtype, and PON3 splice-variant mRNA was performed by specific TaqMan real-time reverse-transcription PCR on a 7900HT Fast Real-Time PCR System (Applied Biosystems, Foster City, CA, USA) using exon–exon boundary spanning primers (Table A2 in Appendix; 400 nM each) and FAM-labeled MGB probes (Table A2 in Appendix; 200 nM). Specificity for PON1 was confirmed using DNA plasmids constructed from PON1 and PON3 wildtype complete cDNA (see Table A3 in Appendix for full-length amplification primers), which were used as a linearized PON1 Taqman standard (10 fg/μl–1 pg/μl) and PON3 wildtype negative control (1–100 pg/μl). Position of primers and probes were shown according to cDNA NM_000446.5 (PON1) and NM_000940.2 (PON3). Specificity for PON3 wildtype and splice-variant were confirmed using DNA plasmids constructed from PON3 wildtype and splice-variant complete cDNA, which were used as linearized Taqman standard (10 fg/μl–1 pg/μl) and as negative control vice versa (1–100 pg/μl). PCR was performed using 2× universal PCR Master Mix (Applied Biosystems) in a final volume of 12.5 μl and the following cycling conditions: 50°C for 2 min; 95°C for 10 min followed by 40 cycles of 95°C for 15 s and 60°C for 1 min. Results were normalized to RPLP0 (60S large ribosomal protein P0) and expressed in relation to the lowest value, which was set at 1.0. Four extreme values of PON1 mRNA (between rel. units 26 and 120) were excluded from subsequent analyses.
Genotyping
Selection of polymorphisms for genotyping
Polymorphisms for PON-locus genotyping were derived from dbSNP database (six coding, three promoter, four intronic, one 3′UTR polymorphisms) and seattle SNP database (from this database six tagging polymorphisms with a VAF > 0.05 covered 72 polymorphisms; one tagging polymorphism with VAF > 0.02 covered 77 polymorphisms). Additional polymorphisms were found in literature (two promoter SNPs from Marsillach et al., 2009; 12 intronic polymorphisms from Wang et al., 2003; Campo et al., 2004; Ranade et al., 2005; Carlson et al., 2006; Erlich et al., 2006; Saeed et al., 2006; Sanghera et al., 2008). Two PON1 coding polymorphisms (L55M, Q192R) were derived from Dahabreh et al. (2010). Genomic positions of polymorphisms refer to reference sequence PON3 NG_008726.1 (modified by adding PON1 NG_008779 and the intergenic region in between). SNP numbering differences occurred in various studies for PON1 promoter SNPs (−107 = −108; −824 = −832 according to Draganov and La Du, 2004). Database VAFs were extracted from Caucasian samples from one of these selections: dbSNP, build 132: (HapMap-CEU, pilot.1.CEU, PGA-EUROPEAN-PANEL); Seattle SNP (23 CEPH samples). Literature data was derived from these populations: 1143 southern Italians (Campo et al., 2004); 2634 Caucasians (Ranade et al., 2005); 949 Chinese (Wang et al., 2003). Polymorphisms were assigned by dbSNP rs number, Seattle SNP var number, amino acid change or naming within literature.
MALDI-TOF MS assay
Thirty-seven polymorphisms were genotyped by two MALDI-TOF MS assays. Primers (Table A4 in Appendix) were designed to specifically amplify regions around polymorphisms and carried a tag sequence (ACGTTGGATG) to avoid interactions with the MALDI-TOF MS analysis. Correct amplification was confirmed by sequencing. MassArray Assay Design (v3.0.0) was used for the design of MALDI-TOF MS extension primers. Two different assays were developed to include all 37 DNA variations analyzed (Table A5 in Appendix). Each assay consisted of preamplification by PCR, shrimp alkaline phosphatase (SAP) treatment, iPLEX primer extension, and a clean resin step. Samples were transferred to a 384 SpectroCHIP® Array (Sequenom) and analyzed in a MassArrayTM Compact mass spectrometer (Sequenom). Automated spectra acquisition was performed using Spectroacquire and data analysis was performed with MassArray Typer software v3.4. Further details are available on request.
Data for rs757158 (SNP 37) and rs854571 (SNP 38) were obtained from HumanHap300v1.1 chip analysis (Microarray Facility Tübingen Services, Tübingen, Germany). rs705379 (SNP 36) was genotyped using a predesigned TaqMan allelic discrimination assay (C_11708905_10; Applied Biosystems, Darmstadt, Germany) using TaqMan 7900HT (Applied Biosystems, Darmstadt, Germany).
Statistical analysis and computational genetic analysis
GraphPad Prism v4.00 (GraphPad Software Inc., San Diego, CA, USA) was applied for Spearman correlation analysis of (a) enzymatic atorvastatin-lactone hydrolysis activity with mRNA expression of selected candidate genes and (b) PON1 and PON3 mRNA and protein expression. Effects of non-genetic factors on enzymatic atorvastatin-lactone hydrolysis activity and PON1/3 mRNA/protein expression were tested by Wilcoxon–Mann–Whitney-tests. Fold-changes are representing observed differences between median values of corresponding phenotypes.
Observed and expected allele and genotype frequencies within populations were tested for deviation from Hardy–Weinberg equilibrium using the online DeFinetti program (Hardy-Weinberg Equilibrium, 2011). No deviation from Hardy–Weinberg equilibrium was detected for any of the SNPs analyzed. Linkage disequilibrium (LD) plots were created by Haploview 4.2 (Barrett et al., 2005). Haplotypes for the PON-locus were generated with statistical software R v2.11.1 (The R Project for Statistical Computing, 2011) using the library haplo.stats v1.4.4. Exclusion criterion for polymorphisms was a VAF < 2%. In case of 100% linked polymorphisms, only one representative was chosen and, if missing data occurred, completed by the 100% correlated polymorphisms. An iterative two-step expectation-maximization algorithm was applied to predict haplotype assignment of individuals based on activity data and polymorphisms (log-additive genetic model). Rare haplotypes were defined by a haplotype frequency <2% and were not included in further analyses. Resulting 13 haplotypes were manually combined to seven major types according to occurrence of PON1 promoter and PON3 F21F and four promoter polymorphism (Table 4). Wilcoxon–Mann–Whitney-tests were used to compare (a) carriers of identified haplotypes vs. carriers of reference haplotypes (*1 or *1/*1) and (b) for each of the selected PON1/3 polymorphisms, heterozygote and homozygote carriers of variant allele vs. homozygote carriers of reference allele.
Moreover, multivariate linear models and step-wise model selection based on Akaike’s information criterion were applied to determine the contribution of polymorphisms and non-genetic factors to atorvastatin-lactone hydrolysis and PON1 and PON3 expression variability. In this analysis, atorvastatin-lactone hydrolysis and PON1 and PON3 expression were first log-transformed in order to satisfy Gaussian distribution assumption. Normality of log-transformed values was verified by normal quantile–quantile plots. Moreover, for each polymorphism, the genetic model (dominant, recessive, or log-additive) with the most significant effect on the corresponding phenotype in the univariate analyses was chosen. Relevant polymorphisms in this analysis were: PON3 −4984 (var1496), −1091 (rs11767787), F21F (rs13226149), PON1 −1741 (rs757158), and −108 (rs705379). The coefficients of determination adjusted for the number of factors in the considered models were then used to specify the fraction of phenotype variability explained by (a) only polymorphisms, (b) only non-genetic factors, and (c) both, polymorphisms and non-genetic factors.
All tests were two-sided and statistical significance was defined as P < 0.05.
Conclusion
PON1 and PON3 were identified as the major enzymes for hydrolysis of atorvastatin-lactone in human liver. Although this study focused on the transformation from atorvastatin-lactone to atorvastatin-acid, it is very likely that these two enzymes also convert the corresponding hydroxyl-metabolites. Based on thorough polymorphism analysis, the two common amino acid variants L55M and Q192R did not seem to be of functional importance, while several rare protein variants were not present in our collection. Our data show that PON1 expression is governed mainly by the linked promoter polymorphisms −108T > C, −832G > A, and −1741G > A, the former of which likely represents the causal variant. Accordingly, haplotypes defined on the basis of this variant show significant changes in expression and atorvastatin-lactone hydrolysis. Our extensive analysis of PON3 polymorphisms failed to identify functional polymorphisms affecting PON3, which appears to be more subject to control by non-genetic factors. As atorvastatin-lactone has been associated with toxicity, these data may help to improve concepts for safer use of statins.
Conflict of Interest Statement
The authors declare that the research was conducted in the absence of any commercial or financial relationships that could be construed as a potential conflict of interest.
Acknowledgments
We thank Elke Schäffeler for helpful advice in MALDI-TOF MS genotyping assay development and Jessica K. Rieger for immunodetection of PON3 in primary human hepatocyte lysate. Britta Klumpp and Igor Liebermann are gratefully acknowledged for excellent technical assistance. The study was supported by the German Federal Ministry of Education and Science (BMBF grants 0313080I and 0315755 of the network program HepatoSys/Virtual Liver and grant 03 IS 2061C of the GANI_MED program), the 7FP EU Initial Training network program “FightingDrugFailure” (GA-2009-238132), and by the Robert-Bosch Foundation, Stuttgart, Germany.
References
André, S., Kozár, T., Kojima, S., Unverzagt, C., and Gabius, H.-J. (2009). From structural to functional glycomics: core substitutions as molecular switches for shape and lectin affinity of N-glycans. Biol. Chem. 390, 557–565.
Aragones, G., Guardiola, M., Barreda, M., Marsillach, J., Beltran-Debon, R., Rull, A., Mackness, B., Mackness, M., Joven, J., Simo, J. M., and Camps, J. (2011). Measurement of serum paraoxonase-3 concentration: method evaluation, reference values and influence of genotypes in a population-based study. J. Lipid Res. 52, 1055–1061.
Araoud, M., Neffeti, F., Douki, W., Najjar, M. F., and Kenani, A. (2010). Paraoxonase 1 correlates with butyrylcholinesterase and gamma glutamyl transferase in workers chronically exposed to pesticides. J. Occup. Health 52, 383–388.
Baer, A. N., and Wortmann, R. L. (2007). Myotoxicity associated with lipid-lowering drugs. Curr. Opin. Rheumatol. 19, 67–73.
Banerjee, I. (2010). Relationship between paraoxonase 1 (PON1) gene polymorphisms and susceptibility of stroke: a meta-analysis. Eur. J. Epidemiol. 25, 449–458.
Barrett, J. C., Fry, B., Maller, J., and Daly, M. J. (2005). Haploview: analysis and visualization of LD and haplotype maps. Bioinformatics 21, 263–265.
Billecke, S., Draganov, D., Counsell, R., Stetson, P., Watson, C., Hsu, C., and La Du, B. N. (2000). Human serum paraoxonase (PON1) isozymes Q and R hydrolyze lactones and cyclic carbonate esters. Drug Metab. Dispos. 28, 1335–1342.
Bouman, H. J., Schömig, E., van Werkum, J. W., Velder, J., Hackeng, C. M., Hirschhäuser, C., Waldmann, C., Schmalz, H.-G., Ten Berg, J. M., and Taubert, D. (2011). Paraoxonase-1 is a major determinant of clopidogrel efficacy. Nat. Med. 17, 110–116.
Campo, S., Sardo, A. M., Campo, G. M., Avenoso, A., Castaldo, M., D’Ascola, A., Giunta, E., Calatroni, A., and Saitta, A. (2004). Identification of paraoxonase 3 gene (PON3) missense mutations in a population of southern Italy. Mutat. Res. 546, 75–80.
Camps, J., Marsillach, J., and Joven, J. (2009). Measurement of serum paraoxonase-1 activity in the evaluation of liver function. World J. Gastroenterol. 15, 1929–1933.
Carlson, C. S., Heagerty, P. J., Hatsukami, T. S., Richter, R. J., Ranchalis, J., Lewis, J., Bacus, T. J., McKinstry, L. A., Schellenberg, G. D., Rieder, M., Nickerson, D., Furlong, C. E., Chait, A., and Jarvik, G. P. (2006). TagSNP analyses of the PON gene cluster: effects on PON1 activity, LDL oxidative susceptibility, and vascular disease. J. Lipid Res. 47, 1014–1024.
Costa, L. G., and Furlong, C. E. (2002). Paraoxonase (PON1) in Health and Disease: Basic and Clinical Aspects. Norwell, MA: Springer.
Dahabreh, I. J., Kitsios, G. D., Kent, D. M., and Trikalinos, T. A. (2010). Paraoxonase 1 polymorphisms and ischemic stroke risk: a systematic review and meta-analysis. Genet. Med. 12, 606–615.
Deakin, S., Leviev, I., Brulhart-Meynet, M.-C., and James, R. W. (2003). Paraoxonase-1 promoter haplotypes and serum paraoxonase: a predominant role for polymorphic position-107, implicating the Sp1 transcription factor. Biochem. J. 372, 643–649.
Draganov, D. I. (2010). Lactonases with organophosphatase activity: structural and evolutionary perspectives. Chem. Biol. Interact. 187, 370–372.
Draganov, D. I., and La Du, B. N. (2004). Pharmacogenetics of paraoxonases: a brief review. Naunyn Schmiedebergs Arch. Pharmacol. 369, 78–88.
Draganov, D. I., Teiber, J. F., Speelman, A., Osawa, Y., Sunahara, R., and La Du, B. N. (2005). Human paraoxonases (PON1, PON2, and PON3) are lactonases with overlapping and distinct substrate specificities. J. Lipid Res. 46, 1239–1247.
Erlich, P. M., Lunetta, K. L., Cupples, L. A., Huyck, M., Green, R. C., Baldwin, C. T., and Farrer, L. A. (2006). Polymorphisms in the PON gene cluster are associated with Alzheimer disease. Hum. Mol. Genet. 15, 77–85.
Furlong, C. E., Richter, R. J., Chapline, C., and Crabb, J. W. (1991). Purification of rabbit and human serum paraoxonase. Biochemistry 30, 10133–10140.
Gan, K. N., Smolen, A., Eckerson, H. W., and La Du, B. N. (1991). Purification of human serum paraoxonase/arylesterase. Evidence for one esterase catalyzing both activities. Drug Metab. Dispos. 19, 100–106.
Gomes, A. M., Winter, S., Klein, K., Turpeinen, M., Schaeffeler, E., Schwab, M., and Zanger, U. M. (2009). Pharmacogenomics of human liver cytochrome P450 oxidoreductase: multifactorial analysis and impact on microsomal drug oxidation. Pharmacogenomics 10, 579–599.
Gonzalvo, M. C., Gil, F., Hernandez, A. F., Rodrigo, L., Villanueva, E., and Pla, A. (1998). Human liver paraoxonase (PON1): subcellular distribution and characterization. J. Biochem. Mol. Toxicol. 12, 61–69.
Goosen, T. C., Bauman, J. N., Davis, J. A., Yu, C., Hurst, S. I., Williams, J. A., and Loi, C.-M. (2007). Atorvastatin glucuronidation is minimally and nonselectively inhibited by the fibrates gemfibrozil, fenofibrate, and fenofibric acid. Drug Metab. Dispos. 35, 1315–1324.
Gouédard, C., Barouki, R., and Morel, Y. (2004). Dietary polyphenols increase paraoxonase 1 gene expression by an aryl hydrocarbon receptor-dependent mechanism. Mol. Cell. Biol. 24, 5209–5222.
Han, C. Y., Chiba, T., Campbell, J. S., Fausto, N., Chaisson, M., Orasanu, G., Plutzky, J., and Chait, A. (2006). Reciprocal and coordinate regulation of serum amyloid A versus apolipoprotein A-I and paraoxonase-1 by inflammation in murine hepatocytes. Arterioscler. Thromb. Vasc. Biol. 26, 1806–1813.
Hardy-Weinberg Equilibrium. (2011). Available at: http://ihg2.helmholtz-muenchen.de/cgi-bin/hw/hwa1.pl
Harel, M., Aharoni, A., Gaidukov, L., Brumshtein, B., Khersonsky, O., Meged, R., Dvir, H., Ravelli, R. B. G., McCarthy, A., Toker, L., Silman, I., Sussman, J. L., and Tawfik, D. S. (2004). Structure and evolution of the serum paraoxonase family of detoxifying and anti-atherosclerotic enzymes. Nat. Struct. Mol. Biol. 11, 412–419.
Hermann, M., Bogsrud, M. P., Molden, E., Asberg, A., Mohebi, B. U., Ose, L., and Retterstøl, K. (2006). Exposure of atorvastatin is unchanged but lactone and acid metabolites are increased several-fold in patients with atorvastatin-induced myopathy. Clin. Pharmacol. Ther. 79, 532–539.
Jacobsen, W., Kuhn, B., Soldner, A., Kirchner, G., Sewing, K. F., Kollman, P. A., Benet, L. Z., and Christians, U. (2000). Lactonization is the critical first step in the disposition of the 3-hydroxy-3-methylglutaryl-CoA reductase inhibitor atorvastatin. Drug Metab. Dispos. 28, 1369–1378.
Kantola, T., Kivistö, K. T., and Neuvonen, P. J. (1998). Erythromycin and verapamil considerably increase serum simvastatin and simvastatin acid concentrations. Clin. Pharmacol. Ther. 64, 177–182.
Kearney, A. S., Crawford, L. F., Mehta, S. C., and Radebaugh, G. W. (1993). The interconversion kinetics, equilibrium, and solubilities of the lactone and hydroxyacid forms of the HMG-CoA reductase inhibitor, CI-981. Pharm. Res. 10, 1461–1465.
Lang, T., Klein, K., Fischer, J., Nüssler, A. K., Neuhaus, P., Hofmann, U., Eichelbaum, M., Schwab, M., and Zanger, U. M. (2001). Extensive genetic polymorphism in the human CYP2B6 gene with impact on expression and function in human liver. Pharmacogenetics 11, 399–415.
Law, M., and Rudnicka, A. R. (2006). Statin safety: a systematic review. Am. J. Cardiol. 97, 52C–60C.
Leviev, I., and James, R. W. (2000). Promoter polymorphisms of human paraoxonase PON1 gene and serum paraoxonase activities and concentrations. Arterioscler. Thromb. Vasc. Biol. 20, 516–521.
Liu, T., Qian, W.-J., Gritsenko, M. A., Camp, D. G., Monroe, M. E., Moore, R. J., and Smith, R. D. (2005). Human plasma N-glycoproteome analysis by immunoaffinity subtraction, hydrazide chemistry, and mass spectrometry. J. Proteome Res. 4, 2070–2080.
Lu, H., Zhu, J., Zang, Y., Ze, Y., and Qin, J. (2006). Cloning, purification, and refolding of human paraoxonase-3 expressed in Escherichia coli and its characterization. Protein Expr. Purif. 46, 92–99.
Mackness, B., Hine, D., McElduff, P., and Mackness, M. (2006). High C-reactive protein and low paraoxonase 1 in diabetes as risk factors for coronary heart disease. Atherosclerosis 186, 396–401.
Marcoff, L., and Thompson, P. D. (2007). The role of coenzyme Q10 in statin-associated myopathy: a systematic review. J. Am. Coll. Cardiol. 49, 2231–2237.
Marsillach, J., Aragonès, G., Beltrán, R., Caballeria, J., Pedro-Botet, J., Morcillo-Suárez, C., Navarro, A., Joven, J., and Camps, J. (2009). The measurement of the lactonase activity of paraoxonase-1 in the clinical evaluation of patients with chronic liver impairment. Clin. Biochem. 42, 91–98.
Neuvonen, P. J., Niemi, M., and Backman, J. T. (2006). Drug interactions with lipid-lowering drugs: mechanisms and clinical relevance. Clin. Pharmacol. Ther. 80, 565–581.
Nicolet, Y., Lockridge, O., Masson, P., Fontecilla-Camps, J. C., and Nachon, F. (2003). Crystal structure of human butyrylcholinesterase and of its complexes with substrate and products. J. Biol. Chem. 278, 41141–41147.
Nies, A. T., Koepsell, H., Winter, S., Burk, O., Klein, K., Kerb, R., Zanger, U. M., Keppler, D., Schwab, M., and Schaeffeler, E. (2009). Expression of organic cation transporters OCT1 (SLC22A1) and OCT3 (SLC22A3) is affected by genetic factors and cholestasis in human liver. Hepatology 50, 1227–1240.
Prueksaritanont, T., Subramanian, R., Fang, X., Ma, B., Qiu, Y., Lin, J. H., Pearson, P. G., and Baillie, T. A. (2002). Glucuronidation of statins in animals and humans: a novel mechanism of statin lactonization. Drug Metab. Dispos. 30, 505–512.
Ranade, K., Kirchgessner, T. G., Iakoubova, O. A., Devlin, J. J., DelMonte, T., Vishnupad, P., Hui, L., Tsuchihashi, Z., Sacks, F. M., Sabatine, M. S., Braunwald, E., White, T. J., Shaw, P. M., and Dracopoli, N. C. (2005). Evaluation of the paraoxonases as candidate genes for stroke: Gln192Arg polymorphism in the paraoxonase 1 gene is associated with increased risk of stroke. Stroke 36, 2346–2350.
Riedmaier, S., Klein, K., Hofmann, U., Keskitalo, J. E., Neuvonen, P. J., Schwab, M., Niemi, M., and Zanger, U. M. (2010). UDP-glucuronosyltransferase (UGT) polymorphisms affect atorvastatin lactonization in vitro and in vivo. Clin. Pharmacol. Ther. 87, 65–73.
Saeed, M., Siddique, N., Hung, W. Y., Usacheva, E., Liu, E., Sufit, R. L., Heller, S. L., Haines, J. L., Pericak-Vance, M., and Siddique, T. (2006). Paraoxonase cluster polymorphisms are associated with sporadic ALS. Neurology 67, 771–776.
Sanghera, D. K., Manzi, S., Minster, R. L., Shaw, P., Kao, A., Bontempo, F., and Kamboh, M. I. (2008). Genetic variation in the paraoxonase-3 (PON3) gene is associated with serum PON1 activity. Ann. Hum. Genet. 72, 72–81.
Sardo, M. A., Campo, S., Bonaiuto, M., Bonaiuto, A., Saitta, C., Trimarchi, G., Castaldo, M., Bitto, A., Cinquegrani, M., and Saitta, A. (2005). Antioxidant effect of atorvastatin is independent of PON1 gene T(-107)C, Q192R and L55M polymorphisms in hypercholesterolaemic patients. Curr. Med. Res. Opin. 21, 777–784.
Shitara, Y., and Sugiyama, Y. (2006). Pharmacokinetic and pharmacodynamic alterations of 3-hydroxy-3-methylglutaryl coenzyme A (HMG-CoA) reductase inhibitors: drug-drug interactions and interindividual differences in transporter and metabolic enzyme functions. Pharmacol. Ther. 112, 71–105.
Silva, M. A., Swanson, A. C., Gandhi, P. J., and Tataronis, G. R. (2006). Statin-related adverse events: a meta-analysis. Clin. Ther. 28, 26–35.
Skottheim, I. B., Gedde-Dahl, A., Hejazifar, S., Hoel, K., and Asberg, A. (2008). Statin induced myotoxicity: the lactone forms are more potent than the acid forms in human skeletal muscle cells in vitro. Eur. J. Pharm. Sci. 33, 317–325.
Suchocka, Z., Swatowska, J., Pachecka, J., and Suchocki, P. (2006). RP-HPLC determination of paraoxonase 3 activity in human blood serum. J. Pharm. Biomed. Anal. 42, 113–119.
Testa, B., and Mayer, J. M. (2003). Hydrolysis in drug and prodrug metabolism: chemistry, biochemistry, and enzymology. Zürich: Helvetica Chimica Acta.
The R Project for Statistical Computing. (2011). Available at: http://www.r-project.org/
Thompson, P. D., Clarkson, P., and Karas, R. H. (2003). Statin-associated myopathy. JAMA 289, 1681–1690.
Van Lenten, B. J., Wagner, A. C., Navab, M., and Fogelman, A. M. (2001). Oxidized phospholipids induce changes in hepatic paraoxonase and ApoJ but not monocyte chemoattractant protein-1 via interleukin-6. J. Biol. Chem. 276, 1923–1929.
Keywords: atorvastatin-lactone, myopathy, rhabdomyolysis, paraoxonase, PON1, PON3, SNP, pharmacogenetics
Citation: Riedmaier S, Klein K, Winter S, Hofmann U, Schwab M and Zanger UM (2011) Paraoxonase (PON1 and PON3) polymorphisms: impact on liver expression and atorvastatin-lactone hydrolysis. Front. Pharmacol. 2:41. doi: 10.3389/fphar.2011.00041
Received: 03 May 2011;
Paper pending published: 02 June 2011;
Accepted: 07 July 2011;
Published online: 27 July 2011.
Edited by:
Ann K. Daly, University of Newcastle upon Tyne, UKReviewed by:
Norio Yasui-Furukori, Hirosaki University, JapanJean-Marie Dupret, University Paris Diderot, France
Copyright: © 2011 Riedmaier, Klein, Winter, Hofmann, Schwab and Zanger. This is an open-access article subject to a non-exclusive license between the authors and Frontiers Media SA, which permits use, distribution and reproduction in other forums, provided the original authors and source are credited and other Frontiers conditions are complied with.
*Correspondence: Ulrich M. Zanger, Dr. Margarete Fischer-Bosch Institute of Clinical Pharmacology, Auerbachstr 112, D-70376 Stuttgart, Germany. e-mail: uli.zanger@ikp-stuttgart.de