 Eric A. Benson1*
 Michael T. Eadon1
 Zeruesenay Desta1
 Yunlong Liu2
 Hai Lin2
 Kimberly S. Burgess3
 Matthew W. Segar2
 Andrea Gaedigk4
 Todd C. Skaar1
- 1Division of Clinical Pharmacology, Department of Medicine, Indiana University School of Medicine, Indianapolis, IN, USA
- 2Department of Medical and Molecular Genetics, Indiana University School of Medicine, Indianapolis, IN, USA
- 3Department of Pharmacology and Toxicology, Indiana University School of Medicine, Indianapolis, IN, USA
- 4Division of Clinical Pharmacology, Toxicology and Therapeutic Innovation, Children's Mercy Kansas City and School of Medicine, University of Missouri-Kansas City, Kansas City, MO, USA
Membrane drug transporters contribute to the disposition of many drugs. In human liver, drug transport is controlled by two main superfamilies of transporters, the solute carrier transporters (SLC) and the ATP Binding Cassette transporters (ABC). Altered expression of these transporters due to drug-drug interactions can contribute to differences in drug exposure and possibly effect. In this study, we determined the effect of rifampin on gene expression of hundreds of membrane transporters along with all clinically relevant drug transporters.
Methods: In this study, primary human hepatocytes (n = 7 donors) were cultured and treated for 24 h with rifampin and vehicle control. RNA was isolated from the hepatocytes, mRNA expression was measured by RNA-seq, and miRNA expression was analyzed by Taqman OpenArray. The effect of rifampin on the expression of selected transporters was also tested in kidney cell lines. The impact of rifampin on the expression of 410 transporter genes from 19 different transporter gene families was compared with vehicle control.
Results: Expression patterns of 12 clinically relevant drug transporter genes were changed by rifampin (FDR < 0.05). For example, the expressions of ABCC2, ABCB1, and ABCC3 were increased 1.9-, 1.7-, and 1.2-fold, respectively. The effects of rifampin on four uptake drug transporters (SLCO1B3, SLC47A1, SLC29A1, SLC22A9) were negatively correlated with the rifampin effects on specific microRNA expression (SLCO1B3/miR-92a, SLC47A1/miR-95, SLC29A1/miR-30d#, and SLC22A9/miR-20; r < −0.79; p < 0.05). Seven hepatic drug transporter genes (SLC22A1, SLC22A5, SLC15A1, SLC29A1, SLCO4C1, ABCC2, and ABCC4), whose expression was altered by rifampin in hepatocytes, were also present in a renal proximal tubular cell line, but in renal cells rifampin did not alter their gene expression. PXR expression was very low in the kidney cells; this may explain why rifampin induces gene expression in a tissue-specific manner.
Conclusion: Rifampin alters the expression of many of the clinically relevant hepatic drug transporters, which may provide a rational basis for understanding rifampin-induced drug-drug interactions reported in vivo. The relevance of its effect on many other transporters remains to be studied.
Introduction
The transport of drugs in and out of tissues and cells is now recognized as an important factor in drug efficacy and toxicity (International Transporter et al., 2010; Hillgren et al., 2013). Drug transport occurs at key sites including the liver, kidney, intestine, and blood-brain barrier to regulate drug and/or metabolite distribution (International Transporter et al., 2010; Hillgren et al., 2013). Understanding the regulation of drug transporter gene expression is important to improve drug efficacy and toxicity, especially for the many drugs transported into and out of the liver. Drug transport into and out of the liver is controlled by two superfamilies of transporters, the solute carrier transporters (SLC) and the ATP Binding Cassette transporters (ABC). Among these transporters, 32 have currently been designated as clinically relevant drug transporters (pharmADME.org; International Transporter Consortium; International Transporter et al., 2010; Hillgren et al., 2013). For most of these transporters, gene expression has not been studied in primary human hepatocytes to assess the impact of rifampin.
Rifampin is commonly used to treat tuberculosis worldwide. It is well-known to induce the expression of many of the cytochrome P450 drug metabolism genes. It is also known to regulate the gene expression of several ABC drug transporters, but its effects on many of the transporters is yet unknown (Stapelbroek et al., 2010; Peters et al., 2011; Vilas-Boas et al., 2013; Weiss and Haefeli, 2013). Several clinically significant rifampin-induced drug-drug interactions have been documented (Niemi et al., 2003; Baciewicz et al., 2013). At least some of the rifampin effect is due to its binding to and activation of the pregnane X receptor (PXR). PXR is a transcription factor that regulates the expression of several of the ABC transporter genes (Mottino, 2008). In addition, rifampin can also regulate transporter expression indirectly by regulating microRNAs (miRNAs), which target the transporter mRNAs (Haenisch et al., 2011). miRNAs are short RNA sequences that regulate mRNA function by degrading the target mRNAs or blocking the mRNA translation. Rifampin induces hepatic expression of many miRNAs (Ramamoorthy et al., 2013), and miRNAs have been shown to regulate drug transporter expression and translation (Haenisch et al., 2011; Zhu et al., 2011; Bang and Thum, 2012), supporting the possibility that miRNAs mediate some of the effects of rifampin on transporter expression. In fact, this has been shown to be true where rifampin induces miRNA-379 expression in the HepG2 human liver cancer cell line and this miRNA subsequently down-regulates ABCC2 protein levels (Haenisch et al., 2011).
In this report, we addressed three aims. First, we determined the effect of rifampin on the expression of the 32 clinically relevant drug transporter genes in primary human hepatocytes. Next, we determined the association of the rifampin-mediated changes in transporter expression with the rifampin-mediated induction of miRNA expression. Lastly, we evaluated whether the effects of rifampin on several drug transporters in hepatocytes has any tissue specificity. Our results demonstrate the wide-reaching effects of rifampin on the expression of many transporter genes relevant to drug metabolism and disposition.
Methods
Human Hepatocytes, Drug Treatment, RNA Isolation, and miRNA Profiling
Our studies analyzed the RNA expression data collected by the studies done by Ramamoorthy et al. (2013). In those studies, “human hepatocytes from seven different subjects were obtained from CellzDirect (Durham, NC).” The primary human hepatocytes were grown on collagen coated plates and treated with rifampin (10 μM) or vehicle (methanol, 0.01%) for 24 h. Each culture from a different individual subject was treated as a biologic replicate (n = 7). In vitro studies were performed within 72–120 h from the time of hepatocyte isolation. Total RNA and miRNA were isolated with a miRNeasy kit (Qiagen, Valencia, CA). miRNAs (754) were analyzed using the Taqman OpenArray Human miRNA Panel in technical duplicates (each sample run on two OpenArrays). Global mRNA expression was measured by RNA-seq conducted on the SOLiD4 system (Life Technologies, Inc, Carlsbad, CA). The hepatocyte tissues were purchased commercially, and were de-identified. These studies were not deemed human subject research. CellzDirect was purchased by another company, and specific demographic or clinical information on the donors was not transferred in the transition and the information could not be retrieved.
miRNA Bioinformatics
The miRNA bioinformatic analysis was re-performed from the original analysis done by Ramamoorthy et al. (2013). For the technical duplicate values, the CT values were averaged. If a miRNA had no value for both technical replicates, then it was assigned the highest CT value of 40. In rare cases, if one technical duplicate detected the miRNA and the other technical duplicate was undetectable, the detectable value was used. To determine which miRNAs to include in the study, we selected only those with at least four of the seven control samples or four of the seven rifampin treated samples with average CT values < 35. All the small nuclear RNA, U6 and RNUs, were removed. The remaining 333 miRNAs were Quantile normalized using PARTEK software. Quality control analysis after each normalization step included the visual evaluation of the histograms followed by principal component analysis (PCA) to identify systematic variations caused by various factors such as OpenArray runs. Normalized data were analyzed by ANOVA using a mixed effect model.
RNA sequencing Analysis
Our studies used the data processing, quality assessment, sequence alignment, and gene expression analysis that was previously performed and published by Ramamoorthy et al. (2013). As previously described for quality control, low quality. Briefly, RNA sequencing reads were removed including reads of less than 35 bases, or having a quality score of 20 or less. RNA was considered expressed if at least 10 reads were present after counts per million normalization.
Treatment and control groups were compared using the log2 transformed fold-change values. Of note, six data points in the transporter gene mRNA expression data were undetectable. Since a zero cannot be used in the log2 transformed fold-change calculations, the zero values were replaced with the minimum read numbers. The resultant p-values of the 410 transporters were corrected using a Benjamini and Hochberg's false discovery rate correction. A fold-change of one represents no change; a two-fold change is a doubling of the expression level.
Correlations of the rifampin effects on the expression of two transporter genes were performed using the Spearman rank correlations on the log2 transformed fold-change values. Correlations of the rifampin effect on specific gene expression with specific miRNA expression were also performed using the Spearman rank correlations on the log2 transformed fold-change using the delta CT values for the miRNA expression.
Selection of Transporters
All human transporter genes were identified using the University of California Santa Cruz reference genome using the following inputs: http://genome.ucsc.edu/cgi-bin/hgTables, criteria- group: genes and gene prediction, track: RefSeq Genes, table: RefGene, assembly: feb. 2009 (GRch37/hg19), clade: mammal, genome: human, region: genome, output format: selected fields from primary and related tables, click get output button, then on the next screen, check both- Name [name of gen (usually transcript_id from GTF)], and name 2 [alternate name(e.g., gene_id from GTF)] and then click get output. Selected transporters evaluated in our study were queried from this UCSC gene list. These human transporters were selected using a combination of literature, pharmADME.org, and NIH NCBI Gene using the term transporter, and using terms transporter, influx transporter, efflux transporter. Transporter gene families were chosen based on possible relevance to drug metabolism or clinical relevance.
Culture and Rifampin Treatment of Renal Cells
Normal human proximal tubular kidney (NHPTK) cells were a gift from the Robert L. Bacallao Laboratory (Herbert et al., 2013). NHPTK cells are primary renal cells from a single donor immortalized with human telomerase plasmid transfection and maintained in REGM media (Lonza, Basel, Switzerland) supplemented with 10% fetal bovine serum (HyClone) to maintain their renal phenotype. NHPTK cells were diluted to 20–30% confluence three times a week and maintained at 37°C in 95% humidified atmosphere with 5% CO2. All in vitro studies were performed on cells in passages 6 through 9 (corresponds to passage 3 through 6 following immortalization). Cultures from each passage were treated as biologic replicates (n = 4). NHPTK cells were treated for 24 h with rifampin (10 μM) or with the vehicle control of methanol (0.01%).
Quantitative Real-Time PCR of Renal Cells
Quantitative real-time polymerase chain reaction (qRT-PCR) was performed to measure the level of expression of CYP3A4, GAPDH, and other transporter genes in NHPTK cells. Since, the PXR expression was at the limit of detection in NHPTK cells, we measured PXR in HepG2 cells as a positive control to verify that are assay could detect the low quantity of PXR found in HepG2 cells. A total of 1 million cells were pelleted following rifampin or vehicle treatment, washed in ice-cold PBS, centrifuged to remove PBS, and stored at −80°C until RNA isolation. Total RNA was extracted using the miRNeasy Plus Mini Kit (Qiagen, Hilden, Germany) following the manufacturer's protocol. RNA quality assessment and quantification were conducted using the optical spectrometry 260/280 and 260/230 nm ratios. Subsequently, mRNA was reverse transcribed to cDNA using the Bio-Rad iScript Reverse Transcription Kit (Bio-Rad, Hercules, CA). The final concentration of cDNA was 25 ng/ml. qRT-PCR was performed with TaqMan Gene Expression Assays (Bio-Rad) for CYP3A4, using commercially obtained primers on the Bio-Rad iCycler RT-PCR system as previously described (Eadon et al., 2013). qRT-PCR for all other genes, including GAPDH as an endogenous control, was performed using custom made primers (Life Technologies) and iTaq Universal SYBR Green (Bio-Rad) on the Bio-Rad iCycler RT-PCR system. Primer sequences are provided in Supplemental Table 1. Reactions were carried out in 20 μl volumes, which consisted of: 10 μl SYBR green, 4 μl cDNA, 0.4 μl of each primer (10 μM stock), and 5.2 μl of water. The RT-PCR reactions were run in triplicate. The thermocycler parameters were 95°C for 30 s, 40 cycles of 95°C for 15 s and then an annealing temperature for 30 s (provided in Supplemental Table 1), with ramping speeds of 1.6–1.98 degrees °C/s and a melt curve. The CT threshold and baseline for each experiment were set automatically by the Bio-Rad software. The delta-delta (ΔΔCT) method was used to obtain the relative expression of each gene for samples treated with rifampin or vehicle. Each sample's gene expression of interest was first subtracted from its GAPDH expression to determine its ΔCT. The ΔCTcontrol was then subtracted from the ΔCTrifampin to determine the ΔΔCT. Fold-changes of the rifampin treatments as compared to the controls were determined by the formula: fold change = 2ΔΔCT. Gene expression for each condition is given as a fold-change ± SEM relative to the control where the SEM was calculated from individual ΔΔCTs of the 4 biologic replicates for each condition. Statistical significance was assessed based on a student's t-test between conditions.
In silico ChIP-Seq PXR Binding Site Analysis
A publically available chromosome immunoprecipitation DNA sequencing (ChIP-Seq) database available from Smith et al. (2014) was analyzed in silico for PXR binding sites within the 410 transporter genes in this study (Smith et al., 2014). This ChIP-Seq dataset analyzed the PXR binding in rifampin treated vs. DMSO vehicle treated HepG2 cells.
Accession Numbers
The raw RNA-seq data have been made publically available through NCBI's Gene Expression Omnibus and are accessible through GEO Series accession number GSE79933 (http://www.ncbi.nlm.nih.gov/geo/query/acc.cgi?acc=GSE79933). The miRNA OpenArray data have been made publically available at http://compbio.iupui.edu/group/6/pages/rifampin.
Results
Regulation of Membrane Transporters by Rifampin
A total of 410 transporter genes from 19 transporter gene families were selected for analysis in the primary hepatocytes. Two hundred sixty-seven of the genes were in the ABC and SLC superfamilies of transporters. Thirty-four of the 267 are drug transporters that are considered to be clinically important for drug disposition (International Drug Transporter Consortium and/or PharmADME.org; International Transporter et al., 2010; Hillgren et al., 2013). Of the 32 transporters designated as “clinically relevant drug transporters” by the International Transporter Consortium (Table 1), we expected at least 18 to be expressed in the hepatocytes (Hillgren et al., 2013). All 18 expected drug transporter genes were indeed found to be expressed in every donor sample; we also found six additional transporters that were previously not reported to be expressed in the liver (Table 2). The expression of 12 of these drug transporter genes was modulated in the hepatocytes by rifampin (Table 2). Rifampin induced the expression of 9 of the 12 drug transporter genes and the expression of three transporters was reduced. The results of the other 16 families of transporters (143 genes) we have characterized are provided in Supplemental Table 2.
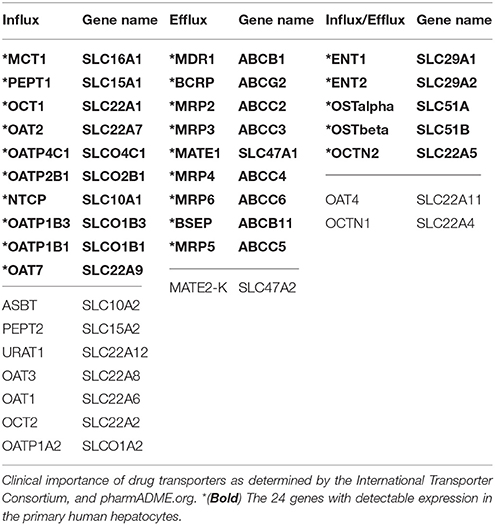
Table 1. Clinically important drug transporters.

Table 2. Rifampin-induced changes in gene expression of clinically relevant drug transporters.
Rifampin altered the expression of 62 of the 267 (~23%) solute carrier (SLC) superfamily genes (Supplemental Table 2). The fifteen SLC genes with the highest changes in expression levels are shown in Figures 1A,B. The expression of three out of the five (60%) detected genes of the SLCO family were also altered by rifampin (Supplemental Table 2). PXR has been shown to regulate SLCO2B1 and SLCO1B1, but the expression of only SLCO2B1 increased (1.73-fold) in our study. In addition, rifampin altered the expression of 12 of the 38 (32%) ATP-binding cassette (ABC) superfamily transporter genes (Supplemental Table 3). Eleven of these ABC genes were induced as shown in Figure 1C, and one (ABCA8) was reduced (Supplemental Table 2).
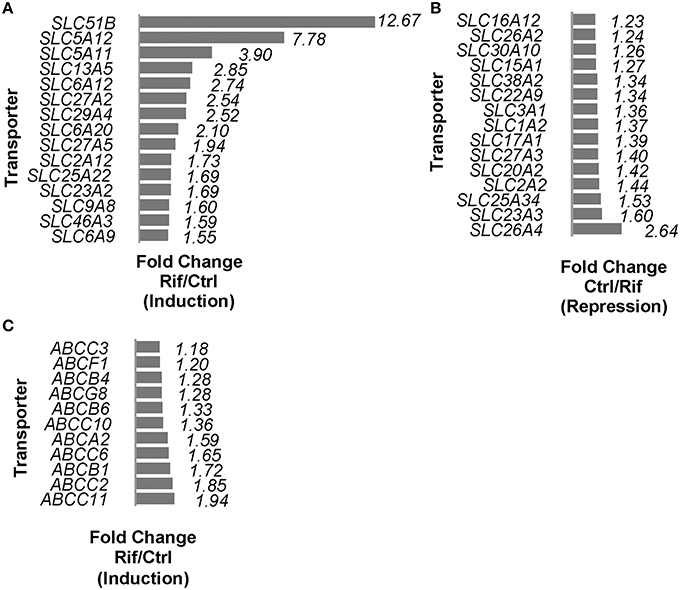
Figure 1. SLCs (including SLCOs) and ABCs mRNA expressions regulated by rifampin with FDR < 0.05. (A) Induction of SLCs by rifampin by fold change (fold change represented as rifampin/control) (FDR < 0.05); the top 15 SLCs are shown. (B) Reduction of SLCs by rifampin by fold change (fold change represented as control/rifampin) (FDR < 0.05); the 15 most reduced SLCs are shown. (C) Rifampin induced 11 ABC transporter genes based on fold change (rifampin/control) with FDR < 0.05. A fold change equal to 1 is defined as no change, and a fold change of 2 is defined as 2x the expression.
Correlations of the Effect of Rifampin on Gene Expression
We next tested whether there were correlations in the effect of rifampin on the expression of drug transporter and cytochrome P450 (CYP) genes. Since each hepatocyte culture replicate was from a different donor, we considered each replicate a separate individual. There were nine pairs of drug transporters that were positively correlated (FDR < 0.05; Figure 2; all CYP/Transporter gene expression correlations are found in Supplemental Table 3), i.e., each pair of genes was upregulated (r > 0.79) upon rifampin treatment. We also correlated the rifampin effects on the drug transporters with rifampin effects on CYP gene expression. There were seven positive correlations (FDR < 0.05; Figure 3; for the correlations of all CYP/Transporter genes see Supplemental Table 4). Interestingly, four were correlations with CYP4F2 (SLCO2B1, SLC29A1, SLC47A1, and SLCO4C1).
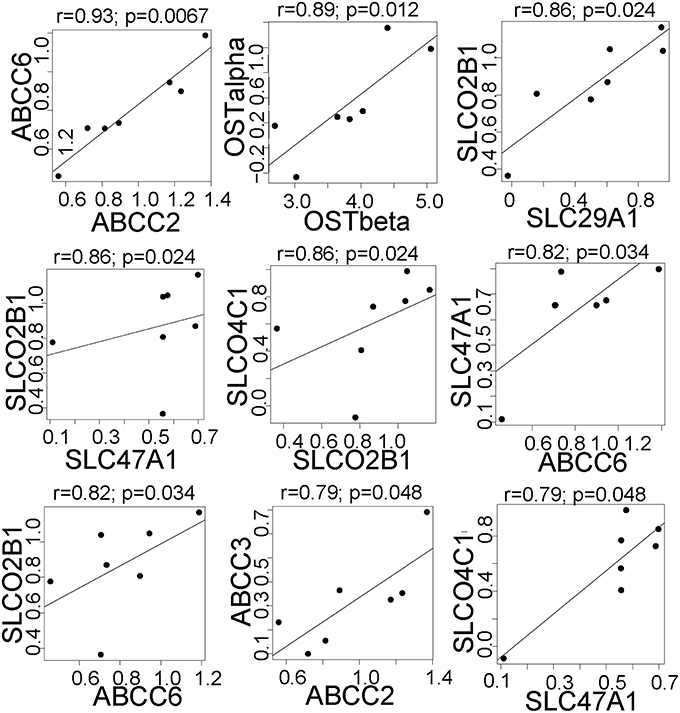
Figure 2. The significant correlations between the expression of clinically relevant transporter genes that were regulated by rifampin. The expression [represented by log2fold change (Log2FC)] after rifampin treatment) was correlated for all 410 transporter genes. Only the significant correlation (p < 0.05 by Spearman correlation) are shown for transporters regulated by rifampin with an FDR < 0.05. Spearman correlation was performed because an assumption of normal distribution could not be made.
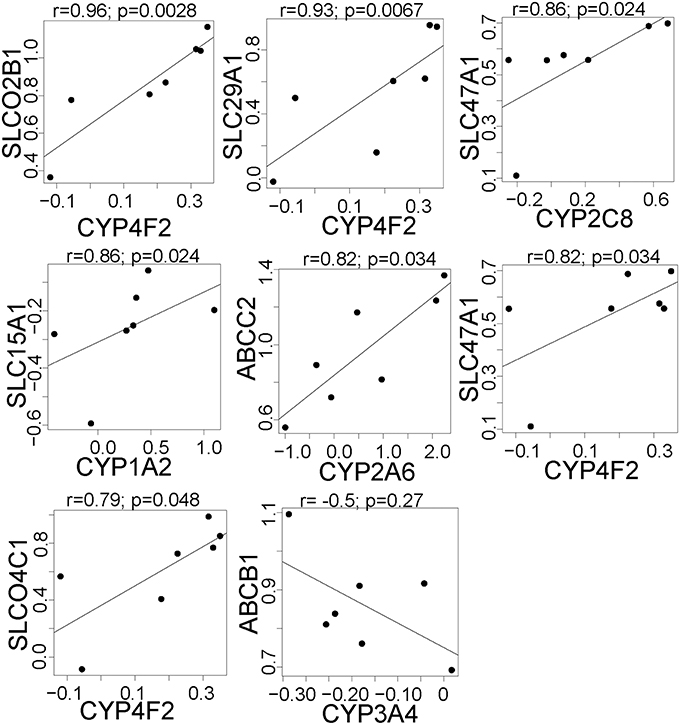
Figure 3. The significant correlations between the expression of drug metabolism genes and clinically relevant transporter genes that are regulated by rifampin. The expression [represented by log2fold change (Log2FC)] after rifampin treatment was correlated between all CYP and 410 transporters genes. The figure illustrates, the seven significant positive and one significant negative correlations between the expression of CYP and drug transporter genes that were regulated by rifampin with an FDR < 0.05. These were the only correlations with a p < 0.05 by Spearman correlation. Spearman correlation was performed because an assumption of normal distribution could not be made.
Correlation between miRNA Induction and Changes of Clinically Relevant Drug Transporter Expression
We have previously shown that rifampin induces the expression of several miRNAs in hepatocytes (Ramamoorthy et al., 2013). To identify drug transporters that may be modulated by these miRNAs, we determined the correlations between rifampin induction of miRNAs and the rifampin effect on drug transporter gene expression. The direct effects of the miRNAs on gene expression would be expected to downregulate transporter expression; however, since miRNAs could also have indirect effects and induce the expression of the drug transporter genes, we searched for both positive and negative correlations. We identified 14 highly correlated negative associations (Table 3; for the correlations of the all transporter/miRNAs gene expression see Supplemental Table 5). Three miRNAs, miR-320, miR-616, and miR-95, each correlated with two different drug transporters. Three drug transporters, ABCB11, ABCC4, and ABCC5 were negatively correlated with two different miRNAs each. Based on the bioinformatics tools we employed, none of these were predicted to be direct effects. Only three rifampin-induced miRNAs were predicted to bind to drug transporters. Target Scan predicted miRNA binding of miR-335 to SLC29A2, miR-200b# to SLCO1B1, and miR-616 to SLCO1B1. However, neither of these transporters genes expression were altered by rifampin.
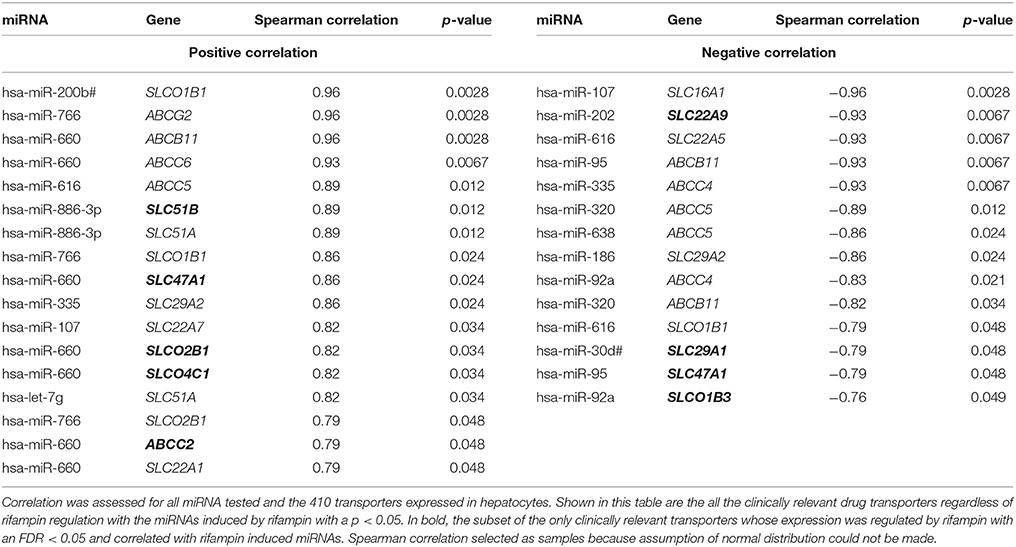
Table 3. All clinically relevant drug transporters correlated with miRNA induced by rifampin with a p < 0.05.
We identified 18 highly positive correlations between the rifampin effects on miRNAs and its effects on drug transporter expression levels (Table 3; Supplemental Table 5). miR-660 positively correlated with seven different transporters, miR-766 positively correlated with three transporters, and miR-886-3p and let-7g positively correlated with two transporters. None of the rifampin-induced miRNAs were predicted to bind to any of the rifampin-regulated drug transporters.
Rifampin's Modulation of Drug Transporter Gene Expression is Tissue Specific
Many of the drug transporters that we detected in the hepatocytes are also expressed in other tissues, including the kidney (Hillgren et al., 2013). Thus, we determined if rifampin demonstrated any tissue specificity by regulating the same transporters in human kidney cells. Normal human proximal tubular kidney (NHPTK) cells were treated with rifampin analogously to primary hepatocytes, and gene expression was measured. Seven transporters were selected based on their differential expression in hepatocytes and their renal proximal tubular relevance. Expression of SLC22A1, SLC22A5, SLC15A1, SLC29A1, SLCO4C1, MRP2, and MRP4 was detected, but did not change significantly following rifampin treatment (Supplemental Figure 1A; statistics are provided in Supplemental Table 6). CYP3A4 expression was low in NHPTK cells with raw CT values between 35 and 37. Expression was not significantly elevated following rifampin treatment (Supplemental Figure 1B). As CYP3A4 is PXR dependent, gene expression of NR1I2 (PXR) was also measured in NHPTK cells and compared to NR1I2 expression in a positive control cell line, HepG2 cells. Since we expected NR1I2 expression to be much lower than hepatocytes, we used HepG2 as a positive control, which is known to have relatively low NR1I2 expression levels (Gerets et al., 2012). The expression of NR1I2 was much lower in NHPTK cells when compared to HepG2 (Supplemental Figure 1C).
38 Transporters have Rifampin Induced PXR Binding Sites
Utilizing a publically available ChIP-Seq database from Smith et al. (2014), Figure 4 illustrates our in silico analysis of this dataset. The 410 transporter genes were mapped to Ensembl annotation. The transcription start site (TSS) was located for each gene and a promoter region was defined as ± 2 kilobases from TSS of each gene. From the ChIP-Seq dataset, 6302 PXR peaks were identified in the rifampin treated HepG2 cells and 1157 PXR peaks in DMSO treated HepG2. PXR peaks were extracted only if uniquely found in rifampin treated HepG2 vs. DMSO vehicle. The remaining 6063 unique rifampin peaks were compared for overlap with the 410 promoter regions of the transporters. 58 of the 410 transporter genes' promoter regions were identified to have PXR binding sites. Table 4 illustrates the PXR binding site for one isoform of each gene transcript, while Supplemental Table 7 provides a list of the PXR binding site analysis for all gene transcript isoforms. Thirty three members of the SLC (SLC10A7, SLC16A3, SLC17A5, SLC1A4, SLC20A1, SLC20A2, SLC22A15, SLC22A3, SLC23A2, SLC25A1, SLC25A10, SLC25A11, SLC25A22, SLC25A4, SLC25A42, SLC25A5, SLC26A2, SLC29A1, SLC2A1, SLC2A10, SLC30A10, SLC37A3, SLC39A7, SLC39A8, SLC3A2, SLC41A2, SLC43A1, SLC47A1, SLC5A11, SLC5A3, SLC5A9, SLC7A5, and SLCO2B1), and 7 members of the ABC (ABCA2, ABCA3, ABCA9, ABCB4, ABCC10, ABCC2, and ABCC3) superfamily of transporters have PXR binding sites. Five of the clinically relevant drug transporter genes, ABCC2, ABCC3, SLC29A1, SLC47A1, and SLCO2B1 were found to have PXR peaks within their promoter regions.
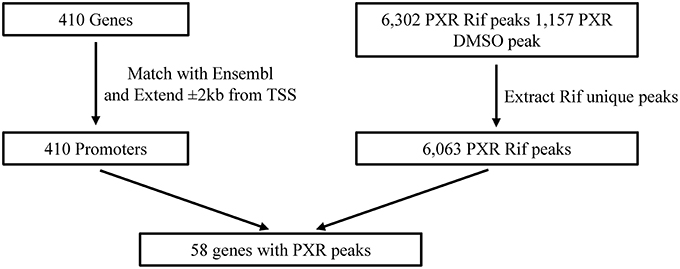
Figure 4. Illustration of the in silico ChIP-Seq testing for PXR binding sites within the 410 transporters. Rif, rifampin; TSS, Transcription Start Site.
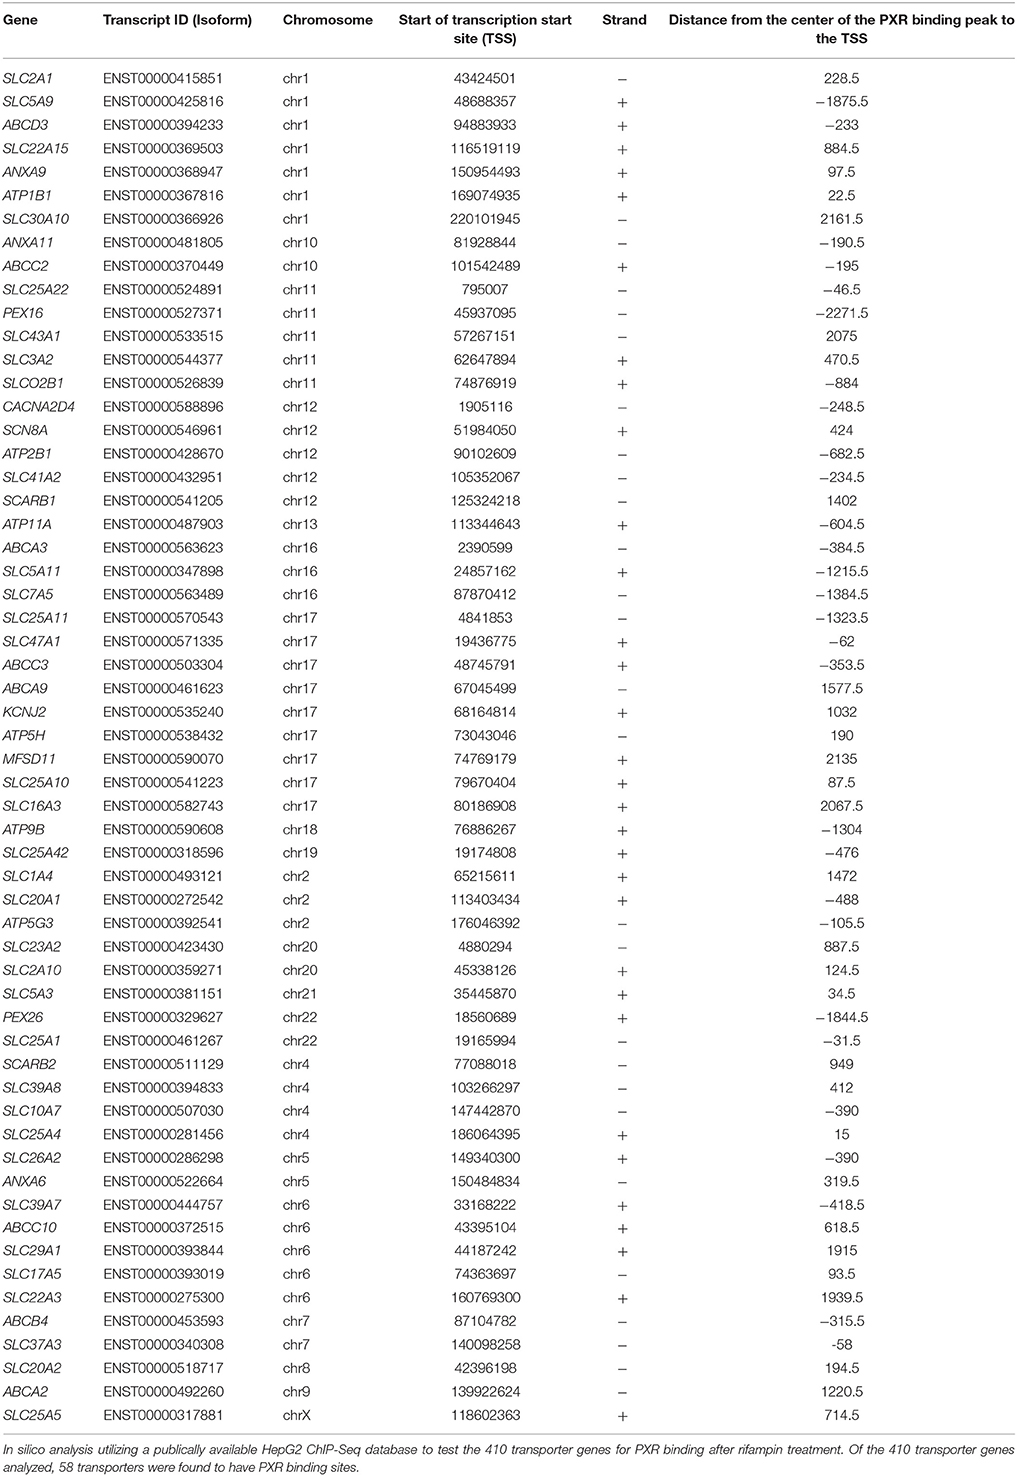
Table 4. The 58 transporters with ChIP-Seq determined PXR binding sites.
Discussion
Our study has several important first-time characterizations of rifampin's direct and indirect regulation of membrane transporters. First, rifampin regulates the gene expression of many members of the two major superfamilies (ABC and SLC) involved with clinically relevant drug transport. Second, the modulation of rifampin of transporter gene expression is associated with changes in miRNA expression. Third, we demonstrated that the effect of rifampin on transporter gene expression is tissue-specific. To the best of our knowledge, this study provides the first global characterization of rifampin induction of drug transporter gene expression.
Our studies demonstrate that rifampin treatment induces the gene expression of many members of the SLCO, SLC, and ABC transporter families. Twelve ABC transporter genes were regulated either directly or indirectly by rifampin; of these 12 ABC transporters genes, five of have previously been shown to be regulated by rifampin (Nishimura et al., 2002; Teng et al., 2003; Stapelbroek et al., 2010; Vilas-Boas et al., 2013; Weiss and Haefeli, 2013; Williamson et al., 2013) and two of the three ABC genes with the smallest p-values in our data set were drug transporters (ABCC2, and ABCB1). ABCC2 and ABCB1 have been shown to be induced by the nuclear receptor, PXR (Geick et al., 2001; Kast et al., 2002). Our analysis of a publically available ChIP-Seq dataset confirmed that ABCC2 has a PXR binding site within the promoter region. ABCB1 was not found to have a PXR binding site by our in silico ChIP-Seq analysis. PXR mediates at least part of the rifampin effects through direct binding to rifampin and nuclear localization (Stapelbroek et al., 2010; Honorat et al., 2011; Roques et al., 2013; Vilas-Boas et al., 2013; Weiss and Haefeli, 2013; Williamson et al., 2013). We likely did not identify the ABCB1 PXR binding site within the promoter region due to defining the promoter region using the common convention of ± 2 kilobases around the TSS. In Kast et al. (2002), the ABCB1 PXR binding site was over 7 kilobases from the TSS.
In the SLC family, the expression of 44 transporters were induced by rifampin. The most highly induced SLC transporter gene was the clinically relevant drug transporter SLC51B (OSTbeta; >12-fold), which is a newly recognized transporter that heterodimerizes with OST alpha and transports bile acids and conjugated steroids (Ballatori et al., 2013). For comparison, CYP3A4 was induced 22-fold (Ramamoorthy et al., 2013). We used a similar method of analyzing the data as Ramamoorthy et al., and with the same RNA-seq data set, CYP3A4 was induced 22-fold in our analysis as well. None of the SLC drug transporter genes (excluding SLCOs) have previously been shown to be induced by PXR or rifampin (Dixit et al., 2007). Our ChIP-Seq analysis identified that 33 SLC genes (Table 4 and Supplemental Table 7) had PXR binding sites. The two clinically relevant drug transporter SLC genes with a PXR binding peak identified in their promoter region were SLC29A1, and SLC47A1. The genes were induced by rifampin 1.38- and 1.37-fold (p < 0.05) respectively. SLC51B was not one of them. Although PXR and rifampin regulation of SLC transporters was mentioned in a review article (Ihunnah et al., 2011), we have been unable to find any published data supporting their statement for rifampin or PXR, but our ChIP-Seq analysis suggests that the rifampin induction of much of the SLC gene expression may be through other transcription factors (Rae et al., 2001; Hagenbuch and Meier, 2004).
In the SLCO family, two transporter genes (SLCO4C1 and SLCO2B1) were induced by rifampin; both are clinically relevant drug transporter genes. Neither of these SLCOs expressions have been previously shown to be altered by rifampin or PXR. Based on our ChIP-Seq data, SLCO2B1 has a PXR binding site in their promoter.
Overall, five of the 12 rifampin induced clinically relevant transporters have PXR binding sites by ChIP-Seq analysis. With an additional sixth gene, ABCB1, having a published report of a PXR binding site, half of the rifampin induction of the clinical relevant transporter gene expression in this study was likely in part due to PXR activation. Our data suggest that a smaller portion of the induction of all ABCs, SLCs, and SLCOs gene expressions by rifampin is through PXR.
Furthermore, rifampin also reduced the gene expression of three clinically relevant drug transporters (SLC15A1, SLC22A9, and SLCO1B3). Of these transporter, only SLCO1B3 expression has studies evaluating rifampin regulation of gene expression. SLCO1B3 gene expression was shown not to change in primary hepatocytes when subjected to similar conditions (24 h 10 μM rifampin treatment; Williamson et al., 2013). Hafner et al. (2011) showed no change in SLCO1B3 after 48 h of rifampicin treatment. After 72 h of rifampin, SLCO1B3 is only moderately elevated (Dixit et al., 2007). These studies and ours suggest that the length of exposure to rifampin likely changes the level of SLCO1B3 gene expression. Additionally, Williamson et al. (2013) also showed an inhibition of SLCO1B3 expression as the rifampin concentration increased from 0.5 to 10 μM. A possible mechanism of this initial inhibition may be an indirect induction of repressors that reduce drug transport gene expression through PXR (Zhou et al., 2006; Tojima et al., 2012; Sehirli et al., 2015; Zhang et al., 2015). Also, we must consider that rifampin is activating other transcription factors. Another possibility may be inhibition of drug transport gene expression through induction, possibly through PXR of miRNAs (Ramamoorthy et al., 2013).
MicroRNAs are potentially involved in the effect rifampin exerts on the expression of clinically relevant drug transporter genes. For example, four transporters genes were negatively correlated with rifampin-induced miRNA expression: SLC47A1/miR-95, SLC29A1/miR-30d#, SLC22A9/miR-202, and SLCO1B3/miR-92a (Table 3). Only SLCO1B3 and SLC22A9 gene expression were reduced after rifampin treatment. This was surprising because no seed binding sites were predicted for the rifampin-induced miRNAs in the 3′ UTRs of these transporter genes (data not shown). Possibly, gene reduction may occur through less well understood miRNA binding in other mRNA regions (e.g., coding and 5′ UTR regions; Clark et al., 2014).
Rifampin's ability to alter gene expression patterns also demonstrated tissue specificity. Since the kidney proximal tubules express transporters that may contribute to plasma drug concentrations, we chose to study a proximal kidney cell line to explore the effects of rifampin on clinically relevant drug transporter gene expression. We used human proximal tubular epithelial cells, NHPTK, because of the known role of the proximal tubules in organic cation, anion, and drug transport (Giacomini et al., 2010; Kido et al., 2011). This cell line closely resembles primary proximal tubular cells with a renal phenotype that includes, parathyroid hormone responsiveness, tight junction formation, and transporter expression and function (Wieser et al., 2008; Herbert et al., 2013). High levels of drug transporter mRNA expression was detected, but rifampin did not induce or reduce transporter expression in a significant manner. This finding is in agreement with prior studies evaluating rifampin effects on individual renal drug transporters expression. For example, rifampin did not lead to alterations in SLC22A2 expression in MDCK cells (Shu et al., 2001). Renal gene expression of NR1I2 (PXR) is minimal in contrast to levels observed in liver and intestine (Cheng and Klaassen, 2006). Although renal transporter expression did not increase with rifampin treatment, this is likely secondary to low intracellular PXR protein concentrations. PXR appears to be a major determinant for rifampin's tissue selective regulation of drug transporters.
Our study has several strengths. First, primary human hepatocytes serve as an in-vitro system to predict changes in gene expression patterns in the human liver. Second, RNA sequencing allowed us to characterize all of the clinically relevant drug transporter genes that are expressed in human liver. Third, this approach allowed us to determine relationships between the gene expression patterns of the clinically relevant drug transporters, drug metabolizing enzymes, and miRNAs. Lastly, our findings provide a blue print for future investigations exploring rifampin's regulation of the transporter function.
There are a few secondary issues of some importance worth addressing. This study also produced a wealth of data on transporters that are not yet known to be clinically relevant for drug transport. In fact, the vast majority of ABC and SLC family members have not yet been shown to be clinically relevant to drug transport. The SLC superfamily is of particular interest in drug therapeutics as it includes transporters for e.g., serotonin, norepinephrine, and glucose that are drug targets (Gether et al., 2006; David-Silva et al., 2013; Felts et al., 2014). SLC5A12 for instance is a sodium-coupled monocarboxylate transporter (SMCT-2) that regulates the lactic acid levels in the blood and has been linked to nicotine uptake (Ohkubo et al., 2012; Garnett et al., 2013); this gene was found in our study to be highly induced (>7-fold increase) by rifampin. Hence, our systematic characterization of transporter gene expression provides a more complete picture of the effects of rifampin on transporters at large. This information can inform the selection of gene targets for future mechanistic studies of transporter function.
Our study also has some limitations. Hepatocytes from only 7 different individuals is not sufficient to determine the population variability of the effects of rifampin. Using hepatocytes from seven donors for this study should identify the major transporters that are commonly regulated by rifampin (Kato et al., 2005); however, there may be some transporters that were not statistically significantly regulated by rifampin due to the low sample number, but are in fact regulated in some subpopulations of individuals. Another limitation is that the impact of genetic variation on expression levels was not taken into account. We also acknowledge that the fold-changes for the clinically relevant drug transporter gene expression were 1.18 to 1.85-fold. However, the levels of transporter mRNA expression have been highly correlated with their protein expression (when protein levels were analyzed by mass spectrometry; Ohtsuki et al., 2012; Lee et al., 2013). Also, these changes in expression levels represent a single time point, i.e., 24 h after rifampin treatment. Many of the correlations may not be direct, and represent inhibition of repressors or induction of co-activators. We also note that the ChIP-Seq dataset from HepG2 cells may not represent all of the PXR induction seen in primary hepatocytes, and limiting the promoter region to ± 2 kilobases around the TSS may have limited the detection of all PXR binding sites.
In conclusion we identified clinically relevant drug transporters exhibiting measurable changes that occur within a relatively short time period after treatment with rifampin. The coordinated changes of transporter expression by rifampin, and other potential inducing/repressing factors, may contribute to transporter-mediated drug-drug interactions. The rifampin-regulated transporters that we identified would be candidates for further investigations to understand the mechanisms (e.g., direct promoter regulation by PXR, indirect effects through miRNAs) involved in the up- and down-regulation of these transporters. Rifampin may serve as a representative ligand of many other PXR ligands (e.g., carbamazepine, St. John's Wort) may also cause effects on transporter expression similar to that of rifampin.
Author Contributions
Participated in research design: EB, TS, ME, ZD. Conducted experiments: EB, ME. Performed data analysis: EB, YL, HL, KB, MS, TS. Wrote or contributed to the writing of the manuscript: EB, ME, TS, ZD, AG, YL, KB, MS.
Conflict of Interest Statement
The authors declare that the research was conducted in the absence of any commercial or financial relationships that could be construed as a potential conflict of interest.
Acknowledgments
This work was supported by grants from the National Institutes of Health [Grant T32GM008425-19 (EB), RO1-GM088076 (ZD, YL, AG, TS)] and the PhRMA Foundation Clinical Pharmacology award (ME).
Supplementary Material
The Supplementary Material for this article can be found online at: http://journal.frontiersin.org/article/10.3389/fphar.2016.00111
References
Baciewicz, A. M., Chrisman, C. R., Finch, C. K., and Self, T. H. (2013). Update on rifampin, rifabutin, and rifapentine drug interactions. Curr. Med. Res. Opin. 29, 1–12. doi: 10.1185/03007995.2012.747952
Ballatori, N., Christian, W. V., Wheeler, S. G., and Hammond, C. L. (2013). The heteromeric organic solute transporter, OSTalpha-OSTbeta/SLC51: a transporter for steroid-derived molecules. Mol. Aspects Med. 34, 683–692. doi: 10.1016/j.mam.2012.11.005
Bang, C., and Thum, T. (2012). Novel non-coding RNA-based therapeutic approaches to prevent statin-induced liver damage. EMBO Mol. Med. 4, 863–865. doi: 10.1002/emmm.201201565
Cheng, X., and Klaassen, C. D. (2006). Regulation of mRNA expression of xenobiotic transporters by the pregnane x receptor in mouse liver, kidney, and intestine. Drug Metab. Dispos. 34, 1863–1867. doi: 10.1124/dmd.106.010520
Clark, P. M., Loher, P., Quann, K., Brody, J., Londin, E. R., and Rigoutsos, I. (2014). Argonaute CLIP-Seq reveals miRNA targetome diversity across tissue types. Sci. Rep. 4:5947. doi: 10.1038/srep05947
David-Silva, A., Freitas, H. S., Okamoto, M. M., Sabino-Silva, R., Schaan, B. D., and Machado, U. F. (2013). Hepatocyte nuclear factors 1α/4α and forkhead box A2 regulate the solute carrier 2A2 (Slc2a2) gene expression in the liver and kidney of diabetic rats. Life Sci. 93, 805–813. doi: 10.1016/j.lfs.2013.10.011
Dixit, V., Hariparsad, N., Li, F., Desai, P., Thummel, K. E., and Unadkat, J. D. (2007). Cytochrome P450 enzymes and transporters induced by anti-human immunodeficiency virus protease inhibitors in human hepatocytes: implications for predicting clinical drug interactions. Drug Metab. Dispos. 35, 1853–1859. doi: 10.1124/dmd.107.016089
Eadon, M. T., Wheeler, H. E., Stark, A. L., Zhang, X., Moen, E. L., Delaney, S. M., et al. (2013). Genetic and epigenetic variants contributing to clofarabine cytotoxicity. Hum. Mol. Genet. 22, 4007–4020. doi: 10.1093/hmg/ddt240
Felts, B., Pramod, A. B., Sandtner, W., Burbach, N., Bulling, S., Sitte, H. H., et al. (2014). The two Na+ sites in the human serotonin transporter play distinct roles in the ion coupling and electrogenicity of transport. J. Biol. Chem. 289, 1825–1840. doi: 10.1074/jbc.M113.504654
Garnett, J. P., Hickman, E., Tunkamnerdthai, O., Cuthbert, A. W., and Gray, M. A. (2013). Protein phosphatase 1 coordinates CFTR-dependent airway epithelial HCO3- secretion by reciprocal regulation of apical and basolateral membrane Cl(-)-HCO3- exchangers. Br. J. Pharmacol. 168, 1946–1960. doi: 10.1111/bph.12085
Geick, A., Eichelbaum, M., and Burk, O. (2001). Nuclear receptor response elements mediate induction of intestinal MDR1 by rifampin. J. Biol. Chem. 276, 14581–14587. doi: 10.1074/jbc.M010173200
Gerets, H. H., Tilmant, K., Gerin, B., Chanteux, H., Depelchin, B. O., Dhalluin, S., et al. (2012). Characterization of primary human hepatocytes, HepG2 cells, and HepaRG cells at the mRNA level and CYP activity in response to inducers and their predictivity for the detection of human hepatotoxins. Cell Biol. Toxicol. 28, 69–87. doi: 10.1007/s10565-011-9208-4
Gether, U., Andersen, P. H., Larsson, O. M., and Schousboe, A. (2006). Neurotransmitter transporters: molecular function of important drug targets. Trends Pharmacol. Sci. 27, 375–383. doi: 10.1016/j.tips.2006.05.003
Giacomini, K. M., Huang, S. M., Tweedie, D. J., Benet, L. Z., Brouwer, K. L., Chu, X., et al. (2010). Membrane transporters in drug development. Nat. Rev. Drug Discov. 9, 215–236. doi: 10.1038/nrd3028
Haenisch, S., Laechelt, S., Bruckmueller, H., Werk, A., Noack, A., Bruhn, O., et al. (2011). Down-regulation of ATP-binding cassette C2 protein expression in HepG2 cells after rifampicin treatment is mediated by microRNA-379. Mol. Pharmacol. 80, 314–320. doi: 10.1124/mol.110.070714
Hafner, M., Juvan, P., Rezen, T., Monostory, K., Pascussi, J. M., and Rozman, D. (2011). The human primary hepatocyte transcriptome reveals novel insights into atorvastatin and rosuvastatin action. Pharmacogenet. Genomics 21, 741–750. doi: 10.1097/FPC.0b013e32834a5585
Hagenbuch, B., and Meier, P. J. (2004). Organic anion transporting polypeptides of the OATP/ SLC21 family: phylogenetic classification as OATP/ SLCO superfamily, new nomenclature and molecular/functional properties. Pflugers Arch. 447, 653–665. doi: 10.1007/s00424-003-1168-y
Herbert, B. S., Grimes, B. R., Xu, W. M., Werner, M., Ward, C., Rossetti, S., et al. (2013). A telomerase immortalized human proximal tubule cell line with a truncation mutation (Q4004X) in polycystin-1. PLoS ONE 8:e55191. doi: 10.1371/journal.pone.0055191
Hillgren, K. M., Keppler, D., Zur, A. A., Giacomini, K. M., Stieger, B., Cass, C. E., et al. (2013). Emerging transporters of clinical importance: an update from the International Transporter Consortium. Clin. Pharmacol. Ther. 94, 52–63. doi: 10.1038/clpt.2013.74
Honorat, M., Mesnier, A., Vendrell, J., Di Pietro, A., Lin, V., Dumontet, C., et al. (2011). MRP8/ABCC11 expression is regulated by dexamethasone in breast cancer cells and is associated to progesterone receptor status in breast tumors. Int. J. Breast Cancer 2011, 807380. doi: 10.4061/2011/807380
Ihunnah, C. A., Jiang, M., and Xie, W. (2011). Nuclear receptor PXR, transcriptional circuits and metabolic relevance. Biochim. Biophys. Acta 1812, 956–963. doi: 10.1016/j.bbadis.2011.01.014
International Transporter, C., Giacomini, K. M., Huang, S. M., Tweedie, D. J., Benet, L. Z., Brouwer, K. L., et al. (2010). Membrane transporters in drug development. Nat. Rev. Drug Discov. 9, 215–236. doi: 10.1038/nrd3028
Kast, H. R., Goodwin, B., Tarr, P. T., Jones, S. A., Anisfeld, A. M., Stoltz, C. M., et al. (2002). Regulation of multidrug resistance-associated protein 2 (ABCC2) by the nuclear receptors pregnane X receptor, farnesoid X-activated receptor, and constitutive androstane receptor. J. Biol. Chem. 277, 2908–2915. doi: 10.1074/jbc.M109326200
Kato, M., Chiba, K., Horikawa, M., and Sugiyama, Y. (2005). The quantitative prediction of in vivo enzyme-induction caused by drug exposure from in vitro information on human hepatocytes. Drug Metab. Pharmacokinet. 20, 236–243. doi: 10.2133/dmpk.20.236
Kido, Y., Matsson, P., and Giacomini, K. M. (2011). Profiling of a prescription drug library for potential renal drug-drug interactions mediated by the organic cation transporter 2. J. Med. Chem. 54, 4548–4558. doi: 10.1021/jm2001629
Lee, N., Hebert, M. F., Prasad, B., Easterling, T. R., Kelly, E. J., Unadkat, J. D., et al. (2013). Effect of gestational age on mRNA and protein expression of polyspecific organic cation transporters during pregnancy. Drug Metab. Dispos. 41, 2225–2232. doi: 10.1124/dmd.113.054072
Mottino, A.-D. (2008). Hepatic drug transporters and nuclear receptors: regulation by therapeutic agents. World J. Gastroenterol. 14, 7068. doi: 10.3748/wjg.14.7068
Niemi, M., Backman, J. T., Fromm, M. F., Neuvonen, P. J., and Kivisto, K. T. (2003). Pharmacokinetic interactions with rifampicin: clinical relevance. Clin. Pharmacokinet. 42, 819–850. doi: 10.2165/00003088-200342090-00003
Nishimura, M., Yoshitsugu, H., Naito, S., and Hiraoka, I. (2002). Evaluation of gene induction of drug-metabolizing enzymes and transporters in primary culture of human hepatocytes using high-sensitivity real-time reverse transcription PCR. Yakugaku Zasshi 122, 339–361. doi: 10.1248/yakushi.122.339
Ohkubo, M., Ohta, K., Inoue, K., and Yuasa, H. (2012). Nicotinate Uptake by Two Kinetically Distinct Na+-Dependent Carrier-Mediated Transport Systems in the Rat Small Intestine. Drug Metab. Pharmacokinet. 27, 255–262. doi: 10.2133/dmpk.DMPK-11-RG-115
Ohtsuki, S., Schaefer, O., Kawakami, H., Inoue, T., Liehner, S., Saito, A., et al. (2012). Simultaneous absolute protein quantification of transporters, cytochromes P450, and UDP-glucuronosyltransferases as a novel approach for the characterization of individual human liver: comparison with mRNA levels and activities. Drug Metab. Dispos. 40, 83–92. doi: 10.1124/dmd.111.042259
Peters, J., Block, W., Oswald, S., Freyer, J., Grube, M., Kroemer, H. K., et al. (2011). Oral absorption of clarithromycin is nearly abolished by chronic comedication of rifampicin in foals. Drug Metab. Dispos. 39, 1643–1649. doi: 10.1124/dmd.111.039206
Rae, J. M., Johnson, M. D., Lippman, M. E., and Flockhart, D. A. (2001). Rifampin is a selective, pleiotropic inducer of drug metabolism genes in human hepatocytes: studies with cDNA and oligonucleotide expression arrays. J. Pharmacol. Exp. Ther. 299, 849–857.
Ramamoorthy, A., Liu, Y., Philips, S., Desta, Z., Lin, H., Goswami, C., et al. (2013). Regulation of microRNA expression by rifampin in human hepatocytes. Drug Metab. Dispos. 41, 1763–1768. doi: 10.1124/dmd.113.052886
Roques, B. B., Leghait, J., Lacroix, M. Z., Lasserre, F., Pineau, T., Viguie, C., et al. (2013). The nuclear receptors pregnane X receptor and constitutive androstane receptor contribute to the impact of fipronil on hepatic gene expression linked to thyroid hormone metabolism. Biochem. Pharmacol. 86, 997–1039. doi: 10.1016/j.bcp.2013.08.012
Sehirli, A. O., Cetinel, S., Ozkan, N., Selman, S., Tetik, S., Yuksel, M., et al. (2015). St. John's wort may ameliorate 2,4,6-trinitrobenzenesulfonic acid colitis off rats through the induction of pregnane X receptors and/or P-glycoproteins. J. Physiol. Pharmacol. 66, 203–214.
Shu, Y., Bello, C. L., Mangravite, L. M., Feng, B., and Giacomini, K. M. (2001). Functional characteristics and steroid hormone-mediated regulation of an organic cation transporter in Madin-Darby canine kidney cells. J. Pharmacol. Exp. Ther. 299, 392–398.
Smith, R. P., Eckalbar, W. L., Morrissey, K. M., Luizon, M. R., Hoffmann, T. J., Sun, X., et al. (2014). Genome-wide discovery of drug-dependent human liver regulatory elements. PLoS Genet. 10:e1004648. doi: 10.1371/journal.pgen.1004648
Stapelbroek, J. M., van Erpecum, K. J., Klomp, L. W., and Houwen, R. H. (2010). Liver disease associated with canalicular transport defects: current and future therapies. J. Hepatol. 52, 258–271. doi: 10.1016/j.jhep.2009.11.012
Teng, S., Jekerle, V., and Piquette-Miller, M. (2003). Induction of ABCC3 (MRP3) by pregnane X receptor activators. Drug Metab. Dispos. 31, 1296–1299. doi: 10.1124/dmd.31.11.1296
Tojima, H., Kakizaki, S., Yamazaki, Y., Takizawa, D., Horiguchi, N., Sato, K., et al. (2012). Ligand dependent hepatic gene expression profiles of nuclear receptors CAR and PXR. Toxicol. Lett. 212, 288–297. doi: 10.1016/j.toxlet.2012.06.001
Vilas-Boas, V., Silva, R., Palmeira, A., Sousa, E., Ferreira, L. M., Branco, P. S., et al. (2013). Development of novel rifampicin-derived P-glycoprotein activators/inducers. synthesis, in silico analysis and application in the RBE4 cell model, using paraquat as substrate. PLoS ONE 8:e74425. doi: 10.1371/journal.pone.0074425
Weiss, J., and Haefeli, W. E. (2013). Potential of the novel antiretroviral drug rilpivirine to modulate the expression and function of drug transporters and drug-metabolising enzymes in vitro. Int. J. Antimicrob. Agents 41, 484–487. doi: 10.1016/j.ijantimicag.2013.01.004
Wieser, M., Stadler, G., Jennings, P., Streubel, B., Pfaller, W., Ambros, P., et al. (2008). hTERT alone immortalizes epithelial cells of renal proximal tubules without changing their functional characteristics. Am. J. Physiol. Renal Physiol. 295, F1365–1375. doi: 10.1152/ajprenal.90405.2008
Williamson, B., Dooley, K. E., Zhang, Y., Back, D. J., and Owen, A. (2013). Induction of influx and efflux transporters and cytochrome P450 3A4 in primary human hepatocytes by rifampin, rifabutin, and rifapentine. Antimicrob. Agents Chemother. 57, 6366–6369. doi: 10.1128/AAC.01124-13
Zhang, S., Pan, X., and Jeong, H. (2015). GW4064, an agonist of farnesoid X receptor, represses CYP3A4 expression in human hepatocytes by inducing small heterodimer partner expression. Drug Metab. Dispos. 43, 743–748. doi: 10.1124/dmd.114.062836
Zhou, C., Tabb, M. M., Nelson, E. L., Grun, F., Verma, S., Sadatrafiei, A., et al. (2006). Mutual repression between steroid and xenobiotic receptor and NF-kappaB signaling pathways links xenobiotic metabolism and inflammation. J. Clin. Invest. 116, 2280–2289. doi: 10.1172/JCI26283
Keywords: rifampin, drug transporter, gene expression, microRNA, human hepatocyte, ChIP-Seq, PXR binding site, RNA sequencing
Citation: Benson EA, Eadon MT, Desta Z, Liu Y, Lin H, Burgess KS, Segar MW, Gaedigk A and Skaar TC (2016) Rifampin Regulation of Drug Transporters Gene Expression and the Association of MicroRNAs in Human Hepatocytes. Front. Pharmacol. 7:111. doi: 10.3389/fphar.2016.00111
Received: 27 January 2016; Accepted: 12 April 2016;
Published: 26 April 2016.
Edited by:
Olavi R. Pelkonen, University of Oulu, FinlandReviewed by:
Paavo Honkakoski, University of Eastern Finland, FinlandAmal Kaddoumi, University of Louisiana at Monroe, USA
Copyright © 2016 Benson, Eadon, Desta, Liu, Lin, Burgess, Segar, Gaedigk and Skaar. This is an open-access article distributed under the terms of the Creative Commons Attribution License (CC BY). The use, distribution or reproduction in other forums is permitted, provided the original author(s) or licensor are credited and that the original publication in this journal is cited, in accordance with accepted academic practice. No use, distribution or reproduction is permitted which does not comply with these terms.
*Correspondence: Eric A. Benson, eabenson@iu.edu