Linear field demagnetization of artificial magnetic square ice
 Jason P. Morgan
 Alexander Bellew1
  Aaron Stein
 Sean Langridge
 Christopher H. Marrows
- 1School of Physics and Astronomy, University of Leeds, Leeds, UK
- 2Department of Physics, University of Cambridge, Cambridge, UK
- 3Center for Functional Nanomaterials, Brookhaven National Laboratory, Upton, NY, USA
- 4ISIS, STFC Rutherford Appleton Laboratory, Didcot, UK
We have studied experimentally the states formed in artificial square ice nanomagnet systems following demagnetization in a rotating in-plane applied magnetic field that reduces to zero in a manner that is linear in time. The final states are found to be controlled via the system's lattice constant, which determines the strength of the magnetostatic interactions between the elements, as well as the field ramping rate. We understand these effects as a requirement that the system undergoes a sufficiently large number of active rotations within the critical field window in which elements may be reversed, such that the interactions are allowed to locally exert their influence if the ground state is to be approached. On the other hand, if quenched disorder is too strong when compared to the interaction strength, any close approach to the ground state is impossible. These results show that it is not necessary for there to be any ac component to the field amplitude that is applied to the system during demagnetization, which is the method almost exclusively employed in field protocols reported to date. Furthermore, by optimizing the parameters of our linear demagnetization protocol, the largest field-generated ground state domains yet reported are found.
1. Introduction
Artificial spin ices are patterned nanomagnet arrays designed to act as analogs of bulk geometrically frustrated materials [1, 2]. They realize two-dimensional (2D) Ising and vertex ice models [3–5], in which each single domain element forms an anisotropic macrospin which can be directly imaged via magnetic microscopy. As they are built via nanolithography and thin film deposition, it is possible to engineer system parameters such as lattice geometry [6], inter-elemental dipolar coupling strength [2, 3], moment switching behavior [7], and (to an extent) quenched disorder (QD) [3, 8]. They have hence presented a family of systems in which to explore a myriad of phenomena, such as collective ordering, competing interactions, and fractionalization [9–13].
Naturally, ground state (GS) access has been a prominent area of interest [14, 15]: one wishes to know whether or not a system behaves as designed. Furthermore, the square ice GS, shown in Figure 1A, provides a background for energetically well-defined magnetic charge defects [16, 17], hence the reliable generation of GS order could lead to studies of defect creation and manipulation. More generally, the repeatable experimental access of well-defined states is of its own interest and is further complementary to numerous current studies, e.g., of ferromagnetic resonance in nanopatterned magnetic structures [18–20] and numerical simulations of ordering processes [21–25].
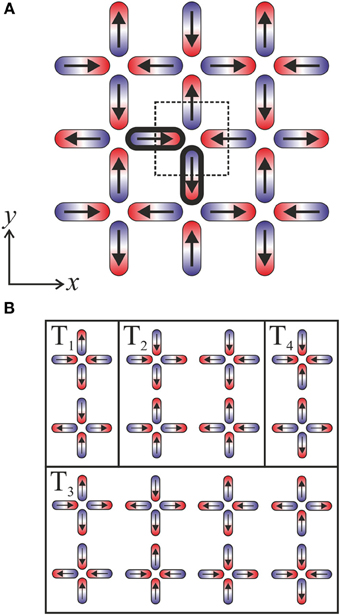
Figure 1. (A) The square ice ground state. Each magnetic nano-element possesses an Ising-like moment, as indicated by arrows. The dashed box indicates a structural unit cell (with lattice constant a) containing a single vertex, which possesses an area of a2. An example of a pair of 1st nearest neighbor moments is emboldened. Cartesian axes are also defined with reference to the sample frame. (B) The 16 vertex model of square ice. Vertices can be arranged into four types Ti in order of increasing energy, i = 1–4, respectively.
Until recently [26–28] the most successful route to GS ordering in square ice involved the thermalization of NiFe islands during early stages of material deposition when the moment volumes were small [3, 17]. As their thickness increased, thermal dynamics of the macrospin lattice slowed down and ultimately blocked, locking-in order [29, 30]. Applied fields are hence required to promote any subsequent reconfiguration of such frozen systems following this single-shot anneal.
Rotating field protocols have proved a reliable and repeatable method for experimentally controlling magnetic states via “effective thermodynamics” [4]. Whilst ac field profiles were reported as superior [31], only short range GS correlations could be produced in quasi-infinite patterns [2, 14]. Although this is the most commonly employed protocol, the parameter space is large and has not been extensively and systematically explored. Constant magnitude rotating fields have recently helped elucidate reconfiguration processes at work during such protocols [22, 32] and emphasize the crucial influence of QD [23, 33, 34]: unlike the Ising systems they mimic, such patterned systems possess an intrinsic distribution of macrospin properties due to unavoidable random variations imparted by the fabrication processes employed. Non-rotating fields have also generated varying amounts of GS order [35, 36]. For all field profiles, a critical window exists in which non-trivial dynamics are allowed, defined by the interplay between QD and dipolar coupling.
Here we apply a simple rotating linearly-decreasing field protocol to square ice systems similar to those discussed. Results of such a protocol have been previously reported, but not in extensive detail [31]. Using magnetic force microscopy (MFM), we look in detail at the effects of varying both the system's lattice constant and the protocol ramping rate on the magnetic states achieved. We observe effective control of GS ordering strength without the need for an oscillating field and produce the strongest GS order yet reported for field-driven dynamics.
2. Materials and Methods
2.1. Sample Fabrication and Field Protocol
Samples were fabricated by electron beam lithography using a JEOL 6300 system and evaporative metallization, as described previously [17]. Elements were 86 nm by 280 nm in area, possessing a thin film structure of Ti(3 nm)/NiFe(26 nm)/Al(2.5 nm). Each element forms a single domain anisotropic macrospin, with a bistable dipolar moment. Samples each spanned total areas of 2.5 mm × 2.5 mm. Two sample batches were studied: batch 1 consisted of five arrays with lattice constants of a = 500 nm to 900 nm in steps of 100 nm, and batch 2 consisted of two arrays with a = 400 nm and 500 nm.
Magnetic states were prepared by the application of an in-plane magnetic field of magnitude Ha which decreased in a linear fashion from ≈ 1300 Oe to 0 Oe, at a rate , whilst the sample rotated around an axis normal to the sample plane at close to f = 42 Hz. A schematic of the protocol as well as an example of an experimentally measured field profile are shown in Figure 2. As for previous studies [2, 21], this protocol operates within a regime in which the micromagnetic response of the system's constituent nano elements to the time-varying field they experience is expected to occur on time scales significantly faster than the utilized rotational period, hence the dynamic response of an island's magnetization occurs effectively instantaneously. For clarity, note that the following results will be discussed from the sample reference frame. Such a protocol ensures states are initially reset with each application, with bulk array coercive fields of Hc ≈ 600 Oe, and a switching window of ≈ 100 Oe (hysteresis measurements for the a = 500 nm sample of batch 1 have previously been presented [37]; such values are typical for nanomagnets of the dimensions used here [21, 31] and vary little with a [38]). These values are also indicated in Figure 2. Magnetic states were imaged using MFM over ~5 evenly spaced areas each of ≈13 μm ×13 μm. Our images are colored (using the WSxM software [39]) such that each nanomagnet appears as a dumbbell of red and blue contrast, as drawn in Figure 1, indicating the north and south magnetic poles, respectively, allowing moment configurations to be fully inferred. Unless stated otherwise, statistical error bars presented are calculated as the standard error over the collection of images for a given sample and field protocol realization.
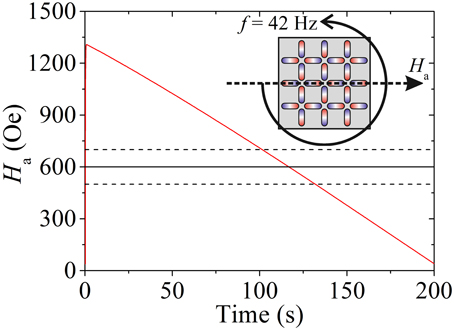
Figure 2. Applied field protocol example. (Inset) A sample is rotated about an out-of-plane axis at f = 42 Hz whilst and in-plane field Ha is applied. Ha is ramped down from 1300 to 0 Oe in a linear fashion, as shown in the main plot for a ramping rate of r = 6 Oe/s (red solid line). The black solid line indicates the coercive field of such samples, Hc ≈ 600 Oe, and the dashed black lines indicate the estimated intrinsic macrospin switching field distribution width of ≈ ± 100 Oe centered about Hc.
2.2. Vertex Model Interpretation
The square ice system is well-described by a 16 vertex model, Figure 1B. Four degenerate configuration types can be formed by the four moments converging at a vertex, Ti for i = 1–4 in order of increasing energy [2]. The GS is defined by a chess-board tiling of T1 vertices, Figure 1, which, crucially, is twofold degenerate. This state presents a background for well-defined magnetic chain defects consisting of magnetically charged “monopole” excitations in the form of T3,4 vertices, which possess an excess of north or south polarity, connected by energetic strings of T2 vertices. Such chain defects can exist as isolated excitations flipped out of the GS background [40], or as part of domain wall structure separating two continuous regions of opposite GS phase [3, 17, 32]. Whilst both T1,2 obey the 2-in/2-out ice rules, they are energetically split by the square ice geometry.
3. Results
3.1. Magnetic States vs. Lattice Constant
Figure 3 shows a series of MFM images of states prepared for r = 6 Oe/s, with a shown in each case. For clarity, regions continuously tiled with T1 vertices are boxed and tinted red or blue, indicating whether they belong to one possible GS phase or the other. What is immediately apparent is the variety of states achieved. For largest a, states appear magnetically disordered. As a decreases, small GS-ordered regions emerge, becoming clear to the eye at a = 700 nm, existing within a disordered-looking matrix of higher energy vertices. By a = 500 nm, the order is typified by sizeable continuous GS domains spanning many vertices and separated by narrow domain wall structures the width of a single vertex, much like those observed following thermal ordering [3, 17, 26–29, 32] and in square ice simulations [24]. For a = 400 nm, these features are only enhanced. Here interaction strength is being varied against a close-to-constant intrinsic island property distribution (assuming little variation in patterning as a is changed).
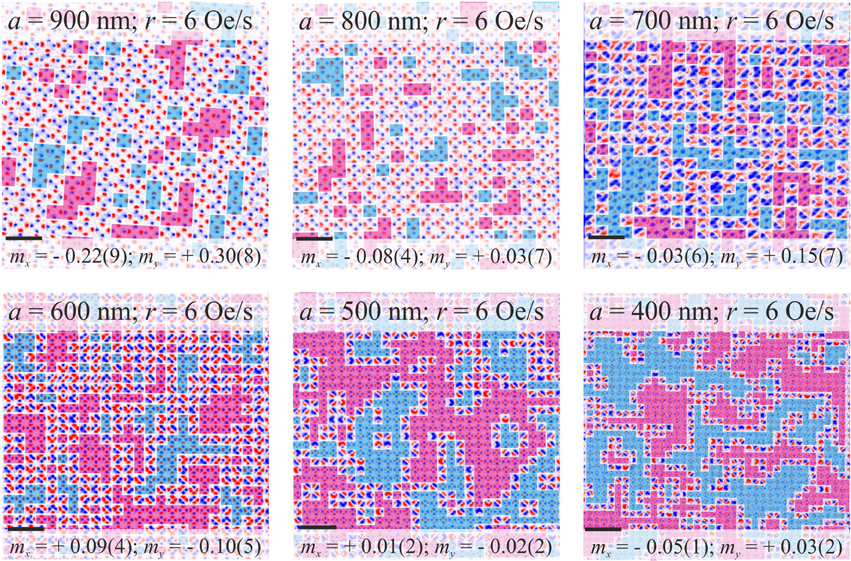
Figure 3. MFM images of square ice states prepared by a linearly decreasing rotating in-plane field. Scale bars represent 2 μm. Samples were rotated at f = 42 Hz, and the field was ramped down at r = 6 Oe/s. As the lattice constant decreases from a = 900 nm to 400 nm, strong ground state order emerges in the form of well-defined domains, which are boxed and tinted red or blue to indicate the two GS phases. The normalized digital magnetization components mx, y are quoted and standard errors are expressed in brackets at their corresponding significant figures. Note, all images are of samples from batch 1 except for a = 400 nm.
Also quoted in Figure 3 are the normalized digital magnetization components mx, y along the respective x−, y−directions as defined in Figure 1A. Here we assume identical point Ising dipoles. Previous discussion of a similar linear protocol reported a large variation in the net magnetization of states achieved for similar samples and protocol parameters, however, this observation was never explained or understood [31]. Here we observe a tendency for demagnetization to improve as a decreases, attributable to stronger interactions promoting the formation of zero-moment T1 vertices.
Figure 4 shows the corresponding vertex type populations, ni for i = 1–4, as a function of a. Populations are non-random over all a, as ni are not given by their multiplicities qi, plotted as dashed lines in Figure 4A. Throughout this series, vertex populations mainly shift from n3 to n1, being respectively, equal to 0.36 ± 0.01 and 0.24 ± 0.02 for a = 900 nm, and 0.073 ± 0.003 and 0.628 ± 0.009 for a = 400 nm. n2,4 stay approximately constant at n2 ≈ 0.33 and n4 ≈ 0. It is clear that the observed behavior with a is qualitatively similar to that of thermally annealed square ice systems: the GS domains are comparable in form [3, 41]. Furthermore, the data for a = 400 nm shows the strongest GS order yet reported following field-driven dynamics.
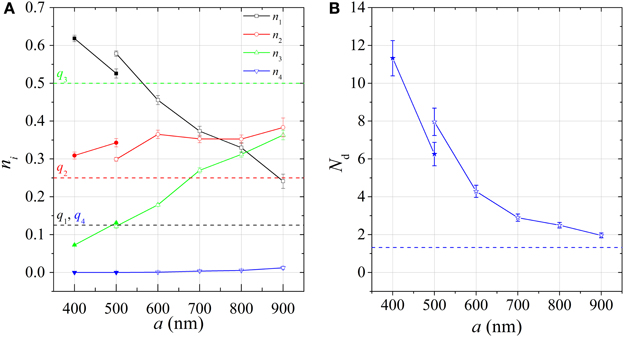
Figure 4. (A) Vertex populations ni for i = 1–4 vs. lattice constant a. Dashed lines represent the corresponding random-state values, as given by multiplicities qi. (B) The corresponding mean areal domain size Nd. Data points for batch 1(2) are open(filled).
The maximum n1 population yet reported following ac demagnetization of quasi-infinite square ice is 0.35 [2]. Whilst the ac demagnetization protocol was further optimized in later studies [14], this work addressed exclusively pairwise correlation between elemental magnetizations. If a correlator C is defined as ±1 depending on whether two first-nearest-neighbor elements (as illustrated in Figure 1A) are favorably or unfavorably aligned, respectively, at a = 400 nm we find a value of 〈C〉 = 0.618 ± 0.009, averaged over all such pairs imaged. This compares with roughly 0.5 ± 0.02 for the previously reported ac demagnetization study [14]. Furthermore, whilst rotating and non-rotating field demagnetization experiments on finite area square ice patterns have also been shown to generate significant n1 populations [21, 35, 42], finite size edge effects are expected to have played a significant role in the onset of coherent ordering [22], which will be absent from our “bulk” measurements.
For completeness, note that our two a = 500 nm samples possess similar statistics, however, they are statistically distinct, indicating the subtle difference between sample batches as mentioned in previous reports [17]. The protocol was also repeated two or three times for each sample, yielding consistent results (not shown in Figure 4 for clarity).
To directly characterize the observed domain structure, we define the normalized mean areal domain size, Nd, as the average number of T1 vertices in continuous contact within a domain (calculated cumulatively over all MFM images for a given parameter set, along with a standard error). A vertex contributes a unit area a2 to a domain, as shown by a box in Figure 1A. Shown in Figure 4B, Nd steadily increases from 1.9 ± 0.1 at a = 900 nm to 11.3 ± 0.9 at a = 400 nm. The value of Nd for a random state equals 1.32 to 3 significant figure, as indicated in Figure 4B by a dotted line, which would be expected for a demagnetized non-interacting system in the limit of a → ∞ (This was calculated by averaging the statistics of pseudo-randomly generated square ice states, 200 × 200 vertices in size, over 30,000 realizations). Note, we follow recent studies of dipole domains in nanomagnet arrays [5], neglecting the finite field of view in the calculation, which will act to reduce the measured size of edge-straddling domains. While our domains could be interpreted in terms of dipoles which belong to either phase of the GS, the vertex picture is more appealing as the T1 vertex is the natural object of interest in this study.
It is interesting to consider the means by which the observed order should form during the field protocol. The evolution of order will be governed by whether or not the net local field experienced by a given macrospin overcomes its intrinsic switching barrier as Ha evolves in time. This is indeed a non-trivial many-body problem requiring the attention of simulations or “real-time” microscopy studies, beyond the scope of our present report. Despite this, we can make general inferences based on the state-of-the-art. As we will discuss, this is a problem involving the balance of three magnetic field scales defined by interaction strength (controlled by a), QD, and r.
Two trivial field regimes must exist: one where Ha is so large that all macrospins track it, the other where Ha is too low to allow any dynamics at all. In the crossover between these two regimes the non-trivial regime of interest exists, both interactions and QD influencing its width. This region is illustrated in the plot of Figure 2. The most influential interaction is that between first nearest neighbors, as indicated in Figure 1A. The field strength H1 can be calculated assuming point Ising dipoles with moments μ = VMs, a prismatic volume V and the saturation magnetization of NiFe Ms = 860 × 103 A/m. H1 varies from ≈ 40 to 4 Oe as a increases from 400 to 900 nm, respectively. For QD, recently a width σ = 1.25H1 was estimated for a Gaussian distribution of intrinsic switching fields in similar patterns with a = 400 nm [21], hence σ ≈ 50 Oe. This estimation is expected to be representative of all a studied, as similarly fabricated patterns studied by MOKE magnetometry were reported to show little variation in the width of the field range over which their net magentizations reversed as a function of a [38], implying that extrinsic perturbations to magnetic reversal of the constituent nanoelements, such as pairwise interaction disorder, are a much lesser contribution to this width.
In dc field reversal, a picture of propagation of defected vertices across a background state via the sequential flipping of underlying moments is often invoked [12, 35, 36, 43]. In our protocol, we can consider there to be a background of “loose” spins which track the field. As Ha drops through the critical field window, increasing numbers of moments will lock out due to local stabilization. Initial nucleation of order will occur at random sites defined by QD. Correlated order can then form around such nucleation sites due to dipolar interactions. Simulations have showed that at optimal values of Ha spin flip dynamics increment every 1/4 turn in constant-magnitude rotating field protocols [21, 22], proceeding via the creation, propagation and annihilation of oppositely charged T3 vertex pairs, and the same is anticipated for our linearly decreasing field profile. The field step every 1/4 turn, ΔHa, is hence a third relevant scale, influencing which moments might or might not freeze. For r = 6 Oe/s and f = 42 Hz, ΔHa = 0.036 Oe. Tuning r is hence expected to be a means of controlling the order in a given sample, crudely defining an “annealing time.”
3.2. Magnetic States vs. Field Ramping Rate
To further study these ideas we explore the effects of parameter r on the states formed. We test this for two samples from batch 1, the densest and sparsest patterns, with a = 500 nm and 900 nm, respectively. The crucial difference between these two samples is the interaction strength. Both should, however, possess a similar intrinsic distribution of moment properties, hence, the effects of QD should be much more prominent for the latter sample, in which interelemental coupling is relatively weaker. Rates of r = 0.3 Oe/s, 3 Oe/s, 6 Oe/s, 60 Oe/s, 300 Oe/s, and 600 Oe/s were used.
Figure 5 shows MFM images for a selection of four values of r for the a = 500 nm sample, and two images for the a = 900 nm sample with smallest and largest r, respectively. All states were found to be adequately demagnetized, as quoted, with a consistently higher moment for a = 900 nm. Again, a shorter a has resulted in better demagnetization. Figure 6 shows (A) ni and (B) Nd for both samples.
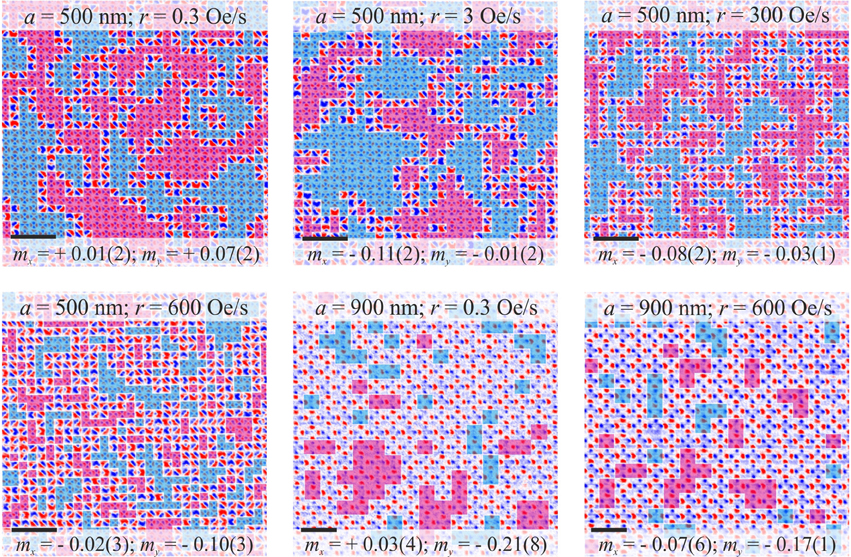
Figure 5. MFM image series of square ice states for varying ramping rates r for the a = 500 nm and a = 900 nm samples of batch 1 (as quoted). Scale bars represent 2 μm. The two GS phases are indicated by boxes tinted red or blue. For a = 500 nm, decreasing r enhances the formation of GS-ordered domains, whilst increasing r promotes more disorder and T2,3 vertices. For a = 900 nm, little variation is observed with r, indicating the relative strength of QD in the system.
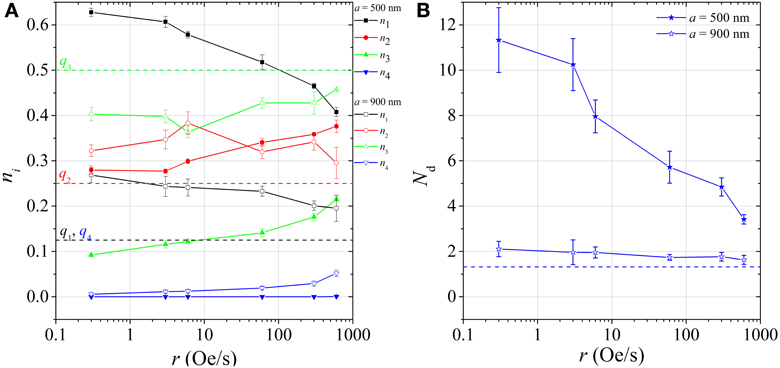
Figure 6. (A) Vertex populations ni vs. ramping rate r for samples with a = 500 nm (filled symbols) and a = 900 nm (open symbols). (B) The corresponding average domain size Nd. Dashed lines represent the limiting random-state values.
For r = 0.3 Oe/s and a = 500 nm, the strongest GS order and largest average domain size are observed, again with narrow domain walls. Here n1 = 0.62 ± 0.09 and Nd = 11.3 ± 1.4 vertices (statistically similar to the state of a = 400 nm and r = 6 Oe/s discussed previously). As r is increased, the domains shrink in size. Whilst continuous T1 domains are never fully suppressed to a random-state size, a messy matrix of T2,3 structure develops by r ≈ 600 Oe/s. Here, n1 = 0.41 ± 0.01 and Nd = 3.4 ± 0.2.
This observation is consistent with the picture that more active rotations within the critical field window allows for increased incremental propagation of T3 vertices, which has allowed them to travel further and find opposite charges with which to annihilate, increasingly forming coherent GS domains in their wake. Once domains are established, they may further evolve or coarsen by motion and annihilation of T3 vertices along their walls [23, 32]. As r increases, there is less opportunity for T3 vertices to travel before becoming trapped by the decreasing of Ha. Interactions are still clearly important at r = 600 Oe/s, as few T4 vertices are found, however, the system is simply not active for long enough to allow for strong GS order formation. This state is not dissimilar to the a = 600 nm and 700 nm states for r = 6 Oe/s discussed previously. Tuning ΔHa appears to influence the extent to which interactions can generate correlated GS order.
For the a = 900 nm sample only very weak effects are observed. For all r, GS order is weak. Whilst there is some evidence of GS order enhancement on reducing r, this is far from conclusive. At r = 600 Oe/s, ΔHa = 3.6 Oe which is ≈ H1(a = 900 nm) hence local variations in field due to interactions may not be allowed to play a significant role in ordering. Interactions are, however, not irrelevant as n4 is suppressed for all values of r. Below r = 6 Oe/s, even though ΔHa « H1, QD must dominate the behavior via the local variation in macrospin properties as σ » H1. The effect of QD can be emphasized by comparing states for parameters sets (a = 500 nm and r = 3 Oe/s) and (a = 900 nm and r = 0.3 Oe/s). ΔHa/H1 are very similar in these two cases, however, the final states achieved are clearly very different. Neither state is random, however, the relative scale of QD is much greater in the latter.
It is further interesting to compare these results with previous reports of ac demagnetized square ice states. It was reported that ac demagnetization was notably superior to linearly ramped field demagnetization [31], despite few details of state statistics being given. Here, using a linear field, we report a closer approach to the GS than those reported for ac demagnetization [2, 3, 14]. Whilst this at first appears to be contradictory, this can also be understood by considering the effects of QD. The samples used in our current study which have the strongest GS order possess less QD relative to the interaction strength, meaning that stronger coherent ordering has been allowed. Evidence for this can be found by comparing various electron microscopy images of experimental square ice patterns previously reported [41, 44].
4. Discussion
To conclude, this rotating linearly-ramped applied field protocol has been shown to produce effective and repeatable formation of GS ordered domains in square ice systems. It is simpler to implement than the ac rotational demagnetization method [31], but can yield superior results in terms of approaching the GS.
Whilst field-driven demagnetization is not as effective at larger a, we have shown here that the field ramping rate is crucial, which determines how many active rotations a system undergoes whilst the applied field lies within a critical dynamical window. Whilst this is also true of ac field profiles applied to rotating systems, an oscillation of the applied field (as observed in the laboratory reference frame) is unnecessary in forming well-demagnetized states possessing strong GS-order. The extent of GS domains, as quantified by an average GS domain size, is the strongest yet achieved by field-driving reported in experimental literature, attributable to a significant degree to sufficiently high ratio of interaction strength to QD.
The observed tuning of domain structure in the final states achieved by relative levels of QD is consistent with the results of numerical simulations [24]. Finding a means of influencing the levels of QD present [3, 8] is hence important for future studies of field- and thermally-driven systems. Further work is needed to better compare the various protocols employed, and understand the subtle difference between their driven dynamics. This can be further supported by numerical simulations, to understand how final states and “effective equilibrium” are approached.
Further work could also involve studies of the effects of field profile parameters, as well as the synchronization of field step with sample rotation. Furthermore, in our samples, the domain size is large enough and the domain walls are narrow enough to further study how GS ordered regions and defects respond to applied fields.
Author Contributions
The experiments were designed by Jason P. Morgan. Experimental measurements were conducted by Alexander Bellew. Data analysis was conducted by Jason P. Morgan and Alexander Bellew. Sample fabrication was conducted by Jason P. Morgan and Aaron Stein. The manuscript was written by Jason P. Morgan and Christopher H. Marrows. The work was supervised by Jason P. Morgan, Sean Langridge, and Christopher H. Marrows.
Conflict of Interest Statement
The authors declare that the research was conducted in the absence of any commercial or financial relationships that could be construed as a potential conflict of interest.
Acknowledgments
Funding: The authors thank the UK EPSRC, the STFC Centre for Material Physics and Chemistry, the Nuffield Foundation and the Institute of Physics for financial support. Research was carried out in part at the Center for Functional Nanomaterials, Brookhaven National Laboratory, which is supported by the U.S. Department of Energy, Office of Basic Energy Sciences, under Contract No. DE-AC02-98CH10886.
References
1. Tanaka M, Saitoh E, Miyajima H, Yamaoka T, Iye, Y. Magnetic interactions in a ferromagnetic honeycomb nanoscale network. Phys Rev B (2006) 73:052411. doi: 10.1103/PhysRevB.73.052411
2. Wang RF, Nisoli C, Freitas RS, Li J, McConville W, Cooley BJ, et al. Artificial ‘spin ice’ in a geometrically frustrated lattice of nanoscale ferromagnetic islands. Nature (2006) 439:303–6. doi: 10.1038/nature04447
3. Morgan JP, Akerman J, Stein A, Phatak C, Evans RML, Langridge S, et al. Real and effective thermal equilibrium in artificial square spin ices. Phys Rev B (2013) 87:024405. doi: 10.1103/PhysRevB.87.024405
4. Nisoli C, Li J, Ke X, Garand D, Schiffer P, Crespi VH. Effective temperature in an interacting vertex system: theory and experiment on artificial spin ice. Phys Rev Lett. (2010) 105:047205. doi: 10.1103/PhysRevLett.105.047205
5. Zhang S, Li J, Gilbert I, Bartell J, Erickson MJ, Pan Y, et al. Perpendicular magnetization and generic realization of the Ising model in artificial spin ice. Phys Rev Lett. (2012) 109:087201. doi: 10.1103/PhysRevLett.109.087201
6. Li J, Ke X, Zhang S, Garand D, Nisoli C, Lammert P, et al. Comparing artificial frustrated magnets by tuning the symmetry of nanoscale permalloy arrays. Phys Rev B (2010) 81:092406. doi: 10.1103/PhysRevB.81.092406
7. Wysin GM, Moura-Melo WA, Mól LAS, and Pereira, AR. Magnetic anisotropy of elongated thin ferromagnetic nano-islands for artificial spin ice arrays. J Phys Condens Matt. (2012) 24:296001. doi: 10.1088/0953-8984/24/29/296001
8. Daunheimer S, Petrova O, Tchernyshyov O, Cumings, J. Reducing disorder in artificial kagome ice. Phys Rev Lett. (2011) 107:167201. doi: 10.1103/PhysRevLett.107.167201
9. Branford WR, Ladak S, Read DE, Zeissler K, Cohen, LF. Emerging chirality in artificial spin ice. Science (2012) 335:1597–600. doi: 10.1126/science.1211379
10. Braun HB. Topological effects in nanomagnetism: from superparamagnetism to chiral quantum solitons. Adv. Phys. (2012) 61:1. doi: 10.1080/00018732.2012.663070
11. Farhan A, Derlet PM, Kleibert A, Balan A, Chopdekar RV, Wyss M, et al. Exploring hyper-cubic energy landscapes in thermally active finite spin-ice systems. Nat Phys. (2013) 9:375–82. doi: 10.1038/nphys2613
12. Mengotti E, Heyderman LJ, Fraile Rodríguez A, Nolting F, Hügli RV, Braun HB. Real-space observation of emergent magnetic monopoles and associated Dirac strings in artificial kagome spin ice. Nat Phys. (2011) 7:68–74. doi: 10.1038/nphys1794
13. Möller G, Moessner, R. Artificial square ice and related dipolar nanoarrays. Phys Rev. Lett. (2006) 96:237202. doi: 10.1103/PhysRevLett.96.237202
14. Ke X, Li J, Nisoli C, Lammert PE, McConville W, Wang RF, et al. Energy minimization and ac demagnetization in a nanomagnet array. Phys Rev Lett. (2008) 101:037205. doi: 10.1103/PhysRevLett.101.037205
15. Qi Y, Brintlinger T, Cumings, J. Direct observation of the ice rule in an artificial kagome spin ice. Phys Rev B (2008) 77:094418. doi: 10.1103/PhysRevB.77.094418
16. Mól LA, Moura-Melo WA, Pereira AR. Conditions for free magnetic monopoles in synthetic square ice dipolar nanoarrays. Phys Rev B (2010) 82:054434. doi: 10.1103/PhysRevB.82.054434
17. Morgan JP, Stein A, Langridge S, Marrows, CH. Thermal ground state ordering and elementary excitations in artificial magnetic square ice. Nat Phys. (2011) 7:75–9. doi: 10.1038/nphys1853
18. Gliga S, Kákay A, Hertel R, Heinonen OG. Spectral analysis of topological defects in an artificial spin-ice lattice. Phys Rev Lett. (2013) 110:117205. doi: 10.1103/PhysRevLett.110.117205
19. Sklenar J, Bhat VS, DeLong LE, and Ketterson JB. Broadband ferromagnetic resonance studies on an artificial square spin-ice island array. J Appl Phys. (2013) 113:17B530. doi: 10.1063/1.4800740
20. Verba R, Melkov G, Tiberkevich V, Slavin, A. Fast switching of a ground state of a reconfigurable array of magnetic nano-dots. Appl Phys Lett. (2012) 100:192412. doi: 10.1063/1.4714772
21. Budrikis Z, Morgan JP, Akerman J, Stein A, Politi P, Langridge S, et al. Disorder strength and field-driven ground state domain formation in artificial spin ice: experiment, simulation and theory. Phys Rev Lett. (2012) 109:037203. doi: 10.1103/PhysRevLett.109.037203
22. Budrikis Z, Politi P, Stamps, RL. Vertex dynamics in finite two-dimensional square spin ices. Phys Rev Lett. (2010) 105:017201. doi: 10.1103/PhysRevLett.105.017201
23. Libál A, Reichhardt C, Reichhardt, CJO. Hysteresis and return-point memory in colloidal artificial spin ice system. Phys Rev E (2012) 86:021406. doi: 10.1103/PhysRevE.86.021406
24. Libál A, Reichhardt CJO, Reichhardt, C. Creating artificial ice states using vortices in nanostructured superconductors. Phys Rev Lett. (2009) 102:237004. doi: 10.1103/PhysRevLett.102.237004
25. Reichhardt, CJO, Libál A, Reichhardt, C. Multi-step ordering in kagome and square artificial spin ice. New J Phys. (2012) 14:025006. doi: 10.1088/1367-2630/14/2/025006
26. Farhan A, Derlet PM, Kleibert A, Balan A, Chopdekar RV, Wyss M, et al. Direct observation of thermal relaxation in artificial spin ice. Phys Rev Lett. (2013) 111:057204. doi: 10.1103/PhysRevLett.111.057204
27. Porro JM, Bedoya-Pinto A, Berger A, Vavassori, P. Exploring thermally induced states in square artificial spin-ice arrays. New J Phys. (2013) 15:055012. doi: 10.1088/1367-2630/15/5/055012
28. Zhang S, Gilbert I, Nisoli C, Chern, G. -W., Erickson MJ, O'Brien L, et al. Crystallites of magnetic charges in artificial spin ice. Nature (2013) 500:553–7. doi: 10.1038/nature12399
29. Greaves SJ, Muraoka, H. Formation of thermally induced ground states in two-dimensional square spin ices. J Appl Phys. (2012) 112:043909. doi: 10.1063/1.4747910
30. Nisoli, C. On thermalization of magnetic nano-arrays at fabrication. New J Phys. (2012) 14:035017. doi: 10.1088/1367-2630/14/3/035017
31. Wang RF, Li J, McConville W, Nisoli C, Ke X, Freeland JW, et al. Demagnetization protocols for frustrated interacting nanomagnet arrays. J Appl Phys. (2007) 101:09J104. doi: 10.1063/1.2712528
32. Budrikis Z, Livesey K, Morgan JP, Akerman J, Stein A, Langridge S, et al. Domain dynamics and fluctuations in artificial square ice at finite temperatures. New J Phys. (2012) 14:035014. doi: 10.1088/1367-2630/14/3/035014
33. Davidović, D, Kumar S, Reich DH, Siegel J, Field SB, Tiberio RC, et al. Correlations and disorder in arrays of magnetically coupled superconducting rings. Phys Rev Lett. (1996) 76:815–8. doi: 10.1103/PhysRevLett.76.815
34. Davidović, D, Kumar S, Reich DH, Siegel J, Field SB, Tiberio RC, et al. Magnetic correlations, geometrical frustration, and tunable disorder in arrays of superconducting rings. Phys Rev B (1997) 55:6518–40. doi: 10.1103/PhysRevB.55.6518
35. Phatak C, Pan M, Petford-Long AK, Hong S, De Graef, M. Magnetic interactions and reversal of artificial square spin ices. New J Phys. (2012) 14:075028. doi: 10.1088/1367-2630/14/7/075028
36. Pollard SD, Volvok V, Zhu, Y. Propagation of magnetic charge monopoles and Dirac flux strings in an artificial spin-ice lattice. Phys Rev B (2012) 85:180402(R). doi: 10.1103/PhysRevB.85.180402
37. Morgan JP, Kinane CJ, Charlton TR, Stein A, Sánchez-Hanke C, Arena DA, et al. Magnetic hysteresis of an artificial square ice studied by in-plane Bragg x-ray resonant magnetic scattering. AIP Adv. (2012) 2:022163. doi: 10.1063/1.4732147
38. Kohli K, Balk AL, Li J, Zhang S, Gilbert I, Lammert P, et al. Magneto-optical Kerr effect studies of artificial spin ice. Phys Rev B (2011) 84:180412(R). doi: 10.1103/PhysRevB.84.180412
39. Horcas I, Fernández R, Gómez-Rodríguez JM, Colchero J, Gómez-Herrero J, Baro, AM. WSxM: a software for scanning probe microscopy and a tool for nanotechnology. Rev Sci Instrum. (2007) 78:013705. doi: 10.1063/1.2432410
40. Mól LA, Silva RL, Silva RC, Pereira AR, Moura-Melo WA, Costa, BV. Magnetic monopole and string excitations in two-dimensional spin ice. J Appl Phys. (2009) 106:063913. doi: 10.1063/1.3224870
41. Morgan JP. Ordering and Defects in Artificial Magnetic Square Ice: thermodynamic and Field-Driven Processes. Ph.D. thesis, University of Leeds (2011).
42. Phatak C, Petford-Long AK, Heinonen O, Tanase M, De Graef, M. Nanoscale structure of the magnetic induction at monopole defects in artificial spin-ice lattices. Phys Rev B (2011) 83:174431. doi: 10.1103/PhysRevB.83.174431
Keywords: artificial spin ice, nanomagnetism, magnetic force microscopy, frustrated systems, statistical mechanics
Citation: Morgan JP, Bellew A, Stein A, Langridge S and Marrows CH (2013) Linear field demagnetization of artificial magnetic square ice. Front. Physics 1:28. doi: 10.3389/fphy.2013.00028
Received: 17 August 2013; Accepted: 23 November 2013;
Published online: 18 December 2013.
Edited by:
Peter Fischer, Lawrence Berkeley National Laboratory, USAReviewed by:
Dong-Hyun Kim, Chungbuk National University, South KoreaDario A. Arena, Brookhaven National Laboratory, USA
Copyright © 2013 Morgan, Bellew, Stein, Langridge and Marrows. This is an open-access article distributed under the terms of the Creative Commons Attribution License (CC BY). The use, distribution or reproduction in other forums is permitted, provided the original author(s) or licensor are credited and that the original publication in this journal is cited, in accordance with accepted academic practice. No use, distribution or reproduction is permitted which does not comply with these terms.
*Correspondence: Christopher H. Marrows, School of Physics and Astronomy, University of Leeds, Leeds LS2 9JT, UK e-mail: c.h.marrows@leeds.ac.uk