X-ray standing wave simulations based on Fourier vector analysis as a method to retrieve complex molecular adsorption geometries
 Giuseppe Mercurio1,2*
  Reinhard J. Maurer3
  Sebastian Hagen4 Felix Leyssner4
  Jörg Meyer4
  Petra Tegeder4,5
  Sergey Soubatch1,2 Karsten Reuter4
  F. Stefan Tautz1,2
- 1Peter Grünberg Institut (PGI-3), Forschungszentrum Jülich, Jülich, Germany
- 2Jülich Aachen Research Alliance, Fundamentals of Future Information Technology, Jülich, Germany
- 3Department Chemie, Technische Universität München, Garching, Germany
- 4Fachbereich Physik, Freie Universität Berlin, Berlin, Germany
- 5Physikalisch-Chemisches Institut, Ruprecht-Karls-Universität Heidelberg, Heidelberg, Germany
We present an analysis method of normal incidence x-ray standing wave (NIXSW) data that allows detailed adsorption geometries of large and complex molecules to be retrieved. This method (Fourier vector analysis) is based on the comparison of both the coherence and phase of NIXSW data to NIXSW simulations of different molecular geometries as the relevant internal degrees of freedom are tuned. We introduce this analysis method using the prototypical molecular switch azobenzene (AB) adsorbed on the Ag(111) surface as a model system. The application of the Fourier vector analysis to AB/Ag(111) provides, on the one hand, detailed adsorption geometries including dihedral angles, and on the other hand, insights into the dynamics of molecules and their bonding to the metal substrate. This analysis scheme is generally applicable to any adsorbate, it is necessary for molecules with potentially large distortions, and will be particularly valuable for molecules whose distortion on adsorption can be mapped on a limited number of internal degrees of freedom.
1. Introduction
The normal incidence x-ray standing wave (NIXSW) technique is one of the methods of choice for determining accurate molecular adsorbate geometries [1–5]. The experimental information it provides are distances of atomic scatterers from the Bragg planes of the substrate crystal. A crucial advantage of NIXSW is its inherent chemical sensitivity: The structural information (e.g., vertical adsorption heights) is collected separately for each chemical species. In this way, the positions of atoms of different chemical elements, but also of atoms of identical elements in different chemical environments, can be determined individually [2, 6, 7]. For organic molecules that contain heteroatoms such as oxygen, sulfur, or nitrogen, this differential analysis has allowed the determination of adsorption-induced distortions [3–5, 8, 9]. In practice, however, the chemical sensitivity of NIXSW has limits. For instance, many organic molecules consist of a large number of distinct carbon atoms that are nevertheless chemically very similar. A case in point are large aromatic molecules. For them, the chemical differentiation in NIXSW between different carbon species is difficult if not impossible (see, however, [4, 5] for notable exceptions). Therefore, in many NIXSW studies on large organic molecules [3, 8–15] the average carbon adsorption height was determined and the corresponding coherence was only qualitatively or semiquantitatively taken into account. On the other hand, for much smaller molecules (4–5 atoms) the NIXSW coherence was used to gain information on the adsorption geometry [16, 17]. In particular, for such small systems and in presence of NIXSW data from multiple Bragg reflections a program that calculates the most likely adsorption geometry was developed [18]. Yet, it would be desirable if structural information on the arrangement of carbon atoms was available from NIXSW also for larger molecules, in cases where chemical differentiation is not possible and when NIXSW data from only one single Bragg reflection are available.
To retrieve comprehensive details of the adsorption geometry also in these cases we introduce here a novel analysis scheme, the Fourier vector analysis. It is based on the comparison of experimental NIXSW data including their coherence with simulations of NIXSW results for different molecular geometries that are obtained by tuning multiple molecular degrees of freedom. We demonstrate that the Fourier vector analysis is necessary to determine the correct geometry of flexible molecules with potentially large distortions upon adsorption. The example of azobenzene (AB) adsorbed at the Ag(111) surface shows that with this method comprehensive geometries of complex organic molecules adsorbed on single metal crystals can be obtained with good accuracy.
AB (Figure 1) is a prototypical molecular switch that undergoes a reversible photoinduced isomerization between the planar C2h symmetric trans isomer and the torsion-twisted C2 cis isomer [19, 20]. This functionality makes it a possible candidate for an optically active device. The study of molecular switches at metal surfaces is motivated by a wide range of conceivable applications, such as light-driven actuators [21], data-storage media [22] and solar thermal fuel [23].
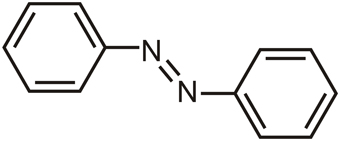
Figure 1. Chemical structure of the trans isomer azobenzene (AB).
While the switching mechanism of AB in solution [24–26] is well understood, it is still an open question how the substrate influences the switching functionality [27]. In particular, steric hindrance, electronic lifetime effects and substrate-induced changes in the electronic structure of the molecule are three possible mechanisms that can occur, but also new properties of the molecular switches induced by the presence of the substrate cannot be excluded a priori [28, 29]. In this context, AB is extensively investigated on different metal surfaces. Isomerization of AB on Au(111) can be achieved via the creation of an ion resonance in an STM junction [30], although light-induced insomerization reactions have not been observed [31, 32]. Successful switching of AB on the Ag(111) surface has so far not been reported, which motivates its study to elucidate the mechanisms underlying the (non)switching function at these closely related surfaces. To understand the switching properties of photo-active molecules adsorbed on metal surfaces, a detailed knowledge of their adsorption geometry and molecular orientation is essential. Insights into the structural configuration will also shed light on the molecule-metal interactions.
Besides introducing the novel analysis scheme mentioned above, the present paper also provides details of the NIXSW data analysis for AB/Ag(111) that was used in Mercurio et al. [33, 34]. The paper is organized as follows. Section 2 contains experimental details, including a short description of the NIXSW technique, AB/Ag(111) sample preparation methods, and some basic information on NIXSW data acquisition and analysis. In section 3 details of the NIXSW data analysis for AB/Ag(111) are presented, culminating in values for the NIXSW structure parameters for AB/Ag(111). These structure parameters are the basis for our further analysis of the structure of AB adsorbed on Ag(111). Because section 3 is of a rather technical nature, readers mainly interested in methodological aspects of how to retrieve complex adsorption geometries via NIXSW simulations based on Fourier vector analysis may skip section 3 and directly turn to section 4 where this analysis method is motivated and presented, using AB/Ag(111) as an example. The paper closes with a discussion of both the experimental structure of AB/Ag(111) and methodological aspects in section 5.
2. Experimental Details
2.1. The NIXSW Technique
The NIXSW technique is a powerful tool for investigating the structural properties of molecules adsorbed on metal surfaces [1, 2, 35, 36]. It results from the combination of x-ray diffraction and x-ray absorption or inelastic scattering (photoelectric effect, Auger effect, fluorescence). In our experiments, performed at the ID32 beamline of the European Synchrotron Radiation Facility (ESRF, Grenoble), photoemission (PE) spectra were measured in order to have simultaneously surface sensitivity and chemical specificity. The experimental set-up is sketched in Mercurio et al. [4].
The NIXSW technique can be summarized as follows. From the interference of the incoming x-ray wave and the wave that is Bragg-reflected from the hkl planes (the incidence angle of the incoming wave is normal to the hkl Bragg planes), a standing wave forms inside and above the metal substrate. Its intensity is dhkl-periodic, with dhkl being the distance between two consecutive hkl Bragg planes. As the photon energy hν of the incoming x-ray beam is tuned through the Bragg condition (hν = EBragg), the standing wave shifts by dhkl/2 along −H, where 2πH is the reciprocal space vector (with |H| = d−1hkl). At each hν, a PE spectrum of a given element core level is measured, and the corresponding PE yield (integral PE intensity after background subtraction) is determined. In this way, the standing wave probes different distances from the Bragg planes. Fitting the PE yield profile (PE yield vs. hν) provides two structure parameters: the coherent position Pc and the coherent fraction Fc, both with values between 0 and 1. The coherent position Pc is related to the (average) distance of the photoemitters above the nearest extended Bragg plane (The ideal planes above the metal surface with the same dhkl periodicity as inside the metal crystal are referred to as extended Bragg planes.) Pc is defined modulo 1, hence both Pc = 0 and Pc = 1 correspond to a Bragg plane position, while 0 < Pc < 1 correspond to positions between two consecutive extended Bragg planes. The coherent fraction Fc is related to the distribution of the photoemitters' positions around their average position. Fc = 1 corresponds to an infinitely sharp δ-distribution, while a homogeneous distribution produces Fc = 0.
2.2. Sample Preparation
NIXSW experiments were performed under UHV conditions with a base pressure of 5 × 10⁻¹⁰mbar. The Ag(111) surface was cleaned in the conventional way by several cycles of sputtering with Ar+ ions and annealing at 820 K. At last, before molecular deposition, the surface cleanliness was checked by x-ray photoemission spectroscopy (XPS).
AB multilayers were deposited from a home-built evaporator onto the Ag crystal kept at 220 K. Subsequent annealing with heating rate of 1 K/s caused the desorption of multilayers, leaving behind a monolayer of AB molecules on the silver surface. The desorption rate was calibrated and controlled by a quadrupole mass spectrometer. In particular, the AB-fragment mass of 77 amu (phenyl ring ion, C6H+5) was monitored to control desorption of AB from the Ag surface. To preserve the integrity of the AB monolayer and to prevent AB desorption, the Ag crystal was kept at 210 K. The corresponding Ag(111) Bragg spacing and Bragg energy are dAg(111) = 2.3552 Å and EBragg = 2634 eV, respectively.
2.3. NIXSW Data Acquisition and Analysis
An NIXSW data set consists of all the core-level PE spectra (XSW-PE spectra) recorded as hν is scanned through the Bragg condition. In the present experiments, XSW-PE spectra were measured with 47 eV pass energy, 0.2 eV kinetic energy (Ek) step width, 100 ms time/step and 10 repeats. The latter acquisition settings result from the compromise between the measurement time and the spectral resolution required to differentiate multiple overlapping components as shown in Figure 2.
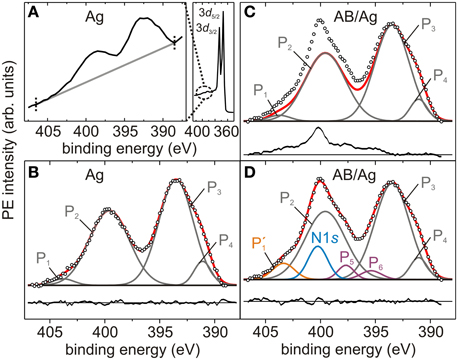
Figure 2. Photoelectron spectra of Ag3d-plasmons and N1s core level. (A) Sum of 14 survey-PE spectra (solid black curve) of Ag3d5/2, Ag3d3/2 (right) and Ag3d-plasmons (enlargement in left panel), measured at hν = 2617 eV on the bare Ag(111) crystal. The two dotted black lines define the binding energy region in which the linear background (gray line) is determined and XSW-PE spectra are fitted. (B) Sum of 93 Ag3d-plasmons XSW-PE spectra acquired in three NIXSW data sets of the bare Ag(111) crystal. (C,D) Sum of 93 N1s+Ag3d-plasmons XSW-PE spectra acquired in three NIXSW data sets of AB/Ag(111). (B–D) Empty black circles: summed PE intensity. Gray curves: P1, P2, P3, P4 components. Blue curve: N1s peak. Orange curve: P′1 component. Purple curves: P5, P6 components. Black straight line: linear background. Black curves: residuals (summed PE intensity - sum of fitting components) plotted below each PE spectrum.
In order to verify the integrity of the molecular layer, survey-PE spectra of C1s and N1s core levels were measured before and after the acquisition of each NIXSW data set on the same sample spot and with hν ≪ EBragg to prevent the standing wave effect from altering the PE yield of photoemitters located at different adsorption heights. Survey-PE spectra were acquired with 94 eV pass energy, 0.5 eV Ek step width, 500 ms time/step and 4 repeats. Since the survey-PE spectra neither show core-level shifts nor peak broadenings, an x-ray induced damage of the molecular layer as well as photoisomerization of AB can be excluded.
The fitting of the PE spectra was performed with the software CasaXPS [37], which provides the PE yield and the error of each fitting component. A detailed description of the PE yield error analysis is reported in Mercurio et al. [4]. The resulting PE yield profiles were analyzed with the program Torricelli1, 2 [38] which provides the corresponding structure parameters (Pc, Fc) with the respective error bars. In particular, to fit C1s and N1s PE yields the nondipolar parameters calculated according to Vartanyants and Zegenhagen [39] and Lee et al. [40] and reported in Table 1 were used. The slight differences between the NIXSW results of this work and those of Mercurio et al. [33] are summarized in Mercurio et al. [34].
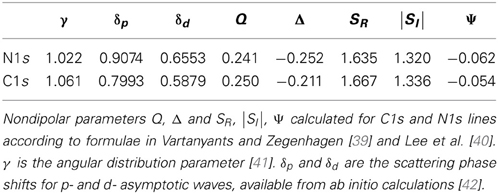
Table 1. Nondipolar parameters of N1s and C1s core levels.
3. Experimental Results
In this section we report the procedure followed to determine the structure parameters (Pc, Fc) of nitrogen and carbon atoms of AB molecules adsorbed on the Ag(111) surface. In the case of nitrogen, the coherent position Pc corresponds directly to the average adsorption height, as argued in section 4.2. In the case of carbon, however, such a direct correspondence does not exist, as will be discussed in section 4.3.
Because of the overlap of Ag3d-plasmon peaks in the energy range 388–407 eV (Figure 2A) with the N1s core level expected at approximately 400 eV [43, 44], the nitrogen PE yield can only be obtained by subtracting the silver PE yield (Figure 2B) from the entire N+Ag spectrum (Figure 2C). For this purpose, a PE spectrum of the Ag3d-plasmons on the bare Ag crystal was measured (Figure 2B), and a fitting model was developed (section 3.1). The latter was used to extract the N1s peak of AB/Ag(111) (Figure 2D), as explained in section 3.2. In contrast, the C1s core level (Figure 5A) does not overlap with any other PE line, hence the determination of C PE yield is straightforward and does not require the modeling of the corresponding PE spectrum, as reported in section 3.3.
3.1. Silver
Our scope here is not to determine and discuss the physical origin of the multiple components into which Ag3d-plasmons can be decomposed [45]. Rather, we are looking for a fitting model consisting of the smallest possible number of components, the envelope of which describes the measured spectra. The fitting model reported in Figure 2B consists of four peaks: The two major components (P2 and P3) account for approximately 90% of the whole PE yield; the additional two minor components (P1 and P4) are located at opposite tails of the spectrum. The residuals, which result from the difference between the envelope P1 + P2 + P3 + P4 and the measured spectrum, indicate the good quality of the fit.
In order to obtain a larger signal-to-noise ratio, all XSW-PE spectra of different NIXSW data sets were summed (Figure 2A). The fitting model of the Ag3d-plasmons was then derived on the basis of this sum spectrum. Note that summing PE spectra recorded at different photon energies around EBragg will alter the PE spectrum, if different chemical species at different adsorption heights contribute to the PE signal. However, in the present case only Ag atoms contribute to the PE spectrum of Ag plasmons, therefore modifications of the sum spectrum are not expected.
Fitting each XSW-PE spectrum of the three available relevant NIXSW data sets with the fitting model for Ag3d-plasmons described above, we verified that each fitting component exhibits Ag-like behavior (Pc ≈ 1, Fc ≈ 1). This finding confirms that the PE signal in the energy region 388–407 eV consists exclusively of plasmon peaks arising from the Ag3d lines, and we can therefore exclude contributions from other chemical elements. Since each fitting component (P1, P2, P3, P4) carries the same structural information, the areas of P1, P2, and P4 were fixed with respect to the one of the largest component P3, and the relative areas, the full widths at half maximum (FWHMs) and the positions of each component were constrained to the corresponding values resulting from the best fit of the sum spectrum in Figure 2B (Table 2).
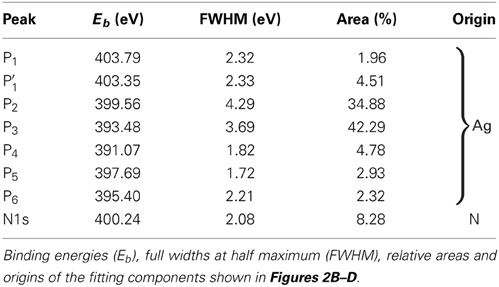
Table 2. Spectral parameters of Ag3d-plasmons and N1s core level.
3.2. Nitrogen
In analogy to the procedure described in section 3.1, the N1s component was derived on the basis of the sum spectrum resulting from the N1s+Ag3d-plasmons XSW-PE spectra of the three available NIXSW data sets measured on AB/Ag(111) (Figures 2C,D) each summed over all photon energies. After subtracting the fit of the Ag3d-plasmons (red envelope in Figure 2C) from the N1s+Ag3d-plasmons sum spectrum, the residuals reveal the presence of at least four additional components. The most prominent one is located at approximately 400 eV and is attributed to the N1s core level [43, 44]. The one located at the high binding energy tail of the spectrum is approximately at the same position as P1, hence, instead of adding a new component, P1 was modified as follows. The area constraint of P1 relative to P3 was removed, and its position was left free to vary within ± 0.5 eV around its original value. The peak modified in this manner and resulting from the best fit of the sum spectrum was renamed as P′1 (Figure 2D). Finally, two additional minor components, P5 and P6, were included in the fitting model of the N1s+Ag3d-plasmons sum spectrum.
The fitting model presented above accurately describes the sum spectrum, as the residuals in Figure 2D confirm, and was then used to fit each individual XSW-PE spectrum with the following constraints. The binding energy positions Eb and the FWHMs of all components as well as the area ratios YP2/YP3 and YP4/YP3 were fixed to the values obtained from the best fit of the sum spectrum in Figure 2D (Table 2). Consequently, the areas of N1s, P′1, P3, P5, and P6 components are the only free fitting parameters. We discuss below the PE yield profiles of N1s, P′1, P2 + P3 + P4, and P5 + P6. The plasmon peaks P2, P3, and P4 are summed, because their intensities are constrained to each other. The minor peaks P5 and P6 are summed in order to have a more significant signal and under the assumption (to be verified) that both components have the same physical origin.
Figure 3 shows individual off-Bragg and on-Bragg XSW-PE spectra with the corresponding fitting components. Already from these three snapshots the different photon energy dependence of the N1s component, as compared to the others, is evident. The corresponding PE yield profiles are shown in Figure 4 and indeed clearly reveal a different behavior of YN1s(hν) as compared to the remaining Ag-like PE yield profiles of P′1, P2 + P3 + P4, and P5 + P6.
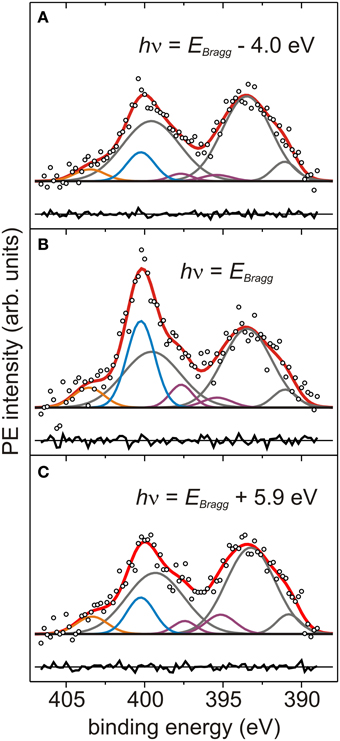
Figure 3. Photoelectron spectra at different photon energies. (A–C) N1s+Ag3d-plasmons XSW-PE spectra of AB/Ag(111) measured at the photon energies hν reported in each panel (with EBragg = 2634 eV). Each PE spectrum is normalized to the corresponding background value at 388 eV. Symbols and color code as in Figure 2.
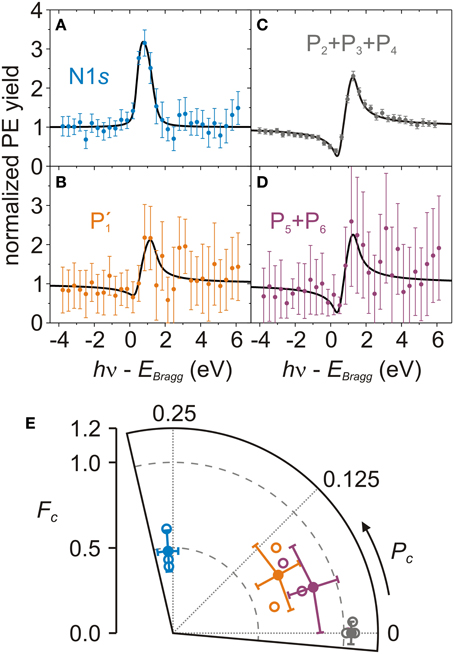
Figure 4. Photoelectron yields and Argand diagram of N1s core level and Ag3d-plasmons. (A–D) Exemplary PE yield profiles (filled circles with error bars [4]) and fitting curves (black lines) of N1s (A, blue), P′1 (B, orange), P2 + P3 + P4 (C, gray), P5 + P6 (D, purple) measured on AB/Ag(111). Structure parameters: (A) Pc = 0.26 ± 0.02, Fc = 0.43 ± 0.07, χ2red = 1.03; (B) Pc = 0.04 ± 0.04, Fc = 0.61 ± 0.13, χ2red = 0.23; (C) Pc = 0.00 ± 0.01, Fc = 1.01 ± 0.02, χ2red = 0.53; (D) Pc = 0.00 ± 0.02, Fc = 1.02 ± 0.11, χ2red = 0.17. (E) Argand diagram of N1s (blue open circles), P′1 (orange open circles), P2 + P3 + P4 (gray open circles), P5 + P6 (purple open circles) structure parameters (Pc, Fc) of the three NIXSW data sets and the corresponding averages (filled circles, Table 3). P′1 has two data points because the fit of the third PE yield did not converge [38]. The third P5 + P6 data point overlaps with the P2 + P3 + P4 data point at Fc = 1.01 [38].
We turn now to discuss the average (Pc, Fc) of N1s, P′1, P2 + P3 + P4, and P5 + P6 (Figure 4E and Table 3) derived from the PE yield fits of each NIXSW data set, as shown, e.g., in Figures 4A–D, respectively. The nitrogen structure parameters are PNc = 0.26 ± 0.02, FNc = 0.48 ± 0.12. The corresponding adsorption height is 2.97 ± 0.04 Å (Table 3). In contrast, the P2 + P3 + P4 structure parameters show a typical substrate behavior, i.e., Pc = 0.00 ± 0.01 and Fc = 1.04 ± 0.02. This is in agreement with our initial interpretation of them as Ag-plasmon peaks. The small excess of the coherent fraction above its physical limit of 1.00 follows from the best fit of Pc and Fc without any numerical restriction, and may be due to the fact that nondipolar parameters are not correctly accounted for, because some of them are unknown for non-s subshells [39, 46]. The coherent position of P5 + P6 is slightly larger (Pc = 0.05 ± 0.05) while the corresponding coherent fraction is slightly smaller (Fc = 0.86 ± 0.15) than for P2 + P3 + P4. This is due to the partial overlap of the N1s component with P5. The intensity of the latter indeed increases in going from off-Bragg to on-Bragg spectra (Figures 3A–C), following the same trend as the N1s peak. A similar behavior is exhibited by P′1. Here again, the larger Pc and the smaller Fc in comparison to the P2 + P3 + P4 profile point to an admixture of the N1s signal. Finally, we note that the error bars of each PE yield are inversely proportional to the corresponding signal-to-noise ratio. For small signals, small variations of the statistical noise result in large variations of the component areas.
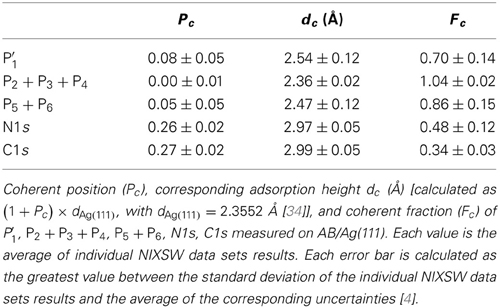
Table 3. Summary of structure parameters and adsorption heights.
3.3. Carbon
Although carbon atoms in AB are in several different chemical states, the corresponding C1s PE spectrum cannot be decomposed into the respective multiple components, because the chemical core-level shifts are too small to be resolved. In fact, the C1s spectrum of AB (Figure 5A) consists of one sharp PE line at approximately 285 eV and a broad tail at higher binding energies. Since the differentiation of carbon species is not feasible, the corresponding structure parameters (Pc, Fc) are representative of all carbon atoms within AB. In particular, the average coherent position and fraction of carbon are PCc = 0.27 ± 0.02 and FCc = 0.34 ± 0.03 (Figure 5C and Table 3), derived from the PE yield fits of each NIXSW data set, as shown, e.g., in Figure 5B. This corresponds to a nominal average adsorption height of 2.99 ± 0.05 Å. However, as we will argue in the next section, this value is not meaningful, and a more elaborate analysis is required to extract the geometry of AB/Ag(111) from the experimental NIXSW structure parameters.
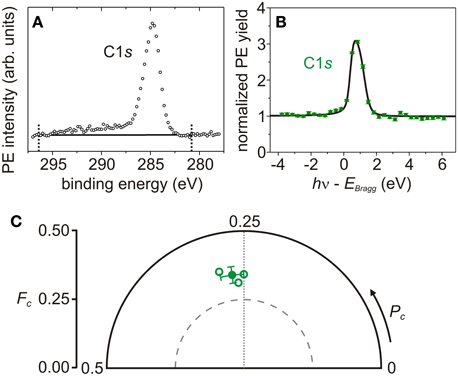
Figure 5. Photoelectron spectrum, photoelectron yield and Argand diagram of C1s core level. (A) Sum of 10 C1s survey-PE spectra (black open circles). The two black dotted lines define the binding energy region in which the linear background (black line) is determined and the PE yield is calculated. (B) Exemplary C1s PE yield profile (green filled circles with error bars [4]) and fitting curves (black line). Structure parameters: Pc = 0.29 ± 0.01, Fc = 0.36 ± 0.02, χ2red = 1.80. (C) Argand diagram of C1s structure parameters (Pc, Fc) of each NIXSW data set (green open circles) and the corresponding average (green filled circle).
4. Fourier Vector Analysis
4.1. General Considerations
Figure 6 contains the experimentally determined structure parameters for carbon and nitrogen, displayed as complex numbers Fc exp (2πiPc) in the Argand diagram. The Argand diagram is a polar diagram in the complex plane, in which the coherent position determines the phase and the coherent fraction the modulus.
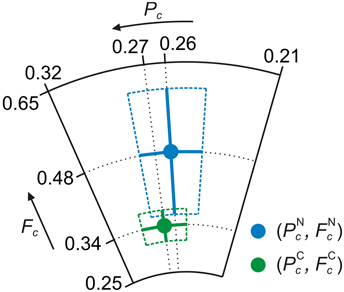
Figure 6. Argand diagram of the NIXSW experimental results for AB/Ag(111). Green filled circle: Average experimental (Pc, Fc) = (0.27±0.02, 0.34±0.03) of carbon. Blue filled circle: Average experimental (Pc, Fc) = (0.26±0.02, 0.48±0.12) of nitrogen. Green and blue solid lines: Corresponding error bars. Green and blue dashed lines: Corresponding error regions [34].
Given the standard relation [1]
between coherent position PXc of a chemical species X and its (average) coherent adsorption height dXc, where dH is the Bragg spacing between two consecutive (hkl) lattice planes at which the incoming x-ray beam is reflected, one could conclude from the results displayed in Figure 6 that the average distances of carbon and nitrogen atoms from the surface are similar, since both data points appear at nearly the same phase in the Argand diagram. Evidently, this would correspond to a flat adsorption geometry of AB on Ag(111), with an adsorption height of approximately 2.98 Å (Table 3). This adsorption geometry has been suggested both by earlier experimental and theoretical work [33, 47–49].
However, looking at Figure 6 we note that the data point for carbon has a 30% smaller modulus in the complex plane than the data point for nitrogen. This indicates that the coherences of the PE yield curves for both species are different. In other words, the widths of the spatial distributions of photoemitters between the Bragg planes are different for C and N.
Usually, the reduction of coherent fractions in NIXSW is assigned to structural disorder at the surface. Other possible sources of low coherent fractions (molecular vibrations, surface diffusion) are discussed in Mercurio et al. [34]. However, it is important to note that even in highly ordered static organic overlayers a certain chemical element X may exhibit a low coherent fraction, because its atoms appear at different but well-defined adsorption heights. If the chemical core-level shifts between the species at different heights of this element are too small to be resolved, the PE yield curve for this element will show a low coherent fraction, in spite of the high degree of order.
Before assigning the reduced coherent fraction of carbon (relative to nitrogen) to static or dynamic structural disorder of the carbon atoms in flat-adsorbed AB, we must therefore consider whether the experimental results of Figure 6 can be explained by a distorted adsorption geometry of AB on Ag(111), in which carbon atoms appear at a range of different, but well-defined adsorption heights. This analysis is carried out in four steps. First, we identify likely distortions of AB on Ag(111), based on qualitative considerations regarding the balance of molecule-substrate and molecule-molecule interactions in a dense monolayer film of AB (section 4.2). This leads to the definition of two internal degrees of freedom along which AB may likely distort upon adsorption. Then, we show that if the molecular adsorption geometry is distorted so strongly that photoemitters contributing to the same PE line are distributed over more than one Bragg spacing, Equation (1) is not sufficient any more, because it disregards the phase information of individual photoemitters that is contained in the modulo term of Equation (2) (section 4.3). Next, we introduce a general scheme with which NIXSW experiments on a given distribution of photoemitters can be simulated (section 4.4). This is based on Fourier vector analysis. And finally, we apply this scheme to AB/Ag(111) and derive two distorted, nonplanar adsorption structures that are consistent with the data in Figure 6, including the different coherence of the carbon and nitrogen signals (section 4.5). (For details of the simulations see the Supplemental Material of Mercurio et al. [34]).
4.2. Plausible Adsorption-Induced Distortions of the Internal AB Geometry
For the purpose of the present discussion, AB can be decomposed into the azo bridge (−N=N−) and the phenyl ring moieties (−C6H5). This conceptual subdivision of the molecule is supported by the fact that HOMO and LUMO are predominantly consisting of the N lone pairs and the π* orbital at the −N=N− moiety, respectively [48]. Therefore, the molecular orbitals that are chemically interacting with the substrate are mainly located at the nitrogen atoms, suggesting a substantial difference between the azo bridge and the closed-shell phenyl rings.
With this conceptual decomposition of AB in mind, we can discuss the AB-substrate and AB-AB interactions qualitatively. There are five major contributions: (i) the van der Waals (vdW) interactions between the phenyl rings and the metal; (ii) the van der Waals (vdW) interactions among phenyl rings of neighboring molecules; (iii) the Pauli repulsion between the phenyl rings and the substrate; (iv) a possible covalent bond between the nitrogen atoms and the Ag surface atoms; (v) a possible energetic penalty due to the distortion of the planar gas-phase molecular geometry. In the stable adsorption geometry, these five contributions must be balanced against each other, yielding a minimum of the total energy [48, 49].
In case of the flat trans isomer of AB, contributions (iii) and (iv) are in competition with each other, because a covalent N-Ag bond tends to bring the molecule closer to the surface, such that the phenyl rings may already experience a substantial Pauli repulsion and thus lift away from the surface to form a butterfly-like configuration (Figure 7A). On the other hand, attractive vdW forces have a propensity to pull the whole molecule closer to the surface, decreasing both the phenyl ring tilt angle ω (dihedral angle CNNC3, Figure 7A) and the nitrogen adsorption height dNc, thereby also reducing the molecular distortion. However, the attractive vdW forces between molecule and surface compete with the vdW forces between phenyl rings of adjacent molecules. The latter have the tendency to increase the phenyl ring torsion angle β (dihedral angle CCNN3, Figure 11) and lift the molecule away from the surface. We can thus conclude that the three geometry parameters ω, β, and dNc are sensitive to the balance between the N-Ag covalent interaction, the dispersive interactions within the molecular layer, and the dispersive interactions between molecule and metal substrate. Hence, tilt and torsional distortions of AB upon adsorption must be considered as possibilities when analyzing the adsorbate structure. On the other hand, the determination of ω, β (and dNc) will allow us to assess the relative magnitudes of the different binding forces acting at the AB/Ag(111) interface. Incidentally, the fact that ω and β are generally used to describe the structural properties of AB during the switching process from the trans to the cis isomer [51, 52] confirms that they are very relevant geometry parameters.
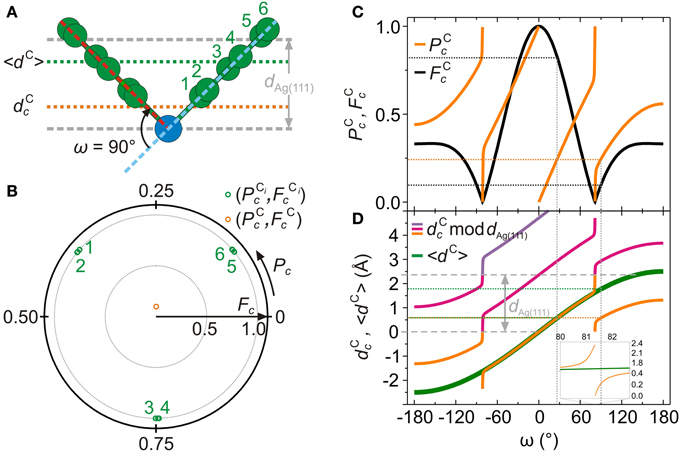
Figure 7. The relation between dCc and 〈dC〉. (A) Hypothetical AB adsorption geometry with nitrogen atoms (blue circles) at the Bragg plane (dNc = 0 mod dAg(111)), ω = 90° and β = 0° (see section 4.2 and Mercurio et al. [34] for the definition for ω and β). Orange dotted line: coherent carbon adsorption height dCc calculated using Equation (1). Green dotted line: true average carbon adsorption height 〈dC〉 calculated using Equation (6). (B) Green circles: structure parameters (PCic,FCic) of the individual carbon atoms in (A). Orange circle: structure parameters (PCc,FCc) of the sum vector FCc exp (2πiPCc), calculated using Equations (2, 3, 9–12). (C) Structure parameters PCc (orange solid curve) and FCc (black solid curve) for −180° ≤ ω ≤ 180°. (D) Orange solid curve: coherent carbon adsorption height dCc (in Å) for −180° ≤ ω ≤ 180°. Note that dCc = PCc × dAg(111) − dAg(111) for ω < 0° (section 4.4), while dCc = PCc × dAg(111) for ω > 0°, with PCc values from (C). Magenta solid curve: dCc (orange solid curve) + dAg(111). Violet solid curve: dCc (orange solid curve) + 2 × dAg(111). Green solid curve: true average carbon adsorption height 〈dC〉 (in Å) for −180° ≤ ω ≤ 180°. Inset: enlargement of (D) at ω ≈ 81°. Gray dashed lines: Bragg planes at 0 Å and 2.3552 Å.
STM studies show that AB adsorbs in the trans configuration both on the more reactive Cu(110) surface [53] and on the less reactive Au(111) surface [31]. Moreover, STM [30, 31, 54], HREELS [55], NEXAFS [56] and two-photon PE [57, 58] experiments for tetra-tert-butyl-azobenzene (TBA), a related molecular switch, indicate trans adsorption on Au(111). On the basis of these observations AB is expected to adsorb in the energetically most favorable trans state on the Ag(111) surface [48]. In addition, PE spectra measured before and after NIXSW experiments allow switching to the cis configuration upon x-ray irradiation to be excluded. Hence, the azo-moiety of AB molecules is most probably lying flat on the surface, with both of the nitrogen atoms in the same chemical state and at the same adsorption height dNc, as predicted also by DFT calculations [48, 49]. However, the flexibility of AB molecules, testified by their tunable conformation upon photoexcitation [51, 52], prevents us from excluding a priori an adsorption geometry in which carbon atoms are vertically spread, possibly over more than one Bragg spacing dAg(111).
4.3. The Relation Between dc and 〈d〉 in NIXSW Experiments
We have seen in the previous section that AB is likely to adsorb on the Ag(111) surface in the trans configuration with both nitrogens at the same height, with a butterfly-like distortion of AB along the tilt angle ω being a general possibility (for the moment, we ignore the equally probable torsional distortion for the sake of simplicity). We now ask the following question: Is it possible to determine ω, knowing the coherent height of the nitrogen atoms dNc and the coherent height of carbon atoms dCc that are derived directly from the NIXSW experiment via Equation (1)?
If the true average position 〈dC〉 [Equation (6)] of the carbons was known, it would of course be trivial to calculate ω from dNc (assumed to be identical to 〈dN〉) and 〈dC〉 by simple geometric considerations. Yet, the answer to the above question is no, because dCc as derived from PCc via Equation (1) does not always correspond to the average adsorption height 〈dC〉. The ultimate reason for this is the modulo 1 periodicity of the coherent position which is a nonlinear operation and thus affects the averaging. This is illustrated below.
Let us consider an AB molecule with ω = 0°, β = 0° and dNc = dAg(111) mod dAg(111). While β and dNc are fixed, ω is tuned between −180° and 180° in steps of 1°. For each of these 361 AB geometries, the structure parameters for carbon (PCc, FCc) are calculated as detailed in section 4.4 below. Furthermore, the coherent carbon adsorption heights dCc and the average carbon adsorption heights 〈dC〉 are computed for each ω. Figure 7A shows one particular AB geometry (ω = 90°). The corresponding coherent position and fraction of the individual C atoms (PCic, FCic) and the average (PCc, FCc) are displayed in the Argand diagram of Figure 7B. Figure 7C shows (PCc, FCc) as ω is varied, while Figure 7D reports the corresponding dCc and 〈dC〉.
Figure 7D clearly shows that for certain geometries dCc does not coincide with 〈dC〉. In these cases, the coherent carbon adsorption height dCc as measured in NIXSW does not have the geometrical meaning of the true average adsorption height of all carbon atoms. As Figures 7C,D indicate, this occurs for AB geometries with large absolute values of the tilt angle ω, i.e., for molecules extending over more than one Bragg spacing. In these cases, due to the modulo 1 periodicity of Pc, PCc undergoes an abrupt change from 1 to 0 at ω ≈ 81° (Figure 7C, orange curve). At this precise point, the family of dCc curves in Figure 7D exhibits a very steep but continuous step by approximately dAg(111)/2 (see orange and magenta curves at ω ≈ 81° in Figure 7D) while the actual average position of carbon atoms 〈dC〉 varies without discontinuity as ω is tuned (Figure 7D, green curve).
Figure 7C illustrates why the knowledge of PCc and the application of Equation (1) to calculate dCc is in general not sufficient to determine ω of AB unambiguously. For example, a value of PCc ≈ 0.25, indicated by the orange dotted line in Figure 7C, is consistent with two angles, ω ≈ 30° and ω ≈ 90°. Although according to Equation (1) these would yield identical dcC (orange dotted line in Figure 7D), it is clear that the true carbon average adsorption heights 〈dC〉 for both angles are different, as can be seen in Figure 7D (green dotted lines). However, we also note that the two configurations ω ≈ 30° and ω ≈ 90° can be distinguished from each other by their different FCc (black curve in Figure 7C). Thus, in cases where the molecule potentially spreads over more than one Bragg spacing, both structure parameters PCc and FCc must be considered for a reliable geometry determination. This is naturally achieved by taking the complex nature of the structure parameters Fc exp (2πiPc) fully into account. The Fourier vector analysis that is described in the next section fulfills this requirement. This analysis scheme is based on the simulation of NIXSW results for a given distribution of atoms.
4.4. NIXSW Simulations of a Distribution of Atoms
In this section we show how, based on the representation of the structure parameters (Pc, Fc) as vectors in the complex plane (Argand diagram), NIXSW results for a given distribution of atoms can be simulated.
Consider an atomic species X and a distribution of NX atoms Xi (i = 1, …, NX) across one or more Bragg spacings. Each atom Xi is defined by its distance dXi from the surface Bragg plane, its coherent position PXic and its coherent fraction FXic. PXic is calculated as [59]
where dH is the Bragg spacing between two consecutive (hkl) lattice planes at which the incoming x-ray beam is reflected. Note that, unlike in Equation (1), the dXi in Equation (2) always corresponds to the true adsorption height of atom Xi. FXic is calculated as:
PXic and FXic can also be interpreted as the phase and the amplitude of the Fourier vector
which defines a point in the Argand diagram (Figure 7B, green points). The entire collection of atoms can be represented by the normalized distribution function
The corresponding average adsorption height is
In an NIXSW experiment the Fourier transform of the distribution fX(z), i.e.,
is measured [59]. Inserting Equation (5) into Equation (7), can be recast as
with
The coherent position and fraction of the distribution of species X are given by
and
respectively. Finally, the coherent adsorption height dXc of the distribution of the atoms Xi is calculated as
Using Equations (2, 3, 9–13), results of a NIXSW experiment on a given distribution fX(z) of atoms X can be simulated. To retrieve experimental geometries from measured structure parameters, the NIXSW simulation is carried out for a range of assumed molecular geometries. All assumed geometries which yield average coherent positions and fractions (Pc, Fc) within the error of the experimentally measured values are regarded as consistent with the experiment. This procedure is illustrated in detail below in section 4.5 for the example of AB.
Before moving on to the example of AB, we briefly comment on some of the general properties of the coherent adsorption height dXc as calculated by Equations (2, 3, 9–13). According to Equation (11), PXc can have two kinds of discontinuities. The first type of discontinuity occurs for ℜ > 0 if ℑ changes sign. This corresponds to the sum Fourier vector [Equation (8)] moving from the first to the fourth quadrant (or vice versa) of the Argand diagram. In this case, PXc changes by 1. This type of discontinuity is displayed in Figures 7C,D. The second type of discontinuity occurs if both ℜ and ℑ change sign. This corresponds to the sum Fourier vector moving from the second to the fourth or from the first to the third quadrant of the Argand diagram (or vice versa) and produces a change of PXc by 1/2, which translates to a change of dXc by dH/2. Note that at the second discontinuity FXc = 0, therefore PXc becomes meaningless.
It is clear from Figure 7 that the above mentioned discontinuities in PXc may in some circumstances occur even if the real space positions of Xi atoms are modified only minutely. This slight modification will not change the average adsorption height 〈dX〉 strongly [see Equation (6)], but it will lead to a discontinuity in the coherent adsorption height dXc. In some simple cases the discontinuity in dXc that is produced by a step of 1 in PXc can be balanced by adding (or subtracting) dH, because the relation between PXc and dXc is only valid modulo dH, and in fact in Figure 7D we have eliminated the discontinuity in dCc at ω = 0 (i.e., for the flat molecule) in precisely this way, bringing 〈dC〉 and dCc around ω = 0 back into congruence. However, actual simulations show that in more complex geometries [and therefore more complex distributions fX(z)] there is no simple modulo dH-relationship any more between 〈dX〉 and dXc. This can be seen, e.g., in Figures 7C,D for angles beyond 80°: Already before the actual discontinuity in PCc, dCc and 〈dC〉 deviate from each other (see inset in Figure 7D), and after the jump by 1 in PCc the difference between dCc and 〈dC〉 is not a full lattice constant (Difference between orange and green or magenta and green curves for ω > 81° in Figure 7D). In these complex cases, NIXSW results can thus not be inverted to yield a molecular geometry. Rather, NIXSW results have to be simulated for all plausible geometries, and the true experimental geometry has to be selected by comparing simulated and measured structure parameters.
4.5. Adsorption Geometry of AB/Ag(111)
We now turn back to the NIXSW data in Figure 6 and apply the NIXSW simulations as introduced in the previous section to AB/Ag(111). The goal is the retrieval of all experimental geometries that are consistent with these data. As motivated in section 4.2, we employ the geometry parameters dNc, ω, and β in our NIXSW simulations.
We have already pointed out in section 4.1 that tuning only the tilt angle ω cannot generate a molecular geometry that is consistent with the experimental structure parameters (blue and green data points in Figure 6). This is confirmed by results of the full NIXSW simulation that are displayed in Figure 8. The figure shows the trace of the carbon sum vector in the Argand diagram as ω is tuned from −180° to 180°. No intersection with the data point for carbon is found. We note that in the simulation the adsorption distance of the nitrogens from the Ag surface dN−Ag is fixed at the experimental value of dNc = 2.97 Å (Table 3), such that for tilt angle ω = 0° the carbon trace must traverse the nitrogen data point (the implicit assumption here is that both nitrogens are at same height and that the coherent fractions of individual carbon atoms are identical to those of individual nitrogen atoms).
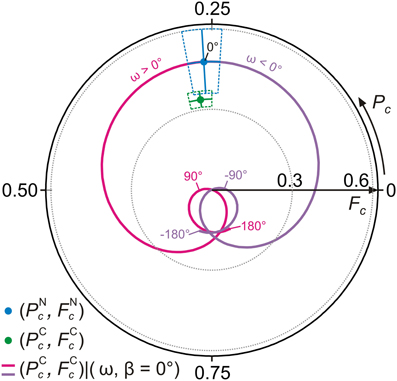
Figure 8. Results of NIXSW simulations for AB, tuning the tilt angle ω. Argand diagram of the NIXSW experimental results (green and blue dots, Figure 6) and NIXSW simulations of carbon structure parameters (PCc, FCc) for −180° ≤ ω ≤ 0° (violet line) and 0° ≤ ω ≤ 180° (magenta line) with β = 0° and dN-Ag = 2.97 Å.
In Figure 9 we repeat the NIXSW simulation, again starting from the flat molecule with nitrogens at the experimental height dN−Ag, but now keeping ω = 0° and tuning the torsion angle β from −180° to 180°. In this case, the carbon trace intersects the error regions around both experimental data points. This shows that in order to retrieve the AB adsorption geometry both geometry parameters ω and β need to be tuned.
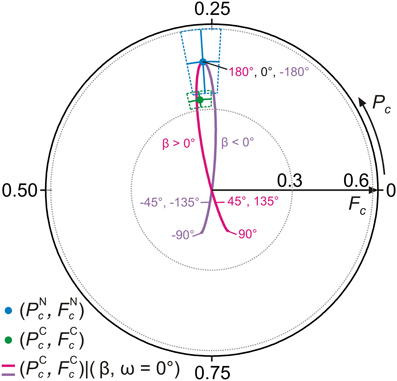
Figure 9. Results of NIXSW simulations for AB, tuning the torsion angle β. Argand diagram of the NIXSW experimental results (green and blue dots, Figure 6) and NIXSW simulations of carbon structure parameters (PCc, FCc) for −180° ≤ β ≤ 0° (violet line) and 0° ≤ β ≤ 180° (magenta line) with β = 0° and dN-Ag = 2.97 Å.
A systematic search, in which both ω and β are tuned at the same time, reveals that there are two geometries which are consistent with the experimental data points: dN−Ag = 2.97 Å, ω = −0.7° and β = 17.7°; dN−Ag = 2.97 Å, ω = 2.6° and β = −18.0° (Figure 10). These are listed in Table 4. The error bars of the geometry distortion angles ω and β arise because it is sufficient that the carbon trace intersects the experimental data points within their error bars. Details about the search, including the determination of the experimental errors, are given in the Supplemental Material to Mercurio et al. [34].
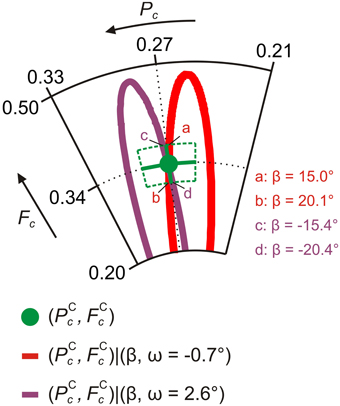
Figure 10. Comparison of NIXSW simulations and experimental data for AB/Ag(111). Argand diagram of the NIXSW experimental results (green dot, Figure 6) and of NIXSW simulations of carbon average structure parameters (PCc, FCc) for: ω = −0.7° and −26.7° ≤ β ≤ 26.5° (red line); ω = 2.6° and −26.6° ≤ β ≤ 27.1° (purple line). For all NIXSW simulations dN-Ag = 2.97 Å and FCic = FNic = 0.48. For each simulated curve the values of β at the intersections with the carbon error region are specified. These values correspond to error 1 of β in Table 4.
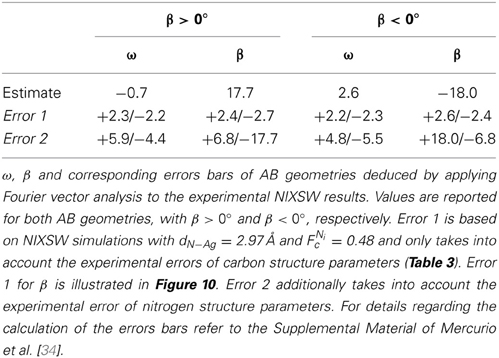
Table 4. Geometry parameters resulting from Fourier vector analysis for AB/Ag(111).
5. Discussion
In Figure 11 real-space models of the two possible adsorption geometries of AB/Ag(111) are shown. They involve similar distortions, with the exception that the torsion angles β have opposite signs. The tilt angles ω are close to zero in both cases. Because of their similarity, neither of the two geometries can be ruled out on the basis of the NIXSW experiment alone. However, we have also carried out density functional calculations for the adsorption of AB on Ag(111). Details of the calculation are given in [34]. These calculations predict a positive β of the same magnitude as in experiment. We can therefore conclude that geometry in Figure 11A is the correct geometry adopted by AB if adsorbed in a dense monolayer on Ag(111).
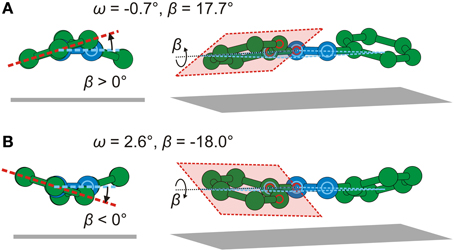
Figure 11. Two possible adsorption geometries of AB/Ag(111) resulting from Fourier vector analysis. (A) Side view and perspective view of AB with ω = −0.7° and β = 17.7°. (B) Side view and perspective view of AB with ω = 2.6° and β = −18.0°. The planes containing atoms C,C,N are marked in red and the corresponding atoms are indicated by red circles. The planes containing atoms C,N,N are marked in light blue and the corresponding atoms are indicated by light blue circles. C atoms: green spheres. N atoms: blue spheres. For clarity, H atoms are not drawn.
What causes the distortion of the molecule, in particular the substantial torsion? Usually, flat molecules (like AB in the trans configuration) tend to adsorb in a flat-lying adsorption geometry, in order to minimize the van der Waals energy with the substrate. From this point of view, the torsion of the molecule seems counterintuitive. However, in the present context of a dense monolayer, the relevant quantity is not the adsorption energy of a separate molecule, but the adsorption energy per unit area. This can be optimized in two ways, either by optimizing the number of molecules per unit area, or by optimizing the adsorption energy per molecule. Our calculations show that an initial increase in the packing density, which becomes possible because the molecules twist and thus reduce their footprint, leads to a gain in adsorption energy per unit area, although the adsorption energy per molecule is reduced. In fact, the calculations predict a maximum of the adsorption energy per surface area that occurs very close to the experimentally determined twist angle β (which rises with packing density). Note that the twisting has two beneficial effects: It helps to accommodate more molecules on the surface and it reduces the van der Waals energy between adjacent molecules. Incidentally, the fact that adsorption of the nominally flat trans isomer leads to an internal torsion of the molecule may be relevant for discussions of the switching mechanism.
We close the paper with some general remarks regarding the analysis technique which we have introduced in this paper. The Fourier vector analysis is generally applicable to any adsorbate and will be particularly valuable for molecules whose distortion on adsorption can be mapped on a limited number of internal degrees of freedom. In this case, in fact, the adsorption geometry of the molecule can be retrieved because among all possible molecular configurations only a limited number of them can explain NIXSW experimental results. We have shown this for AB/Ag(111) where two internal degrees of freedom, AB tilt and torsion angles, are taken into account. However, as the complexity of the adsorbate increases and a larger number of internal degrees of freedom is required to map its distortion on adsorption, the number of plausible adsorption geometries derived by Fourier vector analysis increases as well. In this other case, NIXSW experiments and simulations of the same molecule/substrate system at different hkl reflections may be necessary to reduce the number of plausible adsorption geometries, and thereby to retrieve the actual ones.
Our analysis utilizes the coherence of the NIXSW signal, which in most cases so far has been ignored, as a source of information that is otherwise difficult to obtain. In the proposed scheme we assume that the difference in coherent fractions of different atom species in the molecule stems from a static distribution of photoemitters. This assumption, while plausible, must be checked. To this end, we have analyzed quantitatively by how much the coherent fractions of the carbon and the nitrogen signals are affected if molecular vibrations around the calculated ground state geometries are allowed. The result is reported in Mercurio et al. [34]. We find that vibrations account only for a minor part of the reduction of the coherent fraction of the carbon signal compared to the nitrogen signal. Hence, a posteriori the validity of the assumption is confirmed.
The analysis of finite-temperature effects in Mercurio et al. [34] has, however, revealed that temperature does have an important influence on the average adsorption geometry: Our DFT calculations predict a 0.2 Å increase of the dN−Ag adsorption height when increasing the temperature from 0 to 210 K. This is brought about by the anharmonicity of the low frequency vibrational modes (mostly the molecular vertical frustrated translation). It is noteworthy that the correct adsorption geometry of AB at Ag(111), including adsorption height and molecular distortion, can only be predicted when taking the finite temperature into account. Neglecting temperature and packing effects, there is a fortuitous agreement between experimental nitrogen adsorption heights dN−Ag [33] and the value predicted by DFT with semiempirical dispersion corrections using the TS scheme [60]. Taking the packing effects into account, the agreement between experiment and theory becomes worse, no matter which calculation scheme (TS [60] or vdWsurf [61]) is used, unless temperature is also taken into account, in which case the agreement between vdWsurf (including collective substrate response) and experiment is nearly perfect with regard to adsorption height and molecular torsion, and fair (10° off) with respect to molecular tilt.
We can thus conclude that without detailed distortion information, which is available from NIXSW only through the Fourier vector analysis introduced here, the comparison between NIXSW and the theoretical results would have led to incorrect conclusions, in particular regarding the accuracy of the various semi-empirical van der Waals correction schemes and the influence of temperature on the adsorption geometry. This means: For accurate benchmarking of calculations with NIXSW results in the future, two changes in common practice are indispensable: (1) It is not enough to consider the phase of the NIXSW signal, i.e., 2πPc, and to derive from it average adsorption heights of various parts of the molecules; rather, differences in coherent amplitude Fc of the NIXSW signal of different species must be considered, too. (2) It is not enough to perform calculations for the ground state; rather, thermal expansion must be taken into account, especially if on adsorption the molecule is distorted along rather soft internal modes.
Conflict of Interest Statement
The authors declare that the research was conducted in the absence of any commercial or financial relationships that could be construed as a potential conflict of interest.
Acknowledgments
We acknowledge financial support from the Deutsche Forschungsgemeinschaft TA244/3-1,2 and SFB 658. Support from J. Zegenhagen, Y. Mi, and B. Detlefs at the beamline ID32 of the ESRF is gratefully acknowledged.
Footnotes
1. ^TORRICELLI is an XSW data analysis and simulation program written by G. Mercurio, copies can be obtained from s.tautz@fz-juelich.de.
2. ^Mercurio et al., in preparation.
3. ^In a chain of atoms A-B-C-D, the dihedral angle is the angle between the plane containing the atoms A,B,C and the plane containing the atoms B,C,D, measured on a third plane that is normal to the intersection of the two planes [50]. In this paper, dihedral angles are defined modulo 180°.
References
1. Zegenhagen J. Surface structure determination with X-ray standing waves. Surf Sci Rep. (1993) 18:202–71. doi: 10.1016/0167-5729(93)90025-K
2. Woodruff DP. Normal incidence X-ray standing wave determination of adsorbate structures. Prog Surf Sci. (1998) 57:1–60. doi: 10.1016/S0079-6816(98)00012-4
3. Hauschild A, Karki K, Cowie BCC, Rohlfing M, Tautz FS, Sokolowski M. Molecular distortions and chemical bonding of a large π-conjugated molecule on a metal surface. Phys Rev Lett. (2005) 94:036106. doi: 10.1103/PhysRevLett.94.036106
4. Mercurio G, Bauer O, Willenbockel M, Fairley N, Reckien W, Schmitz CH, et al. Adsorption height determination of nonequivalent C and O species of PTCDA on Ag(110) using x-ray standing waves. Phys Rev B (2013) 87:045421. doi: 10.1103/PhysRevB.87.045421
5. Bauer O, Mercurio G, Willenbockel M, Reckien W, Schmitz CH, Fiedler B, et al. Role of functional groups in surface bonding of planar π-conjugated molecules. Phys Rev B (2012) 86:235431. doi: 10.1103/PhysRevB.86.235431
6. Sugiyama M, Maeyama S, Heun S, Oshima M. Chemical-state-resolved x-ray standing-wave analysis using chemical shift in photoelectron spectra. Phys Rev B (1995) 51:14778–81. doi: 10.1103/PhysRevB.51.14778
7. Jackson GJ, Cowie BCC, Woodruff DP, Jones RG, Kariapper MS, Fisher C, et al. Atomic quadrupolar photoemission asymmetry parameters from a solid state measurement. Phys Rev Lett. (2000) 84:2346–9. doi: 10.1103/PhysRevLett.84.2346
8. Kröger I, Stadtmüller B, Kleimann C, Rajput P, Kumpf C. Normal-incidence x-ray standing-wave study of copper phthalocyanine submonolayers on Cu(111) and Au(111). Phys Rev B (2011) 83:195414. doi: 10.1103/PhysRevB.83.195414
9. Gerlach A, Schreiber F, Sellner S, Dosch H, Vartanyants IA, Cowie BCC, et al. Adsorption-induced distortion of F16CuPc on Cu(111) and Ag(111): an x-ray standing wave study. Phys Rev B (2005) 71:205425. doi: 10.1103/PhysRevB.71.205425
10. Henze SKM, Bauer O, Lee TL, Sokolowski M, Tautz F. Vertical bonding distances of PTCDA on Au(111) and Ag(111): relation to the bonding type. Surf Sci. (2007) 601:1566–73. doi: 10.1016/j.susc.2007.01.020
11. Stadler C, Hansen S, Pollinger F, Kumpf C, Umbach E, Lee TL, et al. Structural investigation of the adsorption of SnPc on Ag(111) using normal-incidence x-ray standing waves. Phys Rev B (2006) 74:035404. doi: 10.1103/PhysRevB.74.035404
12. Kröger I, Stadtmüller B, Stadler C, Ziroff J, Kochler M, Stahl A, et al. Submonolayer growth of copper-phthalocyanine on Ag(111). New J Phys. (2010) 12:083038. doi: 10.1088/1367-2630/12/8/083038
13. Romaner L, Heimel G, Brédas JL, Gerlach A, Schreiber F, Johnson RL, et al. Impact of bidirectional charge transfer and molecular distortions on the electronic structure of a metal-organic interface. Phys Rev Lett. (2007) 99:256801. doi: 10.1103/PhysRevLett.99.256801
14. Yamane H, Gerlach A, Duhm S, Tanaka Y, Hosokai T, Mi YY, et al. Site-specific geometric and electronic relaxations at organic-metal interfaces. Phys Rev Lett. (2010) 105:046103. doi: 10.1103/PhysRevLett.105.046103
15. Gerlach A, Hosokai T, Duhm S, Kera S, Hofmann OT, Zojer E, et al. Orientational ordering of nonplanar phthalocyanines on Cu(111): strength and orientation of the electric dipole moment. Phys Rev Lett. (2011) 106:156102. doi: 10.1103/PhysRevLett.106.156102
16. Kariapper M, Fisher C, Woodruff D, Chan A, Jones RG. Structure determination of PF3 adsorption on Cu(100) using X-ray standing waves. Surf Sci. (2008) 602:650–9. doi: 10.1016/j.susc.2007.11.025
17. Chaudhuri A, Odelius M, Jones RG, Lee TL, Detlefs B, Woodruff DP. The structure of the Au(111)/methylthiolate interface: new insights from near-edge x-ray absorption spectroscopy and x-ray standing waves. J Chem Phys. (2009) 130:124708. doi: 10.1063/1.3102095
18. Basham M, Bennett RA. Solving surface structures from normal incidence x-ray standing wave data. Comp Phys Commun. (2007) 177:459–66. doi: 10.1016/j.cpc.2007.05.006
21. Yu Y, Nakano M, Ikeda T. Photomechanics: directed bending of a polymer film by light. Nature (2003) 425:145. doi: 10.1038/425145a
22. Liu ZF, Hashimoto K, Fujishima A. Photoelectrochemical information storage using azobenzene derivative. Nature (1990) 347:658. doi: 10.1038/347658a0
23. Kolpak AM, Grossman JC. Azobenzene-functionalized carbon nanotubes as high-energy density solar thermal fuels. Nano Lett. (2011) 11:3156–62. doi: 10.1021/nl201357n
24. Birnbaum PP, Style DWG. The photo-isomerization of some azobenzene derivatives. Trans Faraday Soc. (1954) 50:1192–6. doi: 10.1039/TF9545001192
25. Hugel T, Holland NB, Cattani A, Moroder L, Seitz M, Gaub HE. Single-molecule optomechanical cycle. Science (2002) 296:1103. doi: 10.1126/science.1069856
26. Böckmann M, Doltsinis NL, Marx D. Nonadiabatic hybrid quantum and molecular mechanic simulations of azobenzene photoswitching in bulk liquid environment. J Phys Chem A (2010) 114:745–54. doi: 10.1021/jp910103b
27. Tegeder P. Optically and thermally induced molecular switching processes at metal surfaces. J Phys. (2012) 24:394001. doi: 10.1088/0953-8984/24/39/394001
28. Wolf M, Tegeder P. Reversible molecular switching at a metal surface: a case study of tetra-tert-butyl-azobenzene on Au(111). Surf Sci. (2009) 603:1506–17. doi: 10.1016/j.susc.2008.11.049
29. Maurer RJ, Reuter K. Bistability loss as a key feature in azobenzene (non-)switching on metal surfaces. Angew Chem Int Ed Engl. (2012) 51:12009–011. doi: 10.1002/anie.201205718
30. Choi BY, Kahng SJ, Kim S, Kim H, Kim HW, Song YJ, et al. Conformational molecular switch of the azobenzene molecule: a scanning tunneling microscopy study. Phys Rev Lett. (2006) 96:156106. doi: 10.1103/PhysRevLett.96.156106
31. Comstock MJ, Levy N, Kirakosian A, Cho J, Lauterwasser F, Harvey JH, et al. Reversible photomechanical switching of individual engineered molecules at a metallic surface. Phys Rev Lett. (2007) 99:038301. doi: 10.1103/PhysRevLett.99.038301
32. Bronner C, Schulze M, Hagen S, Tegeder P. The influence of the electronic structure of adsorbate-substrate complexes on photoisomerization ability. New J Phys. (2012) 14:043023. doi: 10.1088/1367-2630/14/4/043023
33. Mercurio G, McNellis ER, Martin I, Hagen S, Leyssner F, Soubatch S, et al. Structure and energetics of azobenzene on Ag(111): benchmarking semiempirical dispersion correction approaches. Phys Rev Lett. (2010) 104:036102. doi: 10.1103/PhysRevLett.104.036102
34. Mercurio G, Maurer RJ, Liu W, Hagen S, Leyssner F, Tegeder P, et al. Quantification of finite-temperature effects on adsorption geometries of π-conjugated molecules: azobenzene/Ag(111). Phys Rev B (2013) 88:035421. doi: 10.1103/PhysRevB.88.035421
35. Woodruff DP, Seymour DL, McConville CF, Riley CE, Crapper MD, Prince NP, et al. Simple x-ray standing-wave technique and its application to the investigation of the Cu(111) R30°-Cl structure. Phys Rev Lett. (1987) 58:1460–2. doi: 10.1103/PhysRevLett.58.1460
36. Woodruff D, Seymour D, McConville C, Riley C, Crapper M, Prince N, et al. A simple x-ray standing wave technique for surface structure determination - theory and an application. Surf Sci. (1988) 195:237–54. doi: 10.1016/0039-6028(88)90794-7
37. Fairley N. CasaXPS, Version 2.3.16, Casa Software Ltd, Bay House, 5 Grosvenor Terrace, Teignmouth, Devon TQ14 8NE, UK (2012).
38. Mercurio G. Study of Molecule-Metal Interfaces by Means of the Normal Incidence X-ray Standing Wave Technique, PhD thesis, Schriften des Forschungszentrums Jülich, Reihe Schlüsseltechnologien Vol. 49 (Dissertation, RWTH Aachen University) Available online at: http://www.fz-juelich.de/zb/juwel (2012).
39. Vartanyants IA, Zegenhagen J. Photoelectric scattering from an X-ray interference field. Solid State Commun. (1999) 113:299–20. doi: 10.1016/S0038-1098(99)00399-3
40. Lee JJ, Fisher CJ, Woodruff DP, Roper MG, Jones RG, Cowie BCC. Non-dipole effects in photoelectron-monitored X-ray standing wave experiments: characterisation and calibration. Surf Sci. (2001) 494:166–82. doi: 10.1016/S0039-6028(01)01481-9
41. Trzhaskovskaya MB, Nefedov VI, Yarzhemsky VG. Photoelectron angular distribution parameters for elements Z = 1 to Z = 54 in the photoelectron energy range 100-5000 eV. At Data Nucl Data Tables (2001) 77:97–159. doi: 10.1006/adnd.2000.0849
42. Jablonski A, Salvat F, Powell CJ. NIST Electron Elastic-Scattering Cross-Section Database, Tech. Rep. (Version 3.1, National Institute of Standards and Technology, Gaithersburg, MD) (2003).
43. Lindberg BJ. Molecular spectroscopy by means of ESCA, VI. Group shifts for N, P and as compounds. Chem Scr. (1975) 7:155–66.
44. Brant P, Feltham RD. X-ray photoelectron spectra of aryldiazo derivatives of transition metals. J Organomet Chem. (1976) 120:C53–7. doi: 10.1016/S0022-328X(00)98062-8
45. Leiro J, Minni E, Suoninen E. Study of plasmon structure in XPS spectra of silver and gold. J Phys F Met Phys. (1983) 13:215. doi: 10.1088/0305-4608/13/1/024
46. Vartanyants I, Lee TL, Thiess S, Zegenhagen J. Non-dipole effects in X-ray standing wave photoelectron spectroscopy experiments. Nucl Instrum Methods Phys Res Sect A (2005) 547:196–207. doi: 10.1016/j.nima.2005.05.025
47. McNellis ER, Mercurio G, Hagen S, Leyssner F, Meyer J, Soubatch S, et al. Bulky spacer groups - A valid strategy to control the coupling of functional molecules to surfaces? Chem Phys Lett. (2010) 499:247–9. doi: 10.1016/j.cplett.2010.09.051
48. McNellis E, Meyer J, Baghi AD, Reuter K. Stabilizing a molecular switch at solid surfaces: a density functional theory study of azobenzene on Cu(111), Ag(111), and Au(111). Phys Rev B (2009) 80:035414. doi: 10.1103/PhysRevB.80.035414
49. McNellis ER, Meyer J, Reuter K. Azobenzene at coinage metal surfaces: role of dispersive van der Waals interactions. Phys Rev B (2009) 80:205414. doi: 10.1103/PhysRevB.80.205414
50. McNaught AD, Wilkinson A. IUPAC. Compendium of Chemical Terminology, 2nd Edn. Oxford: Blackwell Scientific Publications (1997).
51. Tiago ML, Ismail-Beigi S, Louie SG. Photoisomerization of azobenzene from first-principles constrained density-functional calculations. J Chem Phys. (2005) 122:094311. doi: 10.1063/1.1861873
52. Maurer RJ, Reuter K. Assessing computationally efficient isomerization dynamics: ΔSCF density-functional theory study of azobenzene molecular switching. J Chem Phys. (2011) 135:224303. doi: 10.1063/1.3664305
53. Miwa JA, Weigelt S, Gersen H, Besenbacher F, Rosei F, Linderoth TR. Azobenzene on Cu(110): adsorption site-dependent diffusion. J Am Chem Soc. (2006) 128:3164–5. doi: 10.1021/ja058413t
54. Alemani M, Peters MV, Hecht S, Rieder KH, Moresco F, Grill L. Electric field-induced isomerization of azobenzene by STM. J. Am. Chem. Soc. (2006) 128:14446–7. doi: 10.1021/ja065449s
55. Óvári L, Wolf M, Tegeder P. Reversible changes in the vibrational structure of tetra-tert-butylazobenzene on a Au(111) surface induced by light and thermal activation. J Phys Chem C (2007) 111:15370–4. doi: 10.1021/jp075274o
56. Schmidt R, Hagen S, Brete D, Carley R, Gahl C, Dokic J, et al. On the electronic and geometrical structure of the trans- and cis-isomer of tetra-tert-butyl-azobenzene on Au(111). Phys Chem Chem Phys. (2010) 12:4488–97. doi: 10.1039/B924409C
57. Hagen S, Leyssner F, Nandi D, Wolf M, Tegeder P. Reversible switching of tetra-tert-butyl-azobenzene on a Au(111) surface induced by light and thermal activation. Chem Phys Lett. (2007) 444:85–90. doi: 10.1016/j.cplett.2007.07.005
58. Tegeder P, Hagen S, Leyssner F, Peters M, Hecht S, Klamroth T, et al. Electronic structure of the molecular switch tetra-tert-butyl-azobenzene adsorbed on Ag(111). Appl Phys A Mater Sci Process. (2007) 88:465–72. doi: 10.1007/s00339-007-4047-0
59. Woodruff DP. Surface structure determination using x-ray standing waves. Rep Prog Phys. (2005) 68:743. doi: 10.1088/0034-4885/68/4/R01
60. Tkatchenko A, Scheffler M. Accurate molecular van der waals interactions from ground-state electron density and free-atom reference data. Phys Rev Lett. (2009) 102:073005. doi: 10.1103/PhysRevLett.102.073005
Keywords: NIXSW, NIXSW simulations, adsorption geometry, azobenzene, Ag(111), XPS, molecular vibrations
Citation: Mercurio G, Maurer RJ, Hagen S, Leyssner F, Meyer J, Tegeder P, Soubatch S, Reuter K and Tautz FS (2014) X-ray standing wave simulations based on Fourier vector analysis as a method to retrieve complex molecular adsorption geometries. Front. Physics 2:2. doi: 10.3389/fphy.2014.00002
Received: 05 November 2013; Accepted: 06 January 2014;
Published online: 28 January 2014.
Edited by:
Nicholas X. Fang, Massachusetts Institute of Technology, USAReviewed by:
Sahraoui Chaieb, King Abdullah University of Science and Technology, Saudi ArabiaYuki Sato, Rowland Institute at Harvard, USA
Copyright © 2014 Mercurio, Maurer, Hagen, Leyssner, Meyer, Tegeder, Soubatch, Reuter and Tautz. This is an open-access article distributed under the terms of the Creative Commons Attribution License (CC BY). The use, distribution or reproduction in other forums is permitted, provided the original author(s) or licensor are credited and that the original publication in this journal is cited, in accordance with accepted academic practice. No use, distribution or reproduction is permitted which does not comply with these terms.
*Correspondence: Giuseppe Mercurio, Center for Free-Electron Laser Science, University of Hamburg, Luruper Chaussee 149, 22761 Hamburg, Germany e-mail: giuseppe.mercurio@desy.de