Systematic study of intermediate-scale structures of equatorial plasma irregularities in the ionosphere based on CHAMP observations
 Hermann Lühr
 Chao Xiong
 Jaeheung Park1
 - 1GFZ, German Research Centre for Geosciences, Potsdam, Germany
- 2Department of Space Physics, College of Electronic Information, Wuhan University, Wuhan, China
Equatorial spread-F ionospheric plasma irregularities on the night-side, commonly called equatorial plasma bubbles (EPB), include electron density variations over a wide range of spatial scales. Here we focus on intermediate-scale structures ranging from 100 m to 10 km, which play an important role in the evolution of EPBs. High-resolution CHAMP magnetic field measurements sampled along north–south track at 50 Hz are interpreted in terms of diamagnetic effect for illustrating the details of electron density variations. We provide the first comprehensive study on intermediate-scale density structures associated with EPBs, covering a whole solar cycle from 2000 to 2010. The large number of detected events, almost 9000, allows us to draw a detailed picture of the plasma fine structure. The occurrence of intermediate-scale events is strongly favored by high solar flux. During times of F10.7 <100 sfu practically no events were observed. The longitudinal distribution of our events with respect to season or local time agrees well with that of the EPBs, qualifying the fine structure as a common feature, but the occurrence rates are smaller by a factor of 4 during the period 2000–2005. Largest amplitude electron density variations appear at the poleward boundaries of plasma bubbles. Above the dip-equator recorded amplitudes are small and fall commonly below our resolution. Events can generally be found at local times between 19 and 24 LT, with a peak lasting from 20 to 22 LT. The signal spectrum can be approximated by a power law. Over the frequency range 1–25 Hz we observe spectral indices between −1.4 and −2.6 with peak occurrence rates around −1.9. There is a weak dependence observed of the spectral index on local time. Toward later hours the spectrum becomes shallower. Similarly for the latitude dependence, there is a preference of shallower spectra for latitudes poleward of the ionization anomaly crest. Our data suggest that the generation of small plasma structures is part of the early stage EPB development, during times when the vertical plasma drift surpasses a certain threshold.
Introduction
The low-latitude ionosphere is known to become unstable during the hours past sunset. Resulting localized regions of plasma density depletions, hereafter called equatorial plasma bubbles (EPB), are a product of electron density irregularities initiated by interchange instabilities on the bottom-side of the equatorial F-layer. EPBs have been a subject of intense research for several decades, but there are still deficits in a complete understanding of the involved processes. This is partly due to limitations in detailed observations. Due to scintillation of trans-ionospheric radio waves such as GPS signals by EPBs the interest in further studies is still high.
These plasma irregularities involve processes at various scale lengths. The bubbles themselves have horizontal sizes of order 100 km. Intermediate-scale plasma structures (10 km–100 m) represent an important part of EPBs. Irregularities in this range are primarily responsible for the disturbance of radio waves in the very high frequency (VHF) range [e.g., 1]. Density variations with wavelengths less than 100 m are commonly termed small-scale structures. They affect more L-band transmissions. The general characteristics of these scales within an EPB have been derived from radar observations [e.g., 2], but also from in situ satellite observations [e.g., 3–6]. In particular the ROCSAT-1 satellite with its high sampling rate of up to 1024 Hz provided a complete view of the full EPB spectral characteristics down to wavelength of 15 m [e.g., 4]. An important result from ROCSAT-1 measurements was that the electron density spectrum can be approximated by a power law with piecewise constant spectral indices. There is a marked change in spectral slope around 80 m wavelength. This breakpoint is commonly used as a demarcation between intermediate and small-scale structures. Unfortunately, the high sampling rate was operated on ROCSAT-1 only for short times, just providing snapshots of the plasma structures.
Another way to study the different scale features is provided by ground receivers monitoring the scintillation of VHF, UHF or L-band radio signals from satellites [e.g., 1, 7, 8]. The inherent limitation of that method is of course the confinement of observations to small regions in the ionosphere around the receivers.
There have been appreciable attempts to model the characteristics and dynamics of EPBs. Recent examples of 3-dimentional models are, [e.g., 9–11]. In spite of their impressive results these models are not able to resolve density structures smaller than 10 km. Important progress in that respect has been achieved by the high-resolution 3-D model of Dao et al. [12]. These authors managed to go down to sub-kilometer scales and resolve temporal variations to fractions of a millisecond. Unfortunately, the code is presently too expensive to simulate the evolution of plasma bubbles over longer times, e.g., hours.
In this study we present the first comprehensive global survey of intermediate-scale plasma density structures in EPBs. The transverse wavelengths we are covering range from 150 m to 10 km. Our investigations are based on the high-resolution 50 Hz magnetic field measurements of the CHAMP satellite. The observation time covers a full solar cycle from 2000 to 2010. CHAMP on its near-polar, low-Earth orbit traverses EPBs in meridional direction. This is different from most of the previously published observations. The majority of satellites considered for scale analysis of plasma irregularities (e.g., AE-E, ROCSAT-1, C/NOFS) had low inclination orbits, thus sampled the bubbles in zonal direction. Similarly with the ground receivers, due to the eastward drift of the irregularities, time series of those observations represent also zonal cuts.
The aim of our investigations is to find out the typical characteristics of intermediate-scale plasma structures and compile a climatology of their occurrences. The derived detailed picture of that phenomenon may help to identify the processes responsible for the structuring.
In the sections to follow we will first present the data used and describe the analysis applied for evaluation. In Observations the dependences of the observed plasma structures on various parameters are shown. In Discussion we will discuss our observations in the context of earlier reports. Important findings are summarized in the end.
Instrumentation and Data Processing
The Champ 50 HZ Data
The CHAMP satellite, launched in July 2000, circled the Earth on a polar orbit [13]. The initial altitude was about 450 km, decreasing slowly to 250 km at the time of atmospheric re-entry in September 2010. Among other payloads CHAMP carried a flux-gate magnetometer (FGM) measuring the three geomagnetic vector components at a rate of 50 Hz. The noise level of the FGM data is less than 0.01 nT root-mean-square (RMS) within the frequency range 1–25 Hz. The FGM has an anti-aliasing filter in the input for rejecting high-frequency signal. This filter has its −3 dB cut-off frequency at 13.5 Hz. The transfer function, V, of this order 3 Bessel low-pass filter can be described analytically:
where f is the frequency of the input signal. Later in the process we make use of the transfer function for correcting the recorded spectra at the high-frequency end.
In addition we consider data from the Planar Langmuir Probe (PLP) that takes readings of the electron density and temperature every 15 s.
In this study we use the 50 Hz FGM data as recorded in the sensor coordinate system. For plasma wave analysis it is appropriate to interpret magnetic field data in the mean-field-aligned (MFA) frame. MFA coordinates are defined as follows: the z component (hereafter “parallel” component) is aligned with the mean field, the y component (hereafter “zonal” component) is perpendicular to the mean field and parallel to the horizontal plane (pointing eastward), and the x component (hereafter “meridional” component) completes the triad, pointing outward. For the transformation of magnetic field data in sensor coordinates to the MFA frame we have used the same approach as described in Park et al. [14]. In the MFA frame the two transverse components are usually small outside the auroral oval. The z component reflects practically the total field variation.
Of particular interest for this study is the parallel component. Before starting the interpretation of these data we subtract the main field strength. For this purpose a high-degree geomagnetic field model (POMME-6, [15]) is used. The resulting residuals are subject of further analysis. As a next step we apply a Fourier transform (FFT) to the detrended parallel component residuals within a moving window of 1024 data points (approximately 20 s long). This returns a spectrum over 25 Hz with a frequency resolution of about 0.05 Hz. The FFT window is moved forward in 10 s steps, providing some signal overlap. As a result we get dynamic spectra over all the 10 years. Thanks to the low-noise environment on CHAMP, global surveys of spectral features at the lower end of the ELF (extreme low frequency) range can be performed with unprecedented resolution.
The Diamagnetic Effect
We make use of magnetic field measurements for sensing the small-scale plasma density variations inside of EPBs. The high sampling rate of 50 Hz allows us to study the spatial details. For plasma structures much smaller than the geomagnetic field curvature radius the linear relation between field strength change and plasma density variation, as presented by Lühr et al. [16], can be used
where ΔB is the diamagnetic effect and B the ambient field strength, n is the number density, k the Boltzmann constant, μ0 is the susceptibility of free space, Ti and Te are the ion and electron temperatures. Over the small spatial scales considered here the plasma temperatures can be assumed constant. It has to be noted that the scaling factor between magnetic field and plasma is inversely proportional to the ambient field strength. For typical night-time values, (Ti + Te) = 2000 K and B = 30000 nT, we obtain with Equation (2), Δn = 0.8 · 1012 m3/nT.
Observations
In this study we focus on variations of the field strength in the frequency range 1 to 25 Hz. This band is known to be rather void of natural compressional magnetic field signal outside the auroral oval. Signals observed by CHAMP in this band can commonly be related to passages through small plasma structures, in our case 300 m–7.5 km along-track. Since the satellite flies straight north-south the meridional structure of the irregularity is sampled. This promises to provide new aspects of plasma structures different from results obtained by low-latitude satellites like ROCSAT-1 or C/NOFS.
Examples
Two examples of CHAMP night-side passes from the southern to the northern hemisphere are presented in Figure 1. In the top panel we see time series of the residual total field variations. The longer period variations may be related to Pc3 [e.g., 17] or Pi2 [e.g., 18] pulsations. Besides that there are clearly confined ranges of high-frequency bursts. These are of special interest here. The panel below shows FFT dynamic spectra of the magnetic signal processed in the way as described above. The broad-band nature of the bursty signal is quite evident, well distinguishable from the neighboring signal. In the third panel a spectral amplitude index is plotted. It reflects the sum of amplitude-times-frequency values of all FFT harmonics within the range from 3 to 25 Hz, and it is named “integrated spectral amplitude” (ISA). The ISA-value is computed as:
where a and b are the Fourier coefficients in units of nT related to the considered harmonics, Δf is the frequency increment of 0.05 Hz, N = 440 is the number of harmonics from 3 to 25 Hz, and Q = 2.83 is a normalization factor making the ISA value comparable to a signal amplitude in pT. The noise level of the magnetometer varies commonly between 4 and 5 units. Any value above the noise can be considered as true signal. Since we relate our magnetic signatures to plasma irregularities, electron density measurements obtained with the PLP are shown in the bottom panel, for reference. There is a clear one-to-one relation between regions of plasma depletions and broadband magnetic signatures as reported earlier [e.g., 19]. The CHAMP PLP data sampled every 15 s are by far too coarse to reflect any fine structure of the EPBs. They just show the large-scale low latitude electron density distribution.
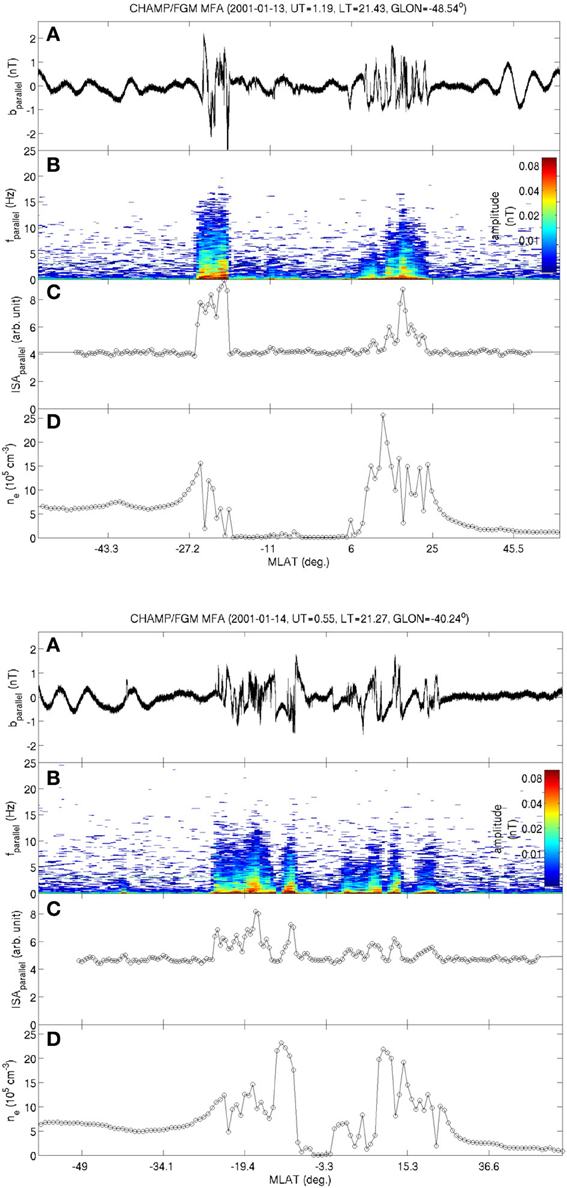
Figure 1. Two examples for observed intermediate-scale plasma structure events. Panel (A) shows the time series of parallel component magnetic field variations. High-frequency fluctuations are caused by rapid passages through plasma fine structures. Panel (B) contains dynamic spectra of the B-field signal; (C) presents the integrated spectral amplitude, ISA, which is used for selecting events. For reference the large-scale electron density distribution is shown in panel (D). Fine-structures generally coincide with plasma depletions.
Statistical Analysis
After having presented two examples we want to investigate the characteristics of the small-scale structure in more details with the help of a statistical study. Our approach of identifying spectra that can be related to intermediate-scale plasma structures is based on the ISA index, as shown in the third panel of Figure 1. An automated selection procedure has been designed that checked all the more than 110,000 CHAMP equator passes during the mission from August 2000 to September 2010.
For the identification of EPB-related broadband spectra we consider a latitude range of ±40° magnetic latitude (MLat) on the night side (18 – 05 LT). In order to determine locally the signal noise level we compute for each pass the median of the ISA values over the considered latitude range. It generally varies between 4 and 5 units. All spectra with ISA values larger than the noise value plus 1 unit are considered as events. Selected broadband spectra are compiled in an event list and completed by supporting information like time, location, amplitude, etc. In order to avoid contamination by other effects during magnetic storms we have rejected events from times with Kp > 3.5. The resulting list containing some 8850 entries is a good basis for our statistical study.
It is well known and confirmed by Xiong et al. [20] that structured EPBs occur preferably during times of high extreme ultraviolet (EUV) solar flux. For checking that we have divided the CHAMP mission period into two 5 years parts, August 2000 to 2005 and August 2005 to 2010. Five years are just the time that is needed for CHAMP to provide even local time coverage in all seasons. The first period coincides well with the solar maximum phase (average solar flux index, F10.7 = 145 ± 44 sfu), while the latter covers the deep and extended solar minimum with an average solar flux index of F10.7 = 76 ± 16 sfu. This contrast is also well reflected by our event list. We find 8706 events during the years 2000–2005 and only 144 in the second period. Due to this fact we consider in the following only the active first 5 years for our analysis. The low event number of the later time period is not sufficient for a significant statistic. During the first 5 years of the CHAMP mission the altitude of the circular orbit decreased from 450 to 360 km. Simultaneous with the orbital decay also the solar activity went down. As a consequence CHAMP observed a more or less constant electron density. Figure 1 of Stolle et al. [21] shows that the average equatorial plasma density distribution along the CHAMP orbit did not change much in character and decreased only by a factor of 1.5 over the considered 5 years.
It is common practice to present the climatology of EPB occurrences. Similar to previous publications we show in Figure 2 the seasonal/longitudinal distribution of the event occurrence rate of our fine-structured EPBs. Here events are sorted into bins with sizes of one month by 15° in longitude. We obtain the well-know distribution: highest rates around December solstice in the South American—Atlantic region, enhanced rates over Africa and the Pacific around June solstice, and EPB activity at almost all longitudes during equinox seasons. The latter is in particular true for autumn equinox. The distribution obtained here resembles very much the EPB distribution shown by Xiong et al. [20] in their Figure 3, upper left. Another aspect of occurrence rates is the local time vs. longitude distribution. In this case we have divided the events by the three Lloyd seasons. As can be seen in Figure 3, most of the events occur between 20 and 22 LT. Interestingly, over Africa the occurrence rate peaks more than an hour later, between 22 and 23 LT, during June solstice. Otherwise we find again the above described seasonal distribution with highest rates over South America and the Atlantic around December solstice. All the features reported here are much in line with the local time distribution of EPB rates as shown by Stolle et al. [2, 21] in their Figure 7. The commonality of the occurrence distributions between EPBs and broadband spectra suggests that intermediate-scale irregularities are a common feature of plasma bubbles at 400 km altitude during solar maximum years.
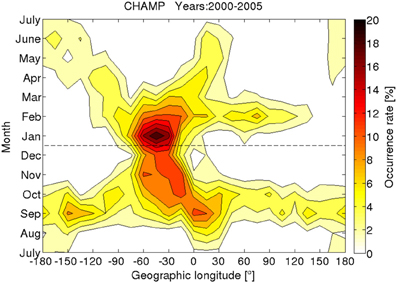
Figure 2. The seasonal/longitudinal distribution of intermediate-scale plasma structure occurrence rates.
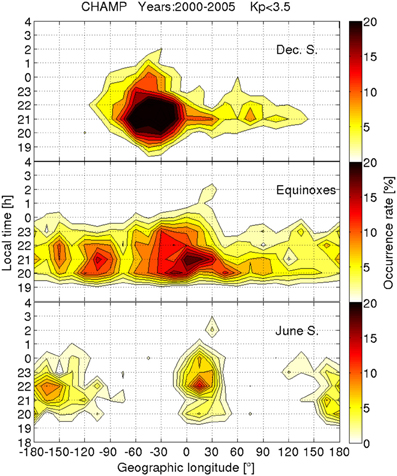
Figure 3. Longitudinal variation of the local time dependence of plasma fine structures separately for the three Lloyd seasons.
Xiong et al. [20] reported that EPB-related features of several tens of kilometers are more common in certain regions than in others. For that reason we checked how the occurrence rate of our intermediate-scale events is distributed in latitude and longitude. In Figure 4 we see that most of the events are found in the longitude range of −70 to 50° GLon. Particularly low rates are observed in the sector 90–150° GLon. The latitude distribution peaks at about 15° MLat in both hemispheres. This is about 4° in latitude poleward of the peak in large-scale bubble distribution. All these findings are in line with the reports of Xiong et al. [20] on smaller scale EPB structures.
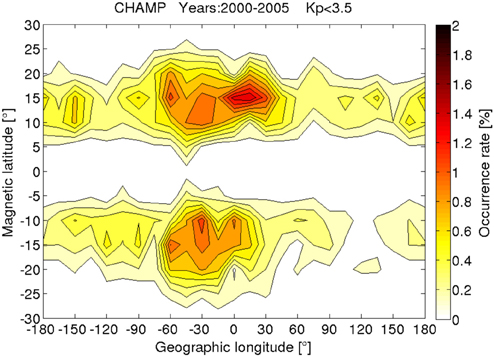
Figure 4. Global distribution of intermediate-scale plasma structures. The peak in occurrence rate coincides with the crest of the equatorial ionization anomaly.
Another feature that we investigate is the signal amplitude of our plasma irregularities. As a reference we use the Fourier amplitude at 5 Hz for all our events. The obtained longitude vs. magnetic latitude distribution of mean amplitudes averaged within 5° MLat by 15° GLon bins is shown in Figure 5. Largest signal amplitudes are commonly observed within latitude bands some 15–20° off the magnetic equator, and in the southern hemisphere partly ever further away. This is several degrees poleward of the equatorial ionization anomaly (EIA) crest and also poleward of the EPB occurrence peak. In particular at the poleward edges the EPBs seem to be highly structured. A typical example for the wave amplitude distribution over latitude is the one in the top part of Figure 1. Over the longitude range −60 to 60°E signal amplitudes are larger in the southern hemisphere. This asymmetry, obvious in Figure 5, can well be explained by the ambient magnetic field strength that enters Equation (2) as scaling factor and which is weaker over the considered latitude range by 20–30% in the southern EIA region than in the northern EIA.
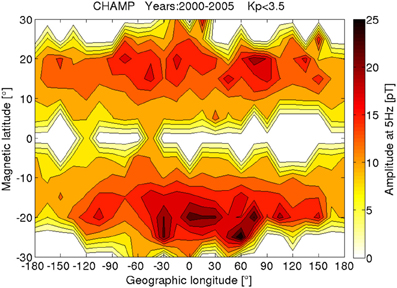
Figure 5. Amplitude distribution of plasma density variations. Largest intermediate-scale density fluctuations are observed at the poleward edges of the plasma bubbles.
Properties of Signal Spectral
Earlier studies have addressed the spectral characteristics of the spatial scales involved in irregularities [e.g., 5]. For that reason we also determined the spectral indices of our events. Every selected event represents a spectrum over 20 s or a latitudinal range of 150 km. Before determining the slope we correct for the filter effect at the high frequency end, using the function given in Equation (1). Figure 6 presents for one equator crossing in the top part a latitude profile of the ISA. Three events are marked by red circles. For them detailed spectra are shown in the frames below. The upper two spectra show an example for a large and for a small-amplitude event (see red circles in top frame). In both cases we observe spectra with negative slopes. For the small-amplitude event some signal increase is observed at the high frequency end due to an amplification of the instrument noise by the removal of the filter effect. In a next step we determine the spectral index over the frequency range 1–22.5 Hz. First we average the wave power within nine logarithmically spaced frequency bins and then perform a linear line-fitting in the log-log frame. In the lower part of Figure 6 the bin averages are plotted onto the spectra as red dots and the resulting linear fit as dashed blue line. Obtained spectral indices are listed in the frames. In case of the strong event the wave power rolls off as 1/f1.7. The weak event exhibits a somewhat shallower slope. We suggest that this smaller spectral index is partly caused by instrument noise at the high-frequency end. The bottom frame of Figure 6 presents the noise spectrum of the 50 Hz FGM data taken at a time of no natural signal (see red circle on right side in top frame). Over the frequency range of interest (1–25 Hz) the spectrum is flat. From the power level of the linear fit we can deduce a noise amplitude of about 3 pT. This magnetic field value corresponds according to Equation (2) to a resolution in electron density of Δn ≈ 2.5 · 109 m3. Fortunately, most of the presented events have larger amplitudes and thus are well resolved.
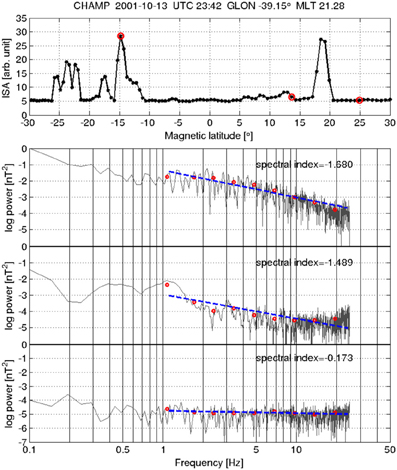
Figure 6. Spectral properties of three events marked by red circles in the top frame. The spectra are approximated by a power law (blue dashed line). The top spectrum is from a large event, in the middle an example of a small-amplitude event is shown, where the high-frequency part is contaminated by noise. The bottom panel represents a noise spectrum.
Some properties of the spectral index are presented in Figure 7. The power spectral density, PSD, is assumed to follow a power law with frequency, f:
where a0 is the signal power at 1 Hz and S the spectral index. The top frame of Figure 7 shows the relation between signal amplitude at 5 Hz and spectral index. Most of the obtained values vary around a slope of −2. Slopes shallower than −1 are all confined to small-signal events (<10 pT @ 5 Hz). They are probably contaminated by instrument noise. For spectral amplitudes larger than 15 pT at 5 Hz the slopes are within the range −1.4 to −2.6. These larger signals seem to be unaffected and represent the actual distribution.
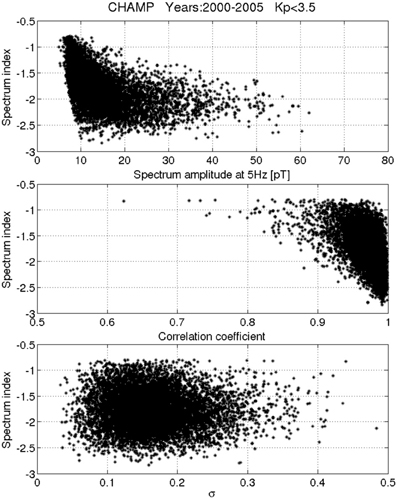
Figure 7. Quality properties of the intermediate-scale spectral indices. The top frame shows the dependence of the index on signal amplitude, the middle frame the quality of linear correlation for the different index values, and at the bottom a possible dependence of the index value on the data point scatter, σ, contributing to the line fit. Almost all the events with correlation coefficients less than 0.9 have small amplitudes (<15 pT @ 5 Hz).
For checking the reliability of the obtained spectra we determined the quality of our linear fits. For all the events the correlation coefficients between frequency and wave power was calculated. As can be seen in the middle frame of Figure 7, we generally obtain very good linear correlations in a log–log frame over the frequency range 1–25 Hz. The vast majority of the cases having correlation coefficients less than 0.9 are small-amplitude events (<15 pT @ 5 Hz). In those cases the instrument noise at the high-frequency end starts to degrade the slope determination, as illustrated in Figure 6.
In addition to the quality of the linear relation we also checked the absolute scatter of the 9 frequency bin averages. In the bottom panel of Figure 7 the standard deviation, σ, of the points about the line fit is presented. The σ-values are distributed quite evenly over the whole range of observed spectral indices. As a mean value we find σ = 0.16. This has to be compared with the considered frequency range on logarithmic scale (1–25 Hz ≥ 1.4). From the ratio between these two numbers we can conclude that the uncertainty of the derived spectral index is typically of the order of 10% and there is not much dependence of the uncertainty on the steepness of the spectrum.
Besides these more technical issues it is interesting to see how the indices are distributed in local time. This is shown in Figure 8, top frame. As mentioned earlier, a majority of the events occurs within the time sector 20 to 22 LT. The most frequently observed spectral index varies around −1.9 in that window. There is little dependence of the index on local time. We will revisit this issue in the discussion section. In the bottom frame of Figure 8 a possible dependence of the spectral index on magnetic latitude is shown. Also here we find only weak systematic features. The highest probability is found for an index around −1.9 occurring about 15° in latitude away from the dip equator in both hemispheres. This latitude coincides well with the locations of the ionization anomaly crests. In this case we might deduce a weak tendency of shallower slopes toward higher latitudes. The region close to the magnetic equator (±5° MLat) is practically free of intermediate-scale events. In the vicinity of the dip equator CHAMP flies more or less along the fluxtube thus cannot sample meridional plasma structures.
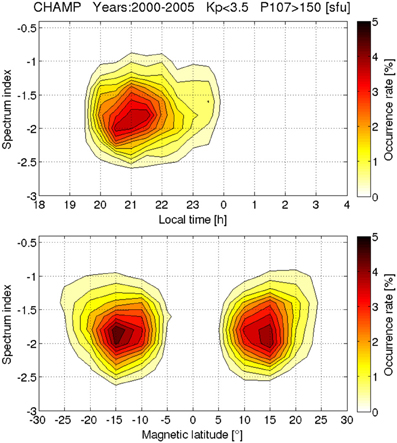
Figure 8. Properties of the intermediate-scale spectral indices. The top frame shows the dependence of the index on local time, and at the bottom the variation with magnetic latitude is displayed.
Discussion
In this paper we present a comprehensive survey of intermediate-scale spatial features in equatorial plasma irregularities. This study is different from earlier works in several aspects. Continuous observations over a full solar cycle (2000–2010) are presented from an altitude range around 400 km, thus close to the F-region peak. Most of the previous reports were based on longitudinal cuts through the irregularity regions. Here we present meridional profiles, which reflect the structuring at different McIlwain L-shells. Since the electric conductivity along magnetic field lines is very high, we can assume that these plasma structures are field-aligned and map across a range of altitudes. Thus, the height of observations is not of great concern, as long as they take place below the L-shell apex. Due to the fast motion of the satellite (7.6 km/s) we can assume the structures to be stationary over the period of 20 s used for computing the spectra. Each frequency of the spectrum can be related to a scale. In this way 1 Hz corresponds to about 7.5 km and 25 Hz to 300 m wavelength along the orbit. In addition we have to take into account the inclination of the geomagnetic field in order to obtain the transverse scale sizes. Since most of the events are observed around 15° MLat, the inclination varies around 30° implying that we achieve in this region a spatial resolution, transverse to the L-shells, of about 150 m.
Here we are using an indirect way of sampling the plasma density structures. As outlined in Equation (2), there exists a linear relation between variations in plasma density and magnetic field strength. However, the scaling factor between the two quantities is inversely proportional to the ambient magnetic field strength. This fact is mainly responsible for the differences in amplitudes between the events in the two hemispheres in particular over South America and the Atlantic, as shown in Figure 5. Several earlier studies investigated the relative electron density variations with respect to ambient density, i.e., ΔNe/Ne [e.g., 23]. Conversely, we show directly the amplitudes of density variations. Therefore, it is no surprise that in our case largest fluctuation amplitudes appear in the EIA crest region, and variation signals fall below our resolution in the deeply depleted equatorial region. This may be regarded as a limitation of the results presented here. But on the other hand, the large-amplitude intermediate-scale irregularities in the crest regions are most important for scintillation of VHF radio waves [e.g., 8]. Thus, our findings can be considered as relevant for practical purposes.
A particular strength of this study is the global and continuous data coverage with 50 Hz sampling over a full solar cycle. This paper has to be seen as part of a series of EPB-related studies bases on CHAMP magnetic field observations [e.g., 19–22, 24]. Here we add the intermediate-scale aspect to it. All the CHAMP and GRACE surveys of plasma irregularities found highest EPB occurrence rates at latitudes close to the ionization anomaly crest, not above the dip-equator as higher flying satellites like ROCSAT-1 and DMSP did. These differences in observation can be reconciled when assuming an alignment of the plasma bubbles with the L-shell. CHAMP observed highest EPB occurrence rates around 10° MLat, which corresponds to an apex height of about 600 km, the orbital altitude of ROCSAT-1. In this study we also find our plasma structures at latitudes away from the equator close to the anomaly crest. It is quite impressive to see how well the occurrence rate distribution of our intermediate-scale events resembles that of the EPBs in general. This is true for both, the seasonal/longitudinal distribution (compare our Figure 3 with [20]; Figure 3) and the local time vs. longitude distribution (compare our Figure 4 with [21, 22]; Figure 7). We may conclude that the spatial structuring is a general feature of equatorial plasma irregularity evolution. When comparing the occurrence frequencies for the time periods 2000–2005, however, we find intermediate-scale events at rates typically a factor of 4 lower. This ratio depends on environmental conditions. Xiong et al. [20] performed a scale analysis of EPBs and found a close relation between the apex height of the L-shell containing a bubble and the appearance of smaller plasma structures in CHAMP observations. In earlier studies Su et al. [25] and Stolle et al. [22] had shown that the height of EPBs is closely controlled by the solar EUV flux. From these relations we may conclude that during 25% of the considered time period (2000–2005) the F10.7 level was high enough to generate fine structures in plasma bubbles at CHAMP altitude. A closer inspection of the dependence on solar flux revealed that the large majority of our intermediate-scale events are from days with F10.7 >150 sfu. The mean solar flux level for all our detected events is about F10.7 = 185 sfu. On days with F10.7 < 100 sfu practically no events are found. This is the reason why we have so few detections during the second period (2005–2010), around solar minimum.
So far there are not many reports about high-resolution satellite plasma measurements within EPB. Su et al. [4] and Le et al. [5] presented results from short intervals of ROCSAT-1 burst mode measurements at 1024 Hz sampling. They interpreted some single EPBs in great detail. For example the spectrum presented by Le et al. [5] (their Figure 12) of a plasma depletion exhibits a spectral index of about −1.8 in the frequency range 1–100 Hz. Their result fits well into our most probable index range between −1.7 and −2.0 (see Figure 7).
The frequency range considered here is well below the break in spectral slope around 100 Hz (~80 m wavelength), as reported by several authors [e.g., 4, 5], where the small-scale structures start. We have looked into a possible dependence of the spectral slope on local time or latitude (see Figure 8). The confinement of the majority of intermediate-scale events to the time sector 20–22 LT suggests that our observations are related to the early stage of EPB development. Even the somewhat later events over Africa around June solstice (see Figure 4) fall into that category since the instability is initiated later there [see 22]. The slightly shallower spectra at later local times may be related to the decay of the perturbation electric field associated with the Rayleigh-Taylor instability. For confirming such a suggestion high-resolution 3-D modeling would be needed.
We observed spectral indices covering the range −1.4 to −2.2 with the highest probability occurring around −1.9. The slope may provide some information about the electrodynamics involved in the evolution of the density irregularity. According to [3] the governing processes are either controlled by ion/neutral collisions or by ion inertial effects. The authors show for a number of events (11) recorded by the DE-2 spacecraft that in cases when inertial effects become important the spectral index takes the value −5/3. This indicates a special type of inertial range turbulence during the evolution of the EPB. It is characterized by a fast upward expansion of the bubble. Within the inertial regime the polarization currents at the bubble boundary are larger than the Pedersen currents [see 3]. Pedersen currents slow down the expansion velocity due to energy dissipation.
When looking at the distribution of spectral indices deduced in this study (see Figure 7 top frame) we can confirm that a slope of −5/3 (−1.667) lies well within the range of covered indices but is in no way outstanding. The local time distribution shown in Figure 8 (top) reveals a highest rate at −5/3 in the local time sector 21–22 LT. This is somewhat later than the sector 20–21 LT quoted by [3]. The difference in local time may be attributed to their rather small number of samples compared to our comprehensive survey over the years 2000–2005 with almost 9000 events. Likewise, we find the most spectra with an index −5/3 at magnetic latitudes between 12° and 15° in our CHAMP measurements, corresponding to fluxtube apex heights of 710–890 km. This is fully consistent with the 2-D model prediction of the height range where ion inertial effects dominate (see [3] their Figure 3). Overall we may conclude that the spectral characteristics of our intermediate-scale electron density variations within an EPB are in agreement with the interpretation of McDaniel and Hysell [3], but the inertial regime seems to be just one possible stage of EPB evolution.
It is worth mentioning that largest amplitude density variations appear at latitudes about 20° away from the magnetic equator (see Figure 5). That is on fluxtubes well poleward of the anomaly crest. At these latitudes a broad range of spectral indices has been observed with a weak preference for shallower spectra. Inspections of individual cases have shown that here discrete, steep and narrow density depletions commonly occur. They resemble in certain ways delta functions, which cause white spectra.
An interesting aspect to note is that the bubble walls at the poleward edge are very steep and accompanied by large density variations. We may even go one step further. In Figure 1, lower part, we observe three positive magnetic field spikes near −25° MLat in panel (A). These spikes, representing kilometer-scale plasma depletions, appear a few degrees in latitude poleward of the large-scale bubble proper. Obviously, intermediate-scale density structures can even form outside the bubbles and may be an early evolutional step of EPB formation. For the interpretation of these narrow solitary plasma depletions in the context of EPB evolution it would be helpful to make use of high-resolution 3-D bubble simulations. The model of Dao et al. [12] may be regarded as a promising step in that direction.
Summary
This paper presents observed characteristics of intermediate-scale electron density structures associated with EPB. Considered spatial scales cover the range 150 m to 10 km. This is the first comprehensive study of the detail plasma structuring along meridional profiles. The EPB fine-structure has been deduced from CHAMP high-resolution magnetic field measurements. Based on a large number of events (~9000) sampled during the solar active years 2000–2005 average features of the density variations could be deduced. Major results are listed below:
(1) The seasonal/longitudinal distribution and the local time distribution of intermediate-scale events resemble well the general distribution of EPBs, but the event occurrence rate during the considered years is lower by a factor of 4. The appearance of intermediate-scale events depends strongly on solar activity. We have found practically no events during times with F10.7 < 100 sfu.
(2) Intermediate-scale events show a symmetric distribution about the magnetic equator with peak occurrence rates at latitudes 10–15° away from the dip-equator coinciding well with the crest of the EIA. Largest amplitude electron density variations are observed even further poleward, around 20° MLat. Conversely, near the magnetic equator the amplitudes of fluctuations are too small and fall below the resolution of our measurements. The average solar flux level, these latitude profiles are based on, is about F10.7 = 185 sfu.
(3) The spectral characteristics of the variations can well be approximated by power laws. In the considered frequency range, 1–25 Hz, spectral indices are found between −1.4 and −2.6. Peak occurrence rates range around an index of −1.9 within the time sector 20–22 LT. There is only a weak dependence observed of the spectral index on local time. Shallower spectra occur more frequently at later time. Equally for the latitude dependence, spectra become slightly shallower toward the poleward edges.
(4) Largest amplitude variations are observed near the poleward boundary of an EPB around 20° MLat. This is on fluxtubes reaching higher than 1000 km. Even poleward of the EPB proper we some times find intermediate scale solitary depletions. For the proper interpretation of the role these small plasma structures play in the evolution of an EPB high-resolution 3-D models are probably needed.
The decade-long CHAMP data set revealed a lot of detailed features of intermediate-scale electron density variations associated with plasma bubbles. Many of the observations confirm previous reports, but other findings need further investigations.
Conflict of Interest Statement
The authors declare that the research was conducted in the absence of any commercial or financial relationships that could be construed as a potential conflict of interest.
Acknowledgments
The CHAMP mission was sponsored by the Space Agency of the German Aerospace Center (DLR) through funds of the Federal Ministry of Economics and Technology. One of the authors (Chao Xiong) is supported by the Alexander von Humboldt foundation through a Research Fellowship for Postdoctoral Researchers.
References
1. Bhattacharyya A, Groves KM, Basu S, Kuenzler H, Valladares CE, Sheehan R. L-band scintillation activity and space-time structure of low-latitude UHF scintillations. Radio Sci. (2003) 38:1004. doi: 10.1029/2002RS002711
2. Woodman RF, LaHoz C. Radar observations of F-region equatorial irregularities. J Geophys Res. (1976) 81:5447–66. doi: 10.1029/JA081i031p05447
3. McDaniel RD, Hysell DL. Models and DE II observations of inertial-regime irregularities in equatorial spread-F. J Geophys Res. (1997) 102:22233–46. doi: 10.1029/97JA02038
4. Su SY, Yeh HC, Heelis RA. ROCSAT-1 ionospheric plasma and electrodynamics instrument observations of equatorial spread F: An early transitional scale result. J Geophys Res. (2001) 106:29153–9. doi: 10.1029/2001JA900109
5. Le G, Huang CS, Pfaff RF, Yeh SY, Heelis RA, Rich FJ, et al. Plasma density enhancements associated with equatorial spread F: ROCSAT-1 and DMSP observations. J Geophys Res. (2003) 108:1318. doi: 10.1029/2002JA009592
6. Rodrigues FS, Kelley MC, Roddy PA, Hunton DE, Pfaff RF, de La Beaujardiere O, et al. C/NOFS observations of intermediate and transitional scale-size equatorial spread-F irregularities. Geophys Res Lett. (2009) 36:L00C05. doi: 10.1029/2009GL038905
7. Basu SU, Basu S, McClure JP, Hanson WB, Whitney HE. High resolution topside data of electron densities and VHF/GHz scintillations in the equatorial region. J Geophys Res. (1983) 88:403–15. doi: 10.1029/JA088iA01p00403
8. Mullen JP, Mackenzie E, Basu S, Whiney H. UHF/GHz scintillation observed at Ascension Island from 1980 through 1982. Radio Sci. (1985) 20:357–65. doi: 10.1029/RS020i003p00357
9. Huba JD, Joyce G, Krall J. Three-dimentional equatorial spread-F modelling. Geophys Res Lett. (2008) 35:L10102. doi: 10.1029/2008GL033509
10. Aveiro HC, Hysell DL. Three-dimensional numerical simulation of equatorial F region plasma irregularities with bottomside shear flow. J Geophys Res. (2010) 115:A11321. doi: 10.1029/2010JA015602
11. Retterer JM. Forecasting low-latitude radio scintillation with 3-D ionospheric plume models: 1. Plume model. J Geophys Res. (2010) 115:A03306. doi: 10.1029/2008JA013839
12. Dao E, Seyler CE, Kelley MC. Three-dimensional modeling of the electromagnetic characteristics of equatorial plasma depletions. J Geophys Res. (2013) 118:3505–14. doi: 10.1002/jgra.50216
13. Reigber C, Lühr H, Schwintzer P. CHAMP mission status. Adv Space Res. (2002) 30:129–34. doi: 10.1016/S0273-1177(02)00276-4
14. Park J, Lühr H, Rauberg J. Global characteristics of Pc1 magnetic pulsations during solar cycle 23 deduced from CHAMP data. Ann Geophys. (2013) 31:1507–20. doi: 10.5194/angeo-31-1507-2013
15. Maus S, Manoj C, Rauberg J, Michaelis I, Lühr H. NOAA/NGDC candidate models for the 11th generation International Geomagnetic Reference Field and the concurrent release of the 6th generation Pomme magnetic model. Earth Planets Space (2010) 62:729–35. doi: 10.5047/eps.2010.07.006
16. Lühr H, Rother M, Maus S, Mai W, Cooke D. The diamagnetic effect of the equatorial Appleton anomaly: its characteristics and impact on geomagnetic field modelling. Geophys Res Lett. (2003) 30:1906. doi: 10.1029/2003GL017407
17. Heilig B, Lühr H, Rother M. Comprehensive study of ULF upstream waves observed in the topside ionosphere by CHAMP and on ground. Ann Geophys. (2007) 25:737–54. doi: 10.5194/angeo-25-737-2007
18. Sutcliffe PR, Lühr H. A comparison of Pi2 pulsations observed by CHAMP in low Earth orbit and on the ground at low latitude. Geophys Res Lett. (2003) 30:2105. doi: 10.1029/2003GL018270
19. Stolle C, Lühr H, Rother M, Balasis G. Magnetic signatures of equatorial spead-F, as observed by the CHAMP satellite. J Geophys Res. (2006) 111:A02304. doi: 10.1029/2005JA011184
20. Xiong C, Lühr H, Ma SY, Stolle C, Fejer BG. Features of highly structured equatorial plasma irregularities deduced from CHAMP observations. Ann Geophys. (2012) 30:1259–69. doi: 10.5194/angeo-30-1259-2012
21. Stolle C, Manoj C, Lühr H, Maus S, Alken P. Estimating the day time Equatorial Ionization Anomaly strength from electric field. J Geophys Res. (2008b) 113:A09310. doi: 10.1029/2007JA012781
22. Stolle C, Lühr H, Fejer BG. Relation between the occurrence rate of ESF and the equatorial vertical plasma drift velocity at sunset derived from global observations. Ann Geophys. (2008a) 26:3979–88. doi: 10.5194/angeo-26-3979-2008
23. Burke WJ, Gentile LC, Huang CY, Valladares CE, Su SY. Longitudinal variability of equatorial plasma bubbles observed by DMSP and ROCSAT-1. J Geophys Res. (2004) 109:A12301. doi: 10.1029/2004JA010583
24. Xiong C, Park J, Lühr H, Stolle C, Ma SY. Comparing plasma bubble occurrence rates at CHAMP and GRACE altitudes during high and low solar activity. Ann Geophys. (2010) 28:1647–58. doi: 10.5194/angeo-28-1647-2010
Keywords: equatorial ionosphere, topside ionosphere, plasma waves and instabilities, plasma irregularities, plasma depletions
Citation: Lühr H, Xiong C, Park J and Rauberg J (2014) Systematic study of intermediate-scale structures of equatorial plasma irregularities in the ionosphere based on CHAMP observations. Front. Physics 2:15. doi: 10.3389/fphy.2014.00015
Received: 20 January 2014; Accepted: 28 February 2014;
Published online: 19 March 2014.
Edited by:
Rudolf A. Treumann, Munich University, GermanyReviewed by:
Archana Bhattacharyya, Indian Institute of Geomagnetism, IndiaJeff Klenzing, NASA Goddard Space Flight Center, USA
Copyright © 2014 Lühr, Xiong, Park and Rauberg. This is an open-access article distributed under the terms of the Creative Commons Attribution License (CC BY). The use, distribution or reproduction in other forums is permitted, provided the original author(s) or licensor are credited and that the original publication in this journal is cited, in accordance with accepted academic practice. No use, distribution or reproduction is permitted which does not comply with these terms.
*Correspondence: Hermann Lühr, GFZ, German Research Centre for Geosciences, Section 2.3, Earth's Magnetic Field, Telegrafenberg, 14473 Potsdam, Germany e-mail: hluehr@gfz-potsdam.de