Energetic particle forcing of the Northern Hemisphere winter stratosphere: comparison to solar irradiance forcing
 Annika Seppälä1*
  Mark A. Clilverd2
- 1Earth Observation, Finnish Meteorological Institute, Helsinki, Finland
- 2British Antarctic Survey (NERC), Cambridge, UK
Variation in solar irradiance is considered an important factor in natural climate forcing. Variations in the solar UV in particular are now regarded as a major source of decadal variability in the stratosphere, influencing surface climate through stratosphere–troposphere coupling. However, by analyzing meteorological re-analysis data we find that the magnitude of the solar controlled energetic particle forcing signal in stratospheric zonal mean zonal winds and polar temperatures is equivalent to those arising from solar irradiance variations during the Northern Hemisphere polar winter months. We find that energetic particle forcing drives warmer polar upper stratospheric temperatures from early winter leading to an anomalously strong polar night jet via modulation of the vertical temperature gradient. By midwinter the stratosphere–troposphere coupling pathway becomes analogous to the solar UV impact at high latitudes. This not only highlights the importance of the energetic particle forcing contribution to stratospheric circulation, but enables us to understand the pathways responsible for the previously reported energetic particle forcing impacts on the troposphere in terms of the coupling of solar UV forcing to dynamics in the latter part of the winter.
1. Introduction
Understanding the role of the Sun and solar variability as a source of external forcing to the atmosphere has become increasingly important with the need to understand all factors, both natural and anthropogenic, contributing to the Earth's climate. The focus has been on the atmospheric effects of climate variability arising from solar total and spectral irradiance variations (the latter most importantly in the UV) and these are known to drive changes on both annual and seasonal scales [1–3]. Recently the role of direct solar as well as solar activity controlled magnetospheric energetic particle forcing [4, 5] (here denoted as EPF for Energetic Particle Forcing, this includes electrons of auroral to relativistic energies, i.e., tens of keV up to few MeV, as well as protons.), in the form of electron and proton precipitation into the atmosphere, has sparked interest due to it's potential influence on stratospheric circulation [6–11]. EPF effects on middle atmosphere chemistry through NOx and HOx production and their impact on atmospheric ozone balance are well recorded in the literature [see e.g., review by 7]. These effects tend to be particularly focused on the winter polar hemisphere where the impact on atmospheric chemical balance can last for months. The first idealized model study looking beyond stratospheric chemical changes arising from EPF [6] suggested that the impact on stratospheric and tropospheric temperatures, even on annual scales, might be comparable to those arising from solar UV variations between the solar maximum and solar minimum, but the physical mechanisms linking the EPF influence on chemical changes in the middle atmosphere to stratospheric and tropospheric circulation and dynamics have remained elusive.
Stratospheric circulation shows largest variability during the winter when planetary scale atmospheric waves interact and disturb the polar vortex [12], which is generated from the equator-to-pole temperature gradient. This so called wave–mean flow interaction provides a way for the stratosphere to significantly influence tropospheric climate and it has been shown that stratospheric circulation anomalies can be used to improve and extend the range of tropospheric weather forecasts [13–16]. This provides a direct application and motivation to improve understanding of mechanisms contributing to stratospheric circulation.
Variations in total solar irradiance (TSI) and solar UV are considered to be the main sources of natural climate forcing [1]. In this paper, we contrast Northern Hemisphere wintertime dynamical and circulation conditions between times of high energetic particle forcing, solar irradiance minimum, and solar irradiance maximum conditions. We focus on the Northern Hemisphere where longer reanalysis datasets are available than for the Southern Hemisphere. We present a mechanism of energetic particle forcing driving dynamical changes in the atmosphere that are as intense as those arising from the known solar irradiance variations. Our results show how these changes propagate through the stratosphere. Contrasting our results with previous work we are able to provide an explanation of how the stratospheric signals can ultimately reach all the way to the surface via stratosphere–troposphere coupling. We focus on the winter months when stratospheric anomalies are more likely to propagate to the surface [17].
2. Materials and Methods
For our meteorological data analysis we use zonal mean zonal wind (U) and zonal mean temperature (T) from the blended ERA-40 [18] and ERA-Interim [19] reanalysis dataset from 1958 to 2012 (switch to Interim data in Jan 1989). For separation of the solar irradiance and energetic particle forcing signals we group the ERA data using solar radio flux (F10.7 cm) observations and geomagnetic/particle precipitation activity indices as detailed below.
Variation in EPF is more linked to transient phenomena in the Sun and solar wind than the progression of the solar cycle, which controls solar irradiance variations. EPF also shows larger variability over time than irradiance variations do from solar maximum (max) to solar minimum (min). Figure 1 presents how the overall solar irradiance (F10.7 cm) varied over 4.5 recent solar cycles, contrasting how EPF levels, as proxied by the geomagnetic activity index Ap, varied during the same time period. A pronounced feature is the 2–3 year lag of the main peak in the EPF forcing relative to the solar cycle. Thus, EPF can provide a way of influencing regional climate which is out of phase with the solar cycle. For EPF we use the geomagnetic activity index Ap as a proxy. As no continuous particle observations are available for the period concerned, this approach is widely used [see 8].
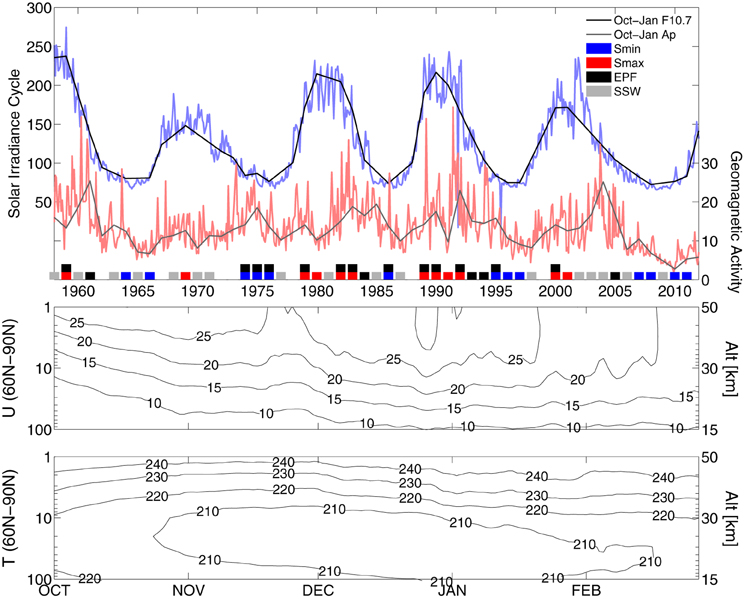
Figure 1. Top: Progression of the Solar Irradiance Cycle (Solar F10.7 cm radio flux) and variation in EPF (Ap index) from 1958 to 2012. Monthly means are shown for both F10.7 (blue), and Ap (red). Oct–Jan means for both are also presented. The winters identified as solar minimum (Smin), solar maximum (Smax), and high EPF, as described in the text, are shown as colored bars. The gray bars indicate an occurrence of a midwinter SSW resulting in exclusion from our analysis (see text), therefore for winters with SSW occurrence, EPF, Smin, and Smax are not marked. Middle and bottom: ERA mean daily Oct–Feb 60–90°N zonal mean zonal wind [m/s] (middle) and zonal mean temperature [K] (bottom). The vertical axis on the lefthand side is pressure [hPa], the approximate altitude in [km] is given on the righthand side.
We average both the solar irradiance cycle and EPF proxies over the 4 month winter period Oct–Jan. The averaged data are also shown in the figure. Following the method of thirds used by Ineson et al. [2] for the solar irradiance signals, we determine solar minimum and solar maximum as the lower and upper thirds of the mean solar radio flux (F10.7 cm). The solar maximum (1959, 1969, 1979, 1980, 1982, 1983, 1989, 1990, 1991, 1992, 2000, 2001) and minimum (1964, 1966, 1996, 1997, 2007, 2008, 2010, 2011) years are shown in Figure 1 as red and blue bars, respectively. The years are also listed in Table 1. We note that defining solar maximum and minimum based on means or medians leads to quantitatively similar results as the thirds.
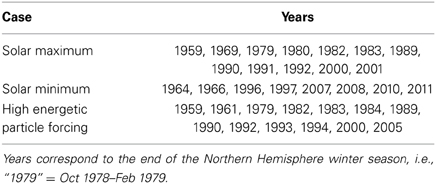
Table 1. Years included in the analysis.
High EPF conditions are determined as those where the Oct–Jan Ap index is above the median of the 1958–2012 period. Using medians is very suitable for the highly varying Ap [9] index, although quantitatively similar results are obtained when using means. The high EPF years (1959, 1961, 1979, 1982, 1983, 1984, 1989, 1990, 1992, 1993, 1994, 2000, 2005) are shown in Figure 1 as black bars. Overlapping years for EPF and solar minimum were additionally removed (shown the figures as overlapping black and blue bars). Some overlap remains for EPF and solar maximum (overlapping black and red bars).
We exclude years during which midwinter sudden stratospheric warmings occur (Figure 1, gray bars) as previous work has shown that the stability of the polar vortex is important for observing the coupling of EPF to dynamical parameters [8, 9, 20]. It is important to note that also QBO, volcanoes, and ENSO, among others, influence the stratosphere. Separation of all factors is challenging with a limited reanalysis dataset, however, the role of these in connection to EPF has been discussed e.g., by Lu et al. and Seppälä et al. [9, 20].
All reanalysis variables in Figures 2, 3 are shown as differences from the blended ERA dataset mean (this is referred to as anomaly). Statistical significance is included, with details given in the Figures. For reference purposes, the two bottom panes in Figure 1 present the daily blended ERA dataset mean polar zonal mean zonal wind and zonal mean temperature. The use of anomalies instead of composite differences (e.g., Solar maximum–Solar minimum) enables us to contrast the propagation of the signals in three different cases, which would not be possible if using composite differences. For composite differences for high and low EPF see e.g., [9, 21].
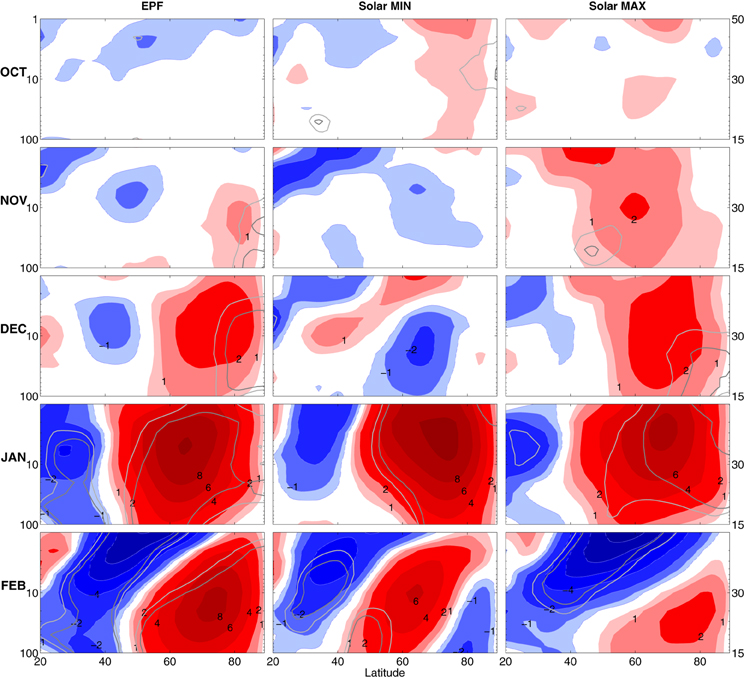
Figure 2. Oct–Feb monthly Northern Hemisphere stratospheric 100–1 hPa zonal mean zonal wind (U) anomalies (difference from the ERA mean) for high EPF (left), solar minimum (middle) and solar maximum (right) conditions. Contour lines are shown for ±0.5, ±1, ±2, ±4, ±6, ±8, ±10, and ±12 m/s. Negative values are shown in blue and indicated with additional dashing. The 90% (95%) significance levels calculated using the t-test are shown with overlaid light (dark) gray contours. The vertical axis on the lefthand side is pressure [hPa], the approximate altitude in [km] is given on the righthand side.
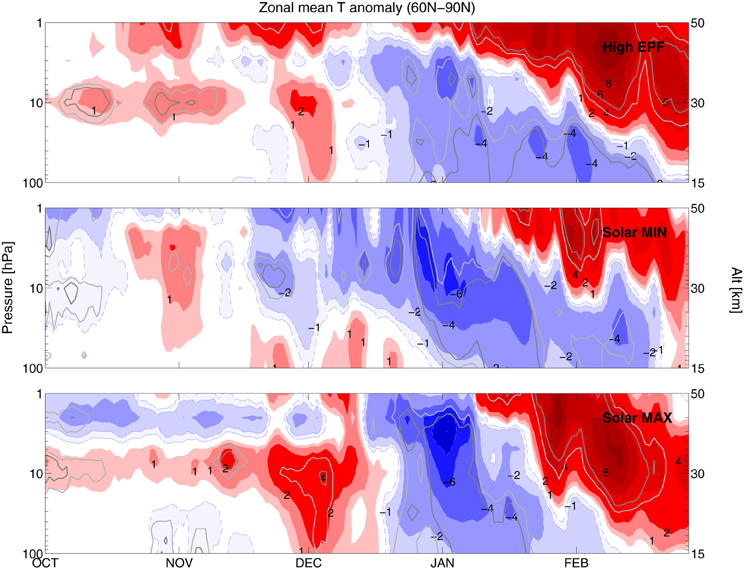
Figure 3. Temporal propagation of temperature anomalies: Daily 60–90°N zonal mean temperature (T) anomaly (difference from the ERA dataset mean) from Oct to Feb. Top: High EPF conditions. Middle: Solar min. Bottom: Solar max. Contours are shown for ±0.5, ±1, ±2, ±4, ±6, ±8, and ±10K. Negative values are shown in blue and indicated with additional dashing. The 90% (95%) significance levels calculated using the t-test are shown with light (dark) gray contours.
3. Results and Discussion
Figure 2 shows the monthly October to February zonal mean zonal wind (U) anomalies for the high EPF, solar min and solar max conditions. The EPF case highlights strengthening winds at high polar latitudes (north of 70°N) from November onwards. Such signals are not present in the October mean and are very weak even at daily scales as presented later. The EPF response is notably different from the solar max conditions, which characteristically shows a stronger sub-tropical upper stratospheric jet in November with a gradual poleward and downward propagation into a stronger high latitude polar night jet as the winter progresses [12, 22]. For both EPF and solar min the stronger polar night jet persists longer than during solar max, with the EPF case featuring anomalously high polar winds across the stratosphere. The key difference between EPF and solar max is the direct influence on the polar latitudes for EPF, instead of the early winter sub-tropical upper stratospheric jet enhancement seen at solar max.
The underlying cause for the initial circulation anomalies driven by variations in solar irradiance is understood to arise from the modulation of atmospheric temperatures via direct heating and additional stratospheric ozone feedback [1]. This is also visible from Figure 3 which shows the propagation of polar temperature anomalies from October to February for the three cases. The polar upper stratosphere around 2–3 hPa shows slightly more persistent cooling from October to November during solar max than during solar min as expected [22], but the response to EPF in early winter is the opposite, with a warmer upper stratosphere above ~5 hPa from mid-October onwards. In a manner similar to solar min, this will weaken the equator-to-pole temperature gradient. However, under high EPF conditions, heating the upper stratosphere will also increase the stratospheric vertical temperature gradient. Modulation of the vertical temperature gradient can further influence the horizontal momentum flux [23]. The momentum flux anomalies reveal that this is taking place for high EPF in October with increasing northward momentum as October progresses. The changes in the momentum flux act to drive the zonal flow resulting in the delayed response in the zonal winds as seen in Figure 2. The strengthened zonal wind will further have an influence on wave propagation which will provide another wave-mean flow feedback to the winds and further down to the troposphere [9]. Despite different initial causes for the EPF and solar UV zonal wind anomalies, the similar end effect on the polar night jet can lead to coupling into the troposphere in both cases.
This suggest that, similarly to the better understood solar UV effects on troposphere [see e.g., 1, 2, 12], the proposed EPF effects on the troposphere [see e.g., 6, 8, 10, 24] are likely to be arise from top–down coupling. The results of Seppälä et al. [9] and Lu et al. [25] have already shown that the wave-mean flow interaction plays a critical role in transferring the signal, and our results now suggest that the propagation of the zonal mean zonal wind and zonal mean temperature signals from December onwards is comparable to the top–down coupling signals arising from solar UV for solar maximum conditions [12]. This comparison, of course, does not include any possible lagged tropospheric effects from solar UV variations, but rather we are addressing the role of the stratosphere in the top–down coupling.
Our results show that the dynamical responses are initiated early in the Northern polar winter season, with first temperature anomalies appearing in the upper stratosphere as early as mid-October, and zonal wind anomalies occurring from November. Recent observational results [26] have demonstrated that even moderate geomagnetic storms are able to drive sufficient levels of EPF into the atmosphere to cause significant ozone loss near and above the stratopause. As these types of storms are much more frequent than those arising solely from large eruptions in the Sun (i.e., Solar Proton Events) [27], it is now proving likely that EPF has more long term influence over middle atmosphere ozone balance than previously expected. Reduced ozone levels at these altitudes at high latitudes during the polar winter season could result in positive temperature anomalies as the ozone radiative effect is not dominated by the solar short wave heating, but rather terrestrial long wave cooling [9, 28, 29], although it is important to note that while this temperature effect from the EPF impact on ozone has been suggested, it has thus far not been confirmed from observations.
Scaife et al. [30] proposed a 1–3 year lagged North Atlantic climate (North Atlantic Oscillation) response to the solar irradiance cycle via extended memory of the ocean heat content. While this mechanism would impact the climate at the surface level, it is unclear how, or to what extent, the stratosphere could be affected. In this context it is interesting to note that Baumgaertner et al. [10] found in model simulations that geomagnetic activity controlled mesospheric EPF NOx production, and the consequent ozone loss lead to more positive Northern Annular Mode (NAM) for high geomagnetic activity. The NAM and the North Atlantic climate are closely related [31]. It should be noted here that a potential link between geomagnetic activity and the North Atlantic Oscillation has also been discussed by several others [see e.g., 32, and references therein]. Therefore it could be possible that several factors, both top–down, as in the EPF case, and bottom–up (the lagged signal from solar irradiance via ocean heat memory) could be contributing to the observed annual variability in the Northern Hemisphere polar region.
4. Conclusions
We show that the Northern winter hemisphere stratosphere is influenced by solar activity driven energetic particle forcing at a level that is comparable to that of the solar irradiance forcing. Our results show that this effect starts early in the winter season. Furthermore, with a comparable effect on stratospheric polar night jet, the further late winter EPF influence on the troposphere presented by Rozanov et al. and Seppälä et al. [6, 8] and Baumgaertner et al. [10] could be understood along the lines of the solar UV top–down coupling propagating downwards via the stratosphere–troposphere connection at high latitudes in later winter. Even though the initial effects on stratospheric dynamics differ, both influence the stratospheric polar night jet—key for providing the downwards coupling to the troposphere. Since the irradiance and particle forcing driven by the Sun typically have different magnitudes and phases of variation during the solar cycle, energetic particle forcing could provide an out-of-phase forcing mechanism from the Sun to the climate of the Earth's winter hemisphere.
Funding
Annika Seppälä was supported by the Academy of Finland (Grants 258165 and 265005).
Conflict of Interest Statement
The authors declare that the research was conducted in the absence of any commercial or financial relationships that could be construed as a potential conflict of interest.
Acknowledgments
The ERA-40 and ERA-Interim data are provided by ECMWF and were made available to this study by FMI and BAS/NERC. All other data is available from NOAA/NGDC. We thank Prof. R. B. Horne and Prof. J. Tamminen for helpful comments on the manuscript.
References
1. Gray LJ, Beer J, Geller M, Haigh JD, Lockwood M, Matthes K, et al. Solar influences on climate. Rev Geophys. (2010) 48:RG4001. doi: 10.1029/2009RG000282
2. Ineson S, Scaife AA, Knight JR, Manners JC, Dunstone NJ, Gray LJ, et al. Solar forcing of winter climate variability in the Northern Hemisphere. Nat. Geosci. (2011) 4:753–7. doi: 10.1038/ngeo1282
3. Ermolli I, Matthes K, Dudok de Wit T, Krivova NA, Tourpali K, Weber M, et al. Recent variability of the solar spectral irradiance and its impact on climate modelling. Atmos Chem Phys. (2013) 13:3945–77. doi: 10.5194/acp-13-3945-2013
4. Akasofu SI. Energy coupling between the solar wind and the magnetosphere. Space Sci Rev. (1981) 28:121–90. doi: 10.1007/BF00218810
5. Hargreaves JK. The Solar-Terrestrial Environment. Cambridge Atmospheric and Space Science Series. Cambridge, UK: Cambridge University Press (1992). doi: 10.1017/CBO9780511628924
6. Rozanov E, Callis LB, Schlesinger M, Yang F, Andronova N, Zubov V. Atmospheric response to NOy source due to energetic electron precipitation. Geophys Res Lett. (2005) 32:L14811. doi: 10.1029/2005GL023041
7. Rozanov E, Calisto M, Egorova T, Peter T, Schmutz W. Influence of the precipitating energetic particles on atmospheric chemistry and climate. Surv Geophys. (2012) 33:483–501. doi: 10.1007/s10712-012-9192-0
8. Seppälä A, Randall CE, Clilverd MA, Rozanov E, Rodger CJ. Geomagnetic activity and polar surface air temperature variability. J Geophys Res. (2009) 114:A10312. doi: 10.1029/2008JA014029
9. Seppälä A, Lu H, Clilverd MA, Rodger CJ. Geomagnetic activity signatures in wintertime stratosphere wind, temperature, and wave response. J Geophys Res. (2013) 118:2169–83. doi: 10.1002/jgrd.50236
10. Baumgaertner AJG, Seppälä A, Joeckel P, Clilverd MA. Geomagnetic activity related NOx enhancements and polar surface air temperature variability in a chemistry climate model: modulation of the NAM index. Atmos Chem Phys. (2011) 11:4521–31. doi: 10.5194/acp-11-4521-2011
11. Kvissel OK, Orsolini YJ, Stordal F, Isaksen ISA, Santee ML. Formation of stratospheric nitric acid by a hydrated ion cluster reaction: implications for the effect of energetic particle precipitation on the middle atmosphere. J Geophys Res. (2012) 117:D16301. doi: 10.1029/2011JD017257
12. Kodera K, Kuroda Y. Dynamical response to the solar cycle. J Geophys Res. (2002) 107:4749. doi: 10.1029/2002JD002224
13. Baldwin MP, Dunkerton TJ. Stratospheric harbingers of anomalous weather regimes. Science. (2001) 294:581–4. doi: 10.1126/science.1063315
14. Baldwin MP, Stephenson DB, Thompson DWJ, Dunkerton TJ, Charlton AJ, O'Neill A. Stratospheric memory and skill of extended-range weather forecasts. Science. (2003) 301:636–40. doi: 10.1126/science.1087143
15. Charlton AJ, O'Neill A, Stephenson DB, Lahoz WA, Baldwin MP. Can knowledge of the state of the stratosphere be used to improve statistical forecasts of the troposphere? Q J R Meteorol Soc. (2003) 129:3205–24. doi: 10.1256/qj.02.232
16. Christiansen B. Downward propagation and statistical forecast of the near-surface weather. J Geophys Res. (2005) 110:D14104. doi: 10.1029/2004JD005431
17. Cohen J, Salstein D, Saito K. A dynamical framework to understand and predict the major Northern Hemisphere mode. Geophys Res Lett. (2002) 29:1412. doi: 10.1029/2001GL014117
18. Uppala SM, Kållenberg PW, Simmons AJ, Andrae U, Da Costa Bechtold V, Fiorino M, et al. The ERA-40 re-analysis. Q J R Meteorol Soc. (2005) 131:2961–3012. doi: 10.1256/qj.04.176
19. Dee DP, Uppala SM, Simmons AJ, Berrisford P, Poli P, Kobayashi S, et al. The ERA-Interim reanalysis: configuration and performance of the data assimilation system. Q J R Meteorol Soc. (2011) 137:553–97. doi: 10.1002/qj.828
20. Lu H, Clilverd MA, Seppälä A, Hood LL. Geomagnetic perturbations on stratospheric circulation in late winter and spring. J Geophys Res. (2008) 113:D16106. doi: 10.1029/2007JD008915
21. Lu H, Jarvis MJ, Hibbins RE. Possible solar wind effect on the northern annular mode and northern hemispheric circulation during winter and spring. J Geophys Res. (2008) 113:D23104. doi: 10.1029/2008JD010848
22. Matthes K, Langematz U, Gray LJ, Kodera K, Labitzke K. Improved 11-year solar signal in the Freie Universität Berlin climate Middle Atmosphere Model (FUB-CMAM). J Geophys Res. (2004) 109:D6101. doi: 10.1029/2003JD004012
23. Simpson IR, Blackburn M, Haigh JD. The role of Eddies in driving the tropospheric response to stratospheric heating perturbations. J Atmos Sci. (2009) 66:1347–65. doi: 10.1175/2008JAS2758.1
24. Maliniemi V, Asikainen T, Mursula K, Seppälä A. QBO-dependent relation between electron precipitation and wintertime surface temperature. J Geophys Res. (2013) 118:6302–10. doi: 10.1002/jgrd.50518
25. Lu H, Franzke C, Martius O, Jarvis MJ, Phillips T. Solar wind dynamic pressure effect on planetary wave propagation and synoptic-scale Rossby wave breaking. J Geophys Res. (2013) 118:4476–93. doi: 10.1002/jgrd.50374
26. Daae M, Espy PJ, Nesse Tyssøy H, Newnham DA, Stadsnes J, Søraas F. The effect of energetic electron precipitation on middle mesospheric night-time ozone during and after a moderate geomagnetic storm. Geophys Res Lett. (2012) 39:L21811.
27. Borovsky JE, Denton MH. Differences between CME-driven storms and CIR-driven storms. J Geophys Res. (2006) 111:A07S08.
28. Langematz U. An estimate of the impact of observed ozone losses on stratospheric temperature. Geophys Res Lett. (2000) 27:2077–80. doi: 10.1029/2000GL011440
29. Langematz U, Kunze M, Krüger K, Labitzke K, Roff GL. Thermal and dynamical changes of the stratosphere since 1979 and their link to ozone and CO2 changes. J Geophys Res. (2003) 108:4027. doi: 10.1029/2002JD002069
30. Scaife AA, Ineson S, Knight JR, Gray L, Kodera K, Smith DM. A mechanism for lagged North Atlantic climate response to solar variability. Geophys Res Lett. (2013) 40:434–9. doi: 10.1002/grl.50099
31. Thompson DWJ, Wallace JM. Regional climate impacts of the Northern Hemisphere annular mode. Science. (2001) 293:85. doi: 10.1126/science.1058958
Keywords: energetic particle precipitation, stratosphere, dynamics, stratosphere–troposphere connection, solar forcing, solar cycle, solar variability
Citation: Seppälä A and Clilverd MA (2014) Energetic particle forcing of the Northern Hemisphere winter stratosphere: comparison to solar irradiance forcing. Front. Physics 2:25. doi: 10.3389/fphy.2014.00025
Received: 27 February 2014; Paper pending published: 13 March 2014;
Accepted: 07 April 2014; Published online: 24 April 2014.
Edited by:
Eugene V. Rozanov, Physikalisch-Meteorologisches Observatorium Davos and World Radiation Center, SwitzerlandReviewed by:
Andreas Josef Gerhard Baumgaertner, University of Colorado, USAMarco Calisto, International Space Science Institute, Switzerland
Copyright © 2014 Seppälä and Clilverd. This is an open-access article distributed under the terms of the Creative Commons Attribution License (CC BY). The use, distribution or reproduction in other forums is permitted, provided the original author(s) or licensor are credited and that the original publication in this journal is cited, in accordance with accepted academic practice. No use, distribution or reproduction is permitted which does not comply with these terms.
*Correspondence: Annika Seppälä, Earth Observation, Finnish Meteorological Institute, Erik Palmenin Aukio 1, FI-00560 Helsinki, Finland e-mail: annika.seppala@fmi.fi