Super-resolution imaging of C-type lectin spatial rearrangement within the dendritic cell plasma membrane at fungal microbe contact sites
 Michelle S. Itano1†
  Matthew S. Graus2
  Carolyn Pehlke3
  Michael J. Wester4
  Ping Liu1
  Keith A. Lidke5
  Nancy L. Thompson6‡
  Ken Jacobson1,7‡
  Aaron K. Neumann2*‡
- 1Department of Cell Biology and Physiology, University of North Carolina at Chapel Hill, Chapel Hill, NC, USA
- 2Department of Pathology, Spatiotemporal Modeling Center, University of New Mexico, Albuquerque, NM, USA
- 3Spatiotemporal Modeling Center, University of New Mexico, Albuquerque, NM, USA
- 4Department of Mathematics and Statistics, Spatiotemporal Modeling Center, University of New Mexico, Albuquerque, NM, USA
- 5Department of Physics, Spatiotemporal Modeling Center, University of New Mexico, Albuquerque, NM, USA
- 6Department of Chemistry, University of North Carolina at Chapel Hill, Chapel Hill, NC, USA
- 7Lineberger Comprehensive Cancer Center, University of North Carolina at Chapel Hill, Chapel Hill, NC, USA
Dendritic cells express DC-SIGN and CD206, C-type lectins (CTLs) that bind a variety of pathogens and may facilitate pathogen uptake for subsequent antigen presentation. Both proteins form punctate membrane nanodomains (~80 nm) on naïve cells. We analyzed the spatiotemporal distribution of CTLs following host-fungal particle contact using confocal microscopy and three distinct methods of cluster identification and measurement of receptor clusters in super-resolution datasets: DBSCAN, Pair Correlation and a custom implementation of the Getis spatial statistic. Quantitative analysis of confocal and super-resolution images demonstrated that CTL nanodomains become concentrated in the contact site relative to non-contact membrane after the first hour of exposure and established that this recruitment is sustained out to 4 h. DC-SIGN nanodomains in fungal contact sites exhibit a 70% area increase and a 38% decrease in interdomain separation. Contact site CD206 nanodomains possess 90% greater area and 42% lower interdomain separation relative to non-contact regions. Contact site CTL clusters appear as disk-shaped domains of approximately 150–175 nm in diameter. The increase in length scale of CTL nanostructure in contact sites suggests that the smaller nanodomains on resting membranes may merge during fungal recognition, or that they become packed closely enough to achieve sub-resolution inter-domain edge separations of <30 nm. This study provides evidence of local receptor spatial rearrangements on the nanoscale that occur in the plasma membrane upon pathogen binding and may direct important signaling interactions required to recognize and respond to the presence of a relatively large pathogen.
Introduction
The ability of immature dendritic cells to recognize, bind, and effectively respond to pathogens is critical for our innate and adaptive immune responses [1, 2]. Specialized receptors, such as the Toll-like and C-type lectin (CTL) receptors, are highly expressed on the plasma membranes of dendritic cells where they recognize pathogen-associated molecular patterns. Specifically, the CTL family of receptors recognize carbohydrate structures that are characteristic of the exposed surfaces of a large range of clinically relevant pathogens, including HIV, Dengue virus, Ebola virus, Candida albicans, and Leishmania [3]. Several members of the CTL family, including DC-SIGN (dendritic cell-specific intercellular adhesion molecule-3-grabbing non-integrin, also called CD209), CD206 (also called Macrophage Mannose Receptor), and Dectin-1, have been shown to form plasma membrane domains which are required for the receptor to stably bind to pathogens and initiate proper downstream signaling events [4]. The specific manner in which CTL clustering enables the receptors to bind to pathogens is under active investigation [5–9].
DC-SIGN and CD206 form clusters on the cell surface even in the absence of exogenous ligands [5–7, 9–12]. Previous measurements using wide-field microscopy methods have indicated that DC-SIGN microdomains both on human immature dendritic cells and on fibroblasts ectopically expressing DC-SIGN range in size from those minimally resolvable by classical optical resolution (≈300 nm) to ~1.5 μm in dimension [10]. Earlier work, using transmission electron microscopy (TEM) and near-field scanning optical microscopy (NSOM), has indicated that DC-SIGN clusters are generally less than 200 nm in diameter [5–7]. Recent results using several complementary fluorescence imaging-based techniques to measure the lateral dynamics of DC-SIGN microdomains have demonstrated that these microdomains are remarkably stable with respect to exchange of DC-SIGN between the domain and its surrounding membrane [9–11]. Throughout this paper, we will refer to domains resolvable by wide-field fluorescence microscopy, having dimensions >300 nm, as “microdomains,” while domain structures with dimension ~300 nm or less, which are only resolvable by super-resolution methods, will be referred to as “nanodomains.” Recently, a super-resolution imaging technique, Blink Microscopy, determined that both DC-SIGN and CD206 exhibit a nanostructure comprised of distinct ~80 nm in diameter nanodomains on naïve fixed dendritic cells and both types of these nanodomains exhibited a spatially random distribution in the plasma membrane with very little tendency to co-localize [12].
Here, we examine how the membrane topography of DC-SIGN and CD206 is altered upon binding of a pathogen-surrogate particle, S. cerevisiae—derived zymosan. Using quantitative fluorescence microscopy, we observed that both DC-SIGN and CD206 increase in fluorescence intensity in the three-dimensional cup-like contact regions between the surfaces of the dendritic cells and the zymosan particles, which have been referred to as “phagocytic synapses” [13, 14]. Further analysis was carried out using the super-resolution method dSTORM (direct stochastic optical reconstruction microscopy), one of several recently developed methods that use sequential, sparsely distributed single-molecule imaging to generate plots of precise locations of single molecules, with a localization precision of approximately 20 nm in the xy image plane [15–18]. This method employs a buffer containing a reducing agent to drive the majority of the dyes into transient dark states and an oxygen scavenging system to extend fluorophore dark state lifetimes and quench fluorophore triplet states. The result is that only a few sparsely distributed dyes fluoresce, with ms-long on times, at a time. dSTORM imaging reveals a change in the nanostructure of DC-SIGN and CD206 at the contact sites of dendritic cells with fungal particles. Quantitative analysis of pair-wise distance probability distributions reveals that these receptors are clustered at longer length scales than in non-contact regions of the cells not challenged with zymosan. A novel implementation of the Getis G statistic was used to analyze the local amount of clustering as a function of nanoscale spatial extent. This spatial statistic, originally developed for geographical research [19], is an effective technique for identification and measurement of protein clustering [20] in super-resolution datasets with minimal need for arbitrary user-defined analysis parameters. To validate our approach, we have compared and contrasted several other spatial statistical methods using experimental and simulated data to examine their relative performance.
Overall, our results indicate that the lateral organization of DC-SIGN and CD206 changes significantly upon direct binding of a zymosan particle. The local formation of relatively large and densely packed DC-SIGN and CD206 nanodomains at pathogen-cell contact sites are likely to direct important signaling interactions required for mediating the recognition and response to the presence of a relatively large pathogen.
Materials and Methods
Dendritic Cells
Human peripheral blood mononuclear cells (PBMCs) were obtained from buffy coats (New York Blood Center, New York, NY; for super-resolution imaging studies) or discarded leukocyte reduction filter effluent (United Blood Services, Albuquerque, NM; for confocal imaging studies). To recover cells from leukocyte reduction filters, those filters were back-flushed with 300 mL HBSS using a peristaltic pump (Watson-Marlow, Falmouth, Cornwall, UK; 155 rpm). The collected cells from either source were spun over Ficoll-Paque Plus (GE, Sweden) to isolate PMBCs. Monocytes were purified by adherence on tissue culture flasks. Immature dendritic cells were prepared by differentiation of monocytes in RPMI supplemented with 10% FBS, 1% penicillin/streptomycin, 10 mM Hepes, 1 mM sodium pyruvate, 500 IU/mL human IL-4 (Peprotech, Rocky Hill, NJ) and 800 IU/mL human GM-CSF (Leukine, Bayer Healthcare Pharmaceuticals, Seattle, WA) at 37°C and 5% CO2,for 7 days. This use of human blood products was reviewed and approved by the University of North Carolina Biomedical IRB and the University of New Mexico Health Sciences Center Human Research Review Committee.
Zymosan Particles
Zymosan particles are widely employed as mimics of pathogenic, live yeast cells. The original 1941 method [21] for production of zymosan from S. cerevisiae yeasts specifies sequential steps of: (1) boiling in Na2HPO4, (2) extensive trypsinization, (3) 95% ethanol washes, (4) boiling in water, (5) washing with absolute ethanol and drying to yield a product reported to contain 94% carbohydrate, 1.78% nitrogen, 2.43% magnesium, and 0.4% phosphorus. The majority carbohydrate fraction of zymosan contains primarily cell wall β-1,3-glucan linked to chitin and β-1,6-glucan together with β-1,6-glucan-linked cell wall mannoproteins [22, 23]. Our studies used commercially available zymosan particles: non-fluorescent zymosan particles and those labeled with AlexaFluor488 on their surfaces (Invitrogen/Molecular Probes, Eugene, OR).
Sample Preparation for Confocal Imaging
Dendritic cells were differentiated from monocytes, seeded on glass-bottomed MatTek dishes (MatTek Corp., Ashland, MA) at a density of 105 cells/plate, and treated with 106 non-fluorescent zymosan particles per sample. Zymosan particles were subjected to three rounds of 30 s bath sonication followed by 30 s of vigorous vortexing to maximize the monodispersion of the particles prior to application to dendritic cells. Conjugates of dendritic cells and zymosan particles were fixed at 0, 1, and 4 h after combination with 4% paraformaldehyde in PBS for 15 min at room temperature. Fixed specimens were treated with a blocking solution of BSA/PBS, stained with non-fluorescent, primary antibodies, washed three times with PBS, stained with fluorescent, secondary antibodies followed by a final wash (three times) in PBS. The two primary antibodies were as follows: mouse monoclonal IgG2b anti-human DC-SIGN (BD Pharmingen 551186) and mouse monoclonal IgG1 anti-human CD206 (Abnova H00004360-M02), both applied at a concentration of 10 μg/mL for 30 min at 25°C. The following secondary antibodies were used: AlexaFluor488-conjugated goat anti-mouse IgG2b (Invitrogen A21141), which specifically labeled the primary anti-DC-SIGN antibodies, and AlexaFluor647-conjugated goat anti-mouse IgG1 (Invitrogen A21240), which specifically labeled the primary anti-CD206 antibodies, applied at a concentration of 1 μg/mL for 30 min at 25°C.
After treatment with primary and secondary antibodies, dendritic cell membranes were made fluorescent by using the membrane-specific probe Cell Mask Orange (CMO; Invitrogen C10045). Dendritic cell—zymosan conjugates were exposed to a concentration of 5 μg/mL CMO in PBS for 5 min at 25°C. This staining condition allows only dendritic cell membranes to become fluorescent. Zymosan surfaces were not observed during subsequent confocal imaging.
Confocal Fluorescence Imaging
Fluorescent proteins and dendritic cell membranes were imaged with an FV1000 laser scanning confocal microscope (Olympus, Center Valley, PA) equipped with a 60×, 1.42 NA, Plan-Apochromat oil immersion objective. The positions of non-fluorescent zymosan particles bound to dendritic cell surfaces were identified by DIC imaging. AlexaFluor488 (reporting the distribution of DC-SIGN) was excited with a 15 mW, 473 nm diode laser operated at 1% power; AlexaFluor647 (reporting the distribution of CD206) was excited with a 20 mW, 635 nm diode laser operated at 1% power, and CMO (reporting the dendritic cell membrane 3D profile) was excited with a 15 mW, 559 nm diode laser operated at 1% power. These lines were reflected to the specimen by a 405/473/559/635 multi-edge main dichroic element, and emission was routed through the main dichroic mirror and confocal pinhole (115 nm diameter) to secondary longpass dichroics (or a mirror) followed by bandpass emission filters in front of 3 independent PMT detectors. Specifically, the emission light passed by the main dichroic was directed to PMT1 (AlexaFluor488/DC-SIGN channel) via reflection from a longpass 560 nm cutoff dichroic mirror and passage through a BA 490–540 nm bandpass filter. Emission passing through this dichroic was directed to PMT2 (CMO/dendritic cell plasma membrane channel) via reflection from a longpass 640 nm cutoff dichroic mirror and passage through a BA 575–620 nm bandpass filter. Finally, emission light passed through this dichroic was directed to PMT3 (AF647/CD206 channel) via reflection from a mirror and passage through a BA 655-755 nm bandpass filter. Z-stacks were recorded with 250 nm spacing. Pixel dimensions (102.9 × 102.9 nm square pixels in the xy dimension), pixel dwell time (2 μs/pixel), detector sensitivity (PMT1 640 volts; PMT2 455 volts; PMT3 610 volts; gain = 1 and offset = 0 for all PMTs) and excitation power (as stated above) were kept constant for all sample imaging.
Confocal Image Analysis
Confocal image analysis was carried out by using a custom program written in Matlab (The Mathworks, Natick, MA). 3D spherical geometries of the contact sites were reconstructed from a stack of 2D image slices. The curved contact site surfaces were identified by the (r,θ,φ) spherical coordinates where the dendritic cell membrane stain CMO was detected, limited by a user-defined maximum r, based on the largest dimension of the yeast as observed in DIC. This results in a map of intensity for each channel in all (θ,φ) positions. Each (θ,φ) position was classified as negative or positive for each channel. This distinction was made based on the intensity at that position being less than (negative) or greater than/equal to (positive) a threshold defined by the mean intensity for contact site positions in the same channel plus one standard deviation of that distribution. Contact site areas were defined as those (θ,φ) positions positive for CMO. Receptor intensity was the summed intensity from the original (θ,φ) positions of contact site areas corresponding to the designated receptor occupancies. Note that while binarization was used to determine which positions were positive or negative for a given receptor, the original intensities at these positions were retained for use in intensity-based readouts. The Matlab code used for these analyses is available at the UNM STMC website software page (http://stmc.health.unm.edu/tools-and-data/index.html) and is described fully elsewhere [24].
Sample Preparation for Super-Resolution Imaging
For all super-resolution imaging, monocyte-derived immature dendritic cells were plated on LabTek 8-well chambered coverglass slides (cat# Z734853, Sigma-Aldrich, St. Louis, MO). On day six of culture, immature dendritic cells at a density of approximately 105 cells per slide (~104 cells per well) were incubated with 3 × 10⁶ AlexaFluor488-labeled zymosan particles/slide for 4 h. After the 4 h incubation, samples were fixed by using a paraformaldehyde solution [4% (v/v) in PBS, pH 7.4] for 20 min at 25°C and then maintained in PBS/BSA overnight at 4°C. Fixed conjugates of dendritic cells and zymosan particles were stained for either DC-SIGN or CD206 by using direct immunofluorescence with mouse monoclonal IgG antibodies conjugated to AlexaFluor647 (either IgG2b, R&D, MAB161, clone 120507 or IgG2a, R&D, MAB25342, clone 685641, respectively). To do so, antibodies were conjugated to AlexaFluor647 according to manufacturer's instructions (A-20186, Invitrogen), with an estimated 1.2 dyes per protein.
Super-Resolution Imaging
Since the introduction of STORM and (F)PALM in 2006 [15–17], several similar approaches have been developed to achieve “super-resolution microscopy” based on the successive localization of single molecules. Direct stochastic optical reconstruction microscopy (dSTORM) employs the use of reversible dark states of carbocyanine, oxazine, and rhodamine-derived dyes to switch the molecules on and off at a rate suitable for super-resolution microscopy [25, 26].
The sample was illuminated with a 488 nm laser line (see below) at a small angle relative to the optical axis (well below the critical angle) to acquire images that indicated the location(s) of fluorescently labeled zymosan particle(s) in relation to dendritic cells. dSTORM images were then generated from movies taken while the AlexaFluor647 dyes were induced to blink with ms-long on-times in the presence of a reducing agent. Specifically, the AlexaFluor647 fluorescence arising from antibodies bound to cell-zymosan conjugates was imaged in a solution containing glucose, 20–50 mM ß-mercaptoethylamine (MEA), 0.04 mg/mL catalase, and 1 mg/mL glucose oxidase [27]. Fluorescence imaging was carried out on an Olympus IX-71 microscope applying an objective-type TIRFM configuration with an oil-immersion objective (PlanApo N, 150×, 1.45 NA, Olympus) and the excitation light focused at an angle below the critical angle to provide oblique illumination of the specimen. Three different lasers were used: AlexaFluor647 excitation was enabled by use of a 635 nm laser (Radius 635, Coherent Inc.) providing ~3 μW/μm2 at the sample plane; photo-activation of AlexaFluor647 was enabled by using a 405 nm laser (CrystaLaser, DL405-010) with ~0.01 μW/μm2 at the sample plane; and AlexaFluor488 excitation was enabled by use of a 488 nm laser (Newport Cyan488, 100 μW/μm2). The microscope dichroic and emission filters used were from a quad-band filter set (Semrock LF405/488/561/635). The emission path further consisted of a quad band image splitter (Photometrics QV2) with band pass emission filters for the AlexaFluor488 channel (Semrock FF01-525/30-25) and the AlexaFluor647 channel (Semrock FF02-685/40-25). Image movies were recorded with an EMCCD camera (Andor iXon 897) using an exposure time of 20 ms. This resulted in a camera frame rate of ~50 frames per second which allowed us to detect ~300 photons per molecule per frame. A multipurpose data acquisition card (National Instruments NI PCIe-6323) was used to control the lasers and peripheral hardware. The optical resolution of the imaging system, which was used to determine the size of a pixel, was calculated based on the components in the system and verified using a target test slide.
An active form of drift correction was accomplished by re-registering the sample to a pre- selected, isolated reference bead after each acquisition of 2000 frames, which took about 1 min. Fluorescent beads (Invitrogen FluoSpheres, 0.1 μm, Red) were added to the imaging buffer and allowed to stabilize on the cover slip. A 3D piezo stage (Nano-LPS100, Mad City Labs) was used to move the sample to the pre-selected bead where a 3D defocus series was collected. The in-focus position of the bead was determined and used to correct for any drift accumulated since the previous registration. Corrected data typically contains less than 10 nm residual drift.
The recorded movies were processed by estimating the emitters' positions using a fast, maximum likelihood based algorithm [18] which takes into account the finite camera pixel size, background fluorescence and camera read out noise. The method for finding candidate regions of interest for position estimation follows that described in Huang et al. [28]. For each frame, the image was filtered using a difference of Gaussians filter. Then 6 × 6 pixel sub-regions including the identified regions were packaged and input into an iterative routine, based on a graphics processing unit (GPU), which allows for a parallelized processing approach and therefore real-time data analysis. The single molecule candidates were accepted if the number of photons per frame was greater than 100, the background was less than 100. After localization, remaining lateral drift was removed using a method which identifies and corrects drift during the data acquisition by cross-correlating reconstructed images made from a temporal sub-set of data similar to that described in Mlodzianoski et al. [29]. Drift correction is visually inspected using a reconstructed image with localizations color coded by the time of collection. Each point in the reconstructed dSTORM image represents the found location of a single fluorophore from the analysis of one frame of the image series. The fit precision is taken as the Cramér-Rao Lower Bound calculated from the fit parameters [18] and is returned for each individual fit.
Statistics for the Assessment of Spatial Heterogeneity
Analysis of dSTORM data was carried out by using SuperCluster (Jan. 2014 release), a custom program written in Matlab (The Mathworks, Natick, MA). Code is available at the UNM STMC website software page (http://stmc.health.unm.edu). Four complementary statistics for the assessment of spatial heterogeneity in regions of zymosan engagement with dendritic cells vs. non-contact regions were employed. The first analysis method was the well-known pairwise distance distribution, displayed in cumulative form. This distribution provided a measure of the length scale(s) of heterogeneity. The second statistical assessment of spatial heterogeneity was the Getis G statistic (described schematically in Figure S1) with a variable cutoff distance, which measured the degree of local clustering [30]. We used this method to identify individual clustered distributions of receptor about local G maxima and perform relevant measurements on all clusters so identified. The third statistical assessment used to assess clustering is Density Based Spatial Clustering of Applications with Noise (DBSCAN). This thresholding-based method for cluster identification was implemented as previously described [31]. We report relevant cluster measurements on DBSCAN-identified clusters, similarly to those found by the Getis G method. The fourth statistical method used to assess receptor nanostructure was Pair Autocorrelation. This method was implemented as previously described [32–34] and reports a characteristic cluster size and localizations per cluster for the dSTORM dataset.
These complementary methods have different capabilities, advantages and disadvantages. The first measure (pairwise distance distributions) averages over the entire region of interest to obtain length scale(s) where clustering occurs. This method involves minimal manipulation and relatively simple analysis of pairwise distributions, which is the fundamental data upon which the other analyses are based and a good point of reference for comparison with other methods. The second and third methods (Getis G and DBSCAN, respectively) emphasize a local measure of clustering. They identify individual clusters allowing comparisons of distributions of cluster characteristics between contact and non-contact regions as opposed to the ensemble measurements provided by the other methods. Our implementation of Getis G cluster detection was designed to achieve higher sensitivity and specificity for cluster detection under conditions of close apposition of clusters (i.e., as would be expected in contact sites) and in the biologically relevant context of clustering on multiple length scales. The Getis cluster detection method also offers the advantage of avoiding ensemble measurements of clustering across an entire image and instead reporting population distributions of single cluster measurements. Both the Getis and DBSCAN based clustering methods are expected to be relatively insensitive to the problem of multiple localizations per fluorophore because the length scale characterizing the spatial distribution of the multiple localizations is similar to or smaller than the length scale of co-clustering criteria used by these methods. The fourth method for clustering assessment (pair autocorrelation) is an ensemble measure (on the region of interest level) designed to correct for instances of multiple single molecule counting in a dSTORM dataset, although care must be taken in interpretation of the results to ensure that local dSTORM probe density effects on the accuracy of localization fitting do not confound these measurements. We compared the performance of these methods using simulated data to better understand their relative strengths and weaknesses as cluster analysis tools for dSTORM datasets.
Super-Resolution Analysis Methods
Localization pairwise distance distribution
A complete set of Euclidian pairwise distances was calculated based on user-selected regions of interest (ROIs), to which minimum and maximum distance cutoffs of 35 and 500 nm, respectively, were applied. The minimum cutoff removed the majority of pairwise distances occurring due to multiple localizations of a single dye. The minimum cutoff was based on the distribution of pairwise distances for dSTORM images of single dyes on glass taken under identical conditions to the cell images to exclude 90% of these multiple localizations. From these pair-wise distances, the pair-wise distribution function (PDF) was generated. The pair-wise cumulative distribution function (CDF) was calculated by placing the pair-wise distances within 100 equally sized bins over the analysis distance (35–500 nm). The CDF was then normalized to the total number of distances, therefore all of the counts in the CDF sum to 1 (or 100%).
Getis G-based cluster analysis
Data preparation for Getis analysis. For the Getis G analysis, the entire region of interest (ROI) area was subdivided into equal-sized sub-regions of a user-defined size (i.e., 10 × 10 nm). Each sub-region was assigned a value equivalent to the number of dSTORM localizations it contained, which was then binarized (based on the criterion that it contained 0 or > 0 localizations) to generate the binary matrix, x.
Calculation of clustering by Getis G at various length scales. The value of the ith sub-region of the binary matrix, xi, was used to calculate the Getis G statistic of local spatial association [19, 30]. The calculation was carried out based on the following equation:
In this equation, d is the pair-wise distance between subregions i and j; n is the number of subregions in the ROI; and wij is a binary weight matrix where wij(d) = 1 if the pairwise distance, d, between subregions i and j is less than a variable “cut-off” distance, and wij(d) = 0 if the pair-wise distance, d, between subregions i and j is greater than the “cut-off” distance. The calculation of G was repeated for all cutoff distances between 0 and a maximum value defined as the first peak of the Ripley's L(r)-r curve, with a step size of 1 subregion dimension. The Ripley's value was selected as the maximum cutoff distance because it is a rough measure of prevailing clustering length scales derived directly from the dSTORM dataset [35] and it does not require the user to enter an arbitrary maximum clustering distance that could bias the analysis.
Measurement of local clustering by maximum Getis G. At each subregion, a curve of G vs. cutoff distance was calculated, and the maximum Getis G value for this curve was recorded for each subregion and retained for further analysis. The maximum Getis G value for a subregion is proportional to the degree to which localizations are clustered about that subregion at length scales up to the maximum cutoff distance (as defined above). Clusters were detected based on the proximity-based joining of subregions with sufficiently elevated maximum Getis G to cluster seed point subregions, as described below.
Assignment of seed points for initiation of cluster detection. Local maxima in the subregions' values of maximum Getis G were found and used as cluster analysis seed points. The Matlab command “imregionalmax,” an image processing toolbox function, which identifies local maximum subregions whose neighbors all have lower localization densities, was used to perform this function. Each seed point was used as a starting point to connect nearby co-clustered subregions into a single cluster object. The decision whether or not to join these subregions depended on the search radius, as defined below.
Definition of search radius for each cluster seed point. A search radius was defined for each seed point subregion. The search radius determined how neighboring subregions are joined (or not) to form individual clusters that will be subjected to cluster measurements. The first derivative of the G vs. cutoff distance function was calculated originating from each seed point subregion. The search radius is defined as the first critical point on the first derivative of the G vs. cutoff distance function. This is a local estimate of the cluster size around the seed point.
Joining subregions into individual clustered groups. Initially, all subregions separated from a seed point subregion by a distance less than or equal to the search radius were joined together as a cluster associated with that seed point. In order to be grouped into a cluster, a subregion had to contain >0 dSTORM localizations. Clusters associated with single seed points were combined if they overlapped. A user defined minimum cluster size (10 localizations per cluster in our analysis) was applied to reject any cluster smaller than the minimum. The boundary of each cluster was determined by the Alpha shape [36] of the localizations contained within the cluster's subregions. This form of boundary definition has the advantage of allowing convex and concave boundary curvature, which results in better definition of irregularly shaped cluster boundaries than convex hull methods.
Receptor cluster metrics. For each cluster, three measurements were performed: equivalent diameter, cluster area, and intercluster distance. Equivalent diameter was defined as the diameter of a circle with equivalent area to the cluster. Intercluster distance was defined as the shortest edge-to-edge distance between the cluster and its nearest neighbor.
DBSCAN-Based Clustering Analysis
Density Based Spatial Clustering of Applications with Noise (DBSCAN) was used to describe clustering in the dSTORM dataset. This algorithm was implemented on the dSTORM localizations as previously described [31]. This method employs a user defined search radius for cluster identification (ε) and minimum localizations/cluster threshold. In our analysis, ε was set to 30 nm and the minimum was set to 10 localizations per cluster. For each cluster, we quantified equivalent diameter and cluster area, as defined above.
Localization Pairwise Distance Autocorrelation
Pair Autocorrelation was performed on the dSTORM localizations to assess receptor nanostructure. Pair autocorrelation was implemented using unmodified code as previously described [32–34]. The results were fit according to the procedure previously described using custom code to fit the autocorrelation results to a Gaussian function using unconstrained non-linear optimization. The code used to implement this fitting is provided within the SuperCluster program, as noted above.
Generation of simulated dSTORM Data
Simulated data was generated using the domain simulation capabilities of the SuperCluster program.
For domain simulations with varying Gaussian variance in Figure S2, simulated data were created by drawing a specified number of points from a multi-variant random normal distribution using random seed points and the desired covariance matrix using the Matlab command “mvnrnd.” These calculations resulted in densely packed round structures with Gaussian distributions of random points with the desired distribution variances in width of the Gaussian distribution.
We generated 2D symmetrical Gaussian domains for Figure S2 using the following parameters: σ = 100 nm; 10 molecules/domain; 1, 5, 10, 20, 30 domains/μm2 simulation space; 10 localizations/molecule, 20 nm localization error; 5 × 5 μm simulation space; 10 nm pixel size. We collected four, non-overlapping 2 × 2 μm regions of interest from the simulation space at each density condition for analysis by SuperCluster. We generated 2D asymmetrical Gaussian domains (Figure S2) with the same parameters except that the x-axis Gaussian σ was 100 nm and the y-axis Gaussian σ was 70 nm.
Results
Recruitment of DC-SIGN and CD206 to Fungal Contact Sites
DC-SIGN and CD206 form microdomains on the plasma membranes of dendritic cells [9–11, 37]. Upon exposure to fungal pathogens or pathogen mimetic particles (i.e., S. cerevisiae-derived zymosan particles used herein), significant spatial rearrangements of these receptors occur. We used laser scanning confocal microscopy on entire 3D contact sites to demonstrate that recruitment of DC-SIGN and CD206 in dendritic cell-zymosan contact regions results in considerable enrichment of receptor in the contact site.
As described in Materials and Methods, cell membranes were labeled using Cell Mask Orange and DC-SIGN and CD206 by indirect immunofluorescence. 3D confocal stacks of resting dendritic cells (0 h) and DC conjugates with zymosan at 1 and 4 h of interaction were imaged and analyzed by a custom procedure designed to accurately extract receptor intensity from the curved contact site membranes [24]. Total contact site DC-SIGN signal increased by a factor of 67-fold (p < 0.0005) at 1 h (relative to resting cell receptor density) and was not significantly different between 1 and 4 h (Figure 1A). Total contact site CD206 signal increased by a factor of 55-fold (p < 0.0005) at 1 h (relative to resting cell receptor density) and was not significantly different between 1 and 4 h (Figure 1B). We conclude that there is a high degree of CTL enrichment in contact sites. However, the fine structure of CTLs in these contact sites is not resolved, so we pursued super-resolution imaging to characterize nanoscale changes in CTL topography within these high receptor density contact sites formed during fungal recognition.
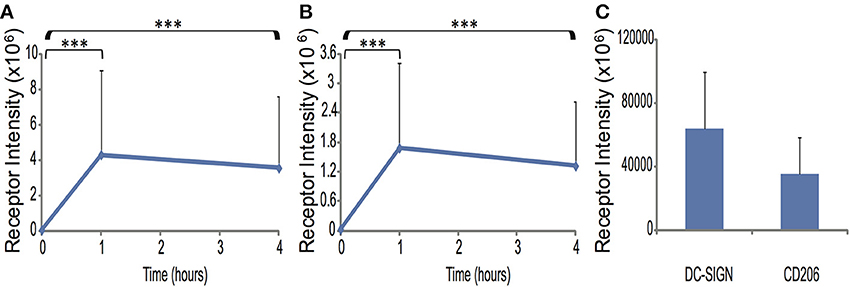
Figure 1. Total receptor enrichment in fungal contact sites. Spatiotemporal distribution of total DC-SIGN (A) and CD206 (B) signal intensity at the contact site during interaction between human immature dendritic cells and zymosan particles. (C) A graph showing the DC-SIGN and CD206 receptor intensity at time = 0 h. Receptor signal was measured by conventional confocal fluorescence microscopy and integrated over the entire three-dimensional contact site. Statistical significance was determined by ANOVA and Tukey's post-hoc test with n = 37 for 1 and 4 h and n = 24 for 0 h. ***Indicate a statistically significant difference at the level of p < 0.0005 between the designated time points.
Super-Resolution Imaging Indicates Enrichment of DC-Sign and CD206 in Fungal Contact Sites on Dendritic Cells
For our dSTORM imaging, human monocyte-derived immature dendritic cells were exposed to fluorescently labeled zymosan particles for up to 4 h to allow stable host-microbe contact sites to form. The immature dendritic cells were then fixed and stained for DC-SIGN or CD206 using direct immunofluorescence with an IgG conjugated to AlexaFluor647 under saturating conditions. In our dataset of super-resolution and confocal fluorescence images of these stained contact sites, we were able to see immunofluorescence staining in all parts of the contact (Figure 2A and data not shown), indicating that antibody access was sufficient to stain receptors throughout the host-microbe contact sites. Prior to dSTORM imaging, widefield fluorescence images were acquired to indicate the location of the fluorescently labeled zymosan particle/s in relation to the dendritic cells. Figure 2A shows a representative dSTORM image of CD206 on a dendritic cell with a single fungal particle (green oval) bound to its surface. In this example, widefield imaging of the green channel indicated that the AlexaFluor488-labeled zymosan was bound to the side of the cell. The plane of focus was set through the middle of the contact region, and thus resolved structures through a cross-section of the dendritic cell (calculated depth of focus ~500 nm). Because the center region of the zymosan particles was slightly autofluorescent in the red channel, localizations which appeared in the middle of the zymosan particle were masked during analysis.
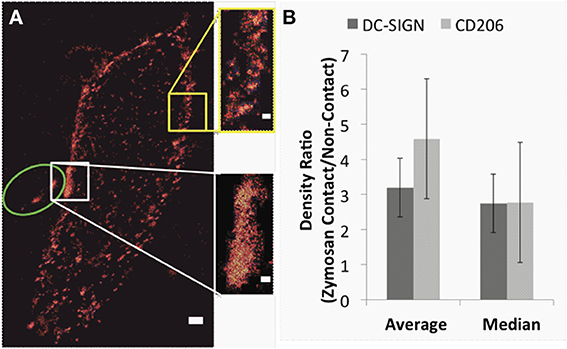
Figure 2. Super-resolution imaging indicates enrichment of DC-SIGN and CD206 in fungal contact sites on dendritic cells. (A) Representative super-resolution image of CD206 on a dendritic cell with a zymosan particle bound. The approximate location of the zymosan particle is indicated with the green oval, the zymosan contact region (white box) and a corresponding non-contact region (yellow box) are highlighted. Scale bars, 500 nm. Insets show the boxed regions at higher zoom, scale bars, 200 nm. (B) Graph depicting the enrichment in the localization density of DC-SIGN (dark gray) and CD206 (light gray) in zymosan contact regions over the corresponding density of non-contact regions in the same dendritic cell. Error bars indicate s.e.m. Results were calculated from 11 and 8 pairs of zymosan contact regions and non-contact regions for DC-SIGN and CD206, respectively. The density of DC-SIGN and CD206 in zymosan contact regions are significantly different when compared to the respective density in non-contact regions [student's t-test p-values = 0.01 (when a single outlier is removed from the analysis) and 0.00085, respectively].
The spatial distribution of DC-SIGN and CD206 within a contact region is strikingly different than in other areas of cell membrane. The lectins form a larger and more continuous structure within the contact site than the nanodomains that are present in naïve cells and in regions that are not bound to a zymosan (Figure 2A and insets). This change occurred within the time interval that zymosan particles and dendritic cells were incubated prior to fixation (4 h). The density of dSTORM super-resolution localizations within a white rectangular region containing a contact site was compared to that in a non-contact region of equivalent size (yellow) from the same image of the same cell. Results were calculated from 11 and 8 pairs of zymosan contact regions and non-contact regions for DC-SIGN and CD206, respectively (obtained from 6 and 5 different cells, respectively). As shown in Figure 2B, the overall density of DC-SIGN and CD206 was significantly enriched in zymosan contact regions over paired non-contact regions. Statistical comparison of receptor density at contact and non-contact membranes by Student's t-test indicated significant differences for both receptors at p = 0.01 for DC-SIGN (when a single outlier, identified by being greater than three standard deviations away from the median, is removed from the analysis) and p = 0.00085 for CD206. The degree of enrichment of super-resolution localizations is lower than that observed for total receptor fluorescence signal by confocal microscopy. We attribute this to known difficulties in sampling single molecule blinking events equally well in regions where density is dramatically larger, leading to under sampling of dense contact sites [28]. This under sampling is a stochastic event involving the observation of simultaneous emission from two probes in a diffraction-limited volume, which must be rejected as unreliable positional estimates for a single probe [38]. This effect would not be expected to impair the ability to measure domain geometry since the domain is still well sampled (see Discussion). However, the conventional confocal measurements in Figure 1 are a more reliable estimate of contact site receptor enrichment.
Pairwise Cumulative Distribution Function (CDF) Analysis of Super-Resolution Data
Further quantitative analysis was required to investigate whether the spatial rearrangement of DC-SIGN and CD206 in fungal contact regions was due to closer packing of the elemental nanodomains viewed in the absence of fungal particles, or alternatively, whether a larger, more continuous structure was formed. Because dSTORM super-resolution imaging produces quite precise single-molecule localizations, CTL receptor accumulations in contact regions could be analyzed by examining pairwise distance calculations. The results of these analyses are shown in Figures 3A–E.
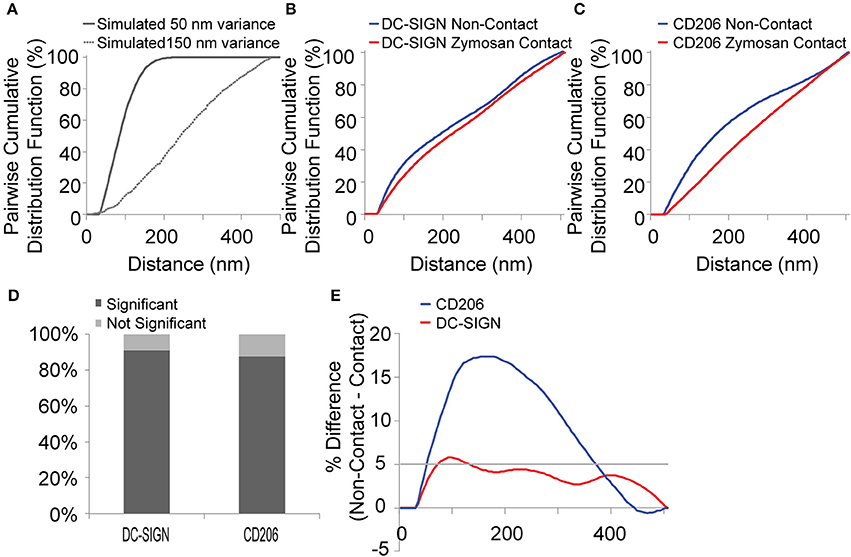
Figure 3. Pairwise cumulative distribution function (CDF) analysis of super-resolution data. (A) CDFs of simulated data with a 50 nm variance (dark gray) and 150 nm variance (light gray). Note that the CDF curve shifts to the right when clustering occurs at a longer length scale. (B) CDFs of DC-SIGN in zymosan contact regions (red) and non-contact regions (blue) on dendritic cells. Data represents the average values for 11 pairs of data. (C) CD206 in zymosan contact regions (red) and non-contact regions (blue) on dendritic cells. Data represents the average values for 8 pairs of data. (D) Graph depicting the results of a chi-squared analysis of the CDF of either DC-SIGN or CD206 from non-contact and zymosan contact regions from the same cell. Significance is indicated by a p-value < 0.05. Results were calculated from 11 and 8 pairs of zymosan contact regions and non-contact regions for DC-SIGN and CD206, respectively. (E) Ratio of the cumulative distance function in non-contact regions over that of zymosan contact regions for DC-SIGN (red) and CD206 (blue). The solid light gray line on the graph indicates a difference in ratio of 5%.
As depicted in Figure 3A, the cumulative probability distribution function (CDF) of single-molecule localization pairwise distances is theoretically predicted to be altered depending upon the nanostructuring of densely packed structures. To test this prediction, simulated pairwise distance distributions were generated from two-dimensional, Gaussian-shaped random distributions of points with a different variances (50 or 150 nm) to produce large or small regions of randomly distributed simulated localizations. For data indicating clustering at a longer length scale, at a given spatial distance in the CDF, there are fewer pairwise distances than for data exhibiting clustering on a shorter length scale. Because differences in density of CTL expression per cell will influence the CDF, all CDFs in these simulations were normalized to the density of points contributing to pairwise localizations by dividing by the total sum of all the counts in the region and multiplying by 100. The results of this simulation showed that the CDF curve shifts to the right, as predicted, when receptor clustering occurs over a longer length scale. Because we had hypothesized a shift to a longer length-scale nanostructure, we expected to see experimental CDFs shift in this fashion.
Pairwise distance data were analyzed for dSTORM localizations from rectangular regions in contact and non-contact regions. Due to the fact that our fitting analysis to identify localizations allows for a single molecule to be localized multiple times due to repeat blinking events of the same molecule, we removed pairwise distances <35 nm from this analysis to minimize their influence on the analysis. The average CDFs for DC-SIGN and CD206 in contact and non-contact membranes are presented in Figures 3B,C, respectively. Data were calculated from 11 and 8 pairs of zymosan contact regions and non-contact regions for DC-SIGN and CD206, respectively. In both cases, the CDF curves for contact regions are shifted in favor of longer length scales when compared to non-contact regions on the same cell. Thus, it appears that in contact regions these lectins are clustered over a longer length scale than in regions of the cell that are not in contact with a zymosan particle. When analyzed on the scale of a single contact region, a chi-squared analysis between individual pairs of CDFs of either DC-SIGN or CD206 from non-contact and zymosan contact regions from the same cell indicated that the curves are significantly different for 91 and 88% of the pairs, respectively. Significance is indicated by a p-value < 0.05 (Figure 3D).
The length scale over which clustering occurs was analyzed by calculating the difference (%) between the non-contact and contact CDFs from paired regions within the same cell. This analysis indicated that the maximal inter-CDF divergence (>5%) occurred between pairwise distances of 70–130 nm for DC-SIGN and 50–370 nm for CD206 (Figure 3E). CD206 exhibited a single clear length scale of increased nanostructuring in contacts. In contrast, DC-SIGN exhibited increased nanostructure in contacts in a more complex pattern with increased frequency of nanostructure spread over several length scale peaks. These inter-CDF divergence values represent distances where the greatest amount of nanostructure was lost in contact site regions. The lower probability of finding pairwise distances in this range for contact sites relative to non-contact membrane suggests that ordering on the scale of individual nanodomains, such as predominate in resting dendritic cells, is lost during fungal contact site formation. Simultaneously, larger and more-continuous CTL lateral organization seems to emerge at fungal contact sites. While CDFs provide a valid overview of spatial data in super-resolution datasets, they provide only ensemble measurements of structure over the entire region of interest. Therefore, we also used several complementary methods to examine spatial organization in contact membranes.
Getis Statistical Analysis of Clustering and Local Density in Fungal Contact Regions on Dendritic Cells
The Getis statistical analysis has been used to analyze geographical clustering data, and is a method that indicates the local amount of clustering in an image [19, 20, 30]. We devised a customized implementation of the Getis statistic and used it to identify and perform further spatial statistical analysis upon receptor clusters. A schematic depiction of this analysis is presented in Figure S1 and described in the Materials and Methods Section. In summary, the Getis G local clustering statistic is applied to small subregions of the image to independently identify receptor clusters in the dataset. Then, super-resolution localizations within these identified clusters can be independently analyzed with respect to cluster equivalent diameter, area, and intercluster separation. The major advantages of this approach include the ability to analyze distributions of nanodomain measurements (rather than ensemble measures across the entire region of interest) and objectivity in cluster identification due to the absence of any requirement for arbitrary user defined parameterization that can strongly influence the result.
Getis analysis identified clusters in contact site and paired non-contact membranes (Figures 4A,B). We measured the size of DC-SIGN and CD206 domains and show that nanodomains of both receptors in contact sites were significantly larger than those in non-contact membranes. This is quantified as both the diameter of a circle of equivalent area of the nanodomain (Figure 4C, Table 1), which gives a sense of the domain width, and the total measured area of nanodomains (Figure 3D). Contact site DC-SIGN and CD206 nanodomains have 70 and 90% greater area, respectively, than non-contact nanodomains. We also found that nanodomains of both CTLs are more tightly packed in contact sites, as measured by diminished separation distance between objects (Figure 4E, Table 1). Intercluster separation (minimum edge-to-edge) distance was decreased significantly for both DC-SIGN (38%) and CD206 (42%) in contact sites relative to non-contact sites. The DC-SIGN and CD206 nanodomains found in contacts are typified by equivalent diameters of approximately 150–175 nm. We found that the number of localizations per nanodomain was not significantly different between contact and non-contact regions (data not shown), but this result must be interpreted with caution due to the relative under sampling of dSTORM localizations under conditions of high probe density.
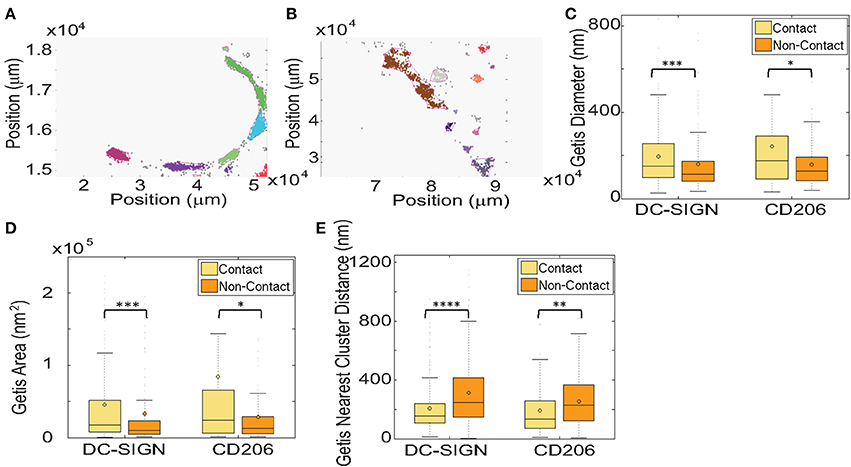
Figure 4. Getis statistical analysis of clustering and local density in fungal contact regions on dendritic cells. (A) A representative map of clusters of CD206 identified using Getis in a zymosan contact ROI on a dendritic cell with a zymosan particle bound. Different colors represent independent clusters identified by the algorithm. (B) A representative map of clusters of CD206 in a non-contact ROI on the same cell as in (A). Getis G values are calculated on 10 × 10 nm square regions. (C) Box and whisker plot of the cluster diameters from Getis analysis. The mean value is depicted by the shaded circle, the median value is depicted by the horizontal line in the shaded box, which represents the Interquartile Range (IQR, values from 25th–75th percentile). The bars above and below the shaded box denote positions 1.5 times the IQR above the 75th percentile and 1.5 times below the IQR below the 25th percentile, respectively. (D) Box and whisker plot of the cluster areas from Getis analysis. (E) Box and whisker plot of the minimum edge to edge distance from one cluster to the next nearest cluster using clusters identified by Getis analysis. Results were calculated from 11 and 8 pairs of zymosan contact regions and non-contact regions for DC-SIGN and CD206, respectively. Box and whisker plots were scaled for visualization of the mean and median values, resulting in some larger outliers to be omitted from the plots. The maximum % of outliers not displayed due to scaling is 10.0% of the total dataset. *Indicates that the difference between the value and the value for the non-contact ROI is significant, with a P-value of < 0.05, **indicates a P-value of < 0.01, ***indicates a P-value of < 0.001 and ****indicates a P-value of < 0.0001 (Mann-Whitney test).
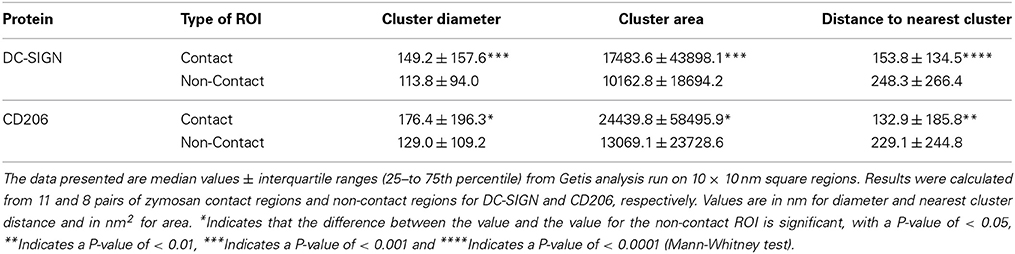
Table 1. Getis statistical analysis of clustering and local density in fungal contact regions on dendritic cells.
DBSCAN Statistical Analysis of Clustering and Local Density in Fungal Contact Regions on Dendritic Cells
A complementary method of identification of domains for subsequent measurement is Density-Based Spatial Clustering of Applications with Noise (DBSCAN). This method identifies clusters by co-clustering all points that are separated by no more than ε pairwise distance, provided that n points can be found within that distance. Thus, the user must provide appropriate values of ε and n for this analysis that can be justified based on familiarity with the data, empirical observations of DBSCAN behavior given those variables, and the degree to which the analysis is robust to changes in the parameters. Nevertheless, the choice of ε and n does influence the identification of domains and therefore, the spatial measurements performed on those domains.
For our CTL analysis, we found that ε = 30 nm and n = 10 functioned well and identified domains in contact and non-contact membranes (Figures 5A,B). These values are also justifiable on the grounds that: (1) ε approximates the positional precision of dSTORM measurements, (2) ε is well below the expected size of domains based on previous work, and (3) n is justifiable as a reasonable estimate of the number of multiple localizations per single molecule based on images of single dyes randomly adsorbed to glass (data not shown). In our analysis, we found a significant increase in the equivalent diameter and absolute area of contact site CD206 nanodomains relative to non-contact site structures (Figures 5C,D; Table 2). The DBSCAN-identified relative increase in nanodomain area for CD206 (50%), was smaller than that observed with the Getis method, as discussed above. No significant change in domain size was observed for DC-SIGN between contact and non-contact membranes (Figures 5C,D; Table 2). We further explored the relative performance of Getis and DBSCAN methods of identifying clusters for analysis using simulated nanodomain images, as described below. Based on the need for user-provided parameter estimation and the fact that DBSCAN performance degrades more rapidly with increasing concentration of domains in the membrane (Figure S2), we conclude that the Getis-based method is a superior means of cluster identification for our dSTORM data.
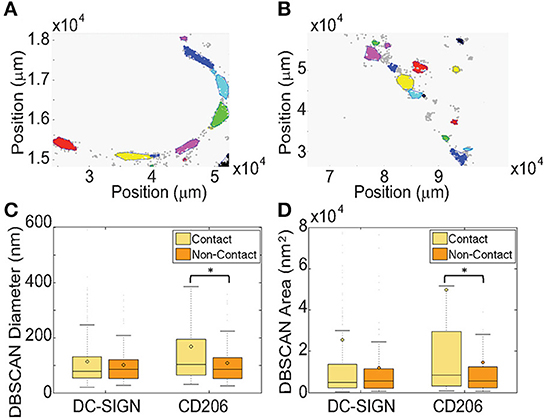
Figure 5. DBSCAN statistical analysis of clustering and local density in fungal contact regions on dendritic cells. (A) A representative map of clusters of CD206 identified using DBSCAN in a zymosan contact ROI on a dendritic cell with a zymosan particle bound. Different colors represent independent clusters identified by the algorithm. (B) A representative map of clusters of CD206 in a non-contact ROI on the same cell as in (A). Results are shown for DBSCAN run with an epsilon value of 30 nm and 10 as a minimum number of points per cluster. (C) Box and whisker plot, as defined in the legend to Figure 4, of the cluster diameters from DBSCAN analysis. (D) Box and whisker plot of the cluster areas from DBSCAN analysis. Results were calculated from 11 and 8 pairs of zymosan contact regions and non-contact regions for DC-SIGN and CD206, respectively. Box and whisker plots were scaled for visualization of the mean and median values, resulting in some larger outliers to be omitted from the plots. The maximum % of outliers not displayed due to scaling is 10.7% of the total dataset. *Indicates that the difference between the value and the value for the non-contact ROI is significant, with a P-value of < 0.05 (Mann-Whitney test).
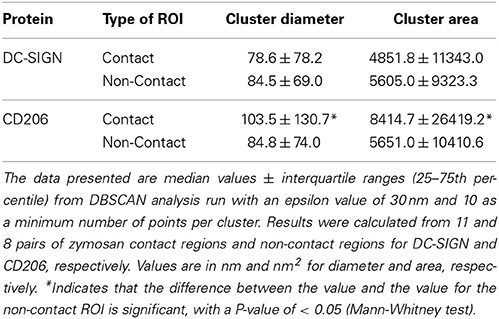
Table 2. DBSCAN statistical analysis of clustering and local density in fungal contact regions on dendritic cells.
Pair Autocorrelation Statistical Analysis of Clustering and Local Density in Fungal Contact Regions on Dendritic Cells
Pairwise distance-based spatial correlation measurements have been developed and constitute another method of analyzing clustering in pointillistic super-resolution datasets such as ours [32–34]. The major advantage of this approach lies in its ability to account for the spatial distribution of multiple localizations of a single probe separately from the spatial features of a larger biological structure (i.e., a membrane nanodomain). This is accomplished by fitting an empirical spatial autocorrelation of pairwise distances between super-resolution localizations in the region of interest to a functional form that contains a term representing the spatial autocorrelation of multiple localizations of a single dye and another term describing the spatial autocorrelation of the biological structure presumed to exist. From this autocorrelation fit, one can extract information about nanoscale structures such as the size of the structure and the density of labeled objects in the structure.
The pair autocorrelation method contrasts with the Getis-based and DBSCAN methods described above in that it is an ensemble measure of nanostructure across the entire region of interest—it does not identify individual domains for measurement. However, it does provide information about characteristic domain features. Heterogeneity in the biological structure of interest will increase the error in the parameters obtained from fitting the autocorrelation data. The shape of the distribution of structural heterogeneity (i.e., normal, skewed/long tailed or multimodal), which is often not known prior to analysis and is not obtained from this method, may also influence the physical meaning of the parameters returned by the fit. These parameters are characteristic values of biological nanostructure averaged over the region of interest. Furthermore, the fitting assumes a biological feature geometry, which is implemented herein as a Gaussian shape. This geometry is a reasonable first approximation for membrane structures, but often the actual nanoscale structure of such objects is not known a priori, structural heterogeneity can be large, and complex structure may exist on multiple length scales.
We applied pair autocorrelation analysis to our dSTORM datasets of CTL distribution in contact site and non-contact membranes. The median autocorrelation fit values for DC-SIGN and CD206 in contact and non-contact membranes are summarized in Figure 6A. Using this method we detected no statistically significant differences (p ≤ 0.05) in objects (fluorophores on labeled primary antibodies) per domain (Figure 6B) or domain size (Figure 6C). However, this data must be interpreted in the light of several important observations and caveats defined below.
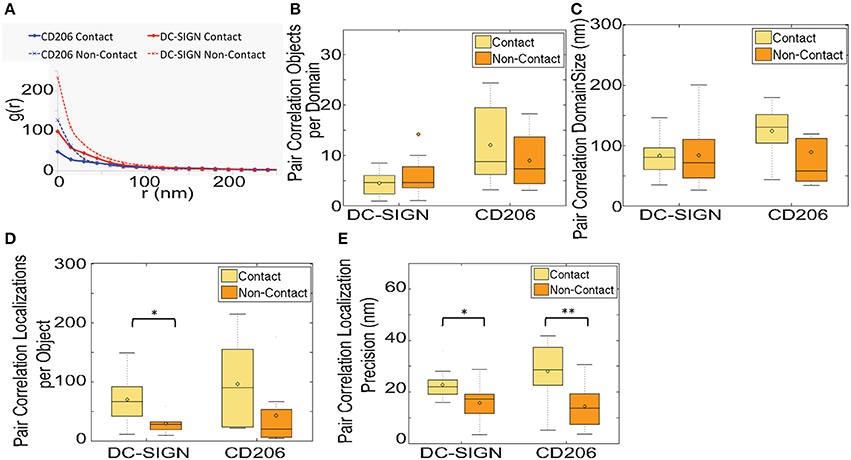
Figure 6. Pair autocorrelation analysis of clustering and local density in fungal contact regions on dendritic cells. (A) Graph of the median value of pair autocorrelation fitting results. (B) Box and whisker plot of the objects per domain from pair autocorrelation analysis. Plot was scaled for visualization of the mean and median values, resulting in some larger outliers for the DC-SIGN Non-Contact ROI to be omitted from the plots (9.1% of the total dataset was omitted). (C) Box and whisker plot of the domain size from pair autocorrelation analysis. (D) Box and whisker plot of the localizations per object from pair autocorrelation analysis. (E) Box and whisker plot of the localization precision from pair autocorrelation analysis. Results were calculated from 11 and 8 pairs of zymosan contact regions and non-contact regions for DC-SIGN and CD206, respectively. *Indicates that the difference between the value and the value for the non-contact ROI is significant, with a P-value of < 0.05, and **indicates a P-value of < 0.01 (Mann-Whitney test).
First, unexpected differences were found in parameters of the pair autocorrelation fits. The number of localizations per object returned by these fits was higher in contact areas for both CTLs (Figure 6D). This value represents the characteristic number of multiple localizations of a single dye in our datasets and should be primarily a function of the photophysics of the dye (i.e., blinking rate) under the imaging conditions used. These differences were observed for the same dye on the identical monoclonal antibody under identical imaging conditions (i.e., from two parts of the same image). We cannot provide a satisfactory physical explanation for why the multiplicity of localization of one AlexaFluor647 should be higher in contact sites. It is possible that increased density and proximity of localizations in the contact may be causing the autocorrelations from multiple localizations of a single dye and autocorrelations from a nearby second dye to be so heavily overlapping that they are difficult to accurately fit to the autocorrelation model. Supporting this conjecture, we also see a significant increase in the localization precision parameter returned by autocorrelation fits for contact site areas (Figure 6E), meaning that the spatial distribution for multiple localizations of a single object is broader in contact sites. Diminished localization precision could be due to a greater density of localizations in the contact, which causes the fitting procedure to erroneously consider a greater number of nearby localizations from different fluorophores as related to the spatial distribution of multiple localizations for a single dye. Finally, we note that the autocorrelation g(0) values are higher for the non-contact than contact site regions (Figure 6A). This is expected because autocorrelation g(0) is inversely proportional to localization density and that density is higher in contact sites. However, the fold decrease in median autocorrelation g(0) between non-contact and contact membrane, which equates to the fold increase in density, is 2.4-fold for DC-SIGN and 2.6-fold for CD206. Therefore, measurement of relative differences in receptor density by autocorrelation g(0) indicates a somewhat lower level of contact site receptor enrichment than determined by reference to the total number of localizations in contact vs. non-contact regions (Figure 2B). This is consistent with the explanation that contact sites have more localizations that are erroneously counted as multiple localizations of a singe dye, leading to additional undercounting of individual objects (fluorophores) in contact sites beyond the density based effect discussed previously in relation to Figure 2B.
We find that a careful consideration of the performance of pair autocorrelation measurements of clustering in our dataset indicates that the method may not be accurately separating autocorrelations from multiple localizations generated from the same dye and those from biological structures similarly for non-contact and contact regions. This method may be adversely influenced by the high localization density in our images. It is also possible that CTL nanodomains are too heterogeneous in shape and/or do not meet the Gaussian-shape assumption of the fit, leading to inaccuracies in the parameters returned by the pair autocorrelation fit. We further explore below the performance of the pair autocorrelation method in simulated dSTORM datasets with variable density and domain shapes that depart mildly from a symmetrical 2D Gaussian shape. Overall, our results with the pair autocorrelation method demonstrate that the method is very powerful and has several important advantages, but factors such as localization density, proximity and domain heterogeneity can strongly influence the results obtained by this method, requiring careful interpretation.
Performance Comparisons of Getis, DBSCAN and Pair Autocorrelation Methods Using Simulated dSTORM Data
We compared the performance of DBSCAN and Getis-based cluster identification algorithms used above (Figures 4, 5; Tables 1, 2) with respect to their ability to identify and measure nanodomains in simulated dSTORM datasets. These nanodomains were intended to be approximately similar to measured objects; they were simulated as symmetrical 2D Gaussian distributions with a specified number of objects, multiplicity in localizations per object and density of nanodomains in the area of simulated 2D space (see Materials and Methods for details). We compared the known input values for these simulated objects with the output of the above clustering metrics. We found that the performance of both Getis and DBSCAN methods of identifying clusters decreased as the domain density increased (Figures S2A,B). The range of domain densities that is most relevant to our experimental data is 1–10 domains/μm2. In this range, both Getis and DBSCAN algorithms initially identified approximately the expected number of domains given the region of interest's area (Figure S2A). As the density of domains increased both methods detected fewer than the expected number of domains, presumably because the probability of domains placed too close together to adequately segment rises with domain density. However, we noted that the Getis method was more accurate than DBSCAN at low densities and remained more accurate as the domain density rose through the relevant range. The size of the simulated domains is based on the Gaussian σ (100 nm) used to create the data, so we evaluated the ability of Getis and DBSCAN methods to identify simulated domain sizes accurately (Figure S2B). Both methods performed well for the identification of domain size up to 10 domains/μm2. However, DBSCAN reported domains as dramatically larger than their true size at >10 domains/μm2 while the ability of Getis-based domain identification to report the correct domain size remained much more accurate over that range.
We used simulated images of symmetrical Gaussian-shaped domains to test the ability of the pair autocorrelation method to accurately extract their key features (Figures S2C–F). Pair autocorrelation exhibited good performance in recovery of accurate domain size (Gaussian σ) (Figure S2C), objects per domain (Figure S2D), localizations per object (Figure S2E) and localization precision (Figure S2F). Performance was strong over the 1–20 domains/μm2 range, although we observed an increasing incidence of autocorrelation fits with unrealistic values at higher density. We observed an accompanying progressive increase in both the localization precision and its variance across multiple simulations with increasing domain density (Figure S2F). We note that this performance is for a dataset where all domains are uniform in shape and size.
Biological membrane structures are generally heterogeneous in their geometric form. Therefore, we performed a further set of dSTORM simulations to determine how a mild departure from a symmetrical 2D Gaussian shape in simulated nanodomains would influence the performance of pair autocorrelation analysis. We simulated Gaussian domains with unequal x and y variance such that variance in one dimension was 70% of that in the other dimension. All other simulation input values (objects per domain, localizations per object and localization precision) were equivalent to those used above for symmetrical Gaussian domain simulations. We found that even this mild departure from a symmetrical Gaussian geometry resulted in inaccuracy in the recovered parameters and increased variance amongst simulation repeats. The returned value for mean domain size (Gaussian σ) was relatively constant over the 1–10 domains/μm2 range, but the recovered size was considerably smaller than either dimension's input value and the variance over multiple simulation runs was quite large (Figure S2G). Over the same domain density, the recovered values for objects per domain (Figure S2H) and localizations per object (Figure S2I) were inaccurate and varied with domain density, while the input values for these parameters was constant. While the performance of the pair autocorrelation method is excellent for uniform data that exactly match the assumed geometry, we conclude that even a relatively mild departure from these conditions, that is certainly comparable to the level of geometric heterogeneity in our experimental data, is sufficient to cause considerably decreased accuracy and precision in the recovered domain parameters.
We conclude that the Getis-based method performs as well or better than the DBSCAN method under the most relevant conditions for nanodomain identification and analysis. Under ideal or very well characterized conditions, pair autocorrelation provides excellent results. However, the heterogeneities present in our biological dataset, which are likely characteristic of biological data, suggest that the results of pair autocorrelation measurements should be interpreted carefully, bearing in mind the assumptions inherent in the analysis and potential artifacts arising from the imaging process. We therefore emphasize our experimental cluster measurements in Figure 3 as likely to provide the most accurate and versatile measurement of CTL nanostructure amongst the methods we have employed.
Discussion
The membrane interface between leukocytes and particulate targets of engulfment has been termed the “phagocytic synapse” by various authors [13, 14]. Phagocytosis serves important functions in host defense, including engulfment, destruction and antigenic sampling of microbial pathogens via pattern recognition receptors. The manner in which the lateral organization of CTL membrane receptors enables specific recognition and signaling in the presence of fungal pathogens remains an important open question. For several members of the CTL family of receptors, including DC-SIGN, CD206 and Dectin-1, clustering of receptors into domains has been identified as a required step for proper recognition of pathogenic particles [5, 6, 39, 40]. Indeed, engagement of Dectin-1 signaling via its hemITAM domain is important for phagocytosis of fungal particles, and previous work has shown that segregation of the transmembrane phosphatases CD45 and CD148 is required for activation of phagocytosis of fungal particles via Dectin-1 [13, 41].
Previous studies using conventional, diffraction-limited fluorescence microcopy methods to explore receptor structure at the phagocytic synapse have suggested models of engulfment in which nanoscale organization of receptors is a key factor in regulation of phagocytic efficiency. Quantitative fluorescence methods such as super-resolution imaging can provide higher resolution data regarding changes in receptor organization in phagocytic synapses, but to our knowledge, these imaging tools, and their accompanying analytical methods, have not been previously used to quantify changes in receptor nanostructure during leukocyte interaction with fungal particles. In this work, we have identified local changes in the lateral distribution of DC-SIGN and CD206 that occur at the sites of contact between immature dendritic cells and fungal zymosan particles using both quantitative confocal fluorescence and super-resolution microscopy. Our results provide the first direct evidence that membrane nanostructure of two mannan-binding CTLs in fungal contacts changes significantly during the establishment of a phagocytic synapse. Most notably, nanodomains of both CTLs were larger and more closely packed in fungal contacts relative to non-contact membranes.
Cluster detection and analysis methods are critical for extracting quantitative information about spatial organization of biological structures from pointillistic datasets derived from various nanoscale imaging modalities. Some examples of methods that can be useful in this context are thresholding of normalized Ripley's L(r) functions [20, 42], localization pairwise distance auto-correlation and cross-correlation [32–34], density based clustering [31] and hierarchical clustering [43]. Some of these methods are compared with experimental and simulated data in this work, revealing different strengths of each approach. Of course, as receptor domains become more closely packed on the surface of a cell, experimental and analytical difficulties increase that are likely to affect all of the above methods. First, finite fluorophore photon flux and optical imperfections present in any microscope create localization error that fundamentally limits precision in localization microscopies (~20 nm in our studies). When domain edge-to-edge separations approach this limit, these cluster detection methods will likely detect the domains as a single structure. Second, as noted above, it is possible that fluorophores will be undercounted as density of probes increases in a structure due to rejection of events with >1 dye emitter in a sub-diffraction volume. While this undercounting effect makes extraction of probe densities difficult, we do not expect it to introduce bias into domain detection or geometric measurement. For dSTORM imaging to be successful, dyes must infrequently and stochastically enter a state capable of fluorescence emission. Dyes enter this state independently. Therefore, the likelihood of simultaneous emission from any pair of dyes in a sub-diffraction sized domain is equivalent and independent of their separation distance. We expect that localizations on all pairwise distance length scales will be similarly affected by undercounting at high probe density, and no bias will be introduced to pairwise distance distributions or other measures used in our work. Third, we must consider whether an increase in localization density in fungal contact site domains would impact performance of methods such as the DBSCAN and Getis-based methods we employ. We conceive of a membrane protein domain as a structure with a boundary inside which are proteins participating in the domain via intermolecular interactions, and outside which are proteins not undergoing such interactions. In a hypothetical domain where the density of domain proteins increases in the presence of a fixed boundary, we might expect more localizations within ~20 nm of the boundary, according to the localization error distribution, but we expect that any broadening of the domain due to an increase in probe density alone would be relatively small and restricted to this effect. We note that it is important that domains be well sampled with probe, and in our work, we operated at saturating probe-binding conditions to avoid underlabeling.
In the present analysis, we surveyed receptor occupancy over a relatively long time window of hours to set our super-resolution data into the context of the evolving host-microbe interaction at the dendritic cell plasma membrane. Based on our confocal data analysis, most receptor recruitment to zymosan contacts occurs in the first hour of contact and there is relatively little change out to 4-h contacts. The 4-h contact sites subjected to super-resolution imaging therefore represent stable host-pathogen interaction structures where significant receptor reorganization has already occurred. Phagocytosis of fungal particles can occur quite rapidly, yet we often observe that fungal particles remain on the surface of human dendritic cells for prolonged periods of time. Indeed, we have previously reported that only ~17% of zymosan particles that stably bind to human immature dendritic cell membranes are internalized over a period of hours, and prolonged extracellular interactions are common with human immature dendritic cell, even at low particle:dendritic cell ratios (8). The signaling occurring at these short- and long-term contacts could differ, as could the functional consequences of these types of cellular interaction for innate immune activation and antigen presentation. While the process of membrane remodeling and internalization required to achieve phagocytosis may be rapid, there may also be clinically relevant settings of innate immune fungal recognition that do not permit rapid phagocytosis of fungi but instead encourage prolonged interactions. For example, leukocytes present in the highly interconnected network of a C. albicans biofilm are thought not to participate in phagocytosis even though they are surrounded by fungal cells and fungal extracellular matrix [44].
Extending earlier work by TEM and NSOM [5–7], our previous studies had determined that both DC-SIGN and CD206 are expressed in ~80 nm nanodomains on the surface of dendritic cells in the absence of exogenous ligand [12]. Due to the very small nature of these domains, super-resolution imaging was required to resolve these structures at the nanoscale [15, 45]. Thus, we investigated whether the CTL aggregation at contact sites was the result of a change in the nanostructuring of these receptors using the dSTORM super-resolution method. Quantitative analysis clustering from dSTORM single molecule localizations determined that both DC-SIGN and CD206 exhibit clustering on significantly longer length scales in the contact region when compared to non-contact membrane regions on the same cell. Therefore, we are no longer able to resolve ~80 nm nanodomains in the contact region. We can conclude that if ordering on this spatial scale exists in the contact site, domains must be packed within identified nanodomains closely enough to achieve sub-resolution interdomain edge separations of <30 nm. We note that non-contact site CTL nanodomains identified by our Getis-based method (~120 nm equivalent diameter) are somewhat larger than those we identified earlier in resting dendritic cells (~80 nm). This is most likely explained by the use of different imaging platforms and modalities (BLINK microscopy vs. dSTORM), different labeling strategies (primary antibody plus labeled secondary antibody previously vs. directly labeled primary antibody herein), different measurement methods (direct 2D Gaussian fitting vs. Getis-based equivalent diameter calculation), and differences in the orientation of the membrane relative to the optical axis (cross-section vs. en face).
The distinct mechanisms that allow CTL nanodomains to assemble into larger more dense structures following exposure to ligand and how receptor density on the nanoscale influences signaling remains unknown. This point is of particular interest as recent findings suggest that DC-SIGN domains contain, as a lower limit, only 1–2 tetramers of protein on average [12, 37]. Our results on local clustering presented in this manuscript suggest that the receptors become significantly more densely packed on the nanoscale, likely leading to spatial arrangements that trigger different interactions between specific lipids and proteins. For DC-SIGN, the mechanism by which this occurs is particularly intriguing because microdomain stability appears not to depend directly on the presence of the cytoplasmic domain but rather on the ectodomain of the protein [9, 11]. Importantly, the merging of originally separate types of CTL domains within a single larger structure, or the formation of heterotypic interdomain boundary zones, could give rise to signaling crosstalk that would not have happened in the resting state where receptors are well-segregated from one another, as is the case for DC-SIGN and CD206 in resting dendritic cells [12].
In attacking the problem of receptor lateral organization at the zymosan-dendritic cell contact zone, we tested and compared several methods for analyzing protein clustering in super-resolution data. This is an important current problem in maximizing the ability of super-resolution methods to contribute novel, quantitative insight into a wide variety of biological systems where the density of relevant proteins is high, including host-pathogen interactions. We found that adaptation of the Getis method offers distinct advantages in terms of providing local information on protein organization in an unbiased manner, thereby providing a view of the phagocytic synapse in unprecedented detail.
In the near future, however, a number of important extensions of our study can be envisioned. First, one limitation of this investigation is that the chemically prepared zymosan particles are not likely to completely recapitulate ligand induced alterations in CTL nanostructure because of the interplay in the lateral organization of live fungal pathogen membranes and the plasma membrane of a dendritic cell occurring at the phagocytic synapse. For instance, work from the Lipke and Dufrene laboratories has demonstrated rearrangements of Als-family mannoprotein adhesins from a random distribution in the C. albicans cell wall to an amyloid form (consisting of 100–500 nm sized clusters) following force application by an AFM cantilever [46, 47]. Interestingly, the clustered distribution of Als proteins spreads to regions of the cell wall never contacted by the cantilever, suggesting that rearrangements of mannoproteins at host-fungal contact sites could induce global changes in cell wall structure. Thus, although the changes in CTL nanostructure that we have observed will reflect ligand nanostructure on the particle, future studies will focus on CTL and cell wall ligand nanostructure generated at contact sites with live fungal pathogens such as C. albicans. Second, in this study we investigated 4 h contact sites representing stable host-pathogen interaction structures where significant receptor reorganization has already occurred, it will be interesting to focus attention on shorter time scales at both the diffraction-limited and super-resolution levels to assess receptor recruitment patterns at very early time points. Third, an alternative approach to measuring geometries of static nanoscale structures would be to examine the dynamic interactions of protein and lipids in CTL domains using methods such as Fluorescence Correlation Spectroscopy and Single Molecule Tracking in sub-diffraction observation volumes, such as those achieved by Stimulated Emission Depletion or near field optical methods [48–53] as well as live cell super-resolution techniques [54–57] Our previous work with DC-SIGN demonstrated that this protein exhibits very little exchange between the domain and the surrounding membrane and low intradomain mobility [9–11]. Extension of these methods to other CTLs, lipid-protein interactions and comparison of resting vs. fungal contact domain dynamics could be informative. Lastly, our attempts to address super-resolution co-localization of DC-SIGN and CD206 in the present study were complicated by z-axis drift in two color datasets that prevented accurate registration of image datasets. We anticipate that improved z-axis positional stability will make direct observations of CTL mixing in fungal contacts a promising target for future investigations.
At this juncture, our results raise a number of important questions regarding the manner in which dendritic cell CTLs like DC-SIGN and CD206 alter their spatial arrangements on the cell membrane when in contact with fungal pathogens to produce key elements of the innate immune response. For example, what are the mechanisms responsible for receptor recruitment to and clustering within contact sites, and are they shared between multiple types of receptors? And, what is the functional significance of increased CTL nanodomain size and packing density with respect to binding avidity and cellular activation? Answers to these questions will substantially increase our understanding of membrane domain structure-function relationships in general, and of CTL domains in particular, thus potentially leading to the design of new therapeutic agents that target host-pathogen interactions for the treatment of human mycoses.
Conflict of Interest Statement
The authors declare that the research was conducted in the absence of any commercial or financial relationships that could be construed as a potential conflict of interest.
Acknowledgments
We thank members of the Jacobson, Lidke, and Neumann labs, and Dr. Stan Steinberg for technical support and advice. We would also like to thank Philip Tinnefeld (Braunschweig University of Technology, Braunschweig, Germany) and members of his lab for their gracious advice, and technical support to one of us (Michelle S. Itano) in obtaining preliminary data supporting this project. This work was supported primarily by NIH grant GM-041402 (Ken Jacobson and Nancy L. Thompson). Additional funding was provided by NIH Cell Migration Consortium grant GM-064346 (Ken Jacobson), NSF grant MCB-0641087 (Nancy L. Thompson), STMC funding to Keith A. Lidke, Carolyn Pehlke, Matthew S. Graus, Michael J. Wester, and Aaron K. Neumann (NIH 5P50GM085273), UNM Medical Trust Fund and Tobacco Settlement RAC grant to Aaron K. Neumann, and STMC funding to Michelle S. Itano to support a visiting scientist position. Matthew S. Graus was additionally supported by the New Mexico Cancer Nanotechnology Training Center CA-R25153825.
Supplementary Material
The Supplementary Material for this article can be found online at: http://www.frontiersin.org/journal/10.3389/fphy.2014.00046/abstract
References
1. Adema GJ, Hartgers F, Verstraten R, De Vries E, Marland G, Menon S, et al. A dendritic-cell-derived C-C chemokine that preferentially attracts naive T cells. Nature (1997) 387:713–7. doi: 10.1038/42716
2. Banchereau J, Steinman RM. Dendritic cells and the control of immunity. Nature (1998) 392:245–52. doi: 10.1038/32588
3. Cambi A, Koopman M, Figdor CG. How C-type lectins detect pathogens. Cell Microbiol. (2005) 7:481–8. doi: 10.1111/j.1462-5822.2005.00506.x
4. Svajger U, Anderluh M, Jeras M, Obermajer N. C-type lectin DC-SIGN: an adhesion, signalling and antigen-uptake molecule that guides dendritic cells in immunity. Cell Signal (2010) 22:1397–1405. doi: 10.1016/j.cellsig.2010.03.018
5. Cambi A, De Lange F, Van Maarseveen NM, Nijhuis M, Joosten B, Van Dijk EM, et al. Microdomains of the C-type lectin DC-SIGN are portals for virus entry into dendritic cells. J Cell Biol. (2004) 164:145–55. doi: 10.1083/jcb.200306112
6. Koopman M, Cambi A, De Bakker BI, Joosten B, Figdor CG, Van Hulst NF, et al. Near-field scanning optical microscopy in liquid for high resolution single molecule detection on dendritic cells. FEBS Lett. (2004) 573:6–10. doi: 10.1016/j.febslet.2004.07.035
7. De Bakker BI, De Lange F, Cambi A, Korterik JP, Van Dijk EM, Van Hulst NF, et al. Nanoscale organization of the pathogen receptor DC-SIGN mapped by single-molecule high-resolution fluorescence microscopy. Chemphyschem (2007) 8:1473–80. doi: 10.1002/cphc.200700169
8. Neumann AK, Jacobson K. A novel pseudopodial component of the dendritic cell anti-fungal response: the fungipod. PLoS Pathog. (2010) 6:e1000760. doi: 10.1371/journal.ppat.1000760
9. Liu P, Wang X, Itano MS, Neumann AK, Jacobson K, Thompson NL. The formation and stability of DC-SIGN microdomains require its extracellular moiety. Traffic (2012) 13:715–26. doi: 10.1111/j.1600-0854.2012.01337.x
10. Neumann AK, Thompson NL, Jacobson K. Distribution and lateral mobility of DC-SIGN on immature dendritic cells–implications for pathogen uptake. J Cell Sci. (2008) 121:634–43. doi: 10.1242/jcs.022418
11. Itano MS, Neumann AK, Liu P, Zhang F, Gratton E, Parak WJ, et al. DC-SIGN and influenza hemagglutinin dynamics in plasma membrane microdomains are markedly different. Biophys J. (2011) 100:2662–70. doi: 10.1016/j.bpj.2011.04.044
12. Itano MS, Steinhauer C, Schmied JJ, Forthmann C, Liu P, Neumann AK, et al. Super-resolution imaging of C-type lectin and influenza hemagglutinin nanodomains on plasma membranes using blink microscopy. Biophys J. (2012) 102:1534–42. doi: 10.1016/j.bpj.2012.02.022
13. Tsai RK, Discher DE. Inhibition of “self” engulfment through deactivation of myosin-II at the phagocytic synapse between human cells. J Cell Biol. (2008) 180:989–1003. doi: 10.1083/jcb.200708043
14. Goodridge HS, Reyes CN, Becker CA, Katsumoto TR, Ma J, Wolf AJ, et al. Activation of the innate immune receptor Dectin-1 upon formation of a ‘phagocytic synapse’. Nature (2011) 472:471–5. doi: 10.1038/nature10071
15. Betzig E, Patterson GH, Sougrat R, Lindwasser OW, Olenych S, Bonifacino JS, et al. Imaging intracellular fluorescent proteins at nanometer resolution. Science (2006) 313:1642–5. doi: 10.1126/science.1127344
16. Hess ST, Girirajan TP, Mason MD. Ultra-high resolution imaging by fluorescence photoactivation localization microscopy. Biophys J. (2006) 91:4258–72. doi: 10.1529/biophysj.106.091116
17. Rust MJ, Bates M, Zhuang X. Sub-diffraction-limit imaging by stochastic optical reconstruction microscopy (STORM). Nat Methods (2006) 3:793–5. doi: 10.1038/nmeth929
18. Smith CS, Joseph N, Rieger B, Lidke KA. Fast, single-molecule localization that achieves theoretically minimum uncertainty. Nat Methods (2010) 7:373–5. doi: 10.1038/nmeth.1449
19. Getis A, Ord JK. The analysis of spatial association by use of distance statistics. Geograph Anal. (1992) 24:189–206. doi: 10.1111/j.1538-4632.1992.tb00261.x
20. Williamson DJ, Owen DM, Rossy J, Magenau A, Wehrmann M, Gooding JJ, et al. Pre-existing clusters of the adaptor Lat do not participate in early T cell signaling events. Nat Immunol. (2011) 12:655–62. doi: 10.1038/ni.2049
22. Di Carlo FJ, Fiore JV. On the composition of zymosan. Science (1958) 127:756–7. doi: 10.1126/science.127.3301.756-a
23. Underhill DM. Macrophage recognition of zymosan particles. J Endotoxin Res. (2003) 9:176–180. doi: 10.1179/096805103125001586
24. Graus, MS, Pehlke C, Wester MJ, Davidson LB, Steinberg SL, Neumann AK. A new tool to quantify receptor recruitment to cell contact sites during host-pathogen interaction. PLoS Comput Biol. (2014) 10:e1003639. doi: 10.1371/journal.pcbi.1003639
25. Heilemann M, Van De Linde S, Schuttpelz M, Kasper R, Seefeldt B, Mukherjee A. et al. Subdiffraction-resolution fluorescence imaging with conventional fluorescent probes. Angew Chem Int Ed Engl. (2008) 47:6172–6. doi: 10.1002/anie.200802376
26. Heilemann M, Van De Linde S, Mukherjee A, Sauer M. Super-resolution imaging with small organic fluorophores. Angew Chem Int Ed Engl. (2009) 48:6903–08. doi: 10.1002/anie.200902073
27. Shi X, Lim J, Ha T. Acidification of the oxygen scavenging system in single-molecule fluorescence studies: in situ sensing with a ratiometric dual-emission probe. Anal Chem. (2010) 82:6132–8. doi: 10.1021/ac1008749
28. Huang F, Schwartz SL, Byars JM, Lidke KA. Simultaneous multiple-emitter fitting for single molecule super-resolution imaging. Biomed Opt Exp. (2011) 2:1377–93. doi: 10.1364/BOE.2.001377
29. Mlodzianoski MJ, Schreiner JM, Callahan SP, Smolková K, Dlasková A, Santorová J, et al. ample drift correction in 3D fluorescence photoactivation localization microscopy. Optics Exp. (2011) 19:15009–19. doi: 10.1364/OE.19.015009
30. Getis A, Aldstadt J. Constructing the spatial weights matrix using a local statistic. Geograph. Anal. (2004) 36:90–104. doi: 10.1111/j.1538-4632.2004.tb01127.x
31. Ester M, Kriegel HP, Sander J, Xu X. A density based algorithm for discovering cluster in large spatial databases with noise. In: Proceedings of the Second International Conference on Knowledge Discovery and Data Mining: Portland, OR: AAAI Press, (1996). p. 226–31.
32. Sengupta P, Jovanovic-Talisman T, Skoko D, Renz M, Veatch SL, Lippincott-Schwartz J. Probing protein heterogeneity in the plasma membrane using PALM and pair correlation analysis. Nat Methods (2011) 8:96975. doi: 10.1038/nmeth.1704
33. Veatch SL, Chiang EN, Sengupta P, Holowka DA, Baird BA. Quantitative nanoscale analysis of IgE-FcepsilonRI clustering and coupling to early signaling proteins. J Phys Chem B (2012a) 116:6923–35. doi: 10.1021/jp300197p
34. Veatch SL, Machta BB, Shelby SA, Chiang EN, Holowka DA, Baird BA. Correlation functions quantify super-resolution images and estimate apparent clustering due to over-counting. PLoS ONE (2012b) 7:e31457. doi: 10.1371/journal.pone.0031457
35. Kiskowski, MA, Hancock JF, Kenworthy AK. On the use of Ripley's K-function and its derivatives to analyze domain size. Biophys J. (2009) 97:1095–103. doi: 10.1016/j.bpj.2009.05.039
36. Edelsbrunner H, Kirkpatrick DG, Seidel R. On the shape of a set of points in the plane. IEEE Trans Inform Theory (1983) 29:551–9. doi: 10.1109/TIT.1983.1056714
37. Liu P, Wang X, Itano MS, Neumann AK, De Silva AM, Jacobson K, et al. Low copy numbers of DC-SIGN in cell membrane microdomains: implications for structure and function. Traffic (2014) 15:179–96. doi: 10.1111/tra.12138
38. Deschout H, Zanacchi FC, Mlodzianoski M, Diaspro A, Bewersdorf J, Hess ST, et al. Precisely and accurately localizing single emitters in fluorescence microscopy. Nat Methods (2014) 11:253–66. doi: 10.1038/nmeth.2843
39. Snyder GA, Ford J, Torabi-Parizi P, Arthos JA, Schuck P, Colonna M, et al. Characterization of DC-SIGN/R interaction with human immunodeficiency virus type 1 gp120 and ICAM molecules favors the receptor's role as an antigen-capturing rather than an adhesion receptor. J Virol. (2005) 79:4589–98. doi: 10.1128/JVI.79.8.4589-4598.2005
40. Heinsbroek SE, Taylor PR, Martinez FO, Martinez-Pomares L, Brown GD, Gordon S. Stage-specific sampling by pattern recognition receptors during Candida albicans phagocytosis. PLoS Pathog. (2008) 4:e1000218. doi: 10.1371/journal.ppat.1000218
41. Underhill DM, Rossnagle E, Lowell CA, Simmons RM. Dectin-1 activates Syk tyrosine kinase in a dynamic subset of macrophages for reactive oxygen production. Blood (2005) 106:2543–550. doi: 10.1182/blood-2005-03-1239
42. Rossy J, Cohen E, Gaus K, Owen DM. Method for co-cluster analysis in multichannel single-molecule localisation data. Histochem Cell Biol. (2014) 141:605–12. doi: 10.1007/s00418-014-1208-z
43. Espinoza FA, Oliver JM, Wilson BS, Steinberg SL. Using Hierarchical clustering and dendrograms to quantify the clustering of membrane protesin. Bull Math Biol. (2012) 74:190–211. doi: 10.1007/s11538-011-9671-3
44. Chandra J, Mccormick TS, Imamura Y, Mukherjee PK, Ghannoum MA. Interaction of Candida albicans with adherent human peripheral blood mononuclear cells increases C. albicans biofilm formation and results in differential expression of pro- and anti-inflammatory cytokines. Infect Immun. (2007) 75:2612–20. doi: 10.1128/IAI.01841-06
46. Alsteens D, Garcia MC, Lipke PN, Dufrene YF. Force-induced formation and propagation of adhesion nanodomains in living fungal cells. Proc Natl Acad Sci USA (2010) 107:20744–49. doi: 10.1073/pnas.1013893107
47. Lipke PN, Garcia MC, Alsteens D, Ramsook CB, Klotz SA, Dufrene YF. Strengthening relationships: amyloids create adhesion nanodomains in yeasts. Trends Microbiol. (2012) 20:59–65. doi: 10.1016/j.tim.2011.10.002
48. Eggeling C, Ringemann C, Medda R, Schwarzmann G, Sandhoff K, Polyakova S, et al. Direct observation of the nanoscale dynamics of membrane lipids in a living cell. Nature (2009) 457:1159–62. doi: 10.1038/nature07596
49. van Zanten TS, Cambi A, Koopman M, Joosten B, Figdor CG, Garcia-Parajo MF. Hotspots of GPI-anchored proteins and integrin nanoclusters function as nucleation sites for cell adhesion. Proc Natl Acad Sci USA (2009) 106:18557–62. doi: 10.1073/pnas.0905217106
50. Sahl SJ, Leutenegger M, Hilbert M, Hell SW, Eggeling C. Fast molecular tracking maps nanoscale dynamics of plasma membrane lipids. Proc Natl Acad Sci USA (2010) 107:6829–34. doi: 10.1073/pnas.0912894107
51. van Zanten TS, Lopez-Bosque MJ, Garcia-Parajo MF. Imaging individual proteins and nanodomains on intact cell membranes with a probe-based optical antenna. Small (2010) 6:270–75. doi: 10.1002/smll.200901204
52. Manzo C, van Zanten TS, Garcia-Parajo MF. Nanoscale fluorescence correlation spectroscopy on intact living cell membranes with NSOM probes. Biophys J. (2011) 100:L8–10. doi: 10.1016/j.bpj.2010.12.3690
53. Mueller V, Ringemann C, Honigmann A, Schwarzmann G, Medda R, Leutenegger M, et al. STED nanoscopy reveals molecular details of cholesterol- and cytoskeleton-modulated lipid interactions in living cells. Biophys J. (2011) 101:1651–60. doi: 10.1016/j.bpj.2011.09.006
54. Manley S, Gillette JM, Patterson GH, Shroff H, Hess HF, Betzig E, et al. High-density mapping of single-molecule trajectories with photoactivated localization microscopy. Nat Methods (2008) 5:155–7. doi: 10.1038/nmeth.1176
55. Shroff H, Galbraith CG, Galbraith JA, Betzig E. Live-cell photoactivated localization microscopy of nanoscale adhesion dynamics. Nat Methods (2008) 5:417–23. doi: 10.1038/nmeth.1202
56. Hirvonen LM, Wicker K, Mandula O, Heintzmann R. Structured illumination microscopy of a living cell. Eur Biophys J. (2009) 38:807–12. doi: 10.1007/s00249-009-0501-6
Keywords: CD206, DC-SIGN, dendritic cell, dSTORM, mannan, zymosan
Citation: Itano MS, Graus MS, Pehlke C, Wester MJ, Liu P, Lidke KA, Thompson NL, Jacobson K and Neumann AK (2014) Super-resolution imaging of C-type lectin spatial rearrangement within the dendritic cell plasma membrane at fungal microbe contact sites. Front. Phys. 2:46. doi: 10.3389/fphy.2014.00046
Received: 30 May 2014; Accepted: 18 July 2014;
Published online: 12 August 2014.
Edited by:
Ali Mobasheri, University of Surrey, UKReviewed by:
Michael B. Fessler, National Institute of Environmental Health Sciences, USAThomas Harder, Otto-von-Guericke-University Magdeburg, Germany
Copyright © 2014 Itano, Graus, Pehlke, Wester, Liu, Lidke, Thompson, Jacobson and Neumann. This is an open-access article distributed under the terms of the Creative Commons Attribution License (CC BY). The use, distribution or reproduction in other forums is permitted, provided the original author(s) or licensor are credited and that the original publication in this journal is cited, in accordance with accepted academic practice. No use, distribution or reproduction is permitted which does not comply with these terms.
*Correspondence: Aaron K. Neumann, Department of Pathology, 1 University of New Mexico, MSC-084640, Albuquerque, NM 87131, USA e-mail: akneumann@salud.unm.edu
†Present address: Michelle S. Itano, Laboratory of Cellular Biophysics, The Rockefeller University, New York, USA
‡These authors have contributed equally to this work.