CO2 dissociation using the Versatile atmospheric dielectric barrier discharge experiment (VADER)
 Michael A. Lindon
 Earl E. Scime
- Department of Physics and Astronomy, West Virginia University, Morgantown, WV, USA
Dissociation of CO2 is investigated in an atmospheric pressure dielectric barrier discharge (DBD) with a simple, zero dimensional (0-D) chemical model and through experiment. The model predicts that the primary CO2 dissociation pathway within a DBD is electron impact dissociation and electron-vibrational excitation. The relaxation kinetics following dissociation are dominated by atomic oxygen chemistry. The experiments included investigating the energy efficiencies and dissociation rates of CO2 within a planar DBD, while the gas flow rate, voltage, gas composition, driving frequency, catalyst, and pulse modes were varied. Some of the VADER results include a maximum CO2 dissociation energy efficiency of 2.5 ± 0.5%, a maximum CO2 dissociation rate of 4 ± 0.4 ×10⁻⁶ mol CO2/s (5 ± 0.5% percent dissociation), discovering that a resonant driving frequency of ~30 kHz, dependent on both applied voltage and breakdown voltage, is best for efficient CO2 dissociation and that TiO2, a photocatalyst, improved dissociation efficiencies by an average of 18% at driving frequencies above 5 kHz.
1. Introduction
Global warming is one of the foremost technological issues in the beginning of the 21st century. The consequences of global warming include ocean acidification, a reduction in arctic ice cap thicknesses and a global increase in severe weather events [1]. Sixty percent of the current global warming trends can be correlated with increased CO2 emissions from the industrialization of countries and 90% of CO2 emissions come from the burning of fossil fuels [2]. The largest source of CO2 emission is from large emission sources, such as power plants (~41%).
There are two principal methods for reducing CO2 emissions from large emission sources: carbon capture and sequestration (CCS) and carbon capture and utilization (CCU). CCS is the process of collecting CO2 from the flue of a reactor or power plant using CO2 absorbers or chemical processes, followed by transporting the gas to a reservoir to be permanently stored [3]. CCS entails many complications, including finding a suitable reservoir that does not adversely affect the surrounding environment and which permanently contains the gas and a large energy cost for separation, transportation, and pumping. Even so, research is currently being done to overcome these barriers.
CCU entails converting CO2 into different chemicals that can be stored or used commercially. Research into this method of CO2 remediation has taken many forms, including growing bio-fuel algae and converting CO2 directly into hydrocarbons or commercial products using different combinations of heat, pressure, catalysts and plasma [4, 5]. Each of these methods come with their own set of issues, which most often stem from low energy efficiencies and poor chemical selectivity. This work focuses on the efficacy of atmospheric plasma CCU, specifically using a Dielectric Barrier Discharge (DBD), and photocatalysts for the dissociation of CO2 into its constituents as a precursor to the formation of value added chemicals.
The first step to understanding CCU using a DBD plasma is understanding the chemistry of non-thermal, atmospheric pressure plasmas. Section 2 reviews the dissociation chemistry of CO2, followed by a set of models of the DBD dynamics and chemistry important for CO2 dissociation. The model was compared to the results of the Versatile Atmospheric dielectric barrier Discharge ExpeRiment (VADER). The VADER experimental setup is discussed in Section 3 and the experimental results are in Section 4. The results include the CO2 dissociation efficiencies, dissociation rates and the different variables that affect efficiency. For full details about the models and experiments, see Lindon [6].
While the work herein focuses on CO2 dissociation, it should be noted that the techniques and analyses shown can be generalized to other plasma chemical reactions, specifically endothermic reactions within a plasma.
2. Theory
2.1. CO2 Dissociation Chemistry
The simplest dissociation pathways for CO2 are:
where ΔH is the change in enthalpy. The oxygen atom (O) reacts with other oxygen atoms or CO2 to form O2
or
Combining the above equations give the full reaction [7]
Activation energy is the minimum input energy needed to start a reaction. The activation energy for CO2 dissociation is ~5.52 electron volts (eV). After energy equal to or greater than the activation energy is supplied, either 2.58 eV of input energy per O is recovered through oxygen recombination or an additional 0.34 eV is spent to remove an oxygen from a CO2 molecule; easily attainable in a plasma. Thus, the minimum energy cost for dissociating a single CO2 molecule into carbon monoxide (CO) and half an oxygen molecule (O) is 2.94 eV.
These chemical equations only include the most basic and efficient dissociation paths. They do not include the many single and multistep reaction paths that occur within a CO2 plasma, nor any chemical and system inefficiencies, including quenching, energy recuperation, energy deposition in the molecular energy states, and higher energy reaction pathways.
Quenching refers to the rate at which reactants are cooled in an effort to halt or slow down reverse and/or unwanted reactions. If a CO2 plasma isn't properly quenched, reverse reactions (like CO + O2 → CO2 ΔH ~ −2.94 eV/molec) will dominate the system kinetics as the gas cools [8]. The best way to suppress these reverse reactions is to use a system with a very large quenching rate or to use an intrinsically low temperature system, like a DBD or corona discharge, for dissociation.
Energy recuperation is linked to quenching and is the ability of a system to reuse the input and reaction energies of a chemical system for other purposes. In the case of CO2 dissociation, not recuperating any of the reaction energies is equivalent to losing 2.58 eV per CO2 dissociated; due to oxygen atom recombination (5.16 eV, Equation 2). Energy recuperation is partially addressed with the inclusion of a photocatalyst into the reaction chamber (discussed in Subsection 4.2.6), however, cooling and energy losses outside of the reaction chamber were not addressed. Therefore, CO2 dissociation in VADER is guaranteed to require energies greater than 2.94 eV per reaction.
In a molecule there are four reservoirs (states) into which energy can be deposited: the vibrational, electronic, rotational and kinetic states. Energy in each of these reservoirs enable a different path for dissociation with a different efficiency. According to theory, the most efficient CO2 dissociation path puts all of the energy into vibrational excitation, while keeping kinetic, electronic and rotational energies at a minimum [8–10]. For example, by exciting the asymmetric vibrational states of CO2 with a microwave discharge at moderate pressures (50–200 Torr), CO2 was dissociated with an energy efficiency of up to 90% [8, 11]. However, direct excitation of vibrational modes using electromagnetic radiation has several issues at atmospheric pressures, including relatively low energy efficiencies and problematic optical access in carbon-rich processing systems.
DBDs and corona discharges preferentially excite electronic states. However, electron energy is efficiently mode-converted to vibrational energy during collisions with CO2. The electronic-vibrational cross-section for CO2 peaks at electron energies between 3 and 6 eV with a cross-section greater than 1 × 10⁻¹⁶ cm2 for 1 eV < Te < 10 eV; allowing for an effective pathway for vibrational excitation and CO2 dissociation [12]. Electronic excitation also allows for additional dissociation pathways, the most common of which are dissociative attachment, impact dissociation, and dissociative ionization [13, 14]. These additional reaction paths have considerably smaller cross-sections as compared to vibrational excitation, but can occur at lower electron energies. For instance, dissociative attachment occurs at electron energies as low as 3.4 eV [12, 15, 16].
Another form of energy deposition inefficiency stems from the numerous dissociative pathways within a plasma. Longer pathways require larger energy input, which take energy away from dissociative processes and increase the need for energy recuperation. The majority of these higher energy dissociative pathways in a CO2 plasma come from radical chemistry and ionization processes, for instance oxygen (O) relaxation; CO+2, CO+, and O+ ionization and recombination; and charge exchange [6].
2.2. Dielectric Barrier Discharges (DBDs)
The DBD was first developed in 1857 by Ernst Werner Von Siemens for use in ozone production and was originally called the “silent discharge” [17]. The DBD is a high pressure, non-LTE (non-local thermodynamic equilibrium), transient, low temperature plasma discharge. Given their operating temperatures, high plasma densities, and high electron excitation efficiencies, DBDs are an attractive candidate for CO2 dissociation (see Table 1). The design of a DBD is similar to an arc plasma (two electrodes and an air gap). However the DBD has a high breakdown voltage dielectric placed between the electrodes to impede arcing. The DBD discharge is a short lived (1–100 nanosecond scale) electron cascade brought on by the large electric fields created within the air gap [18–23]. The cascade is self-terminating and only repeats when the applied voltage changes sign, because the electron cascade charges the dielectric surface and shields the electric field from the air gap. Therefore, typically a DBD consists of one grounded electrode and the other is attached to a high frequency (60 Hz–500 kHz), high voltage (0–500 kV) power source.
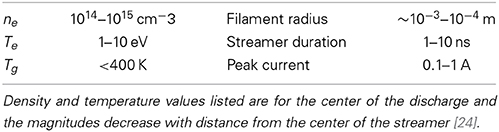
Table 1. General characteristics of an atmospheric pressure streamer.
Each DBD cascade leaves a population of high energy particles in its wake. If the driving frequency is sufficiently high (>1 kHz), the remaining energized particles fuel the next cascade. The repeated reignition of the plasma in the same location creates a streamer plasma, the most common discharge in a DBD (others include the atmospheric pressure glow discharge). A streamer is an oscillating, non-LTE, filament-like plasma created by a large electric field and consists of three regions: two surface discharge regions and a micro-discharge channel (see Figure 1). The surface discharge regions are where the plasma is in contact with either a dielectric or electrode surface and generally has a diameter between 1 cm and 1 mm. The surface discharge is due to the opposing electric field of the charges on the dielectric surface which deflect impinging particles. The surface discharge diameter is reduced on electrode surfaces due to electrons being conducted out of the system. The micro-discharge channel is a thin channel of plasma outside of the surface discharge regions and is similar to the initial cascade of an arc plasma, consisting of a very thin dense column of plasma connecting the two surface discharges. The typical plasma characteristics of the streamer are listed in Table 1 [24]. Due to the localized nature of streamers, it is common for multiple streamers to form across the electrode surfaces. The number of streamers that form, and in turn the plasma volume, is dependent on many variables including the applied voltage, driving frequency, gas pressure, gas composition, system geometry, electrode and dielectric materials. In general, higher potentials across the air gap and low ionization energy gases lead to higher streamer densities. A detailed description of streamer dynamics is given in Lindon [6].
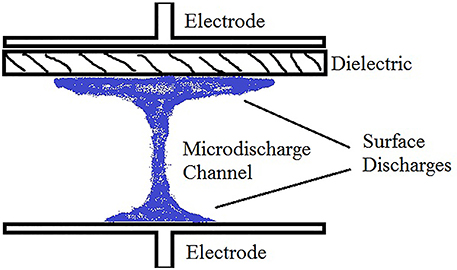
Figure 1. The anatomy of a single DBD streamer with dielectric covering one electrode.
2.3. DBD Plasma Chemical Model
To understand the chemistry of CO2 dissociation within a DBD, a simple, 0-D DBD plasma chemical model based on streamer dynamics within a micro-discharge channel was developed. The model calculates the electron, ion and chemical reaction rates based on the three overlapping stages of a streamer: the cascade phase, the afterglow phase and the ground state phase [18, 25]. The parameters of the model were based on VADER parameters with a flow rate of 200 standard cubic centimeters per minute (SCCM) passing through a 0.3175 cm2 inlet cross-section and a driving frequency of 30 kHz. The model was compared to one of VADER's best experimental results in which 5% of CO2 was dissociated using the above parameters (a gas composition of 92.5% CO2, 5% CO and 2.5% O2); which corresponds to an ~4×10⁻⁶ mol/s conversion rate and a volumetric reaction rate, r, of ~1.25×10⁻⁶ mol/cm3 s. Therefore, reaction rates significantly below these rates are ignorable. This same analysis and reaction rate metric was applied to a plasma with a gas composition of 56.5% CO2, 40% Ar, 3% CO, 1.5% O2 to compare to experimental results with 40% argon.
2.3.1. The cascade phase
The cascade phase encompasses streamer formation (the cascade) and shielding of the external electric field. Within the first nanoseconds of the cascade, the electron and ion densities reach a maximum of anywhere from 1012–1015 cm−3 with average electron temperatures between 1 and 10 eV. Once the cascade reaches the electrode/dielectric, it dissipates due to shielding. During these several nanoseconds (10 ns in the model) of high energy and high density electrons, electron impact reactions dominate and endothermic reactions are possible.
The reaction rates during the cascade phase were calculated using
where r is the reaction rate, ve is the electron velocity, f(ve) is the Druyvestyn electron velocity distribution function , as suggested in Carman and Mildren [26]), σ(ve) is the relevant electron-CO2 cross-section, [A] is the target ion or neutral density, and L is the time the plasma is within the cascade phase over the time in the afterglow and neutral phase. The relevant electron-CO2 collision reactions and their corresponding cross-sections are tabulated in Lindon [6]. The cross-sections were obtained from Itikawa [12], Anzai et al. [27], Seiersen et al. [28], McConkey et al. [15], Itikawa [29], Peverall et al. [30], Sheehan and St Maurice [31], Rosén et al. [32], Rapp and Briglia [33], Schulz [34], Zecca et al. [35], Rejoub et al. [36], Derai et al. [37], Flesch and Ng [38], and Flesch et al. [39]. A minimum electron density of ne = 1012 cm−3 was assumed to provide a lower limit on the important reaction rates occurring within the streamer. All reaction rates scale linearly with electron density, except for reactions involving charged particles which scale with n2e.
2.3.2. The afterglow phase and neutral phase
Once the electric field is shielded during the cascade phase, the streamer enters the afterglow phase. The afterglow phase is dominated by free radical chemistry. Free radicals are created following the recombination of electrons with ions and the high energy reactions within the cascade phase [18, 25]. During this phase, the electron temperature and density quickly drop as electrons collide with particles and recombine at a high rate. Approximately 1 ms after the initial discharge, the population of free radicals becomes small enough that ground state chemistry dominates. Due to the small neutral temperatures found in a DBD, CO2 neutral chemistry is slow and the chemistry favors reverse reactions. Therefore, DBDs for CO2 dissociation and other endothermic reactions are often pulsed at frequencies such that time in the ground state phase is minimized (>500 Hz).
The free radical, recombination and neutral reaction rates for gas temperatures (Tg) between 300 and 3000 K were calculated using the rate equation
where k is the rate coefficient and [R1], [R2], and [R3] are the molar densities of reactants 1, 2, and 3 ([R3] = 1 for second order reactions). A list of the relevant reactions and corresponding rate coefficients are in Lindon [6]; the rate coefficients were tabulated from Derai et al. [37], Seiersen et al. [28], Rosén et al. [32], Seiersen et al. [40], Sheehan and St Maurice [31], Peverall et al. [30], Tsang and Hampson [41], Hippler et al. [42], Heimerl and Coffee [43], Shaw [44], Atkinson et al. [45], Pshezhetskii et al. [46], Harteck and Dondes [47], Toby et al. [48], Arin and Warneck [49], and Mick et al. [50]. CO2, CO, O2 and Ar densities were scaled to atmospheric pressure densities (n = 2.454 × 1019 cm−3) based on their individual partial pressures. A density of ne = 1012 cm−3 was assumed to determine the minimum electron reaction rates. CO+2, CO+, and O+2 densities were scaled to the electron density based on their partial pressures. The O density was assumed to be 3.43 × 1014 cm−3, as this is the minimum O density needed for ~5% dissociation in VADER at 200 SCCM and 30 kHz (4×10⁻⁶ mol/s). Therefore, the calculated reaction rates including O are minimum reaction rates. Ozone was not detected in any of the VADER experiments. However, ozone quickly breaks down even at low temperatures and ozone was found to be a favorable reaction even with minimal amounts of atomic oxygen. Therefore, the ozone density was scaled to the ozone production rate (O2 + O + M → O3 + M) and the driving frequency, yielding an ozone density of ~1013 cm−3.
2.4. Chemical Model Results
The results of the DBD chemical model for the cascade phase are shown in Figure 2. Figure 2C shows the ionization rate is ~10−6 mol/cm3s at Te ~8 eV, which is consistent with densities and temperatures found within DBDs. Using this temperature as a baseline for the cascade phase, Figure 2B shows that the largest reaction rate is e-CO2 vibrational excitation. While these large vibrational excitation rates suggest that a DBD highly excites the vibrational states which lead to a significant portion of CO2 dissociation in a DBD, it was calculated that vibrational to translational (V-T) relaxation is also relatively high at atmospheric pressures (2.6 × 10⁻⁴ mol/cm3s versus a vibrational excitation rate of 3 × 10⁻⁴ mol/cm3s). These high V-T relaxation rates suggest that vibrational excitation may only play a limited role in CO2 dissociation at atmospheric pressures [8, 51–53]. A similar modeling result was obtained by Aerts et al. [54] and Kozak and Bogaerts [55]. Therefore, it is important to consider the other dissociative reaction rates in Figure 2A. The highest dissociative reaction rates at 8 eV are CO dissociative attachment followed by e-CO2 impact dissociation. The large CO dissociative attachment rate suggests that CO molecules within the plasma absorb a considerable amount of energy. CO reactions are unfavorable in VADER as they reduce the amount of electron energy that goes toward CO2 dissociation. However, for the purposes of forming value-added chemicals, the carbon atoms created during CO dissociative attachment could be used to form longer carbon chains. Additionally, CO and O2 vibrational excitation similarly take energy away from CO2 dissociation and have similar reaction rates to CO attachment, thereby creating an additional energy loss mechanism in VADER.
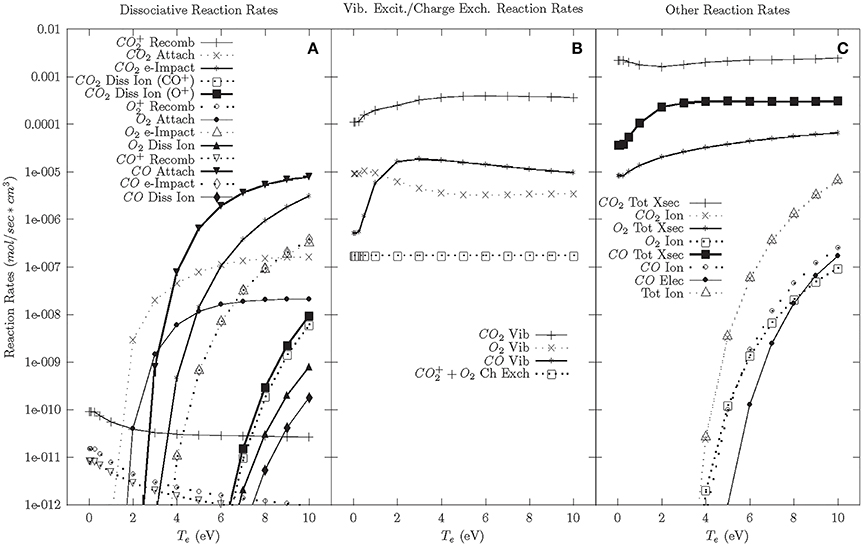
Figure 2. Cascade phase reaction rates—92.5% CO2, 5% CO, 2.5% O2. (A) Dissociative reaction rates. (B) Vibrational excitation and charge exchange reaction rates. (C) Other reaction rates.
In the wake of the cascade, plasma temperatures decrease and lower electron temperature chemistry becomes important. Figure 2A shows that at lower electron temperatures (<4 eV), the dissociation reaction rate drops significantly and CO2 attachment dominates. Below 2 eV, dissociative reaction rates are negligible. There is also considerable vibrational excitation, but at lower electron temperatures it is presumed that far fewer of those reactions will initiate dissociation.
Once the electron cooling has finished, the plasma enters the afterglow phase; which is initially dominated by the relaxation of charged particles (see Figure 3A). The model shows that this relaxation is dominated by CO+2 charge exchange with O2 (CO+2 + O2 → CO2 + O+2). This charge exchange process reduces the CO+2 population, which reduces CO+2 recombination (e + CO+2 → CO + O) and encourages O+2 recombination (e + O+2 → O + O); a reverse reaction.
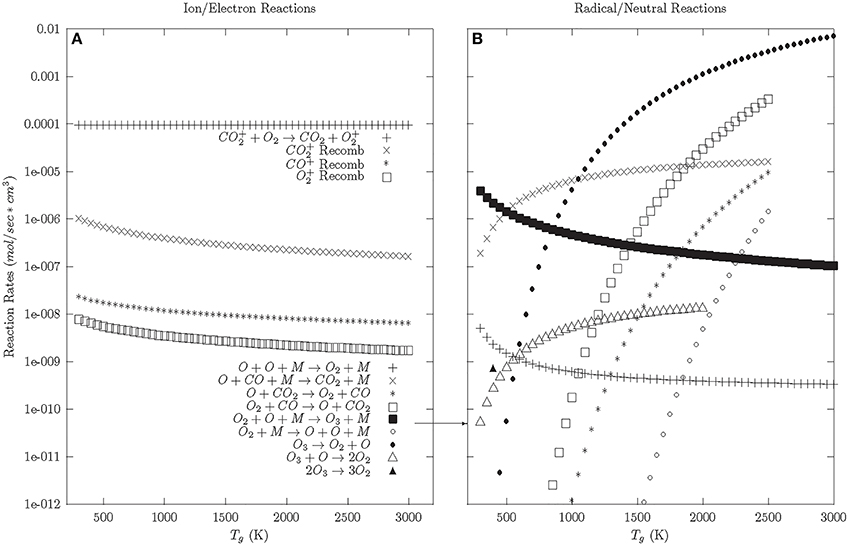
Figure 3. Afterglow and Neutral phase reaction rates—92.5% CO2, 5% CO, 2.5% O2. (A) Ion and electron reactions. (B) Radical and neutral reactions.
Once the charged particles are neutralized, the neutral and radical reactions dominate (Figure 3B). At a Tg > 500 K, the reverse reactions are preferred. O and O2 preferentially react with CO to reform CO2, given a small population of CO and O2 background gas. At Tg < 500 K, the preferred reaction is the formation of ozone. Looking at the reaction rates for ozone, ozone preferentially decays into O2 at lower temperatures (<500 K). This suggests that the preferred relaxation pathway for CO2 dissociation in DBDs involves the formation and decay of ozone, similar to what is seen in ozonizers [56].
The cascade phase reaction rates with argon are shown in Figure 4. Modeling with argon doping was performed because of the significant gain in CO2 dissociation efficiency with the addition of argon observed in the experiments. The model shows that the dissociative reaction rates and ionization rates are minimally affected by the addition of argon. The one significant change due to the addition of argon is the Ar+-CO2 charge exchange rate, which is more than 100 times larger than other charge exchange rates. While not quantitative, this suggests that Ar+-CO2 charge exchange could be responsible for increased CO+2 populations, which results in dissociation following electron-CO+2 recombination. Due to the large binding energies of argon, argon has a minimal effect on the afterglow/neutral phases beyond affecting the charge exchange reactions and reducing the overall reaction rates.
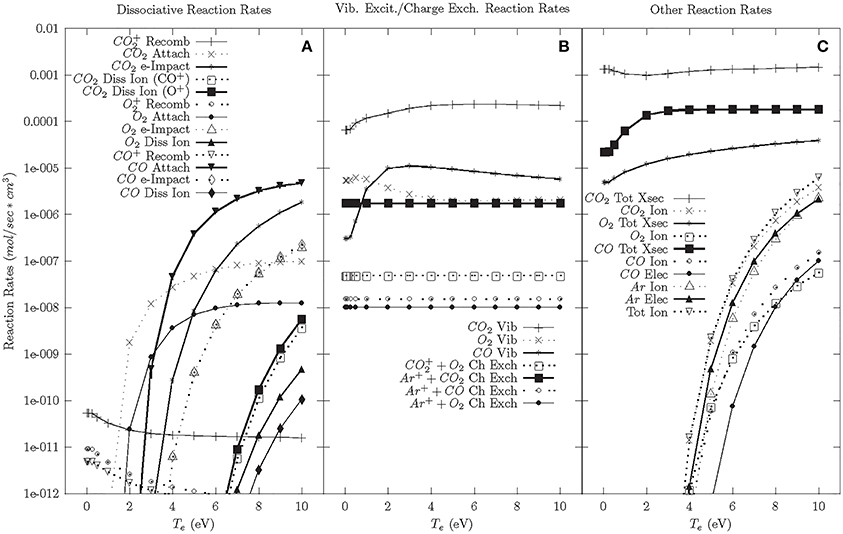
Figure 4. Cascade phase reaction rates—56.5% CO2, 40% Ar, 3% CO, 1.5% O2. (A) Dissociative reaction rates. (B) Vibrational excitation and charge exchange reaction rates. (C) Other reaction rates.
3. VADER Design
The Versatile Atmospheric Dielectric barrier discharge ExpeRiment (VADER) was designed to examine the variables that affect CO2 dissociation within a DBD. The detailed design is described within Lindon [6]. VADER is a planar DBD at the center of a 20.32 cm Lesker 6 way CF cross. A diagram of the system is shown in Figure 5.
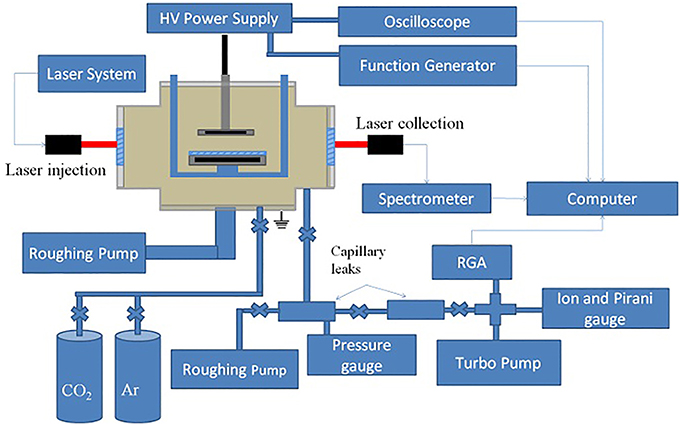
Figure 5. A schematic of the VADER system.
To control the gas flow within the reaction volume, the VADER DBD was created by sandwiching a custom built reaction box between a stainless steel (SS) high voltage electrode and a SS ground electrode. The DBD, in layered order, consisted of a 5 cm diameter HV electrode, a 0.3175 cm thick quartz dielectric, a 0.3175 cm air gap and a 5.7 cm diameter ground electrode giving a total reaction volume of ~3.2 cm3. The ground electrode was slightly larger than the HV electrode to increase uniformity. For experiments using a catalyst, the quartz disk was replaced by a quartz disk with a thin film, <0.025 cm thick, of P25 TiO2 applied to a ~5 cm diameter patch at the center of the disk.
Gas flow through the reaction volume was regulated using a set of MKS 500 and 100 SCCM mass flow controllers supplying CO2 and Ar, respectively. The pressure within the reaction box was monitored with an Ashcroft compound vacuum pressure gauge and regulated using a throttling valve (needle valve) attached to a Pfeiffer Xtra dry vacuum pump. To measure the output gas properties, a two stage capillary leak system connected to a residual gas analyzer (RGA) was teed off the exhaust line ahead of the throttling valve. The capillary leak was designed by Vacuum Technology Incorporated (VTI) and was connected to a Stanford Research Systems (SRS) RGA100. The first stage pressure was regulated using a Pfeiffer Xtra dry vacuum pump (760 Torr to 10−2 Torr) and the second stage was regulated using a Pfeiffer TSH-521 turbo pump (10−2 Torr to 10−8 Torr). The pressures in the second stage were measured with an SRS ion pressure gauge and ConvectronTM gauge. The RGA was calibrated by flowing Ar, CO and air into the system at varying pressures and recording the RGA's response. Before and after each experimental run the entire gas system was flushed with new gas.
Two HV power supplies were used to power VADER's HV electrode: a TREK 10/10B HV power amplifier with signal input from a HP 33120A 15 MHz Waveform Generator and a DIDRIV10 power supply from amazing1.com. The TREK power amplifier outputted ±10 kV over the frequency range 0–2.5 kHz with a current limit of 10 mA and a max output power of 50 W. At higher driving frequencies, the voltage dropped linearly with frequency such that at 7 kHz the output voltage was ±5 kV. Due to these voltage limitations, all experimental runs using the TREK power supply were performed at the maximum voltage available. Output power from the TREK power supply was measured using its built-in current and voltage monitors. The DIDRIV10 power supply outputted a maximum voltage of 1.9 kV and 513 mA at 28.4 kHz and ±1.7 kV and 455 mA at 30 kHz, these were the only two frequencies that consistently formed a plasma. Due to the variation in maximum voltages with frequency, the voltage readings for the DIDRIV10 power supply are reported as either 100% (the maximum voltage setting) and 90% (90% of the maximum voltage). Output power from the DIDRIV10 power supply was measured using a Rogowski coil and a voltage divider.
4. Results and Discussion
4.1. Experimental Setup
The VADER experiments focused on the effects of multiple variables on the dissociation rate and efficiency within a DBD. The tested parameters are listed in Table 2. The dissociation rate (dN/dt) was calculated using the change in partial pressures of CO and O2 (Δp) measured by the RGA and the ideal gas law (PV = NRT),
where C is a chemical constant (1 for CO and 2 O2, because CO2 → CO + 1/2O2), u is the volumetric flow rate through the reaction volume (dV/dt), R is the ideal gas constant and T is the system temperature (~298 K for all runs). The CO2 dissociation efficiency (η) was calculated from
where P is the forward power of the power supply. The major sources for error in the results come from the RGA readings, which give an error of ~14% and ~10% for O2 and CO measurements, respectively.
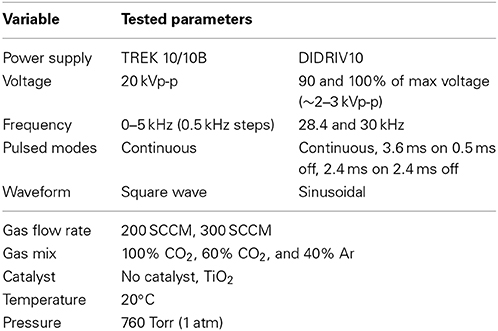
Table 2. The VADER source parameters.
Different experimental setups were compared using the percent difference in dissociation rate and efficiency due to a single variable. For instance, the percent difference in energy efficiency due to the addition of a catalyst was calculated using
where ηCatalyst is the average energy efficiency for one experimental setup using a catalyst and ηNo Catalyst is the average energy efficiency of the same experimental setup without a catalyst. By applying this calculation to every combination of variables and using a bin size of 2.5%, a statistical distribution of the effects of the catalyst is created. The same analysis is applied to each set of system variables for both energy efficiency and dissociation rate. Since different experimental setups are being compared, the appropriate analysis metrics are the mean, standard deviation (SD) and G1 sample skewness for each distribution; the results of which are tabulated in Table 3. Figure 6 is an example of a percent difference distribution comparing forward power between different gas mixtures (see [6] for graphical representations of all of the data) [57, 58].
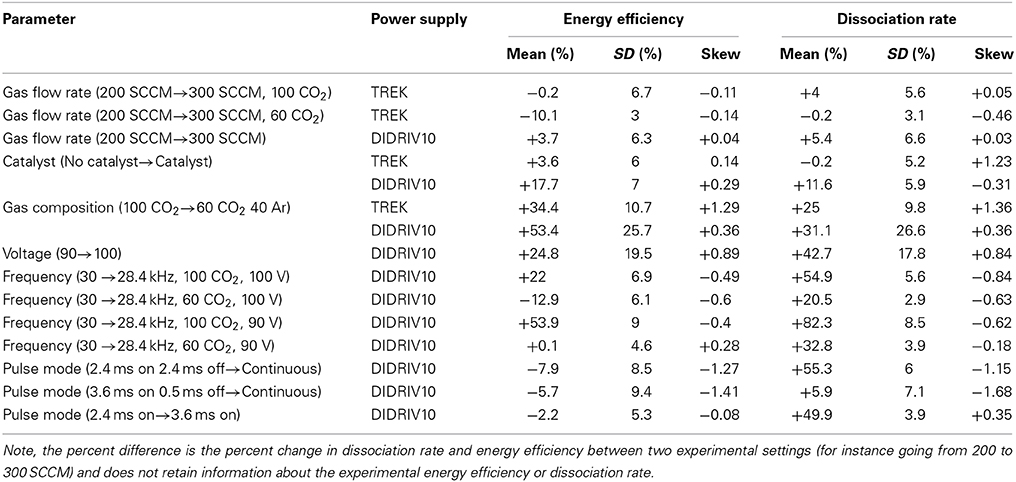
Table 3. Mean, standard deviation and skew for the percent difference distributions.
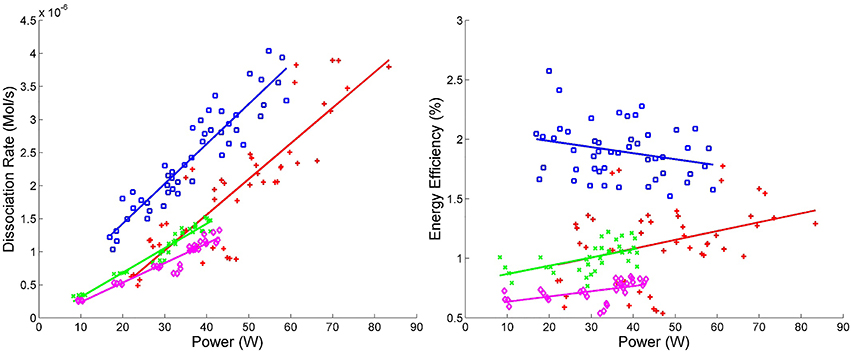
Figure 6. Energy efficiency vs. power and dissociation rate vs. power. Blue squares ( ) correspond to experimental runs with 60% CO2 and 40% Ar using the DIDRIV10 power supply, red plus signs (
 ) correspond to 100% CO2 DIDRIV10 data, green x's (
 ) correspond to 60% CO2 TREK data and purple diamonds (
 ) correspond to 100% CO2 TREK data.
4.2. Experimental Results
4.2.1. Energy efficiency and dissociation rate
The highest energy efficiency achieved in VADER was 2.5 ± 0.5% (10−4 mol CO2/kJ, see Figure 6). These efficiencies are comparable to the highest efficiencies other groups have achieved (3–10%), but are much lower than what is needed for a commercial system [55, 59–61].
Energy efficiency was highly dependent on the power supply and gas mixture, see Figure 6. The DIDRIV10 power supply was considerably more efficient at CO2 dissociation than the TREK power supply. The primary difference between these power supplies is their driving frequency. The DIDRIV10 operates at higher frequencies than the TREK power supply (28.4–30 kHz versus 0–7 kHz, respectively), which suggests that higher driving frequencies (in the range of 30 kHz) are significantly more efficient than lower frequencies (0–7 kHz). A similar effect was reported by Paulussen et al. [59]. This frequency dependence is attributed to the amount of time the plasma spends in the afterglow neutral phase going through reverse reactions. At lower driving frequencies, the discharge spends considerably more time within the afterglow neutral phase. The effect of replacing 40% of the CO2 with argon also greatly improved dissociation efficiencies (by >50%) and is further discussed in Section 4.2.4.
The largest dissociation rate achieved in VADER was 4 ± 0.4 ×10⁻⁶ mol/s (5 ± 0.5% of the input CO2), see Figure 6. The dissociation rate correlates directly with forward power, which is again consistent with the results of Paulussen et al. [59]. The reason for the correlation with power is that forward power increases with increasing applied voltage, which controls the streamer density and reaction volume. An increase in the reaction volume means more gas is being processed and reduces the time during which the gas cools between streamers. While not seen in these results, Wang et al. [60] showed that there is a point of saturation above which increasing the voltage no longer increases the dissociation rate; presumably due to a saturation of streamer density. Figure 6 also indicates that argon and higher frequencies significantly improve dissociation rates (see Sections 4.2.4 and 4.2.5 for more details).
4.2.2. Gas flow rate
The gas flow rate is inversely proportional to the residence time of the gas within the reaction volume. Wang et al. [60] has shown that DBD efficiencies decrease with higher percentages of CO2 dissociated. Therefore, it was expected that a decrease in residence time would increase dissociation efficiencies. However, the percent difference results for changing the flow rate from 200 to 300 SCCM (residence time of 0.97–0.64 s) in VADER showed a minimal effect on the dissociation efficiency and rate (see Table 3). For the DIDRIV10 power supply, higher flow rates yielded a 4% with a standard deviation of 6% (i.e., 4% SD 6%) shift toward higher energy efficiencies. For the TREK power supply there was a 10% SD 3% decrease in energy efficiency in cases with argon and no change with pure CO2. We believe these results are caused by a buildup of energy in the molecular energy states and product gas densities within the plasma, which encourage the dissociation of the product gases. For lower frequency power supplies, product densities within a streamer stay small and there is limited energy accumulation. Therefore, cold plasmas with small product densities stay in a regime where the re-use of excited species in the discharge is more beneficial to CO2 dissociation than the effects of product buildup and heating. The effects of energy accumulation in the plasma are enhanced with argon due to the slow recombination rates of argon and the longer mean free path of excited particles.
4.2.3. Voltage
The characteristics of a streamer are invariant to driving voltage (to an extent). Therefore, the voltage determines the number and density of streamers in a DBD [62, 63]. The invariance is due to the short lifetime of a streamer (10 s of nanoseconds) in comparison to the relatively slow changes in voltage even at the higher frequencies used in VADER (~33 μs for one cycle at 30 kHz) [64]. The density of streamers affects the amount of time a volume of gas is processed within streamers (as opposed to between streamers), which changes the length of time a gas is highly excited and experiences the neutral phase and its concomitant reverse reactions. This reduction in reverse reactions explains the large increases in energy efficiency (+25% SD 19.5%) and dissociation rate (+43% SD 18%) as voltage was increased in the DIDRIV10 experiments (see Table 3). These results run counter to those reported by Paulussen et al. [59], Wang et al. [60], and Zheng et al. [61]. However, the frequency and voltages used in VADER were much different than those groups' DBD parameters. Note, the large variance in the percent difference values for the voltage's effect is because voltage, gas composition and frequency are interrelated; which is further discussed in Section 4.2.5.
4.2.4. Gas composition
The addition of argon into the feed gas had the single greatest effect on dissociation efficiencies and rates (see Table 3). For the TREK power supply, energy efficiency increased by 34% SD 11% and the dissociation rate by 25% SD 10%. For the DIDRIV10 power supply, energy efficiency increased by 53% SD 26% and dissociation rate by 31% SD 27%. These increases in efficiency and dissociation rate with the addition of argon occurred despite a 24% decrease in forward power for the DIDRIV10 power supply cases (see Figure 7). Note, the large variance in energy efficiency for the DIDRIV10 case is due to the relationship between voltage, gas composition and frequency discussed in Section 4.2.5.
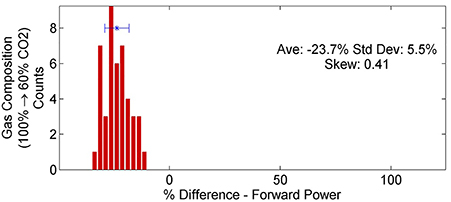
Figure 7. Percent difference in forward power between different gas compositions for the DIDRIV10 power supply. The distribution shows that adding argon (100–60% CO2) decreases the forward power.
We propose that the increases in dissociation efficiency and rate are due to a combination of charge exchange between Ar+ and CO2 (Ar+ + CO2 → Ar + CO+2) and a reduction in the gas breakdown voltage. Ar+/CO2 charge exchange increases the CO+2 populations, which increases CO2 dissociation rates following CO+2 recombination (CO+2 + e → CO + O); as suggested by the 0-D model. The reduction in breakdown voltages is due to the limited number of argon electronic states, which limit inelastic collisions and recombination rates with argon. The combination of reduced inelastic collision rates with the low recombination rate of argon increases the mean free path of electrons in the plasma, which gives electrons a longer time to accelerate within the external electric fields. This increase in mean free path is balanced with the lower voltages needed for breakdown. Thus, the electron temperatures and densities are invariant to the change in breakdown voltage, as seen by Zhang et al. [65], and the net effect is similar to increasing the applied voltage (see Section 4.2.3).
4.2.5. Driving frequency
The driving frequency determines the time the plasma is within each of the three discharge phases, which affects the reaction kinetics of the plasma. Figure 8 shows that frequencies near 30 kHz have almost double the efficiency of those between 1 and 5 kHz in VADER.
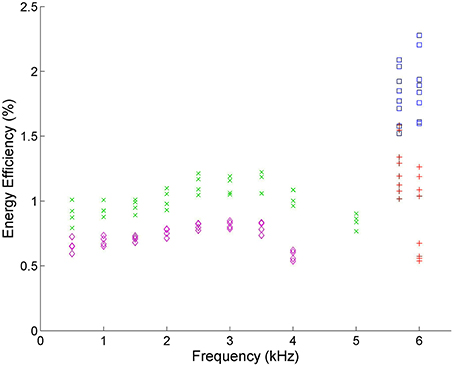
Figure 8. Energy efficiency vs. frequency. Blue squares () correspond to experimental runs with 60% CO2 and 40% Ar using the DIDRIV10 power supply, red plus signs () correspond to 100% CO2 DIDRIV10 data, green x's () correspond to 60% CO2 TREK data and purple diamonds () correspond to 100% CO2 TREK data. The drop in energy efficiencies between 3–5 kHz, are due to the voltage limits of the TREK power supply.
The DIDRIV10 power supply percent difference results show that the frequency dependence of dissociation is highly dependent on the applied voltage and gas composition (see Table 3). For example, looking at the percent difference in energy efficiency for the 100% CO2, 100% voltage case (22% SD 7%) there is an increase in efficiency when going to lower frequencies. This efficiency result implies that when the gas is 100% CO2 and the power supply is at max voltage, dissociation is more efficient at lower frequencies (28.4 kHz as opposed to 30 kHz). However, when the gas is 60% CO2 and 40% argon, the percent difference is negative (−13% SD 6%) meaning higher frequencies are more efficient. This change in energy efficiency with gas composition is similarly seen when comparing the two 90% voltage cases (54% SD 9% with 100% CO2 and 0% SD 5% with 60% CO2). A similar trend is found when the gas compositions are kept constant and the voltages are increased. These results imply that dissociation is more efficient at higher frequencies when the applied voltage is high and the breakdown voltage is low and vice versa for lower frequencies. A similar effect was reported by Paulussen et al. [59] and Li et al. [66].
The changes in CO2 dissociation energy efficiency with frequency suggest that there is a resonance between the driving frequency and the plasma chemistry within a DBD. It is hypothesized that this occurs due to a predator-prey relationship between the different plasma reactions. Comparing these results to the model, if the frequency is too low, the gas spends additional time within the neutral phase going through reverse reactions. If the frequency is too high, the gas doesn't have time to relax and form the final products. A short relaxation time also leads to an increase in the vibrational energy of molecules (which explains why DBD excimer lamps work best at higher frequencies, 10–100 s of kHz) [63, 67]. This energy build up causes more CO2 breakdown, but also encourages the breakdown of the final products and produces long lived free radical populations which increase afterglow reaction rates, like O + CO → CO2. These results imply that efficient dissociation requires a balance between relaxation times (time for final products to form) and the discharge times (time for CO2 to be dissociated).
4.2.6. Catalyst
To address some of the issues of energy recuperation in VADER, a catalyst was applied to VADER's dielectric surface. A traditional catalyst is ineffective, due to the small differences in activation energy of CO2 dissociation (~5.5 eV) and the energy of formation of CO2 from CO and O (~5.5 eV). Therefore, the photocatalyst P25 TiO2 was used. A photocatalyst is a material that acts like a catalyst only when it absorbs enough energy to bridge the materials electron band gap, that energy is then applied to the reaction. In VADER, the energy of the cascading electrons and ions, which would normally be lost to heating the electrode and dielectric surfaces, was used to activate the catalysts and cause further dissociation.
The effect of the photocatalyst during the TREK power supply experiments (lower driving frequency) showed a very small increase in the energy efficiency (4% SD 6%) and no change in the dissociation rate (0% SD 3%) with the addition of TiO2 to the reaction volume (see Table 3). The slight increase in efficiency is explainable by the small shift in the measured forward power of the plasma with the addition of the catalyst (−4% SD 6%). Therefore, at driving frequencies between 0–5 kHz the catalyst had no effect on dissociation.
When using the higher frequency DIDRIV10 power supply, there was a consistent increase in energy efficiency (18% SD 7%) and dissociation rate (12% SD 6%) with the addition of TiO2 to the reaction volume. This increase in dissociation was accompanied by a small decrease in forward power (−6% SD 5.5%). However, the change in power is not enough to explain the increase in dissociation rate. Therefore, the TiO2 must be responsible for the increased dissociation efficiency and rate at these higher frequencies (~30 kHz).
We propose that the catalyst results are due to the relaxation time of the catalyst and the differences in particle flux. For a photocatalyst to work, it needs to be energized. If the time between cascades is long, the energy deposited into the catalyst by the electron cascade has time to diffuse out of the system (i.e., relax), for instance through conduction or emission. By using a higher driving frequency, the time for relaxation is reduced and the number of cascades increase within the same time period, i.e., particle flux increases. The increased flux and reduced relaxation time allow more particles to interact with the energized photocatalyst surface.
4.2.7. Pulse mode
The adjustable pulse mode settings of the DIDRIV10 power supply were used to look at the effects of plasma startup on the energy efficiency and conversion rates in VADER. The three pulse modes tested were 2.4 ms on 2.4 ms off, 3.6 ms on 0.5 ms off and continuous. At atmospheric pressures, it takes several milliseconds for ionized particles to recombine after the power supply is turned off. Therefore, charged particles in the 2.4 ms on 2.4 ms off case had more than enough time to recombine [18].
The experiments showed a minor increase in energy efficiency and a large drop in dissociation rate when comparing the pulsed plasma to a continuous plasma (see Table 3). The dissociation rates are directly related to the duty cycle of the pulses (ton/(ton + toff) × 100). For example, the 2.4 ms on, 2.4 ms off (50% duty cycle) dissociates approximately half the CO2 of the continuous mode (see Figure 8). According to the models, a reduction in dissociation rate (therefore CO2 dissociation product densities) should increase the energy efficiency of the discharge, but it is unclear if the energy efficiency gains are due to pulsing or a reduction in product density. However, since the energy efficiency change by pulsing was expected to be relatively small and the change in energy efficiency was also small, the effects of CO2 products on dissociation in VADER must also be small.
5. Summary
Using models and experiments, the important chemistry and plasma dynamics of a DBD for CO2 dissociation was investigated. To better understand the dynamics of the plasma chemistry, a 0-D plasma chemical model was developed. The model included the important reaction rates during each phase of the discharge and how they relate to the CO2 dissociative process. Key predictions of the model are that:
1. CO2 dissociation is controlled by a combination of vibrational excitation, electron impact and recombination reactions. The rates of these reactions are highly dependent on electron temperature, with higher CO2 dissociation rates achievable at higher electron energies.
2. Once CO2 is dissociated into CO and O, the relaxation of O during the afterglow phase and neutral phase determine the final chemical state of the gas. Relaxation of O (in a CO2 plasma) usually ends in the formation of O2, ozone or CO2. When CO and O2 are present (> 0.001% of total gas) the model shows that O2 is preferentially formed through a reaction path following ozone formation and decay, which occurs efficiently at gas temperatures below 500 K.
3. As more CO2 is dissociated in a DBD, the CO and O2 densities influence the chemistry by absorbing large portions of electron energy that would otherwise go toward CO2 dissociation. This same effect has been reported by other groups [59–61].
Further improvements to the chemical model would entail incorporating the temporal evolution of the discharge, expansion from a 0-dimensional to a multi-dimensional model, and the inclusion of more chemical reactions and surface chemistry. The Plasmant Group in Germany is currently developing a more advanced 0-d chemical model that takes into account vibrational excitation and excimer formation in a CO2 DBD [54, 55].
The key experimental results were:
1. Energy efficiency of CO2 dissociation in VADER was low, never exceeding ~2.5 ± 0.5%.
2. The CO2 dissociation rates in VADER were modest, with a maximum dissociation rate of ~4 × 10⁻⁶ ± 0.5 × 10⁻⁶ mol/sec and a maximum CO2 percent conversion of ~5%.
3. When the gas breakdown voltage (gas composition) and driving frequency are held relatively constant, the dissociation rate in VADER was found to increase linearly with power. Wang et al. [60] has shown that at higher powers this linear trend plateaus, due to an increase in product densities.
Experiments in which the effects of variations in the gas flow rate, driving voltage, gas composition, frequency, photocatalyst, and pulse sequence demonstrated that:
1. The gas residence time (flow rate) and pulse mode were found to have a small effect on dissociation efficiencies and rates. We propose that the effects of gas residence time on dissociation are dependent on the plasma driving frequency and gas composition due to the buildup of dissociation products and energy in molecular states with longer residence times. Consistent with the gas residence time, the pulse mode results revealed that the amount of product gases created within VADER have a small effect on CO2 dissociation rates and efficiencies.
2. Increasing the driving voltage and adding argon to the feed gas significantly improved CO2 dissociation efficiencies and rates in VADER. We propose that these increases in efficiency and rate are due to an increase in streamer densities and in the case of argon, increased Ar-CO+2 charge exchange. We note that because other groups have shown that there is a limit in the number of streamers that can be formed within a volume, these gains in dissociation efficiency and rate are likely to be limited [60].
3. For each applied voltage and gas composition, there appears to be a resonant driving frequency that yields the best CO2 dissociation efficiencies and rates. We hypothesize that the resonant frequency is due to a predator-prey relationship between CO2 dissociation rates and product gas formation rates (CO and O2).
4. For the first time, a photocatalyst has been shown to improve CO2 dissociation within a DBD plasma. These improvements in dissociation efficiency and rate were found to only occur at driving frequencies above 5 kHz, which is likely due to the relaxation rate of the catalyst and the increased particle flux to the catalyst surface with higher frequencies.
Further research into CO2 dissociation using a DBD should expand on the results listed above. These experiments should be carried out with more commercially viable DBD designs; a DBD with a cylindrical geometry for instance. A larger range of flow rates should also be investigated to verify the effects of the gas residence time on dissociation. A power supply with a larger and more stable range of frequencies, voltages and power is needed to quantify the relationship between resonance frequencies, voltages and gas compositions. Since these experiments demonstrated that dissociation rates improve with a reduction in gas breakdown voltage, it would be prudent to look at the effects of adding different gases to a DBD; including further studies into converting CO2 into a value added chemical. Many groups have done tests using various structures, foams, etc. for incorporating different catalysts into their experiments [66, 68–71]. Similar experiments using TiO2 should also be attempted.
Funding
DOE contract - DE-AC26-04NT41817.
Conflict of Interest Statement
The authors declare that the research was conducted in the absence of any commercial or financial relationships that could be construed as a potential conflict of interest.
Acknowledgment
We would like to acknowledge the National Energy Technology Laboratory, specifically Dushyant Shekhawat, Michael Gallagher and Dave Berry, and the National Research Center for Coal and Energy for both funding and supporting this research.
References
1. IPCC. The fourth assessment report of the intergovernmental panel on climate change - climate change 2007. In: Parry ML, Canziani OF, Palutikof JP, van der Linden PJ, Hanson CE, editors. Impacts, Adaptation and Vulnerability. Cambridge University Press (2007). Available online at: http://www.ipcc.ch/publications_and_data/publications_ipcc_fourth_assessment_report_wg2_report_impacts_adaptation_and_vulnerability.htm
2. Raupach MR, Marland G, Ciais P, Le Quéré, C, Canadell, JG, Klepper G, et al. Global and regional drivers of accelerating CO2 emissions. Proc Natl Acad Sci USA (2007) 104:10288–93. doi: 10.1073/pnas.0700609104
Pubmed Abstract | Pubmed Full Text | CrossRef Full Text | Google Scholar
3. EPA. Carbon Dioxide Capture and Sequestration (2013). Available online at: http://www.epa.gov/climatechange/ccs/index.html
4. Styring P, Jansen D. Carbon Capture and Utilisation in the Green Economy. In: Using CO2 to Manufacture Fuel, Chemicals and Materials. Centre for Low Carbon Futures (2011). Available online at: http://www.lowcarbonfutures.org/reports/carbon-capture-and-utilisation-green-economy-1
5. Global CCS Institute. Accelerating the Uptake of CCS: Industrial use of Captured Carbon Dioxide. The Global CCS Institute, Parsons Brinckerhoff (2011). Available online at: http://www.globalccsinstitute.com/publications/accelerating-uptake-ccs-industrial-use-captured-carbon-dioxide
6. Lindon M. CO2 Dissociation using the Versatile Atmospheric Dielectric Barrier Discharge Experiment (VADER). Copyright ProQuest, UMI Dissertations Publishing (2014). Available online at: http://pqdtopen.proquest.com/pqdtopen/doc/1527497509.html?FMT=ABS
7. Darwent B. Bond Dissociation Energies in Simple Molecules. National Bureau of Standards (1970). Available online at: http://www.nist.gov/data/nsrds/NSRDS-NBS31.pdf
8. Fridman A. Plasma Chemistry. New York, NY: Cambridge University Press (2008). doi: 10.1017/CBO9780511546075
9. Rusanov VD, Fridman AA, Sholin GV. The Physice of a chemically active plasma with nonequilibrium vibrational excitation of molecules. Soviet Phys Uspekhi (1981) 24:447–74. doi: 10.1070/PU1981v024n06ABEH004884
10. Capezzuto P, Cramarossa F, D'Agostino R, Molinari E. Contribution of vibrational excitation to the rate of carbon dioxide dissociation in electrical discharges. J Phys Chem. (1976) 80:882–8. doi: 10.1021/j100549a024
11. Silva T, Britun N, Godfroid T, Snyders R. Optical characterization of a microwave pulsed discharge used for dissociation of CO2. Plasma Sources Sci Technol. (2014) 23:025009. doi: 10.1088/0963-0252/23/2/025009
12. Itikawa Y. Cross sections for electron collisions with carbon dioxide. J Phys Chem Refer Data (2002) 31:749–67. doi: 10.1063/1.1481879
13. Rond C, Bultel A, Boubert P, Cheron BG. Spectroscopic measurements of nonequilibrium CO2 plasma in RF torch. Chem Phys. (2008) 354:16–26. doi: 10.1016/j.chemphys.2008.09.006
14. Polak L. Elementary chemical processes and kinetics in a non-equilibrium and quasi-equilibrium plasma. Pure Appl Chem. (1974) 39:307–42. doi: 10.1351/pac197439030307
15. McConkey JW, Malone CP, Johnson PV, Winstead C, McKoy V, Kanik I. Electron impact dissociation of oxygen-containing molecules:A critical review. Phys Reports (2008) 466:1–103. doi: 10.1016/j.physrep.2008.05.001
16. Christophorou LG, Stockdale JAD. Dissociative electron attachment to molecules. J Chem Phys. (1968) 48:1956–60. doi: 10.1063/1.1668997
17. Kogelschatz U, Eliasson B, Egli W. From ozone generators to flat television screens: history and future potential of dielectric-barrier discharges. Pure Appl Chem. (1999) 71:1819–28. doi: 10.1351/pac199971101819
18. Eliasson B, Egli W, Kogelschatz U. Modelling of dielectric barrier discharge chemistry. Pure Appl Chem. (1994) 66:1275–86. doi: 10.1351/pac199466061275
19. Steinle G, Neundorf D, Hiller W, Pietralla M. Two-dimensional simulation of filaments in barrier discharges. J Phys D (1999) 32:1350. doi: 10.1088/0022-3727/32/12/311
20. Barni R, Esena P, Riccardi C. Chemical kinetics simulation for atmospheric pressure air plasmas in a streamer regime. J Appl Phys. (2005) 97:073301. doi: 10.1063/1.1879081
21. Li J, Dhali SK. Simulation of microdischarges in a dielectric-barrier discharge. J Appl Phys. (1997) 82:4205–10. doi: 10.1063/1.366223
22. Eliasson B, Hirth M, Kogelschatz U. Ozone synthesis from oxygen in dielectric barrier discharges. J Phys D (1987) 20:1421. doi: 10.1088/0022-3727/20/11/010
23. Kulikovsky AA. Positive streamer in a weak field in air: a moving avalanche-to-streamer transition. Phys Rev E (1998) 57:7066–74. doi: 10.1103/PhysRevE.57.7066
24. Kogelschatz U. Fundamentals and Applications of Dielectric-Barrier Discharges. ABB Corporate Research Ltd. (2000). Available online at: www.coronalab.net/wxzl/plasma-16.pdf
25. Kogelschatz U. Dielectric-barrier Discharges: their history, discharge physics, and industrial applications. Plasma Chem Plasma Proc. (2003) 23:1–46. doi: 10.1023/A:1022470901385
26. Carman R, Mildren R. Electron energy distribution functions for modelling the plasma kinetics in dielectric barrier discharges. J Phys D (2000) 33:L99–L103. doi: 10.1088/0022-3727/33/19/101
27. Anzai K, Kato H, Hoshino M, Tanaka H, Itikawa Y, Campbell L, et al. Cross section data sets for electron collisions with H2, O2, CO, CO2, N2O and H2O. Eur Phys J D (2012) 66:1–8. doi: 10.1140/epjd/e2011-20630-1
28. Seiersen K, Al-Khalili A, Heber O, Jensen MJ, Nielsen IB, Pedersen HB, et al. Dissociative recombination of the cation and dication of CO2. Phys Rev A (2003) 68:022708. doi: 10.1103/PhysRevA.68.022708
29. Itikawa Y. Cross sections for electron collisions with oxygen molecules. J Phys Chem Refer Data (2009) 38:1–20. doi: 10.1063/1.3025886
30. Peverall R, Rosén S, Peterson JR, Larsson M, Al-Khalili A, Vikor L, et al. Dissociative recombination and excitation of O+2: cross sections, product yields and implications for studies of ionospheric airglows. J Chem Phys. (2001) 114:6679–89. doi: 10.1063/1.1349079
31. Sheehan CH, St. Maurice JP. Dissociative recombination of N+2, O+2, and NO+: Rate coefficients for ground state and vibrationally excited ions. J Geophys Res Space Phys. (2004) 109:1884–2015. doi: 10.1029/2003JA010132
32. Rosénen S, Peverall R, Larsson M, Le Padellec A, Semaniak J, Larson A, et al. Absolute cross sections and final-state distributions for dissociative recombination and excitation of CO+(v = 0) using an ion storage ring. Phys Rev A (1998) 57:4462–71. doi: 10.1103/PhysRevA.57.4462
33. Rapp D, Briglia DD. Total cross sections for ionization and attachment in gases by electron impact. II. Negative-Ion formation. J Chem Phys. (1965) 43:1480–9. doi: 10.1063/1.1696958
34. Schulz GJ. Cross sections and electron affinity for O− Ions from O2, CO, and CO2 by electron impact. Phys Rev. (1962) 128:178–86. doi: 10.1103/PhysRev.128.178
35. Zecca A, Karwasz G, Brusa R. One century of experiments on electron-atom and molecule scattering: a critical review of integral cross-sections - Atoms and diatomic molecules. La Rivista del Nuovo Cimento (1996) 19:1–146. doi: 10.1007/BF02742990
36. Rejoub R, Lindsay BG, Stebbings RF. Determination of the absolute partial and total cross sections for electron-impact ionization of the rare gases. Phys Rev A (2002) 65:042713. doi: 10.1103/PhysRevA.65.042713
37. Derai R, Kemper PR, Bowers MT. Effect of reactant ion internal and translational energy on the rate constants of the charge exchange reactions: CO+2 + O2 → O+2 + CO2 and O+2 + O2 – > O2 + O+2. J Chem Phys. (1985) 82:4517–23. doi: 10.1063/1.448706
38. Flesch GD, Ng CY. Absolute state-selected and state-to-state total cross sections for the Ar+(2P3/2,1/2)+CO2 reactions. J Chem Phys. (1992) 97:162–72. doi: 10.1063/1.463616
39. Flesch GD, Nourbakhsh S, Ng CY. Absolute state-selected and state-to-state total cross sections for the Ar+(2P3/2,1/2)+CO reactions. J Chem Phys. (1991) 95:3381–6. doi: 10.1063/1.460843
40. Seiersen K, Heber O, Jensen MJ, Safvan CP, Andersen LH. Dissociative recombination of dications. J Chem Phys. (2003) 119:839–43. doi: 10.1063/1.1579470
41. Tsang W, Hampson RF. Chemical kinetic data base for combustion chemistry. Part I. Methane and related compounds. J Phys Chem Refer Data (1986) 15:1087–279. doi: 10.1063/1.555759
Pubmed Abstract | Pubmed Full Text | CrossRef Full Text | Google Scholar
42. Hippler H, Rahn R, Troe J. Temperature and pressure dependence of ozone formation rates in the range 1–1000 bar and 90–370 K. J Chem Phys (1990) 93:6560–9. doi: 10.1063/1.458972
43. Heimerl JM, Coffee TP. The unimolecular ozone decomposition reaction. Combustion Flame (1979) 35:117–23. doi: 10.1016/0010-2180(79)90015-4
44. Shaw R. Estimation of rate constants as a function of temperature for the reactions W + XYZ = WX + YZ, where W, X, Y, and Z are H or O atoms. Int J Chem Kinetics (1977) 9:929–41. doi: 10.1002/kin.550090608
45. Atkinson R, Baulch DL, Cox RA, Crowley JN, Hampson RF, Hynes RG, et al. Evaluated kinetic and photochemical data for atmospheric chemistry: volume I - gas phase reactions of Ox, HOx, NOx and SOx species. Atmospheric Chem Phys. (2004) 4:1461–1738. doi: 10.5194/acp-4-1461-2004
46. Pshezhetskii SY, Morozov NM, Kamenetskaya SA, Siryatskaya VN, Gribova EI. Kinetics of the thermal decomposition of ozone. Russ J Phys Chem. (1959) 33:328–30.
47. Harteck P, Dondes S. Reaction of carbon monoxide and ozone. J Chem Phys. (1957) 26:1734–7. doi: 10.1063/1.1743612
48. Toby S, Sheth S, Toby FS. Reaction of carbon monoxide with ozone and oxygen atoms. Int J Chem Kinetics (1984) 16:149–57. doi: 10.1002/kin.550160206
Pubmed Abstract | Pubmed Full Text | CrossRef Full Text | Google Scholar
49. Arin LM, Warneck P. Reaction of ozone with carbon monoxide. J Phys Chem. (1972) 76:1514–6. doi: 10.1021/j100655a002
Pubmed Abstract | Pubmed Full Text | CrossRef Full Text | Google Scholar
50. Mick HJ, Burmeister M, Roth P. Atomic resonance absorption spectroscopy measurements on high-temperature CO dissociation kinetics. AIAA J. (1993) 31:671–6. doi: 10.2514/3.11602
51. Blauer JA, Nickerson GR. A Survey of Vibrational Relaxation Rate Data for Processes Important to CO2-N2-H2O Infrared Plume Radiation. Ft. Belvoir, VA: Air Force Rocket Propulsion Laboratory (1973).
52. Gower MC, Carswell AI. Laser-induced plasma perturbation studies of energy transfer in CO[sub 2] glow-discharge lasers. J Appl Phys. (1974) 45:3922–9. doi: 10.1063/1.1663888
53. Huetz-Aubert M, Tripodi R. Rate equations for the vibrational relaxation of CO[sub 2][single bond]N[sub 2] or CO[sub 2]- noble gas mixtures— application to comparison of spectrophone data with results from other experimental techniques. J Chem Phys. (1971) 55:5724–34. doi: 10.1063/1.1675743
54. Aerts R, Martens T, Bogaerts A. Influence of Vibrational States on CO2 Splitting by Dielectric Barrier Discharges. J Phys Chem C (2012) 116:23257–73. doi: 10.1021/jp307525t
55. Kozak T, Bogaerts A. Splitting of CO 2 by vibrational excitation in non-equilibrium plasmas: a reaction kinetics model. Plasma Sources Sci Technol. (2014) 23:045004. doi: 10.1088/0963-0252/23/4/045004
56. Vezzu G, Lopez JL, Freilich A, Becker KH. Optimization of large-scale ozone generators. Plasma Sci IEEE Trans. (2009) 37:890–6. doi: 10.1109/TPS.2009.2015452
57. Joanes DN, Gill CA. Comparing measures of sample skewness and kurtosis. J R Stat Soc D (1998) 47:183–9. doi: 10.1111/1467-9884.00122
58. Bulmer G. Principles of Statistics, Dover Books on Mathematics Series. New York, NY: Dover Publications (1979).
59. Paulussen S, Verheyde B, Tu X, Bie CD, Martens T, Petrovic D, et al. Conversion of carbon dioxide to value-added chemicals in atmospheric pressure dielectric barrier discharges. Plasma Sources Sci Technol. (2010) 19:034015. doi: 10.1088/0963-0252/19/3/034015
60. Wang JY, Xia GG, Huang A, Suib SL, Hayashi Y, Matsumoto H. CO2 decomposition using glow discharge plasmas. J Catal. (1999) 185:152–9. doi: 10.1006/jcat.1999.2499
61. Zheng G, Jiang J, Wu Y, Zhang R, Hou H. The mutual conversion of CO2 and CO in dielectric barrier discharge (DBD). Plasma Chem Plasma Process. (2003) 23:59–68. doi: 10.1023/A:1022464702294
62. Kogelschatz U. Filamentary, patterned, and diffuse barrier discharges. IEEE Trans Plasma Sci. (2002) 30:1400–8. doi: 10.1109/TPS.2002.804201
63. Kogelschatz U. Excimer lamps: history, discharge physics, and industrial applications. Proc SPIE (2004) 5483:272–86. doi: 10.1117/12.563006
64. Guikema J, Miller N, Niehof J, Klein M, Walhout M. Spontaneous pattern formation in an effectively one-dimensional dielectric-barrier discharge system. Phys Rev Lett. (2000) 85:3817–20. doi: 10.1103/PhysRevLett.85.3817
Pubmed Abstract | Pubmed Full Text | CrossRef Full Text | Google Scholar
65. Zhang Y, Wen XH, Yang WH. Excitation temperatures of atmospheric argon in dielectric barrier discharges. Plasma Sources Sci Technol. (2007) 16:441. doi: 10.1088/0963-0252/16/3/003
Pubmed Abstract | Pubmed Full Text | CrossRef Full Text | Google Scholar
66. Li R, Yamaguchi Y, Yin S, Tang Q, Sato T. Influence of dielectric barrier materials to the behavior of dielectric barrier discharge plasma for CO2 decomposition. Solid State Ionics (2004) 172:235–8. doi: 10.1016/j.ssi.2004.02.036
67. Sosnin EA, Oppenlander T, Tarasenko VF. Applications of capacitive and barrier discharge excilamps in photoscience. J Photochem Photobiol C Photochem Rev. (2006) 7:145–63. doi: 10.1016/j.jphotochemrev.2006.12.002
68. Rico VJ, Hueso JL, Cotrino J, Gallardo V, Sarmiento B, Brey JJ, et al. Hybrid catalytic-DBD plasma reactor for the production of hydrogen and preferential CO oxidation (CO-PROX) at reduced temperatures. Chem Commun. (2009) 41:6192–4. doi: 10.1039/b909488a
Pubmed Abstract | Pubmed Full Text | CrossRef Full Text | Google Scholar
69. Kraus M, Eliasson B, Kogelschatz U, Wokaun A. CO2 reforming of methane by the combination of dielectric-barrier discharges and catalysis. Phys Chem Chem Phys. (2001) 3:294–300. doi: 10.1039/b007015g
70. Wen Y, Jiang X. Decomposition of CO2 using pulsed corona discharges combined with catalyst. Plasma Chem Plasma Process. (2001) 21:665–78. doi: 10.1023/A:1012011420757
Keywords: plasma chemistry, plasma chemical model, dielectric barrier discharge, atmospheric plasmas, CO2 dissociation, CO2 reduction, plasma physics
Citation: Lindon MA and Scime EE (2014) CO2 dissociation using the Versatile atmospheric dielectric barrier discharge experiment (VADER). Front. Phys. 2:55. doi: 10.3389/fphy.2014.00055
Received: 02 July 2014; Accepted: 27 August 2014;
Published online: 26 September 2014.
Edited by:
Antonio D'Angola, Università della Basilicata, ItalyReviewed by:
Michael Keidar, George Washington University, USAJ. P. Sheehan, University of Michigan, USA
Annarita Laricchiuta, Istituto di Metodologie Inorganiche et dei Plasmi, Italy
Copyright © 2014 Lindon and Scime. This is an open-access article distributed under the terms of the Creative Commons Attribution License (CC BY). The use, distribution or reproduction in other forums is permitted, provided the original author(s) or licensor are credited and that the original publication in this journal is cited, in accordance with accepted academic practice. No use, distribution or reproduction is permitted which does not comply with these terms.
*Correspondence: Earl E. Scime, Department of Physics and Astronomy, West Virginia University, Box 6315, 135 Willey St., Morgantown, WV 26506, USA e-mail: escime@wvu.edu