Electric-field induced microdynamics of charged rods
 Kyongok Kang
- Soft Condensed Matter, Institute of Complex Systems, Forschungszentrum Juelich, Juelich, Germany
Electric-field induced phase/state transitions are observed in AC electric fields with small amplitudes and low frequencies in suspensions of charged fibrous viruses (fd), which are model systems for highly charged rod-like colloids. Texture- and particle-dynamics in these field-induced states, and on crossing transition lines, are explored by image time-correlation and dynamic light scattering, respectively. At relatively low frequencies, starting from a system within the isotropic-nematic coexistence region, a transition from a nematic to a chiral nematic is observed, as well as a dynamical state where nematic domains melt and reform. These transitions are preliminary due to field-induced dissociation/association of condensed ions. At higher frequencies a uniform state is formed that is stabilized by hydrodynamic interactions through field-induced electro-osmotic flow where the rods align along the field direction. There is a point in the field-amplitude vs. frequency plane where various transition lines meet. This point can be identified as a “non-equilibrium critical point,” in the sense that a length scale and a time scale diverge on approach of that point. The microscopic dynamics exhibits discontinuities on crossing transition lines that were identified independently by means of image and signal correlation spectroscopy.
Introduction
Suspensions of highly charged fibrous viruses (fd) at low ionic strengths are used here as a model system to investigate the electric response of bulk suspensions of colloidal rods. The response of these suspensions can also be relevant for biological molecules and charge-regulated functional materials. So far there are only a few studies where the interactions between anisotropic colloids induced by low frequency external fields lead to the formation of new phases/states. Inter-colloidal interactions and single-particle field-induced transport depend on various parameters, such as the distribution of molecular weights, particle shapes, and stiffness [1]. In the case of dilute dispersions of DNA fragments, for example, the flexibility and length of the DNA fragments significantly affect their electrophoretic mobility [2], as well as the molecular twisting and bending [3]. When the inter-DNA interactions become important at higher concentrations, the apparent increase of the diameter due to electrostatic interactions becomes an additional parameter that determines the electrokinetic mobility. Charge-charge interactions determine to a large extent the phase behavior of suspensions of, for example, amyloid fibrils [4], biological food proteins [5], and synthetic charged colloidal rods (boehmite suspensions) [6, 7]. Such interactions also affect the dynamics of macromolecules. Theoretically, the rotational diffusion coefficient of single, non-interacting rod-like colloids is known be a logarithmically decreasing function with the aspect ratio (see Figure 3 in ref. [8]). For interacting rods, translational motion couples to rotational motion, so that the diffusive behavior is described by a tensorial quantity. The long-time self-translational diffusion of charged colloidal rods can be measured in the isotropic phase, where the decrease of the diffusion coefficient with increasing concentration can be described in terms of an effective diameter resulting from electrostatic interactions [9, 10]. Charge-charge interactions are non-trivial even for spherical colloids, where for example a gas-liquid phase and fluid-solid phase transitions are predicted, depending on the charge carried by the colloids [11]. For charged filamentous viruses, the charge-charge interactions strongly affect the location of the isotropic-nematic phase transition as well as the orientational order parameter [12]. For not too low ionic strengths, these effects can be explained in terms of an effective diameter that is larger than the bare diameter due to electrostatic interactions. Another interesting phenomenon due to charge-charge interactions is the ion-induced nucleation of charged rod, as predicted within a Ginzburg-Landau free energy [13, 14]. A subtle but important feature is that the solvation interaction energy can be strongly influenced by the degree of ionization of the chemical groups on the surface of the charged rods [15].
Electrostatic rod-rod interactions can be affected by a low-frequency external electric field through: (i) the polarization of the electric double layer, (ii) the polarization of the layer of condensed ions, which accumulate near to the core of the rod, (iii) the field-induced dissociation/association of condensed ions, and (iv) the electro-osmotic flow that is induced by the external field within the electric double layer and the layer of condensed ions. These mechanisms are depicted in Figure 1 in Kang [16]. In case of fd-virus particles, which carry a large amount of condensed ions, the dissociation/association of condensed ions plays an important role in explaining the phase/state behavior [17]. Due to the finite diffusivity of the ions, these field-induced interactions only occur at sufficiently low frequency (typically less than 1 kHz).
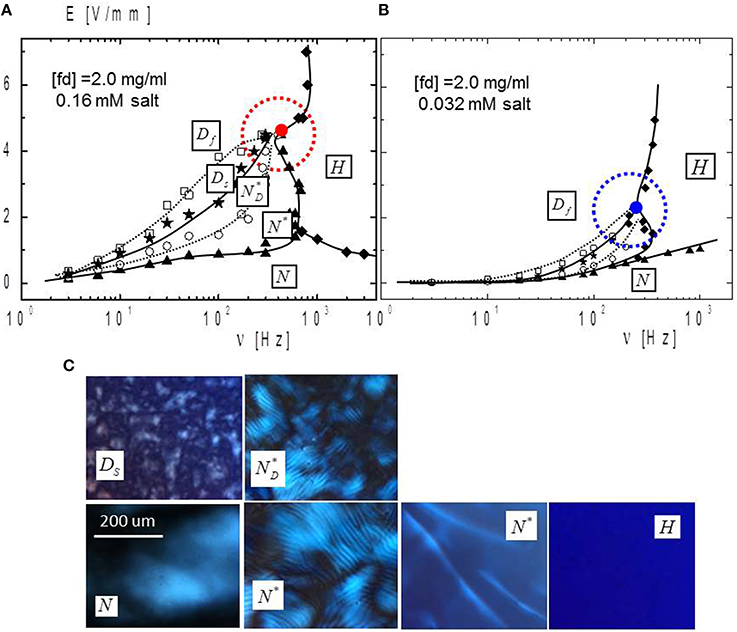
Figure 1. The electric phase/state diagram in the AC field amplitude vs. frequency plane for a fd-concentration of 2.0 mg/ml at (A) 0.16 mM and (B) 0.032 mM buffer concentration. (C) The corresponding depolarized images of the morphologies of field-induced phases/states that are indicated in the phase/state diagram. Phase transition lines are drawn to guide the eye. The encircled red point is the non-equilibrium critical point. The various phase/states are N, nematic; N*, chiral-nematic; Ds, slow-dynamical state; Df, fast-dynamical state; H, homeotropic state. Red circle (in A) and blue circle (in B) are the critical points. Red and blue circled dots are field-induced critical points.
In this paper I present a comprehensive overview of earlier work [16–22] on the response of fd-virus suspensions at very low ionic strengths to low frequency electric fields, which induces new phases and states as well as non-equilibrium critical phenomena. Special attention is given to the microscopic dynamics along various pathways within the phase/state diagram in the field strength vs. frequency plane, including the discontinuity of dynamical behavior on crossing transition lines. In addition, some of the earlier published experimental results concerning the existence of phases and states can be explained on the basis of the dissociation/association of condensed ions.
Materials and Methods
System
Suspensions of fd-virus particles have been used as a model system for mono-disperse charged colloidal rods, whose effective diameter can be tuned by varying the ionic strength. As compared to the earlier studies of Konstanz group at very low ionic strengths [23], the fd-concentrations considered here are much larger, within the isotropic-nematic coexistence region. The sample preparation is done by our typical protocols [24] as follows. The fd-viruses are grown and purified by using the XL1-blue strain of E. coli as the host bacteria. The virus particles are purified by repeated centrifugation (105 g for 5 h) and re-dispersed in TRIS/HCl buffers with varying concentration, depending on the final ionic strength. Bacteriophage fd is a rod-like helical DNA-strand macromolecule with a length of L = 880 nm, a bare diameter of D = 6.6 nm. The persistence length at high salt concentration is about P = 2200 nm, and a molecular weight of M = 1.64 × 10⁷ g/mol. From the dimensions and molecular weight of a fd-virus particle, the volume fraction ϕ of an fd-virus suspension is found to be related to the weight concentration c, as ϕ = 1.10 × 10⁻³ × c [mg/ml]. The overlap concentration of fd-virus suspensions is equal to 0.076 mg/ml. At a given ionic strength, fd-virus suspensions are equilibrated with a TRIS/HCl buffer by an osmotic dialysis. The dialyzation buffer is also used to dilute the suspensions to the desired fd-concentration. The ionic strength of the osmotic reservoirs is the ionic strength from which the electrostatic Debye-Huckel screening length is calculated. Each buffer is obtained by dilution with deionized water of a concentrated a concentrated TRIS/HCl buffer, which is prepared by adding a small volume of HCl to a 20.0 mM TRIS solution (with a pH of 8.2). The effect of dissolved carbon dioxide on the ionic strength and pH as a function of the buffer concentration can be found in Kang et al. [25], and the charge distribution on fd-virus particles is estimated from titration curves [26].
Electric-Field Induced Phase/State Diagram of Suspensions of Fd-Rods
The electric-field phase/state diagrams and depolarized optical morphologies of various phases/states are shown in Figure 1 for two relatively low ionic strengths (corresponding to buffer concentrations of 0.16 mM Figure 1A and 0.032 mM Figure 1B). Here, the electric field amplitude is corrected for electrode polarization (which becomes important for frequencies below 60 Hz). A detailed account of electrode polarization is provided in Kang and Dhont [18]. The depolarized images in this figure within the various phases/states are recorded with the sample between two crossed polarizers.
The solid lines in the phase/state diagram refer to sharp phase/state transitions, while the dashed lines refer to gradual transitions involving the chiral texture and dynamics of N-domains. Figure 1C shows the depolarized morphology of the various phases/states. The N-phase is a coexistence of an isotropic and non-chiral nematic phase, which is also the equilibrium state without the electric field. The non-chiral nematic domains become chiral on increasing the field amplitude at sufficiently low frequencies: the N*-phase, which corresponds to the image with the typical striped pattern. The domains become smaller and disconnect gradually on increasing the field amplitude further: the N*D-phase. The pitch becomes smaller on increasing the field amplitude. On further increasing the field amplitude, a slow dynamical state Ds is induced, where nematic domains slowly melt and reform. The time scale on which melting and forming occurs becomes smaller in the fast dynamical Df with increasing field amplitude. At a high frequency, however, only a uniformly aligned homeotropic H-phase is observed, where the fd-rods are aligned along the applied electric field. The above described phases and states are reversible on changing the applied field parameters, and found to be independent of the way they are reached. Also at a given field amplitude, on decreasing the field frequency, pre-transitional blurry nematic domains are seen on approach of the H-N* transition line.
There is a point in the phase/state diagram where several transition lines meet. This point can be identified as a non-equilibrium critical point in the sense that a time- and length-scale diverge on approach of that point from the side of the dynamical state. The time-scale is the time interval during which melting and forming of nematic domains occurs, while the length-scale is the maximum size of the domains. Detailed measurements of the characteristic time for melting and domain formation are performed through image-time correlation spectroscopy, where transmitted-light correlation functions are constructed from time-resolved CCD images [27] the principle of which is explained in Figure 2. Constructing correlation functions from CCD microscopy images of transmitted light has been proposed and used to study the dynamics of slow dynamical modes in colloidal systems and foams in Cerbino and Trappe [28], Duri et al. [29]. In the present case, the transmitted intensity through the sample between crossed polarizers is correlated instead of scattered light.
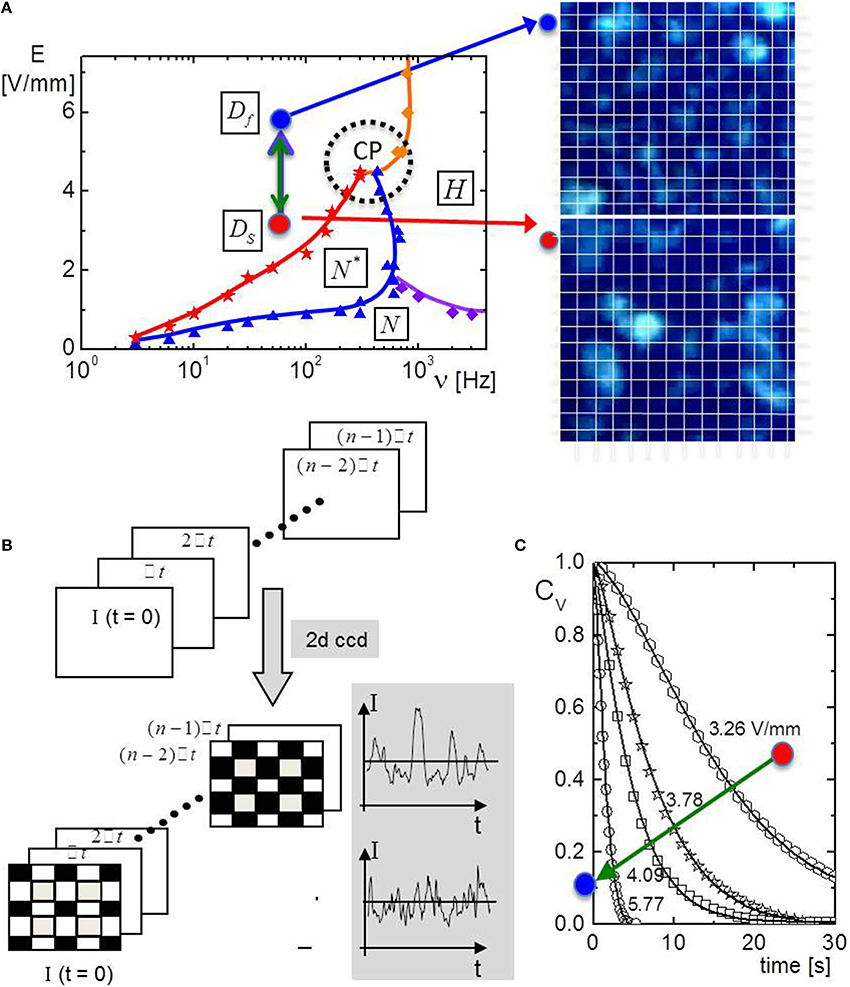
Figure 2. (A) A simplified electric phase/state diagram, with two depolarized CCD-camera snap shots are shown, one in the slow dynamical state DS (red dot), and one in the fast dynamical state Df (blue dot). CP is the critical point that multi-transition lines meet. (B) The principle of image-time correlation spectroscopy. Time-resolved image are taken with a CCD camera. For each pixel a time trace is thus recorded (the plots show a typical time trace in the slow dynamical state, upper plot, and within the fast dynamical state, the lower plot). From these time traces the image-time correlation function as defined in the main text is constructed. (C) Examples of image-time correlation functions for different field amplitudes. On going from the slow- to the fast dynamical state the decay rate of the correlation functions increases. The solid lines are fits to a single stretched exponential. The time constant in this fit quantifies the time scale on which melting and forming of nematic domains proceeds. Colored symbols and lines indicate the phase transition lines. Symbols are data points.
As can be seen in Figure 1B, the critical point is shifted to lower field amplitude on lowering the ionic strength, for the same fd-concentration. This can be understood as follows. The origin of the dynamical state lies in the cyclic field-induced dissociation and association of condensed ions [17]. When a domain is oriented along the electric field, polarization of the layer of condensed ions [30] leads to the dissociation of condensed ions. This leads to an increase of the ionic strength, giving rise to a decrease of the Debye length. When sufficient ions are released, the effective diameter can become so small that the effective concentration is lower than the isotropic-nematic binodal concentration. The nematic domain will then melt, and rods will de-align. This de-alignment leads to association of condensed ions, which leads in turn to an increase of the effective concentration. When the concentration is larger than the binodal concentration the melted domain will become nematic again. The nematic domain is subsequently aligned along the electric field due to torques that the external field exerts on the polarization charges of condensed ions, again leading to increasingly strong polarization of the layer of condensed ions. This again results in dissociation of condensed ions, and the cycle repeats itself. This is the mechanism that underlies the origin of the dynamical state [17]. As the overall ionic strength arising from the buffer is decreased, less dissociated condensed ions are needed to give rise to a relatively large change of the Debye length. Hence, a lower field amplitude is sufficient to dissociate the smaller amount of condensed ions necessary to reach the dynamical state. This is the reason why the N*D-Df transition line, and the critical point in particular, shifts to lower field amplitudes as the buffer concentration is decreased.
The reason for observing a chiral nematic is as follows. The DNA strand has a chiral structure, which is mediated to the coat proteins, which in turn translates to a chiral distribution of the surface charge distribution. For large Debye lengths, however, the long-ranged electrostatic repulsion screens these chiral interactions, rendering the nematic non-chiral. The variation of the pitch with the electric field amplitude and frequency can be explained in terms of dissociation of condensed ions, like for the dynamical state. At higher frequencies, the polarization of the layer of condensed ions is less pronounced, leading to less dissociation of condensed ions, and thus to a relative low ionic strength. The resulting large Debye length leads to a stronger screening of the chiral core-core interactions, and thus to a longer pitch. At a given ionic strength, field amplitude and frequency, the chiral core-core interactions become more pronounced as the fd-concentration is increased. Increasing the fd-concentration thus leads to a decrease of the pitch.
Image-Time Correlation Spectroscopy in Low-Frequency Induced Dynamical States
A simplified electric phase/state diagram is shown in Figure 2A, where the low frequency induced dynamical states are indicated, as well as the pixelated time-lapsed images on the right. The slow dynamical state DS is indicated as a red point, near the transition line at low frequency. Away from the transition line there is a fast dynamical state Df that is indicated with a blue point. To probe the dynamics of the melting and reforming nematic domains, image-time correlation functions are construction from time-resolved CCD images [27]. The construction of correlation functions from CCD images of transmitted light has also been proposed in Cerbino and Trappe [28], Duri et al. [29]. In Givazzi et al. [31], the originally proposed image correlation technique in Cerbino and Trappe [28], Duri et al. [29] is extended to probe elastic constants of nematics, for planar and homeotropic alignment. The principle of image-correlation is briefly sketched in Figure 2B. First, a series of time-lapsed images is collected with a CCD camera. The image-time correlation function is defined as
where I is the instantaneous intensity recorded by a single pixel, and the brackets <… > denote averaging over all pixels. Note that the pixel-averaged intensity is subtracted from the single pixel intensity, and the function is normalized such that it is unity at time zero. Then the decay rate of correlation functions is used to characterize the dynamics of textures. For data acquisition, a time binning (or time interval), a total number of frames, and the region of interest are optimized [27]. Image-time correlation functions are shown in Figure 2C, together with fits to a stretched exponential. The corresponding time constant quantifies the time-scale on which melting and reforming of domains occurs. The slowing down of melting and reforming of domains on approach of the transition line is clearly revealed by the correlation functions shown in Figure 2C.
In-situ Electric-Field Small Angle Vertical Dynamic Light Scattering
Microscopic dynamics in the homeotropic H-phase that is induced at relatively high frequencies is explored with a home-built small angle in-situ electric field dynamic light scattering set up, a photograph of which is shown in Figure 3A [27]. The in-situ electric cell is located at the center of the setup (indicated by the red circle). The optical train is vertically aligned, and the sample cell consists of two ITO-coated glasses, where the sample droplet is kept in place through capillary forces. The detector is mounted on a goniometer, and the true scattering angle is corrected for refraction of the scattered light at the sample-glass-air interfaces. For small scattering angles the direction of the scattering vector is predominantly perpendicular to the field direction, while a small parallel component comes into play at somewhat larger scattering angles. In the present study the scattering angle is fixed to θS ~10°.
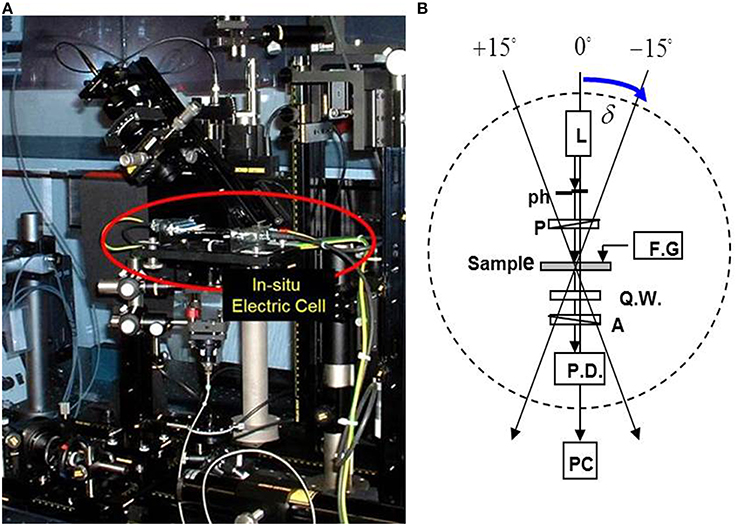
Figure 3. (A) A photograph of the in-situ small angle dynamic light scattering set up, where the in-situ electric cell is located within the red circle. (B) A sketch of the electric birefringence setup: The optical rail is tilted by 15°. L, Laser; ph, pinhole; P, polarizer; F.G., function generator; Q.W., quarter-wave plate; A, analyzer. Blue arrow is the tilted angle of an optional rail.
Electric Birefringence
To probe the degree of orientational alignment of fd-rods within the H-phase, the birefringence is measured by means of the set up that is sketched in Figure 3B, where the optical elements are loaded in the straight optical rail that is slightly tilted [18, 27]. The tilt angle δ is non-zero, since otherwise no birefringence would be measured for the homeotropic alignment at hand. The transmitted intensity is measured as a function of the angle of rotation of the analyzer (the polarizer marked “A” in Figure 3B). From the shift of the angle where the minimum intensity is measured as compared to a non-birefringent sample, the orientational order parameter, which quantifies the degree of alignment, can be calculated [18].
Results
The Choices of Different Pathways in Phase/State Diagram
Different pathways are chosen to explore the orientational order and microdynamics at high frequencies, within the H-phase. Figure 4 shows a sketch of the various pathways along which dynamic light scattering experiments are performed:
• Path (i): At a fixed high frequency, by lowering the field amplitude well within the homeotropic H-phase
• Path (ii): At a fixed low field amplitude, by lowering the frequency
• Path (iii): At a fixed critical field amplitude, by lowering the frequency
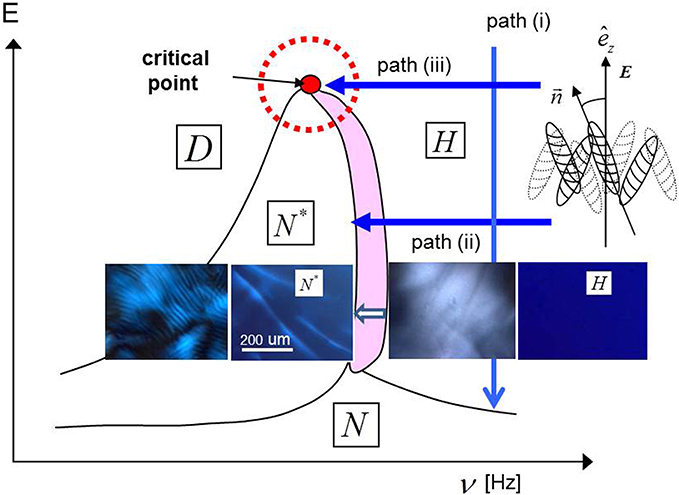
Figure 4. A simplified phase/state diagram, indicating the pathways (i), (ii), and (iii). The depolarized images of the morphologies along path (ii) are shown. Transient, large and blurry nematic domains are seen in the pink area.
Depolarized morphologies along path (ii), near to the H-N* transition line, are given in Figure 4, where transient large blurry nematic domains with a fuzzy interface appear within the indicated pink region with a width of about 100 Hz. Just below the H-N* transition line, the chiral pitch is very large (see the second image in Figure 4), which decreases on lower4ing the frequency (see the first image).
Orientation Alignment in the Homeotropic Phase
The field-induced orientational order parameter is measured in the H-phase, which quantifies the degree of alignment of the rods. As the frequency is too large to induced polarization of the double layer and the layer of condensed ions, the degree of ordering depends on the direct interactions through the unperturbed electric double layers, as well as hydrodynamic interactions through the electro-osmotic flow that is induced by the external field within the electric double layers. It turns out that the order parameter is independent of the field amplitude and the frequency throughout the H-phase (except near the N-to-N* transition line where pre-transitional nematic domains are present). This is shown in Figures 5A–C, where the shift of the angle α of the analyzer is plotted for the three different pathways. The angle (and thus the order parameter) is constant along the three paths, and is also the same for the three different paths. This suggests that the mechanism that stabilizes the homeotropic H-phase is not connected to interactions due to polarization of the electric double layer or the layer of condensed ions, but is due to field induced electro-osmotic flow. The H-phase is thus stabilized by hydrodynamic interactions between the rods, due to the electro-osmotic flow that is generated within their double layers by the external field.
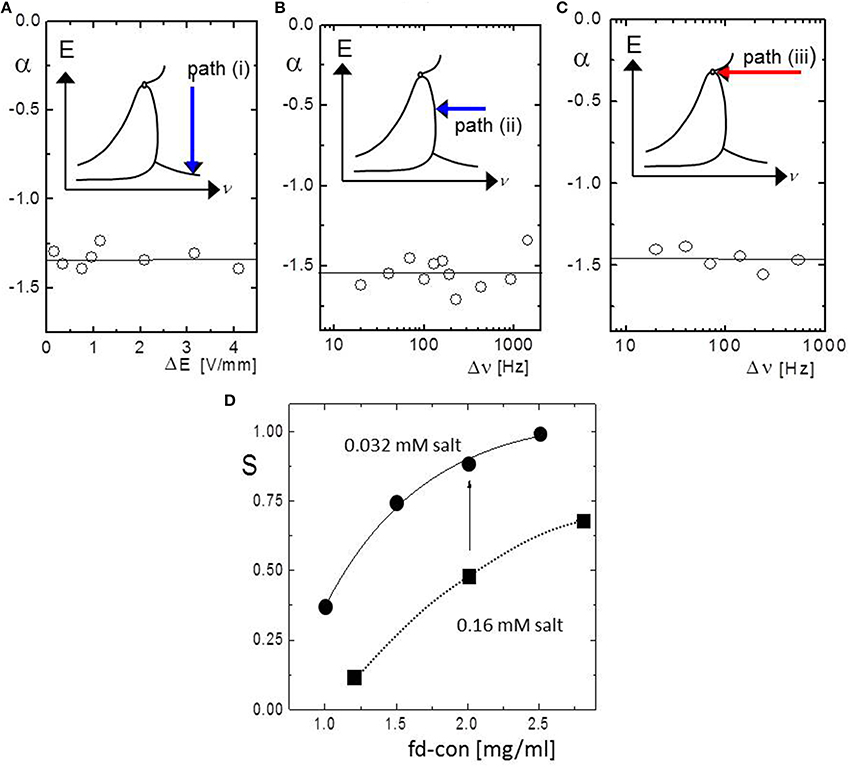
Figure 5. (A–C) The analyzer angle as a function of the field strength and frequency, relative to the location of the N*-H transition line, along the different paths indicated in the inserts. (D) The order parameter as a function of fd-concentration for two low ionic strengths (circle = 0.032 mM and square = 0.16 mM salt).
As the electric double layer is essentially unperturbed within the H-phase, the degree of alignment in the H-phase is still a sensitive function of the ionic strength as well as the rod-concentration. The orientational order parameter S is shown in Figure 5D obtained from electric birefringence measurements as a function of the fd-concentration for two ionic strengths (corresponding to buffer concentrations of 0.16 and 0.032 mM). As expected, the order parameter is larger for the lower ionic strength, due to the larger Debye length that renders the effective thickness, and thereby the effective concentration of the rods, larger.
Field-Induced Microscopic Relaxation Dynamics within the Homeotropic H-Phase
The microscopic dynamics as probed by dynamic light scattering along the same pathways (defined in Figure 4) within the high-frequency induced homeotropic H-phase is explored.
Along path (i) the correlation functions do not change with decreasing field strength. The field-induced dynamic light scattering correlation functions along the paths (ii) and (iii) are shown in Figures 6A,B, respectively. The apparent particle dynamics becomes faster as the transition line is approached. This happens only close to the H-N* transition line, within the pink region in Figure 4, with a width of about 100 Hz. The origin of this apparent increasing diffusivity is connected to the existence of pre-transitional domains in that region (which can be seen in the third-right image in Figure 4). Within these transient domains (with a life-time of several minutes), rods are not necessarily oriented along the electric field direction. For the very small scattering angle of 100, the scattering vector is essentially perpendicular to the electric field direction. Within the H-phase, away from the transition line, diffusion in the direction perpendicular to the nematic director is therefore probed. When pre-transitional domains are present, however, also diffusion parallel to the nematic director is probed. The latter is much faster that the former, so that a faster relaxation is found within the pink region in Figure 4. Away from the pink region in Figure 4, diffusivities are independent of the field strength and frequency. There is, however, a special feature for path (iii) on approach of the critical point, on lowering the frequency at constant critical field strength of 3.52 V/mm. As can be seen from Figure 6B, a slow mode comes into play close to the critical point. The decay time and amplitude of this mode increases on approach of the critical point. There is thus not only critical behavior from the side of the dynamical state (see Section Electric-field induced phase/state diagram of suspensions of fd-rods), but also from the side of the H-phase connected to dynamics on the particle level. The origin of this slow mode may be related to the existing local elasticity of chiral nature of particles.
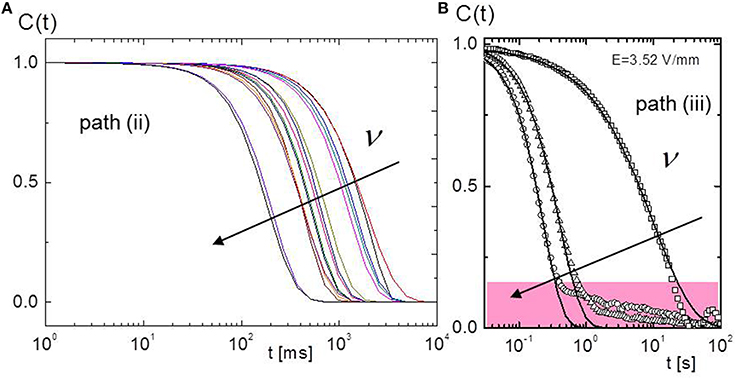
Figure 6. Dynamic light scattering correlation functions for the different paths: (A) the off-critical path (ii) and (B) the path (iii) at critical field strength. The arrow indicates the decrease of an applied frequency.
The correlation functions can be fitted with a stretched exponential function C(t) ~ Aexp (−(t/τ)β)+ B, where τ is the microscopic relaxation time and β is the stretching parameter, which accounts for non-standard diffusive behavior. For β <1 the diffusive process is referred to as sub-diffusive, and for β > 1 as super-diffusive. Such a single stretched-exponential fit along path (iii) is done with the disregard of the slow mode (see the solid lines in Figure 6B). A diffusion coefficient can be defined as D = 1/(q2τ). This diffusion coefficient is plotted as a function of the distance in frequency from the H-N* transition line in Figure 7A, for paths (ii) and (iii). This quantifies the rise in the apparent diffusivity due to the existence of pre-transitional domains, as discussed above. The stretching exponent is plotted in Figure 7B as a function of the scattering wave vector for two frequencies (left plot) and for a fixed scattering angle as a function of the frequency. Far into the H-phase, away from the transition line, sub-diffusion is observed, while close to the transition the diffusion is super-diffusive. The microscopic origin of this behavior is not yet understood. The diffusion coefficient related to the fast mode, close to the transition line, is about twice as large for the critical approach as compared to the non-critical approach. This indicates that the fraction of the system occupied by pre-transitional domains is larger for the critical approach. The diffusion constant is decreased on increasing the fd-concentration. As the motion that is probed is perpendicular to the nematic director, this can be interpreted as an increased hindrance through the relatively long-ranged electrostatic repulsive forces. At larger scattering angles, well within the H-phase, dynamic light scattering correlation functions exhibit two modes [22]. The additional mode is due to the finite component of the wave vector parallel to the electric field through which diffusion along the nematic director is probed as well.
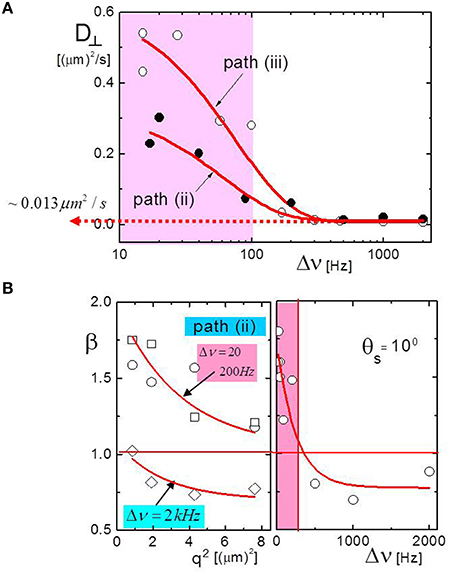
Figure 7. (A) The diffusion coefficient for motion perpendicular to the external field D⊥ as a function of the frequency gap from the transition frequency of the H-N* transition line, for the two paths (ii) and (iii). (B) The stretching exponent, β, as a function of the squared wave vector q for two different frequencies (left panel) and as a function of the frequency along path (ii) at a fixed scattering angle (right panel).
Discontinuous Microscopic Relaxation Times at Transition Lines
Finally, the microscopic relaxation time τ as measured by dynamic light scattering is probed along the paths A and B in Figure 8A, upon crossing various transition lines. The relaxation time is obtained from a stretched exponential fit as discussed in Section The choices of different pathways in phase/state diagram. The microscopic relaxation time τ is shown as a function of applied field amplitude along path A in Figure 8B. At the sharp transition from the quiescent N*D-phase to the dynamical state there is a clear discontinuity in the relaxation time, with a jump of about 0.5 s. As the time scale for melting and forming of domains in the Ds-state is several tens of seconds, while the measured relaxation time is of the order of a second, this relaxation time is connected to particle dynamics, not to the melting and reforming dynamics of nematic domains. There is thus an abrupt change of the micro-structure within the nematic domains on going from the N*-state to the dynamical state. A similar, but less pronounced, discontinuity is shown along path B as the N*-H transition line is crossed on increasing the frequency, as can be seen in Figure 8C. In view of the discontinuity of the relaxation times, which implies a jump in micro-structural order, the N*-D and N*-H transitions may be classified as first-order transitions.
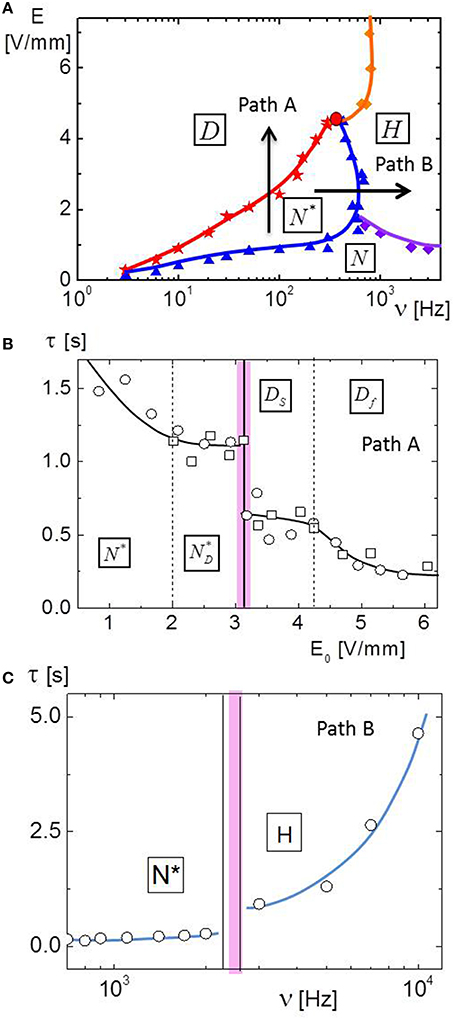
Figure 8. (A) A simplified electric phase/state diagram, which defines the paths A and B. (B,C) The relaxation time of dynamic light scattering correlations functions along path A and path B, respectively. Colored lines are different phase transition lines. Colored symbols and lines indicate the phase transition lines.
Conclusion and Discussion
Suspensions of fd-virus particles, which are model systems for very long and thin, highly charged colloidal rods, show a rich behavior when subjected to a low-frequency external electric field. For concentrations within the isotropic-nematic coexistence region, the electric field induces several new phases and a dynamical state, where nematic domains persistently melt and form. These transitions are due to field-induced interactions related to polarization of the double layer and the layer of condensed ions, due to hydrodynamic interactions through electro-osmotic flow induced within the double layers surrounding the rods, and due to the field-induced dissociation/association of condensed ions. The frequency above which charge polarization is essentially absent can be estimated to be around 500–1000 Hz. The phases and the dynamical state found experimentally below this critical frequency are therefore the result of polarization charge-charge interactions and field-induced dissociation/association of condensed ions, while the uniform homeotropic phase found above this frequency is due to hydrodynamic interactions through the field-induced electro-osmotic flow.
There a special point in the phase/state diagram where several transition lines meet, which can be identified as a non-equilibrium critical point. On approach of this point from the side of the dynamical state, the time scale on which melting and forming of nematic domains occurs as well as the maximum size of the domains diverge. The dynamics of melting and forming of domains is probed through the construction of image-time correlation functions. On approach of this point from the side of the uniform high-frequency homeotropic phase, dynamic light scattering reveals the development of a slow mode. The field strength at which the critical point is located shifts to lower values on decreasing the ionic strength. This can be understood in terms of field-induced dissociation/association of condensed ions. Since the critical point is located at the frequency where charge polarization interactions become less pronounced, and probably of the same magnitude as hydrodynamic interactions through electro-osmotic flow, the critical behavior may be due to a subtle interplay between these two types of interactions.
In the homeotropic phase, within a small frequency range at the transition line where the chiral nematic transforms to the homeotropic phase, large blurry domains are observed with fuzzy interfaces. These pre-transitional nematic domains have a life time of a few minutes. Dynamic light scattering and electric birefringence measurements show that the diffusivity and the orientational order are independent of the field strength and frequency throughout the homeotropic phase, except within the region close to the transition line where the pre-transitional domains are present. The presence of these domains leads to an apparent increase of the diffusivity. Both sub- and super-diffusivity are observed in the homeotropic phase and the region where the pre-transitional domains are present. Dynamic light scattering reveals that the particle dynamics changes abruptly on crossing sharp phase/state transition lines. This indicates that the microstructural order changes abruptly, so that these transitions may be classified as first order transitions. Upon a quench from the H-phase to just below the N*-H transition, blurry domains are seen after a few seconds, after which it takes several minutes to form the equilibrium N*-phase. After a quench from the N*-phase into the H-phase, it takes typically a few minutes to melt the N*-structure.
The transition from a normal nematic to a chiral nematic and subsequently to the dynamical state can be interpreted (on a semi-quantitative level) in terms of field-induced dissociation/association of condensed ions. This also explains the shift of the critical point to lower field strengths on lowering the buffer ionic strength. It would therefore be interesting to investigate the phase behavior, and the kinetics in the dynamical state in particular, for various ionic strengths.
Conflict of Interest Statement
The author declares that the research was conducted in the absence of any commercial or financial relationships that could be construed as a potential conflict of interest.
Acknowledgment
Author thanks to J. K. G. Dhont for scientific discussions.
References
1. Zimm BH. Applications of the methods of molecular distribution to solutions of large molecules. J Chem Phys. (1946) 14:164–79. doi: 10.1063/1.1724116
Pubmed Abstract | Pubmed Full Text | CrossRef Full Text | Google Scholar
2. Allison S, Chen C, Stigter D. The length dependence of translational diffusion, free solution electrophoretic mobility, and electrophoretic tether force of rigid rod-like model duplex DNA. Biophys J. (2001) 81:2558–68. doi: 10.1016/S0006-3495(01)75900-0
Pubmed Abstract | Pubmed Full Text | CrossRef Full Text | Google Scholar
3. Barkley MD, Zimm BH. Theory of twisting and bending of chain macromolecules: analysis of the fluorescence depolarization of DNA. J Chem Phys. (1979) 70:2991–3007. doi: 10.1063/1.437838
4. Rhues PA, Adamcik J, Bolisetty S, Sanchez-Ferrer A, Mezzenga R. A supramolecular bottle-brush approach to disassemble amyloid fibrils. Soft Matter (2011) 7:3571–9. doi: 10.1039/c0sm01253j
5. Veerman C, Sagis LMC, van der Linden E. Gels at extremely low weight fractions formed by irreversible self-assembly. Macromol. Biosci. (2003) 3:243–7. doi: 10.1002/mabi.200390035
6. Wierenga AM, Philipse AP, Reitsma EM. Decay of flow birefringence in dispersions of charged colloidal rods-effect of double-layer interactions. Langmuir (1997) 13:6947–50. doi: 10.1021/la9708593
7. Wierenga AM, Philipse AP. Low-shear viscosity of isotropic dispersions of (Brownian) rods and fibers- A review of theory and experiments. Colloids Surfaces A (1998) 137:355–72. doi: 10.1016/S0927-7757(97)00262-8
8. Tirado MM, de la Torre JG. Rotational dynamics of rigid, symmetric top macromolecules: application to circular cylinders. J Chem Phys. (1980) 73:1986–93. doi: 10.1063/1.440288
9. van Bruggen MPB, Lekkerkerker HNW, Dhont JKG. Long-time translational self-diffusion in isotropic dispersion of colloidal rods. Phys Rev E (1997) 56:4394. doi: 10.1103/PhysRevE.56.4394
10. van der Zande BMI, Dhont JKG, Boehmer MR, Philipse AP. Colloidal dispersions of gold rods characterized by dynamic light scattering and electrophoresis. Langmuir (2000) 16:459–64. doi: 10.1021/la990043x
11. Hynninen AP, Panagiotopoulos AZ. Disappearance of the gas-liquid phase transition for highly charged colloids. Phys Rev Lett. (2007) 98:198301. doi: 10.1103/PhysRevLett.98.198301
Pubmed Abstract | Pubmed Full Text | CrossRef Full Text | Google Scholar
12. Purdy KR, Fraden S. Isotropic-cholesteric phase transition of filamentous virus suspensions as a function of rod length and charge. Phys Rev E (2004) 70:061703. doi: 10.1103/PhysRevE.70.061703
Pubmed Abstract | Pubmed Full Text | CrossRef Full Text | Google Scholar
13. Onuki A, Okamoto R, Araki T. Phase transitions in soft matter induced by selective solvation. Bull Chem Soc Jpn. (2011) 84:569–87. doi: 10.1246/bcsj.20110012
Pubmed Abstract | Pubmed Full Text | CrossRef Full Text | Google Scholar
14. Okamoto R, Onuki A. Ion distribution around a charged rod in one and two component solvents: preferential solvation and first order ionization phase transition. J Chem Phys. (2009) 131:094905. doi: 10.1063/1.3216518
Pubmed Abstract | Pubmed Full Text | CrossRef Full Text | Google Scholar
15. Kitamura H, Onuki A. Ion-induced nucleation in polar one-component fluids. J Chem Phys. (2005) 123:124513. doi: 10.1063/1.2039078
Pubmed Abstract | Pubmed Full Text | CrossRef Full Text | Google Scholar
16. Kang K. Charged fibrous viruses (fd) in external electric-fields: dynamics and orientational order. New J Phys. (2010) 12:063017. doi: 10.1088/1367-2630/12/6/063017
17. Dhont JKG, Kang K. An electric-field induced dynamical state in dispersions of charged colloidal rods. Soft Matter (2014) 10:1987–2007. doi: 10.1039/c3sm52277f
Pubmed Abstract | Pubmed Full Text | CrossRef Full Text | Google Scholar
18. Kang K, Dhont JKG. Electric-field induced transitions in suspensions of charged colloidal rods. Soft Matter (2010) 6:273–86. doi: 10.1039/b910046f
19. Kang K, Dhont JKG. Double-layer polarization induced transitions in suspensions of colloidal rods. Euro Phys Lett. (2008) 84:14005. doi: 10.1209/0295-5075/84/14005
20. Kang K, Dhont JKG. Criticality in a non-equilibrium, driven system: charged colloidal rods (fd-viruses) in electric fields. Eur Phys J E (2009) 30:333–40. doi: 10.1140/epje/i2009-10525-4
Pubmed Abstract | Pubmed Full Text | CrossRef Full Text | Google Scholar
21. Kang K. Mesoscopic relaxation time of dynamics image correlation spectroscopy. J Bio Sci Eng. (2010) 3:625–32. doi: 10.4236/jbise.2010.36085
22. Kang K. Diffusivity in an electric -field induced homeotropic phase of charged colloidal rods. Europhys Lett. (2010) 92:18002. doi: 10.1209/0295-5075/92/18002
23. Kramer H, Graf C, Hagenbuche M, Johner C, Martin C, Schwind P, Weber R. Electro-optic effects of aqueous fd-virus suspensions at very low ionic strength. J Phys II France (1994) 4:1061–74. doi: 10.1051/jp2:1994184
24. Sambrook J, Fritsch EF, Maniatis T. Molecular Cloning: A Laboratory Manual. New York, NY: Cold Spring Harbor Laboratory Press (1989).
25. Kang K, Wilk A, Patkowski A, Dhont JKG. Diffusion of spheres in isotropic and nematic networks of rods: electrostatic interactions and hydrodynamic screening. J Chem Phys. (2007) 126:214501. doi: 10.1063/1.2737446
Pubmed Abstract | Pubmed Full Text | CrossRef Full Text | Google Scholar
26. Zimmermann K, Hagedorn H, Heuck CC, Hinrichsen M, Ludwig H. The ionic properties of the filamentous bacteriophages Pf1 and fd. J Bio Chem. (1986) 261:1653.
27. Kang K. Image time-correlation, dynamic light scattering, and birefringence for the study of the response of anisometric colloids to external fields. Rev Sci Instrum. (2011) 82:053903. doi: 10.1063/1.3589856
Pubmed Abstract | Pubmed Full Text | CrossRef Full Text | Google Scholar
28. Cerbino R, Trappe V. Differential dynamic microscopy: probing wave vector dependent dynamics with a microscope. Phys Rev Lett. (2008) 100:188102. doi: 10.1103/PhysRevLett.100.188102
Pubmed Abstract | Pubmed Full Text | CrossRef Full Text | Google Scholar
29. Duri A, Sessoms DA, Trappe V, Cipelletti L. Resolving long-range spatial correlations in jammed colloidal systems using photon correlation imaging. Phys Rev Lett. (2009) 102:085702. doi: 10.1103/PhysRevLett.102.085702
Pubmed Abstract | Pubmed Full Text | CrossRef Full Text | Google Scholar
30. Dhont JKG, Kang K. Electric-field induced polarization of the layer of condensed ions on cylindrical colloids. Eur Phys J E (2011) 34:40. doi: 10.1140/epje/i2011-11040-9
Pubmed Abstract | Pubmed Full Text | CrossRef Full Text | Google Scholar
31. Givazzi F, Crotti S, Speciale A, Serra F, Zanchetta G, Trappe V, et al. (2014). Viscoelasticity of nematic liquid crystals at a glance. Soft Matter 10:3938–49. doi: 10.1039/c4sm00145a
Pubmed Abstract | Pubmed Full Text | CrossRef Full Text | Google Scholar
Keywords: external electric field, phase transitions, charged fibrous viruses, homeotropic phase, correlation functions
Citation: Kang K (2014) Electric-field induced microdynamics of charged rods. Front. Phys. 2:73. doi: 10.3389/fphy.2014.00073
Received: 18 October 2014; Accepted: 19 November 2014;
Published online: 12 December 2014.
Edited by:
Raúl A. Rica, Institut de Ciències Fotòniques, SpainReviewed by:
Claire Chassagne, Technical University of Delft, NetherlandsGiuliano Zanchetta, Università degli Studi di Milano, Italy
Copyright © 2014 Kang. This is an open-access article distributed under the terms of the Creative Commons Attribution License (CC BY). The use, distribution or reproduction in other forums is permitted, provided the original author(s) or licensor are credited and that the original publication in this journal is cited, in accordance with accepted academic practice. No use, distribution or reproduction is permitted which does not comply with these terms.
*Correspondence: Kyongok Kang, Soft Condensed Matter, Institute of Complex Systems, Forschungszentrum Juelich, Leo-Brandt Str. 4, Juelich 52425, Germany e-mail: k.kang@fz-juelich.de