Thermodynamic mechanism of the density anomaly of liquid water
 Makoto Yasutomi
- Department of Physics and Earth Sciences, Faculty of Science, University of the Ryukyus, Nishihara-Cho, Japan
Although the density anomaly of liquid water has long been studied by many different authors, it is still not clear what thermodynamic mechanism induces the anomaly. The thermodynamic properties of substances are determined by interparticle interactions. We analyze what characteristics of the pair potential cause the density anomaly on the basis of statistical mechanics and thermodynamics using a thermodynamically self-consistent Ornstein-Zernike approximation. We consider a fluid of spherical particles with a pair potential given by a hard-core repulsion plus a soft-repulsion and an attraction. We show that the density anomaly occurs when the value of the soft-repulsive potential at hard-core contact is in some proper range, and that the range depends on the attraction. Furthermore, we show that the behavior of excess internal energy plays an essential role in the density anomaly, and that the behavior is mainly determined by the value of the soft-repulsive potential, especially near the hard-core contact. Our results show that most of the ideas put forward up to now do not explain the direct causes of the density anomaly of liquid water. It has been known for a long time that these ideas tell us nothing about what causes the negative thermal expansion at temperatures below 4°C.
1. Introduction
Most liquids become monotonically denser when cooled from room temperature, but liquid water reaches its maximum density at approximately 4°C, below which it expands to become less dense as it is cooled further. To explain this density anomaly, several ideas have been proposed.
Röntgen [1] considered water to be a mixture of molecular complexes. Some of these complexes are less dense and ice-like, whereas others are denser, proper-water complexes. A change in the proportions of these complexes with temperature could explain the non-monotonic dependence of some water properties on these parameters. However, there is no explanations of what induces such a change in the proportions.
Bernal and Fowler [2] put forward the idea that a three-dimensional network exists in liquid water. They reasoned that at temperatures close to the melting point, this network is a mixture of two structures: one denser and quartz-like and the other less dense and tridymite-like (or ice-like). This was a concretization of Röntgen's idea of water as a mixture of ice-like and water-like particles.
The next version of the network model was formulated by Pople [3], who proposed that hydrogen bond bending is the reason for the greater density of water in comparison with ice. Bernal [4] returned to the problem of liquid water. He applied the notion of a random tetrahedral network to water. The concept of the random tetrahedral network was developed quantitatively by Sceats and Rice [5–7].
Two other groups of models were developed and discussed in the 1950 and 1960s, the first being the model put forward by Samoilov [8], who proposed that water retains an ice-like network, and cavities in this network are partially filled by water molecules. The network itself is perturbed by thermal motion. According to this model, ice melting must be accompanied by molecules falling into the cavities; this is why the density increases. Unlike Samoilov, [9] supposed that the network is not ice-like, but gas-hydrate-like. These models can be described as clathrate because their main feature is the filling of cavities.
The second group of models is a direct development of Röntgen's two-state idea. These models suggest that water is a microheterogeneous system consisting of two microphases: one consisting of fragments of a hydrogen-bonded tetrahedral framework and another in which the molecules are not involved in hydrogen bonds. The most popular among these models is that proposed by Némety and Scheraga [10]. They considered that hydrogen-bonded water clusters are floating in a “sea” of non-bonded molecules. Both microphases of the classical two-state models came to be regarded as containing hydrogen bonds; the possibility of hydrogen-bond formation between the cavity and framework molecules began to be admitted by proponents of clathrate models. Thus, a picture of water as a continuous three-dimensional network predominated on the eve of the computer simulation era. The impossibility of Némety and Scheraga type models was ultimately demonstrated when models based on percolation theory were applied to water [11]. The three dimensional network was accepted by practically all scientists involved in the study of water [12].
In addition, Monte Carlo and molecular dynamics calculations have been performed for liquid water by using the BNS, MCY, and ST2 potential functions [13], and by using TIP3P [14], TIP4P [15], TIP5P [16], SPC [17] and SPCE [18]. There is an enormous literature on the properties of water. Stanley et al. [19] have presented an overview of recent research that applies ideas of statistical mechanics to try to better understand the statics and in particular the dynamic puzzles regarding liquid water. They have discussed recent molecular dynamics simulations using TIP5P, which is closer to real water than previously-proposed classical pairwise additive potentials, and have shown some interesting results. Guillot [20] has appraised in his review paper what have been accomplished during the last three decades and what remains to be improved: one has a taste of incompletion if one considers that not one water model is available in the literature that is able to accurately reproduce all the properties of water. Despite great efforts to improve this situation, there has been little significant progress. Molinero and Moore [21] developed a coarse-grained model of water called “mW” that essentially models water as an atom with tetrahedrality intermediate between carbon and silicon. The mW model mimics the hydrogen-bonded structure of water through the introduction of a non-bonded angular dependent term that encourages tetrahedral configuration. This model reproduces the experimentally obtained density-temperature curve at 1 bar better than any other water model presented so far.
Although realistic models can provide a description of the density maximum and reproduce a number of the other anomalies of water, they make the direct causes obscure and difficult to elucidate because the models should include a number of properties of water, and some of them would not be the immediate causes. Therefore, it is impossible to capture the essential physics via the study of realistic models that include the miscellaneous properties of water, even if they can reproduce all of the anomalies of water. To capture the physics underlying the density anomaly, one should use simplified models that include only the properties crucial to explaining the density anomaly of water. Such a traditional method is frequently used in many sciences. It is important to clear up the mysteries one by one, accumulate knowledge, and develop ideas. It is impossible to illuminate the direct causes of all the anomalies of water simultaneously.
To clarify the physics underlying the density anomaly, a number of simplified (core-softened) potentials have been presented by many different authors. Those can be divided into two groups; one composed of a hard-core (HC) plus a purely repulsive tail, and another composed of an HC plus a soft repulsion and an attraction. Models from both groups have presented us with many fruitful results regarding the anomalous behavior of liquids. Although the shapes of the potential tails of both groups are very different, they exhibit water-like anomalous behaviors (see e.g., [22–32] and references quoted therein). It has recently been shown that even weakly softened potentials are able to yield water-like anomalies, i.e., in this case anomalies arise without ever invoking (as usually done) the interplay between two repulsive length scales [33, 34]. However, the simplified potential models presented so far have not been shown to reproduce quantitatively the experimental behaviors of liquid water sufficiently well. We think that this prevents one from obtaining a conclusive explanation of the density anomaly because the thermodynamic properties of liquids depend strongly on the interparticle interactions. Furthermore, numerical results obtained by using a limited number of particles via a Monte Carlo method or molecular dynamics simulation occasionally show a mixture of less dense and denser regions of particles, and it is claimed that a change in the proportions of these regions causes the density anomaly. However, there are other claims that such a mixture is never observed. At any rate, it is not known what thermodynamic mechanism causes a change in the proportions and results in negative thermal expansion. Therefore, a sophisticated method that reproduces the experimental data with high accuracy without using such computer simulations can bring great progress to the solution of this problem.
A self-consistent Ornstein-Zernike approximation (SCOZA) is frequently used as one of the sophisticated methods mentioned above. The SCOZA is known to describe the overall thermodynamics very well and provide a remarkably accurate critical point and coexistence curve. This scheme is entirely self-contained, that is, no supplementary thermodynamic or other input is necessary. Up to now, the SCOZA has been applied to the Yukawa, Sogami-Ise, square-well, triangle-well, and screened-power series potentials, and many fruitful results have been obtained (see [35–40] and references quoted therein). Because any smooth potential tail can be approximated with sufficient accuracy by Yukawa terms, the SCOZA with Yukawa terms is applicable to a variety of liquids.
In our previous paper [41], we determined many functional representations of interparticle interactions between water molecules, all of which reproduce the experimentally measured density-temperature relation at 1 bar with an accuracy better than that obtained by previous models. Numerous similar descriptions of pair interactions will be discovered in the coming years, and these will help us to understand why solid water has polymorphic structures and why liquid water has a large number of anomalies. We mentioned earlier that nearly all of the ideas put forward so far do not explain the immediate causes of the density anomaly of liquid water.
Our present aim is to find the force that appears attractive above 4°C to condense water, but seems repulsive to expand water below 4°C, with reducing temperature. Such a force (hereafter for simplicity referred to as the “anomaly force”) is the immediate cause of the density anomaly of liquid water [41]. Our study is blind to freezing and, more generally, to the solid phases of the model system (see e.g., [42]), but it gives significant insight into the thermodynamic properties of water in these phases. We apply the SCOZA to our core-softened models with an HC repulsion and a tail that is composed of a soft-repulsion and an attraction. We present a new phase diagram (or thermodynamic mechanism) that elucidates the anomalous behavior of liquid water: unusual negative thermal expansion is observed when the value of the potential tail at the hard-core contact is in some proper range that depends on the shape of the attraction; otherwise negative thermal expansion is never observed. It is also found that the behavior of excess internal energy plays an essential role in the density anomaly and that the behavior is mainly determined by the value of the soft-repulsive potential, especially near the hard-core contact, depending on the attraction. Our results show that most of the ideas put forward up to now, such as the second critical point hypothesis, simple two-state model, liquid-liquid phase transition model, clathrate model, network model, hydrogen bonding, orientation-dependent potential, and so on, do not explain the direct causes of the density anomaly of liquid water, as we discussed in our previous article [41].
In the next section, we consider nine cases of pair interactions to illuminate what characteristics of the interactions cause the density anomaly. In Section 3, we clarify the thermodynamic mechanisms that induce the anomaly, and finally, we present conclusions and discussion in Section 4.
2. Models
We consider a fluid of spherical particles with a pair potential given by an HC repulsion and some tail ϕ(r), which is expressed as
where N is an arbitrary integer and zn and an are arbitrary constants.
To clarify the physics underlying the density anomaly, we consider nine cases of tails ϕi(r) (i = 1–9). The model parameters zn and an are listed in Tables 1, 2. Figure 1 shows these potentials except for ϕ6(r). The tail ϕ6(r) is the same as ϕ5(r) in Yasutomi [41]. The diameter of the hard-core σu is used as the unit of length and the depth of the potential εu as the unit of energy.
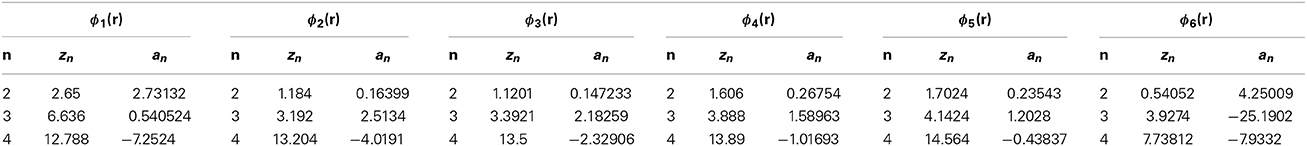
Table 1. Parameters for ϕ1(r), ϕ2(r), …, and ϕ6(r).
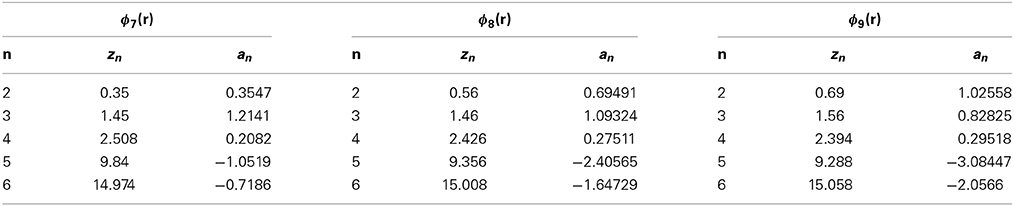
Table 2. Parameters for ϕ7(r), ϕ8(r) and ϕ9(r).
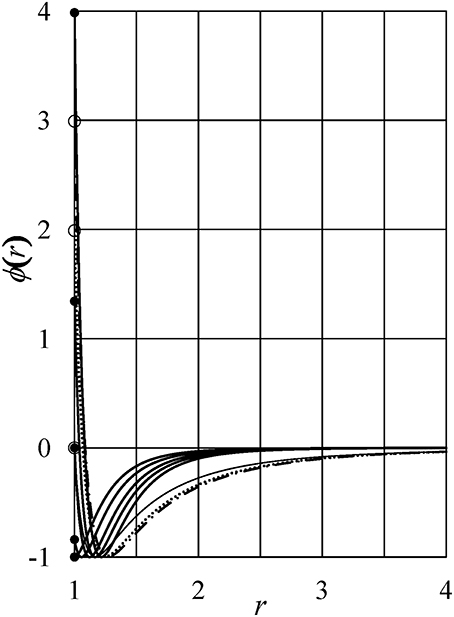
Figure 1. Interaction potentials. Thick full lines: ϕ1(r), ϕ2(r), …, and ϕ5(r) from the top to the bottom at r = 1 of the figure, respectively. Thin full line: ϕ7(r). Dotted line: ϕ8(r). Dot-dash line: ϕ9(r). Full and open circles show ϕ1(1+), ϕ9(1+), ϕ8(1+), ϕ2(1+), ϕ3(1+) = ϕ7(1+), ϕ4(1+), and ϕ5(1+) from the top to the bottom of the figure. Here, 1+ = limε→0(1 + |ε|).
The thermodynamic properties of the models are obtained by using the SCOZA. We express the physical quantities by the same symbols used in Yasutomi [41], and the numerical computations are performed by using the same method described in Pini et al. [35, 41]. Tables 3, 4 show the density grid Δρ, the temperature grid Δβ, the density ρ0 at which we made use of the so-called high-temperature approximation [43], and βf; numerical computations are performed in the range of 0 < β < βf.
Table 3. Parameters used in numerical computations for Models 1–6.
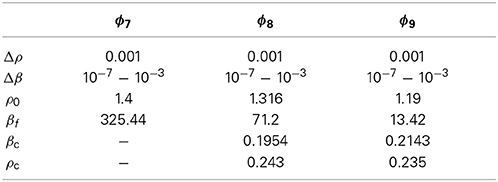
Table 4. Parameters used in numerical computations for Models 7–9.
We first present the numerical results for the HC-ϕ2(r) liquid (hereafter referred to as “Model ϕi” (i = 2) for simplicity) as a representative of the models that show the density anomaly. The pressure isotherms at kTc = 1.235, kT1 = 1.135, kT2 = 0.925, kT3 = 0.735, and kT4 = 0.543 of Model ϕ2 are shown by thin full lines in the P−ρ plane in Figure 2. The thick full line shows the binodal line, which has a critical point (ρc, Pc) = (0.2464, 0.0974) exhibited by the full circle and a maximum density ρ = 0.5633. The dot-dash line shows the spinodal curve, which has the largest density ρ = 0.3615 and a minimum pressure of P = −0.5196. It is found that for similar to normal substances, the pressure isotherms shift to lower pressure as the temperature is reduced in the range of T ≥ T4. The density ρi(P = const, Ti) in the liquid phase can be obtained from the intersection of the pressure isotherm at Ti with a line of constant P: for example, the dotted line of P = 0.063. Figure 2 shows that the density increases with reducing temperature at a specified P in the liquid phase, as in normal substances. We note here that the intersection point of each pressure isotherm in the liquid phase with the binodal line indicates the boiling point.
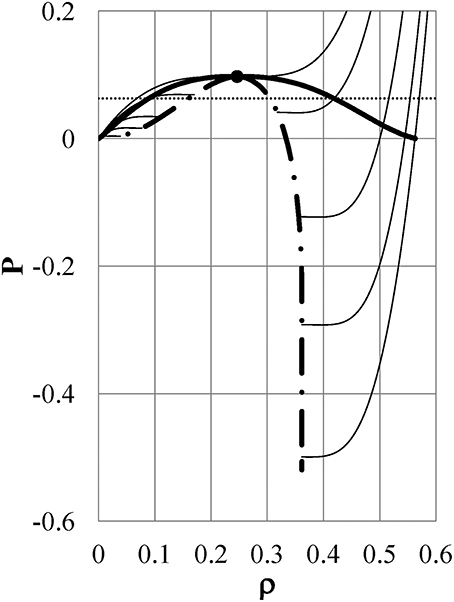
Figure 2. Pressure isotherms of Model ϕ2 in the P−ρ plane: Thin full lines: pressure isotherms at kTc = 1.235, kT1 = 1.135, kT2 = 0.925, kT3 = 0.735, and kT4 = 0.543 from the top to the bottom of the figure, respectively. Thick full line: binodal curve, which has a critical point (full circle) of (ρc, Pc) = (0.2464, 0.0974) and a maximum density ρ = 0.5633. Dot-dash line: spinodal curve, which has the largest density ρ = 0.3615, and a minimum pressure P = −0.5196. Dotted line: P = 0.063.
Figure 3 is the same as Figure 2 but at kT5 = 0.390, kT6 = 0.260, kT7 = 0.198, kT8 = 0.177, and kT9 = 0.160. The binodal line (thick full line) in the liquid phase has a maximum density ρ = 0.5633 and the lowest density ρ = 0.3615, which ends at the spinodal line. The spinodal line (dot-dash line: ρ = 0.3615) in the liquid phase has a minimum pressure of P = −0.5196. All isotherms and the binodal overlap with the spinodal on the scale of the figure for gas branches. Contrary to Figure 2, the pressure isotherms for liquid branches shift toward higher pressure with reducing temperature. As a result, the liquid expands to become less dense as it is cooled further in the range of kT < kT4 at a specified pressure. The behavior of the isothermal pressure-density curves shown in Figures 2, 3 is just what one can infer from the shape of the experimentally measured isobaric density-temperature curve of liquid water, which is exhibited in Figure 2 in Yasutomi [41] by open circles.
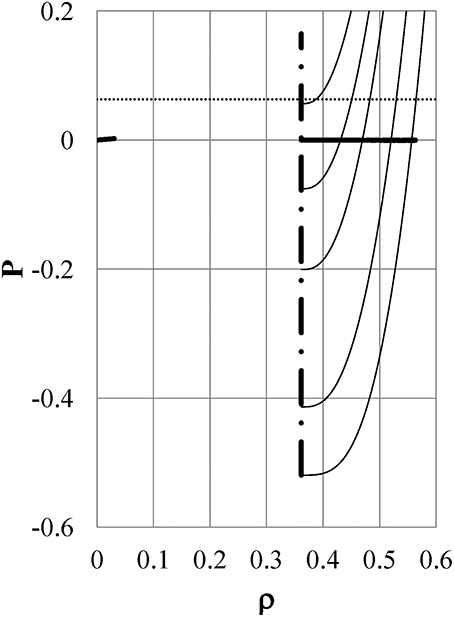
Figure 3. The same as Figure 2 but for kT5 = 0.390, kT6 = 0.260, kT7 = 0.198, kT8 = 0.177, and kT9 = 0.160 from the bottom to the top of the figure, respectively. The binodal line (thick full line) in the liquid phase has a maximum density ρ = 0.5633 and ends at the spinodal line. The spinodal line (dot-dash line : ρ = 0.3615) in the liquid phase has a minimum pressure P = −0.5196. All isotherms and the binodal curve overlap with the spinodal curve on the scale of the figure for gas branches.
The density-temperature curves for liquid branches at the critical pressure Pc = 0.0974 (dotted line) and P = 0.0341 (dashed line) in Figure 4 both show density anomalies. The intersection point of the dashed line with the binodal curve marked by the full circle indicates the boiling point at P = 0.0341.
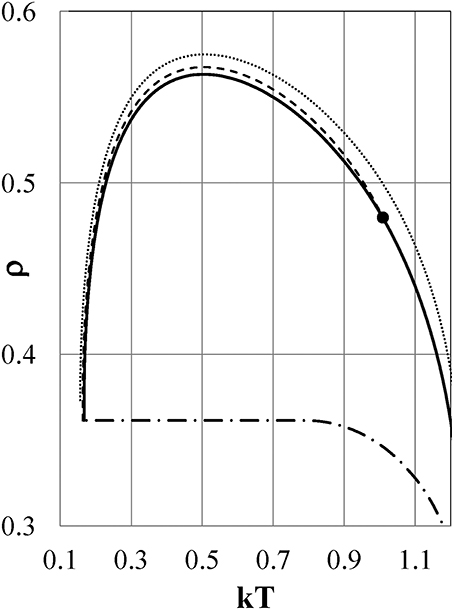
Figure 4. Density-temperature curves for liquid phase at specified pressures for Model ϕ2. Dotted and dashed lines: ρ−T curves at Pc = 0.0974 and P = 0.0341, respectively. Full line: binodal curve. Dot-dash line: spinodal curve. Full circle: the boiling point at P = 0.0341.
We next study what characteristics of the interparticle interaction cause the density anomalies or, equivalently, the pressure anomalies. Figure 5 shows the density as a function of temperature for Models ϕi (i = 2–5) at Pc = 0.0974, 0.1216, 0.1173, and 0.1025, respectively, by full lines. The isobaric ρ−T curves depend so weakly on the pressure that they are indistinguishable or very close to each other on the scale of the figure in the range of 0 < P < Pc.
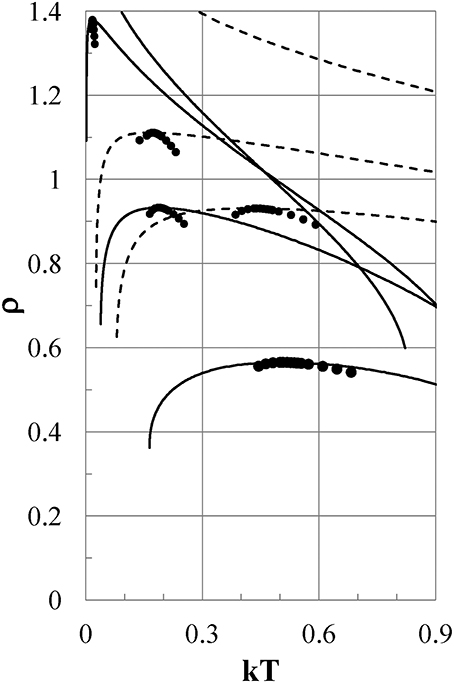
Figure 5. Density-temperature curves at Pc. Full lines are for Models ϕi (i = 2–5), and dashed lines are for ϕi (i = 9-7) from the bottom to the top of the figure, respectively. Pc = 0.0974, 0.1216, 0.1173, 0.1025 for Models ϕi (i = 2–5), and Pc = 0.384, 0.441, 0.571 for ϕi (i = 9–7), respectively. Full circles show experimental densities of liquid water at P = 1 bar.
All models except for Models ϕ1 and ϕ5 exhibit density anomalies, which are qualitatively induced by the same thermodynamic mechanism as that already shown for Model ϕ2. Model ϕ1 has only a gas phase and no liquid phase. In Model ϕ5, the density increases monotonically with reducing temperature and never exhibits negative thermal expansion.
Next, we examine the thermodynamic properties of Models ϕi (i = 7–9), whose attractive potentials are shifted to values lower than those of Models ϕi (i = 1–5) to study what the effects of such attractions are on the thermodynamic properties of the models as shown in Figure 1 by the thin full, dotted, and dot-dash lines, respectively. In Figure 5, the density as a function of temperature is shown for Models ϕ7, ϕ8, and ϕ9 by dashed lines at Pc = 0.571, 0.441, and 0.384, respectively. The ρ−T curves depend so weakly on the pressure that they are indistinguishable on the scale of the figure in the range of 0 < P < Pc. Models ϕ8 and ϕ9 show density anomalies, which are caused by the same qualitative mechanism as that in Model ϕ2. To the contrary, Model ϕ7 exhibits no density anomaly. As seen from Figure 1, both ϕ7 and ϕ3 have nearly the same soft repulsion, but the attractive part of ϕ7 is shifted to a value lower than that of Model ϕ3, which exhibits the density anomaly. It is clear that the difference in thermodynamic behavior between Models ϕ3 and ϕ7 is ascribed to the difference between the attractive parts of ϕ7 and ϕ3.
Thus, we can conclude that negative thermal expansion is exhibited when the value of ϕ(1+) of the potential tail at the hard-core contact is in some proper range that depends on the shape of the attraction; otherwise the negative thermal expansion is never observed. Here, 1+ = limε→0(1 + |ε|).
3. Thermodynamic Mechanism Underlying the Density Anomaly
The derivative of pressure P with respect to temperature T at a fixed density ρ is written as
where k is the Boltzmann constant and u is the excess internal energy per unit volume defined by
where g(r) is the distribution function. When the coefficient α is positive, the pressure increases with temperature as in usual substances as shown in Figure 2. To the contrary, when α < 0, the pressure increases with reducing temperature, and the pressure anomaly, or equivalently the density anomaly, occurs as shown in Figures 3, 4. Equation (2) shows that competition among u, ρ(∂u/∂ρ), and P determines the sign of α. The value of the pressure P is always positive and contributes to positive α. In contrast, u is able to become positive or negative depending on the value of ϕ(1+), as seen from Equation (3); at high density and low temperature, the distribution function g(r) has a positive large value at the hard-core contact, which makes u positive or negative depending, on the sign of ϕ(1+). The behavior of u determines ρ(∂u/∂ρ). In this way, the value of ϕ(1+) and the behavior of u play important roles in determining the sign of α at low temperature and high density.
The dotted lines in Figure 6 show the energy u as a function of density ρ at T(°C) = +20, +4, and −20 from the bottom to the top of the figure, respectively, for Model ϕ6, which is the same as Model ϕ5 in Yasutomi [41]. The function u shifts to larger values with reducing temperature, and it is accompanied by an increase in the term ρ(∂u/∂ρ). As a result, the function α shifts from positive to negative around ρ = 0.3 with reducing temperature as exhibited in Figure 7 by dotted lines at T(°C) = +20, +4, and −20 from the top to the bottom of the figure, respectively. These induce the pressure anomaly and result in the unusual negative thermal expansion similar to the case of Model ϕ2 as shown in Figures 2, 3.
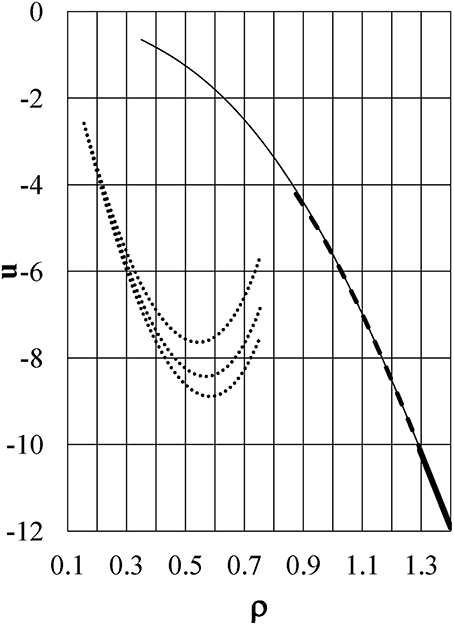
Figure 6. The excess internal energy u per unit volume as a function of density ρ. Dotted lines: u−ρ curves at T(°C) = +20, +4, and −20 from the bottom to the top of the figure, respectively, for Model ϕ6. Thin full, dashed, and thick full lines are for kTc = 0.896, kT = 0.372, and kT = 0.0324, respectively, for Model ϕ5.
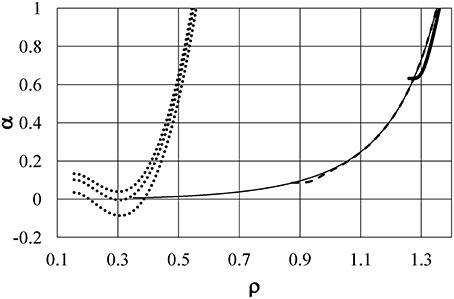
Figure 7. The differential coefficients α = ∂P/∂(kT) as a function of density. Dotted lines are at T(°C) = +20, +4, and −20 from the top to the bottom of the figure, respectively, for Model ϕ6. Thin full, dashed, and thick full lines are α/100 for kTc = 0.896, kT = 0.372, and kT = 0.0324, respectively, for Model ϕ5.
For comparison, the energy u and the coefficient α are also shown in Figures 6, 7, respectively, for Model ϕ5 by thin full, dashed, and thick full lines for kTc = 0.896, kT = 0.372, and kT = 0.0324, respectively. This model has no soft repulsion and has the smallest negative value of ϕ5(1+). It causes the energy u and ρ(∂u/∂ρ) to have small negative values at the largest density at low temperature to keep α positive at any temperature. This is the reason why the pressure anomaly, or equivalently negative thermal expansion, is never induced in Model ϕ5. Figure 6 shows the great difference in the behaviors of u between Models ϕ5 and ϕ6 and confirms that the behavior of the energy u plays an essential role in the density anomaly in liquids.
To study the behavior of the integrand f(r, ρ, T) = r2ϕ(r)g(r) in Equation (3), let us define Δf(r, ρ, T) as follows:
Figure 8 exhibits the difference Δf(r, ρ, T) as a function of distance r. Full and dashed lines show Δf(r, ρ0, +4°C) and Δf(r, ρ0, −20°C), respectively, where ρ0 = 0.7535. The figure shows Δf(r, ρ0, T) has a much larger value near the hard-core contact than in other regions, which can be shown to be true at any density. Therefore, the value and behavior of energy u (which induce the density anomaly of liquid water) are mainly determined near the hard-core contact where the pair potential has large positive values of the soft-repulsive potential.
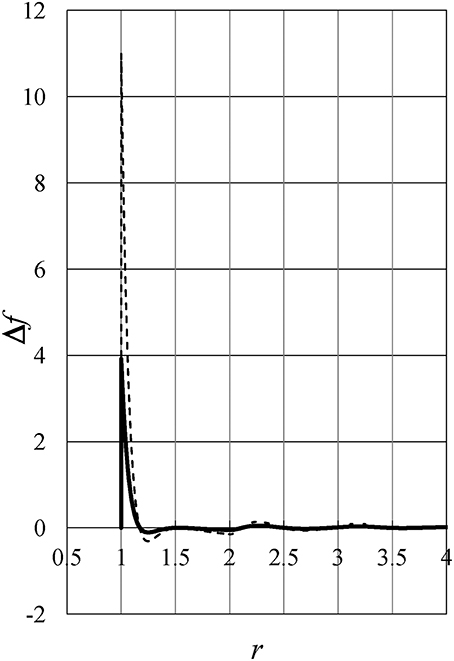
Figure 8. The difference Δf(r, ρ, T) as a function of distance r. Full and dashed lines show Δf(r, ρ0, +4°C) and Δf(r, ρ0, −20°C), respectively, where ρ0 = 0.7535.
4. Conclusions and Discussion
In our previous paper [41], we determined many functional representations of interparticle interactions between water molecules, all of which reproduce the experimentally measured density-temperature relation at 1 bar with an accuracy better than obtained by previous models. Numerous similar descriptions of pair interactions will be discovered in the coming years, which will help us to understand why solid water has polymorphic structures and why liquid water has a large number of anomalies. We also discussed the fact that nearly every idea put forward so far does not explain the immediate cause of the density anomaly of liquid water.
In the present paper, we illuminated the physics underlying the density anomaly of liquid water by using the thermodynamically self-consistent Ornstein-Zernike approximation (SCOZA). The SCOZA is known to describe the overall thermodynamics very well and provide a remarkably accurate critical point and coexistence curve. This scheme is entirely self-contained, that is, no supplementary thermodynamic or other input is necessary. We considered a fluid of spherical particles with a pair potential given by a hard-core repulsion and a tail. The tail is composed of a soft-repulsion and an attraction. Our scheme is one of the most optimum methods for clarifying the thermodynamic mechanism that induces the density anomaly of liquid water because it contains only the crucial physics that causes the density anomaly.
We showed that negative thermal expansion is exhibited when the value of the potential tail at the hard-core contact is in some proper range that depends on the shape of the attraction; otherwise negative expansion is never observed. Furthermore, we showed that the behavior of the excess internal energy plays an essential role in the density anomaly and is mainly determined by the values of the soft-repulsive potential, especially near the hard-core contact, and is very different from those of usual liquids that never show the density anomaly.
It is impossible to capture the crucial physics via the study of realistic models because these include many of the miscellaneous properties of water, and not all of them are relevant to explaining the immediate causes. Numerical results obtained by using a limited number of particles via a Monte Carlo method or molecular dynamics simulation occasionally show a mixture of less dense and denser regions of particles, and one result claims that a change in the proportions of these regions causes the density anomaly. Another, however, claims that such a mixture is never observed. At any rate, it is not known what thermodynamic mechanism causes a change in the proportions and results in negative thermal expansion.
Thermodynamic anomalies are found qualitatively even with purely repulsive tails. However, it still has not been shown that the tails can reproduce quantitatively the experimentally measured density anomaly of liquid water with sufficient accuracy.
As discussed in our previous work [41], the present results show that nearly all of the ideas that have been proposed, such as the second critical point hypothesis [44], a simple two-state model [1], the clathrate model [9], the network model [2], tetrahedral structure, and the orientation-dependent potential [21, 45–47] do not explain the direct cause of the density anomaly in liquid water [32]. It has long been pointed out that these ideas tell us nothing about what causes the negative thermal expansion at temperatures below 4°C. Let us argue that the orientation-dependent potential is not the immediate cause of the density anomaly in liquid water. The anisotropy of the potential is considered to come from hydrogen bonding or the electronic dipole-dipole interaction between two water molecules. These are attractive and are able to reduce the distance between molecules in thermodynamic equilibrium. Each molecule has a thermal motion around the equilibrium orientation that minimizes the potential. The thermal motion around the equilibrium orientation becomes small with reduced temperature. Therefore, it is impossible to consider that the dipole-dipole interaction or hydrogen bonding turns into a repulsive force below a certain temperature that causes a negative thermal expansion of liquid water. Instead, we believe that the ideas proposed up to now would be formed as a result of negative thermal expansion (see discussion below).
Recently, Russo and Tanaka [48] introduced a novel structural order parameter, which quantifies the degree of translational order of the second shell in water. They show that this parameter is extremely helpful and accurate in describing water properties, including the density anomaly. They used a two-state model to describe the behavior of liquid water over a wide region of the phase diagram. In one of the two states, denoted by S, local structures have low energies, high specific volumes, and low degeneracy. In contrast, structures in the other state, labeled ρ, are thermally excited and characterized by a high degree of disorder and degeneracy, low specific volumes, and high energies. However, the authors do not explain what causes the decomposition of water into the two states. We can explain the cause on the basis of the thermodynamic mechanisms described in Section 3 as follows. Cooling of water generates the higher density ρ state structures, makes their excess internal energies higher owing to the high value of the soft-repulsive potential near the hard core-contact due to condensation, and makes the coefficient α defined by Equation (2) negative, resulting in negative thermal expansion that generates the S state structures. In this way, we can understand that the decomposition of water into the two states is not the cause of the anomaly but just an accompanying effect.
Furthermore, no idea mentioned in the Introduction tells us anything about what induces negative thermal expansion. However, we can explain the cause in the same way as mentioned above. The cooling of water may generate denser proper-water complexes [1], a denser quartz-like structure [2], hydrogen bond bending [3], or the filling of cavities [8, 9]. It makes the excess internal energies higher because of the high value of the soft-repulsive potential near the hard core-contact due to condensation, and makes the coefficient α negative, resulting in negative thermal expansion that may generate less dense and ice-like complexes [1], less dense tridymite-like ones [2], stretching of the hydrogen bond bending [3], or preventing of the filling of cavities and causing negative expansion [8, 9].
Our results now enable us to consider that the thermodynamic mechanism we present induces negative thermal expansion, which is accompanied by rearranging of the orientations of molecules and results in polymorphic structures of solid water that depend on the shape of the orientation-dependent potential, or are accompanied by second critical point, two-state structures, or clathrate structures. In this way, although our study is blind to freezing and, more generally, to the solid phases of the system, it presents significant insights into the thermodynamic properties of water in these phases. We believe that there is a high possibility that our main remarks are applicable to density anomalies in other liquids.
We note here that for some of the isobars shown in Figure 5, the density of the maximum is very high (that of Model ϕ4 nearly coincides with close-packing), and likely to lie inside the region where fluid-solid coexistence or a solid phase is expected. In this case, the occurrence of the solid may preempt the density anomaly. However, this does not have any major influence on the present conclusions.
Finally, we note that all of the density anomalies shown for models with different tails here and in our previous work [41] are caused by the same thermodynamic mechanism we describe.
Conflict of Interest Statement
The author declares that the research was conducted in the absence of any commercial or financial relationships that could be construed as a potential conflict of interest.
References
1. Röntgen WC. Ueber die constitution des flüssigen wassers. Ann Phys. (1892) 281:91–7. doi: 10.1002/andp.18922810108
2. Bernal JD, Fowler RH. A theory of water and ionic solution, with particular reference to hydrogen and hydroxyl Ions. J Chem Phys. (1933) 1:515–48. doi: 10.1063/1.1749327
3. Pople JA. Molecular association in liquids. II. A theory of the structure of water. Proc R Soc Lond A. (1951) 205:163–78. doi: 10.1098/rspa.1951.0024
4. Bernal JD. The bakerian lecture, 1962. The structure of liquids. Proc R Soc Lond A. (1964) 280:299–322. doi: 10.1098/rspa.1964.0147
5. Sceats MG, Rice, SA. The water-water pair potential near the hydrogen bonded equilibrium configuration. J Chem Phys. (1980) 72:3236–47. doi: 10.1063/1.439560
6. Sceats MG, Rice SA. A random network model calculation of the free energy of liquid water. J Chem Phys. (1980) 72:6183–91. doi: 10.1063/1.439077
7. Rice SA, Sceats MG. A random network model for water. J Chem Phys. (1981) 85:1108–19. doi: 10.1021/j150609a009
8. Samoilov OY. A new approach to the study of hydrogen of ions in aqueous solutions. Discuss Faraday Soc. (1957) 24:141–6. doi: 10.1039/df9572400141
9. Pauling L. The structure of water. In: Hadzi D, Thompson HW, editors. Hydrogen Bonding. London: Pergamon Press Ltd (1959). p. 1–6.
10. Némety G, Scheraga HA. Structure of water and hydrophobic bonding in proteins. I. A model for the thermodynamic properties of liquid water. J Chem Phys. (1962) 36:3382–400. doi: 10.1063/1.1732472
Pubmed Abstract | Pubmed Full Text | CrossRef Full Text | Google Scholar
11. Stanley HE. A polychromatic correlated-site percolation problem with possible relevance to the unusual behaviour of supercooled H2O and D2O. J Phys A Math Gen. (1979) 12:L329.
12. Malenkov G. Liquid water and ices: understanding the structure and physical properties. J Phys Condens Matter. (2009) 21:283101. doi: 10.1088/0953-8984/21/28/283101
Pubmed Abstract | Pubmed Full Text | CrossRef Full Text | Google Scholar
13. Beveridge DL, Mezei M, Mehrotra PK, Marchese FT, Ravi-Shankar G, Vasu T, et al. Molecular-based study of fluids. In: Haile JM, Mansoori GA, editors. Advances in Chemistry, Vol. 204. Washington DC: American Chemical Society (1983). p. 297–351.
14. Jorgensen WL, Chandrasekhar J, Madura JD, Impey RW, Klein ML. Comparison of simple potential functions for simulating liquid water. J Chem Phys. (1983) 79:926–35. doi: 10.1063/1.445869
15. Jorgensen WL, Madura JD. Temperature and size dependence for monte carlo simulations of TIP4P water. Mol Phys. (1985) 56:1381–92. doi: 10.1080/00268978500103111
Pubmed Abstract | Pubmed Full Text | CrossRef Full Text | Google Scholar
16. Mahoney MW, Jorgensen WL. A five-site model for liquid water and the reproduction of the density anomaly by rigid, nonpolarizable potential functions. J Chem Phys. (2000) 112:8910–22. doi: 10.1063/1.481505
17. Berendsen HJC, Postma JPM, van Gunsteren WF, Hermans J. Interaction models for water in relation to protein hydration In: Pullman B, editors. Intermolecular Forces. Dordretch: Reidel (1981). p. 331–42. doi: 10.1007/978-94-015-7658-1/21
18. Berendsen HJC, Grigera JR, Straatsma TP. The missing term in effective pair potentials. J Phys Chem. (1987) 91:6269–71. doi: 10.1021/j100308a038
19. Stanley HE, Buldyrev SV, Giovambattista N, La Nave E, Mossa S, Scala A, et al. Application of statistical physics to understand static and dynamic anomallies in liquid water. J Stat Phys. (2003) 110:1039–54. doi: 10.1023/A:1022188608924
Pubmed Abstract | Pubmed Full Text | CrossRef Full Text | Google Scholar
20. Guillot B. A reappraisal of what we have learnt during three decades of computer simulations on water. J Mol Liquids. (2002) 101:219–60. doi: 10.1016/S0167-7322(02)00094-6
21. Molinero V, Moore EB. Water modeled as an intermediate element between carbon and silicon. J Phys Chem B. (2009) 113:4008–16. doi: 10.1021/jp805227c
Pubmed Abstract | Pubmed Full Text | CrossRef Full Text | Google Scholar
22. de Oliveira AB, Netz PA, Barbosa MC. An ubiquitous mechanism for water-like anomalies. EPL (2009) 85:36001. doi: 10.1209/0295-5075/85/36001
23. Gribova NV, Fomin YD, Frenkel D, Ryzhov VN. Waterlike thermodynamic anomalies in a repulsive-shoulder potential system. Phys Rev E. (2009) 79:051202. doi: 10.1103/PhysRevE.79.051202
Pubmed Abstract | Pubmed Full Text | CrossRef Full Text | Google Scholar
24. Fomin YD, Tsiok EN, Ryzhov VN. Inversion of sequence of diffusion and density anomalies in core-softened systems. J Chem Phys. (2011) 135:234502. doi: 10.1063/1.3668313
Pubmed Abstract | Pubmed Full Text | CrossRef Full Text | Google Scholar
25. Sadr-Lahijany MR, Scala A, Buldyrev SV, Stanley HE. Liquid-state anomalies and the stell-hemmer core-softened potential. Phys Rev Lett. (1998) 81:4895–8. doi: 10.1103/PhysRevLett.81.4895
26. Wilding NB, Magee JE. Phase behavior and thermodynamic anomalies of core-softened fluids. Phys Rev E. (2002) 66:031509. doi: 10.1103/PhysRevE.66.031509
Pubmed Abstract | Pubmed Full Text | CrossRef Full Text | Google Scholar
27. Gibson HM, Wilding NB. Metastable liquid-liquid coexistence and density anomalies in a core-softened fluid. Phys Rev E. (2006) 73:061507. doi: 10.1103/PhysRevE.73.061507
Pubmed Abstract | Pubmed Full Text | CrossRef Full Text | Google Scholar
28. Caballero JB, Puertas AM. Density anomaly and liquid-liquid transition from perturbation theories. Phys Rev E. (2006) 74:051506. doi: 10.1103/PhysRevE.74.051506
Pubmed Abstract | Pubmed Full Text | CrossRef Full Text | Google Scholar
29. Lomba E, Almarza NG, Martin C, McBridge C. Phase behavior of attractive and repulsive ramp fluids: integral equation and computer simulation studies. J Chem Phys. (2007) 126:244510. doi: 10.1063/1.2748043
Pubmed Abstract | Pubmed Full Text | CrossRef Full Text | Google Scholar
30. Jagla EA. Low-temperature behavior of core-softened models: water and silica behavior. Phys Rev E. (2001) 63:061509. doi: 10.1103/PhysRevE.63.061509
Pubmed Abstract | Pubmed Full Text | CrossRef Full Text | Google Scholar
31. Yan Z, Buldyrev SV, Giovambattista N, Stanley HE. Structural Order for One-Scale and two-scale potentials. Phys Rev Lett. (2005) 95:130604. doi: 10.1103/PhysRevLett.95.130604
Pubmed Abstract | Pubmed Full Text | CrossRef Full Text | Google Scholar
32. Yan Z, Buldyrev SV, Kumar P, Giovambattista N, Stanley HE. Correspondence between phase diagrams of the TIP5P water model and a spherically symmetric repulsive ramp potential with two characteristic length scales. Phys Rev E. (2008) 77:042201. doi: 10.1103/PhysRevE.77.042201
Pubmed Abstract | Pubmed Full Text | CrossRef Full Text | Google Scholar
33. Prestipino S, Saija F, Malescio G. Anomalous phase behavior in a model fluid with only one type of local structure. J Chem Phys. (2010) 133:144504. doi: 10.1063/1.3499830
Pubmed Abstract | Pubmed Full Text | CrossRef Full Text | Google Scholar
34. Malescio G, Prestipino S, Saija F. Anomalous melting and solid polymorphism of a modified inverse-power potential. Mol Phys. (2011) 109:2837–44. doi: 10.1080/00268976.2011.609146
35. Pini D, Stell G, Wilding NB. A liquid-state theory that remains successful in the critical region. Mol Phys. (1998) 95:483–94. doi: 10.1080/00268979809483183
36. Pini D, Stell G, Dickman R. Thermodynamically self-consistent theory of structure for three-dimensional lattice gases. Phys Rev E. (1998) 57:2862–71. doi: 10.1103/PhysRevE.57.2862
37. Schöll-Paschinger E. Self-consistent ornstein-zernike approximation for the sogami-ise fluid. J Chem Phys. (2004) 120:11698–711. doi: 10.1063/1.1755192
Pubmed Abstract | Pubmed Full Text | CrossRef Full Text | Google Scholar
38. Schöll-Paschinger E. Vapor-liquid equilibrium and critical behavior of the square-well fluid of variable range: a theoretical study. J Chem Phys. (2005) 123:234513. doi: 10.1063/1.2137713
Pubmed Abstract | Pubmed Full Text | CrossRef Full Text | Google Scholar
39. Betancourt-Cárdenas FF, Galicia-Luna LA, Benavides AL, Ramirez JA, Schöll-Paschinger E. Thermodynamics of a long-range triangle-well fluid. Mol Phys. (2008) 106:113–26. doi: 10.1080/00268970701832397
40. Yasutomi M. A self-consistent ornstein-zernike approximation for a fluid with a screened power series interaction. J Chem Phys. (2010) 133:154115. doi: 10.1063/1.3503590
Pubmed Abstract | Pubmed Full Text | CrossRef Full Text | Google Scholar
41. Yasutomi M. Interparticle interactions between water molecules. Front Phys. (2014) 2:64. doi: 10.3389/fphy.2014.00064
42. Prestipino S. On the accuracy of the melting curves drawn from modelling a solid as an elastic medium. J Phys Condens Matter. (2012) 24:035102. doi: 10.1088/0953-8984/24/3/035102
Pubmed Abstract | Pubmed Full Text | CrossRef Full Text | Google Scholar
44. Poole PH, Sciortino R, Essmann U, Stanley HE. Phase behaviour of metastable water. Nature (1992) 360:324–8. doi: 10.1038/360324a0
45. Chatterjee S, Debenedetti PG, Stillinger FH, Lynden-Bell RM. A computational investigation of thermodynamics, structure, dynamics and solvation behavior in modified water models. J Chem Phys. (2008) 128:124511. doi: 10.1063/1.2841127
Pubmed Abstract | Pubmed Full Text | CrossRef Full Text | Google Scholar
46. Wang Y, Wang Y, Breed RD, Manoharan NV, Feng L, Hollingsworth DA, et al. Colloids with valence and specific directional bonding. Nature (2012) 491:51. doi: 10.1038/nature11564
Pubmed Abstract | Pubmed Full Text | CrossRef Full Text | Google Scholar
47. Biffi S, Cerbino R, Bomboi F, Paraboschi ME, Asselta R, Sciortino F, et al. Phase behavior and critical activated dynamics of limited-valence DNA nanostars. Proc Natl Acad Sci USA. (2013) 110:15633. doi: 10.1073/pnas.1304632110
Pubmed Abstract | Pubmed Full Text | CrossRef Full Text | Google Scholar
48. Russo J, Tanaka H. Understanding water's anomalies with locally favoured structures. Nature (2014) 5:3556. doi: 10.1038/ncomms4556
Pubmed Abstract | Pubmed Full Text | CrossRef Full Text | Google Scholar
Keywords: liquid water, interparticle interaction, density anomaly, SCOZA
Citation: Yasutomi M (2015) Thermodynamic mechanism of the density anomaly of liquid water. Front. Phys. 3:8. doi: 10.3389/fphy.2015.00008
Received: 20 October 2014; Accepted: 09 February 2015;
Published online: 04 March 2015.
Edited by:
Gang Zhang, Institute of High Performance Computing (A*STAR), SingaporeReviewed by:
Roberto Cerbino, Università degli Studi di Milano, ItalyRui-Qin Zhang, City University of Hong Kong, China
Copyright © 2015 Yasutomi. This is an open-access article distributed under the terms of the Creative Commons Attribution License (CC BY). The use, distribution or reproduction in other forums is permitted, provided the original author(s) or licensor are credited and that the original publication in this journal is cited, in accordance with accepted academic practice. No use, distribution or reproduction is permitted which does not comply with these terms.
*Correspondence: Makoto Yasutomi, Department of Physics and Earth Sciences, Faculty of Science, University of the Ryukyus, Nishihara-Cho 903-0213, Japan e-mail: g800002@lab.u-ryukyu.ac.jp