Flow and fracture in water-saturated, unconstrained granular beds
 Germán Varas
 Gabriel Ramos
 Jean-Christophe Géminard
 Valérie Vidal
- 1Instituto de Física, Pontificia Universidad Católica de Valparaíso, Valparaíso, Chile
- 2Laboratoire de Physique, École Normale Supérieure - Centre National de la Recherche Scientifique, Université de Lyon, Lyon, France
The injection of gas in a liquid-saturated granular bed gives rise to a wide variety of invasion patterns. Many studies have focused on constrained porous media, in which the grains are fixed in the bed and only the interstitial fluid flows when the gas invades the system. With a free upper boundary, however, the grains can be entrained by the ascending gas or fluid motion, and the competition between the upward motion of grains and sedimentation leads to new patterns. We propose a brief review of the experimental investigation of the dynamics of air rising through a water-saturated, unconstrained granular bed, in both two and three dimensions. After describing the invasion pattern at short and long time, a tentative regime-diagram is proposed. We report original results showing a dependence of the fluidized zone shape, at long times, on the injection flow rate and grain size. A method based on image analysis makes it possible to detect not only the fluidized zone profile in the stationary regime, but also to follow the transient dynamics of its formation. Finally, we describe the degassing dynamics inside the fluidized zone, in the stationary regime. Depending on the experimental conditions, regular bubbling, continuous degassing, intermittent regime or even spontaneous flow-to-fracture transition are observed.
1. Introduction
A fluid (liquid or gas) crossing an immersed granular medium is a process widely encountered in nature, and often referred to as “venting.” It includes a large variety of phenomena such as methane venting [1], hydraulic fractures [2–4], pockmarks [5–7], hydrothermal complexes [8, 9], kimberlite pipes [10–12] or mud volcanoes [13–16]. Since the 90's, the technique of air sparging has also been developed. It consists of injecting gases into the saturated zone in the subsurface, in order to remove water contamination by volatile compounds [17–21]. Understanding these processes is important not only for economy and ecology, but also for the mitigation of natural hazards. Indeed, quick fluidization due to fluid venting is often associated with catastrophic events such as soil liquefaction [22], volcaniclastic events [10, 11] or, at a larger scale, global warming [23, 24].
Many studies have been performed in two-phase systems to analyze the mechanisms at play in the fluid venting process, either for dry (gas/grains) [25, 26] or wet (liquid/grains) [16, 22, 27, 28] beds. For unconstrained beds, where the grains are likely to move and their free surface to deform, different patterns have been thoroughly described when changing the fluid injection flow-rate, Q, in the granular matrix. For low flow-rate, the grains remain at rest and the fluid percolates the medium—as a rigid porous medium. For intermediate Q, the granular bed deforms and develops instabilities and microchannels, but the macroscopic flow-rate still obeys Darcy's law. Finally, for high flow-rate, the sample exhibits hydraulic failure, with pipe formation leading to a partial liquefaction of the system [16, 22, 27, 28]. However, many natural phenomena involve a three-phase flow. Typical examples are gas discharge by submarine mud volcanoes [29], or pockmarks [6]. In both cases, gas escapes from a saturated granular matrix—seafloor sediments for pockmarks or dense particle suspension for mud volcanoes. Extensive modeling for gas injection in a saturated, rigid porous medium has been performed in the last 20 years, both with and without the presence of heterogeneities in the system (see for instance [2, 30–35], a tentative phase diagram by Geistlinger et al. [36], and references within). When the medium is deformable, however, complex patterns may arise from the interaction between the fluid flow and the grains motion [37, 38]. In particular, in the dense regime, frictional contacts play a central role, and govern the macroscopic behavior of the granular bed.
Laboratory experiments are ideal tools to investigate the parameters governing the complex dynamics of three-phase systems. In the recent years, a thorough description of the patterns and hydrodynamic regimes have been reported for systems where gas is injected in a saturated granular medium. For injection at a fixed overpressure and grain compacity in a quasi-bidimensional (Hele-Shaw) cell, a transition has been reported between the viscous and frictional regimes [39], or between a Saffman-Taylor instability, dense suspension fracturing and fingering in a fixed porous medium [40]. When the compacity is not constrained, and the cell gap varies, more regimes can be found, exhibiting a strong coupling between the fluid and grain flows, as well as an expansion and fluidization of the granular bed [41]. Gravity, however, did not play a strong role in these systems, consisting mainly of a horizontal Hele-Shaw cell.
In this work, we investigate the dynamics of buoyancy-driven, unconstrained, three-phase systems. First, we summarize previous results describing the different regimes when air is injected at the bottom of a vertical Hele-Shaw cell filled with a granular material immersed in water [18, 21, 37, 38, 42–44], and propose a tentative regime diagram. As already reported in the literature, the fluidized zone exhibits a parabolic shape, in the stationary regime, for most of the experimental parameters. However, contrary to previous results, we report a dependence of this shape on the air injection flow-rate and grain size, for larger grains. In addition, the final shape departs from the classical parabola for the largest grains. After a brief description of the transient, we focus on the air dynamics inside the fluidized zone, in the stationary regime. We propose a regime diagram for 3D systems, and report a peculiar flow-to-fracture transition in the 2D cell. Finally, we discuss the dimensionless numbers previously introduced in the literature, predicting the dynamics of the system. We underline the major role played by the polydispersity in the invasion process.
2. Materials and Methods
The experimental setup (Figure 1) consists of a 3D cell (plexiglas cylinder, 7.4 cm in diameter) or 2D vertical Hele-Shaw cell (glass plates 40 × 30 cm, gap 2 mm). The cell is filled with spherical glass beads (USF Matrasur or Wheelabrator), sieved to achieve typical diameter ranges from 200–250 μm up to 710–965 μm (the grain diameter ranges are given for each result in the next sections). For each batch, we systematically measure the grain size distribution by means of a microscope. Typically, a thousand grains are considered for each batch, and the grain size distribution is fitted by a gaussian, which fairly accounts for the shape of the distribution for most grain batches. The central value provides the typical grain diameter, d, whereas the standard deviation quantifies the typical size dispersion. Measurements are given in Table 1 for the grains used in the 2D experiment. Note that in the following, we refer either to the grain batch (e.g., “250–425 μm”) or to the typical grain size (e.g., “318 ± 44 μm”). The granular layer is immersed under water. In the 3D experiment, we stir the grains vigorously with a paddle to remove the gas bubbles trapped in the bed. In the 2D experiment, the cell is completely filled with water, then closed and turned upside-down. Right before a total sedimentation, it is flipped back to its original position, and the water is removed up to a given height. The free surface of the grains is then smoothed gently with a thin pole (in 2D) or a squegee (in 3D). hg denotes the grain layer height, and hw the water layer height above the grains free surface, respectively (Figure 1). In all the experiments, hw ~eq 2 cm, small enough to avoid grain advection over large distances in the water layer, and the subsequent crater formation at the bed free surface [45].
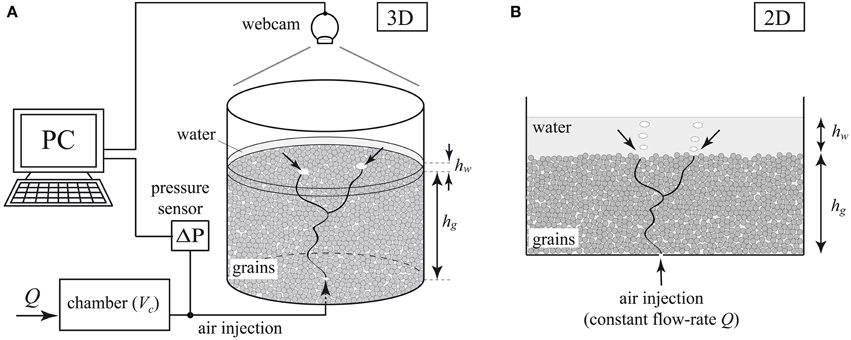
Figure 1. Experimental setup, 3D (A) or 2D (B). Air is injected at constant flow rate, Q, through a nozzle at the base of the immersed granular bed, via a dry chamber (volume Vc). Direct visualization from top (3D) or side (2D) is achieved by means of webcams. In some experiments, we can monitor simultaneously the overpressure ΔP in the chamber, which provides indication on the system dynamics.
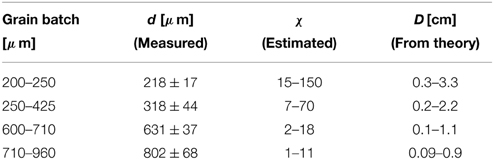
Table 1. Grain size and theoretical predictions for the characteristic length D describing the extension of the fluidized zone (2D experiment).
Air is injected at constant flow-rate, Q, into a dry chamber (volume Vc), connected to a nozzle of inner diameter 1 mm, localized at the bottom center of the cell. The constant flow-rate is set either by means of a valve and capillary tube (1.5 ≤ Q ≤ 4.3 mL/s) or with a mass-flow controller (Bronkhorst, Mass-Stream Series D-5111, 0.17 ≤ Q ≤ 3.3 mL/s). In some experiments, the pressure variations in the chamber is also monitored with a pressure sensor (MKS Instruments, 223 BD-00010 AB) connected to an acquisition board (National Instruments, PCI-6251), with a sensitivity of about 10 Pa. Illumination of the surface (in 3D) or the bulk (in 2D) is achieved with a transparency flat viewer (Just NormLicht, Classic Line) or with an array of LED lights, which ensure a homogeneous light. Images are recorded by a webcam (Logitech QuickCam Express, 2D experiment and Logitech QuickCam S7500, 3D experiment) or by a camera PixeLINK, model PL-B741U, 1280 × 800 px2. Continuous or time-lapse acquisition is performed to capture either the quick degassing dynamics or the evolution of the system over long time-scales, by means of either a free software (Astra Image Webcam Video Grabber), or the PixeLINK camera software. The images are then analyzed with Matlab (MathWorks®).
3. Results
3.1. Invasion Patterns
3.1.1. Tentative Regime Diagram
First, we focus on the 2D experiment, which makes it possible to directly visualize the air patterns in the immersed granular bed. At short times, two different invasion patterns are observed, depending on the injected flow-rate Q. At low flow-rate, the pressure and/or buoyancy in the system is not enough to lift the grains and the air percolates the immersed granular layer, without moving significantly the grains (Figure 2, bottom left picture). The pattern develops several branches, which can reach the surface. The pressure loss in the percolating channels is much larger than the pressure drop associated with a bubble emission at the surface. Consequently, we can observe simultaneous bubble emissions at the free surface. At high flow-rate, a fracture opens, which propagates quickly toward the surface (Figure 2, top left picture). The side branches of this pattern are less pronounced, as the upper fracture tip always propagates at a larger speed, due to the strong vertical pressure gradient between the finger tip and the free surface. When reaching the surface, the bubble emission generates a large pressure drop in the fracture, and a subsequent collapse of its walls. Under continuous injection, another fracture opens, not necessarily following the same path.
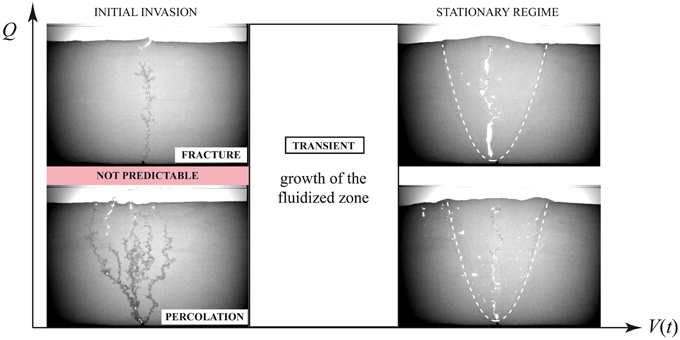
Figure 2. Tentative regime diagram of the invasion pattern dynamics as a function of the injected flow-rate, Q, and the total volume of gas V(t) which has crossed the system at time t. The light red zone indicates the region where the initial invasion regime (percolation or fracture) cannot be predicted [images from the grain batch 250–425 μm, hg = 22 cm, hw = 2 cm, Q = 0.43 mL/s (bottom images) and Q = 2.17 mL/s (top images); the white dashed lines indicate the fluidized zone boundary].
It is interesting to note that the transition between percolation and fracture, at short times, is not clearly defined. Indeed, for a given range of intermediate Q, it is not possible to predict the invasion pattern. This indetermination, already reported in Varas et al. [44] with a tilted experimental cell, is due to the local heterogeneities in the system. Indeed, both the polydispersity of the grains batch and the layer preparation (resulting in different local packing fraction) make the system slightly different from one experiment to the other, although the grains sample and the global packing fraction are the same.
At long time (typically, between a few hours and a few tens of hours, depending on the flow-rate), a fluidized zone is formed at the center of the cell [38], clearly visible in the 2D Hele-Shaw cell (Figure 2, right). Although it is not possible to visualize it directly in the 3D experiment, mapping the air location at the free surface of the granular layer also provided a good description of the region invaded by the air, as a function of the bed height [42]. For most experiments, the stationary shape of the fluidized zone is a parabola. This parabolic shape has already been described in the literature [17, 21, 37, 46], although for many years a cone-shape invasion zone has also been reported [17]. More recent works have pointed out the robustness of the parabolic shape, whichever the initial invasion regime, i.e., whichever the injection flow-rate, both in 2D and 3D experiments [42–44]. Based on these results and our experiments, we propose the tentative diagram displayed in Figure 2, where for a given immersed granular bed, the state of the system will be mainly governed by the injection flow rate, Q, as well as the volume of gas V(t) which has crossed the grain layer at time t.
A simple analytical model can account for the final parabolic shape [42] and its independence on the flow rate. It points out that the dynamics of the system is governed by a single dimensionless parameter:
where ρ is the water density, g the gravitational acceleration and d the typical grain diameter; σp is the width of the distribution of the capillary overpressures in the system. In other words, the parameter χ compares the width of the distribution of the capillary overpressure associated with the passage of air between the immersed grains, σp, to the typical hydrostatic pressure variation over the grain size, ρgd. The width of the distribution of the capillary overpressure in the system can be written σp ~ wγ/d, where w is the typical relative variation of the pores size and γ is the air-water surface tension. Therefore,
The geometry of the air paths in the system are well-reproduced by a 2D numerical model [43], which captures both the branches morphology as a function of the parameter χ, and the typical contour of the region invaded by the gas. For a given batch of grains, when the parameter χ increases, the air path extends laterally and the typical contour of the invaded region widens. We do not detail here these results that are thoroughly discussed in previous articles [43, 44]. In Section 4, we further discuss the parameter χ and compare it to the classical Bond and modified Bond numbers, previously introduced in the literature to describe the dynamics of fluid invasion in porous media.
3.1.2. Dependence on Q and d
The experiments reported in this article explore a larger range of grains diameter than in former studies. In order to detect precisely the contour of the fluidized zone, we propose a new method based on the global tracking of motion in the system, for the 2D experiment. We consider the absolute difference in the intensity of two consecutive images, Mk = |Ik + 1 − Ik|. The matrix Mk can contain either zero (no motion) or non-zero elements, the latter corresponding to regions where a motion occurred in the system—due either to air or grain motion. The generation of the fluidized zone can be seen as a cumulative process due to the continuous emission of gas through the system. Therefore, its dynamics is generally slow, and requires to accumulate information over time to enhance the contrast and detect correctly its contour. We define the flow density, ρn(x, z), as the sum of consecutive image differences Mk:
The normalized flow density, ρ = ρn/max(ρn), provides a quantification of the average motion in the granular bed. The contour of the fluidized zone is then determined by imposing a low threshold value, typically ρ < 0.1, which makes it possible to detect the boundary between the outer zone, where the grains do not move significantly, and the central fluidized zone.
Figure 3 displays the flow density for all the grain diameters and flow rates used in our experiments (16 experiments in total, one final flow density image per experiment). For almost all experiments, the stacking of successive image difference was performed over 4000 images (time interval between successive images Δt = 10 s, see legend in Figure 3). Note that it does not represent an equal total volume crossing the medium for the different flow rates, but rather a similar experiment duration. Once the system is in stationary regime, the time over which the images stacking is performed does not change much the result—the longer the time, the better the contrast, but the contour of the fluidized zone (FZ) remains the same. Interestingly, when the grain size is increased (typically, for d > 250 μm), the contour of the fluidized zone becomes slightly dependent on the flow-rate Q. For the largest grain size (d = 710–965 μm), no fluidized zone is formed at all for the lowest flow rate (see bottom left picture, Figure 3). This can be explained by the fact that for larger grains, the pore size increases, which favors percolation of the granular bed by the air. In that case, it is harder to trigger the grain motion and at low flow-rate, the medium resembles a rigid porous medium.
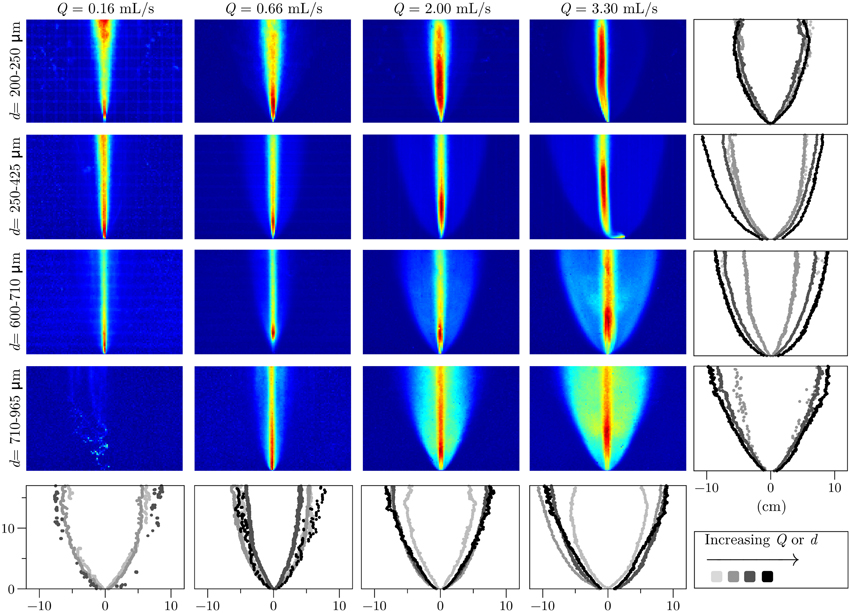
Figure 3. Normalized flow density, ρ, for all the parameters used in our experiments. Each flow density image displayed here corresponds to one experiment (16 experiments in total) [hg = 17 cm, stacking over 4000 images (all except the bottom-left flow density image) or 8000 images (bottom-left density image), Δt = 10 s between successive images]. The color ranges from 0 (dark blue) to 1 (dark red). Right and bottom: Fluidized zone boundary [threshold ρ = 0.1, light gray to black: increasing Q or d]. Note that for the large grains (d = 710–965 μm), no fluidized zone is formed at low flow rate (Q = 0.16 mL/s).
Previous studies have described the fluidized zone (FZ) parabolic contour by the equation |x| = , where D can be seen as the analog of a diffusion coefficient—here, D is a characteristic “diffusive” length [42]. Typically, in similar experiments, D was found of the order of 4 cm [44]. Figure 4 displays an example of how to extract D from the experimental data. In Figure 4A, the (x, z) FZ profile is shown for the grain batch 250–425 μm, and a flow-rate Q = 0.16 mL/s. The FZ contour is obtained by considering a threshold value for its boundary, here ρ = 0.1. The horizontal distance to the injection point at the center, |x|, is then displayed as a function of for both the right and left FZ contour (Figure 4B), and a linear fit gives the value of D. Note that the determination of D excludes a small region close to the air inlet (z < 2 mm), and just below the free surface (z > 12 cm). Indeed, in these regions, boundary effects are observed (blue regions, Figure 4). The coefficient D is then calculated for all experiments.
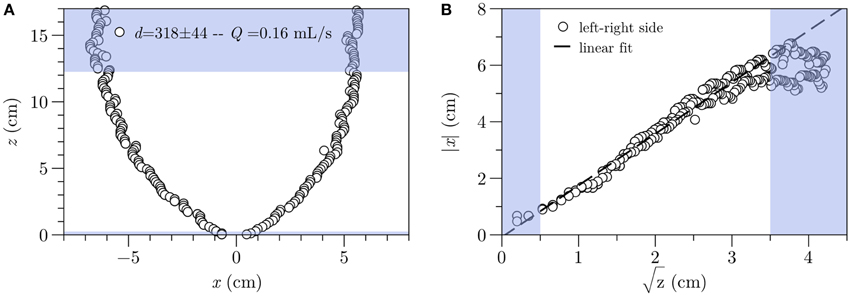
Figure 4. Determination of the coefficient D characterizing the parabolic shape of the fluidized zone, |x| = [grain batch 250–425 μm, corresponding to a typical grain size d = 318 ± 44 μm, estimated with a gaussian fit (see text); Q = 0.16 mL/s]. (A) Automatic contour detection from the normalized flow density images shown in Figure 3 [threshold ρ = 0.1]. The lower (z < 2 mm) and upper (z > 12 cm) zones (in blue) are excluded for the following fit, to avoid boundary effects (mainly close to the surface). (B) Linear fit of the experimental data, |x| as a function of [same data than (A)]. The right and left sides of the fluidized zone are superimposed, and a single fit is performed. We only take into account the experimental points in the central, white region. The parabola coefficient, D, is directly extracted from the slope—here .
The results are displayed in Figure 5. Note that the grain sizes displayed in the figure correspond to the typical grain sizes (and standard deviations) found from the gaussian fit of the grain size distributions corresponding to each batch (see Section 2 and Table 1). For smaller grains (batch 200–250 μm), D ~ 3–4 cm and no significant variation is found as a function of the flow-rate (Figure 5A), in agreement with previous results [44]. Note that it is difficult to interpret the value of D for very low flow-rate (Q < 0.5 mL/s). Indeed, in that case, the air invasion is mainly percolation and no clear grain motion is observed in the fluidized zone, even over long time-scale. Nonetheless, up to grain size of about 700 μm, the flow density images, obtained by stacking the successive image differences, displays a parabolic contour (Figure 3). For the large grains, however, no parabolic region is observed over the experimental observations—in that particular case, the stacking was performed up to 8000 images, corresponding roughly a 22 h experiment (Figure 3, bottom left flow density image). For these parameters, therefore, the coefficient D is undetermined.
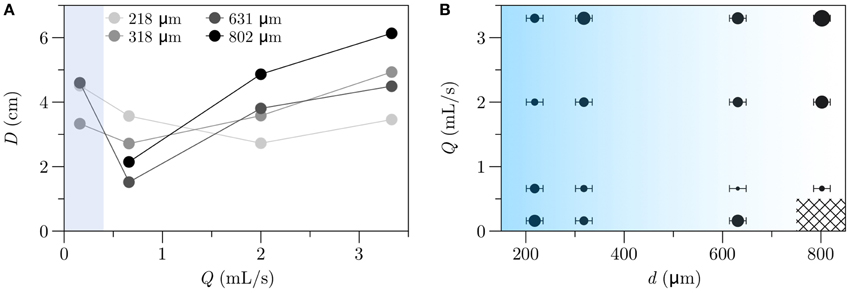
Figure 5. (A) Coefficient D as a function of the injection flow-rate, Q, for different grain size (only the average grain size is indicated here). (B) Diagram of the parabolic contour determination (coefficient D) as a function of the governing parameters, the injection flow-rate Q and the grain size d. The marker size is proportional to D, and the horizontal error bar indicates the grain size standard deviation for each batch. The blue shade indicates a transition between a dynamics governed by a homogeneous grain convection in the fluidized zone, for small grains (d < 425 μm) to a more complex regime where the fluidization is heterogeneous, and intermittent, lateral fracture is observed in the fluidized zone (d > 600 μm). The hatched zone corresponds to parameters for which no fluidized zone formation was observed over the experimental time.
For larger grain size (d > 250 μm) and larger flow-rate (Q > 0.5 mL/s), we report an increase of the fluidized zone extension as a function of the flow-rate (Figure 5A). Table 1 gives the range of χ and D expected from the theory, by using Equation (2) and D ~ dχ as given by numerical simulations [43]. For a granular bed made of polydisperse grains, w is usually of the order of the relative width of the size distribution [42]. This value, however, is difficult to quantify precisely, and may strongly vary from one batch to the other. We consider here a typical relative variation of pore sizes ranging between w = 0.1 to 1. The upper limit of D expected from the theory is of the order of the experimental observations at low flow-rate (Q < 1 mL/s). Note that, for Q = 0.66 mL/s, we observe a widening of the fluidized zone (increase of D) when the grain size decreases, as predicted by the model with similar w for all batches. Variations of w depending on the grain batch may explain the value of the coefficient D larger for d = 710–960 μm than for d = 600–710 μm. For other flow-rates, no clear dependence is observed as a function of the average grain size. The dependence on the flow-rate is not predicted by the model.
Figure 5B summarize the results in the (d, Q) phase diagram, where the marker size is proportional to the value of D. Although a parabolic contour is always observed in the flow density images (except for the larger grains and lower flow-rate), it is interesting to note that the dynamics in the granular bed varies a lot. For small grains (typically, d < 425 μm), in the stationary regime, the fluidized zone is characterized by two convection rolls, which entrain the grains upward in the central zone (together with the air crossing the layer), and downward on both sides. The fluidization, and thus the overall motion in the FZ, is homogeneous. However, for larger grains (d > 600 μm), a more complex dynamics is observed. The fluidization is heterogeneous, with lateral fracture opening intermittently—which explains the increase in the flow density value inside the central zone (see for example Figure 3, bottom right image). In that case, a local fluidization, limited to a region right above the injection point (typically, a couple of centimeters), is observed, while the motion above mostly happens either through percolation, or intermittent fracture opening. This dynamics strongly resembles the formation of a “fluidized cavity” reported by Philippe and Badiane [47], who injected liquid in liquid-saturated grains (two-phase system), with grain size above 3 mm. The transition between a fluidized zone dynamics mainly governed by grain convection, or a local fluidization plus percolation and fracture above, is not clear, and would require a more detailed study. It is indicated qualitatively by the blue shade in Figure 5B.
3.2. Transient Dynamics: Growth of the Fluidized Zone
After having characterized the properties of the fluidized zone in the stationary regime, we briefly describe its formation in the 2D experiment. For grain size of 250–425 μm, Varas et al. [44] have shown that the fluidized zone develops from the free surface, and grows downward until reaching the injection nozzle. The authors reported a logarithmic growth of both the horizontal and vertical extent of the fluidized central region. For larger grains (d = 400–600 μm), Kong et al. [38] pointed out the existence of a threshold flow-rate, above which the fluidized region indeed grows from the grains free surface, and reaches the orifice—in that case, the authors state that the fluidization region accesses the whole region initially explored by the tree-like percolation pattern. Below this threshold flow-rate, the fluidization stops “somewhere between the top of the packing and the orifice.” The precise motion, however, is difficult to detect on the direct images, and has to be guessed from the accelerated movie of the experiment (see for instance Figure 5A of Varas et al. [44]). The flow density determination, as described in Section 3.1, makes it possible to clearly observe the transient dynamics of fluidized zone formation (Figure 6).
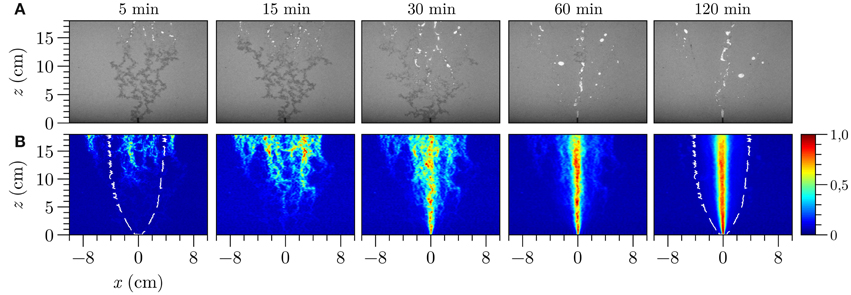
Figure 6. Formation of the fluidized zone [Q = 0.66 mL/s, d = 250–425 μm]. (A) Direct images from the experiment. (B) Normalized flow density ρ obtained by stacking successive image differences from the beginning of the experiment up to the time indicated above each image. The white dashed line indicate the contour of the fluidized zone, found by using the threshold ρ = 0.1 in the final image.
At short time, it is interesting to note that the motion is not limited to the later fluidized zone contour, but extends to a wider region, mostly close to the surface. This is due to the formation of microchannels or instabilities close to the free surface, when the air explores the system at the beginning of the injection. Later on, the motion concentrates in the central zone, until being exclusively limited to this latter. The large motion at the center is due to the repetitive air rise, which does not explore anymore a wide region, but behaves as air rising in a fluid—the central region can then be assimilated to a liquid-like granular suspension. Note that this behavior is observed only for grain diameter below 425 μm (see above section).
In the following section, we will focus on the dynamics of air crossing the fluidized zone, in the stationary regime.
3.3. Degassing in the Stationary Regime
3.3.1. Bubbles or Channels?
Few experiments have previously reported the dynamics of gas rising in an unconstrained, saturated porous medium, although the different patterns for rigid porous media have been thoroughly discussed in the in-situ air sparging (ISAS) literature [48]. In sand-sized porous media, Ji et al. [46] reported experimentally that gas formed channels rather than discrete bubbles or percolation (dendritic) networks. The formation of air channels, as well as their migration, in unconstrained media has been described by Kong et al. [37] in grains saturated with a glycerine-water solution. A later work by the same authors evidenced the existence of a meandering single channel, at the center of the fluidized zone [38]. This irregular, oscillating channel is formed by “several discrete elongated bubbles […] driven by their buoyant forces.” In a first attempt to characterize better the air dynamics through the fluidized region, we analyzed the signal monitored by the pressure sensor, close to the injection nozzle, in the 3D experiment (Figure 1A). Two different signals are registered. For low flow-rate, the pressure signal exhibits a sawtooth shape, characteristic of successive pressure increase, followed by bubble emission, which triggers a sharp pressure drop (Figure 7A, up). For higher flow-rate, bubble emission is still observed (sawtooth-shaped signal), but from time to time, the pressure remains at a constant value (Figure 7A, down). This is the signature of a channel, opening from the injection nozzle through all the granular layer, and emitting air continuously through the bed [49]. The pressure value in this state can vary, depending on the pressure loss in the channel, and can exhibit slow temporal variations, if the channel remains open for a long time (up to a couple of minutes in our experiments). After a time ranging from less than a second up to a couple of minutes, the channel collapses and the bubbling regime restarts. In this regime, channels formation and collapse are observed intermittently. This dynamics strongly resembles the degassing dynamics, in the same experimental conditions (constant injection flow-rate), through a layer of shear-thinning, viscoelastic fluid [50–52].
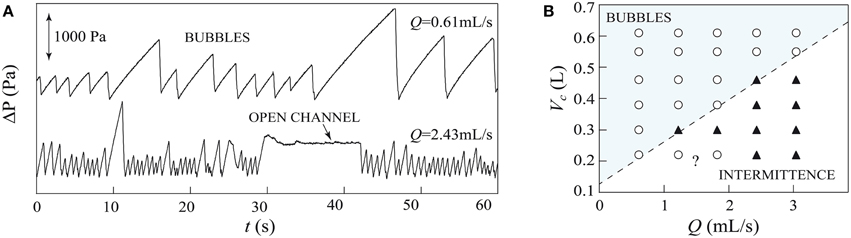
Figure 7. Different degassing regimes through an immersed granular layer [3D experiment, d = 315–400 μm, hg = 2 cm, hw = 10 cm]. (A) For low flow-rate, successive bubbles cross the medium; for high flow-rate, we report an intermittence between the bubbling and the open channel regime. (B) Regime diagram when varying the chamber volume Vc and the flow-rate Q [○ = bubbles, ▲ = intermittence]. The dashed line indicates the transition between the two regimes. Due to the finite acquisition time (1 min), it is sometimes difficult to infer the boundary with precision.
In Figure 7B, we propose a regime diagram summarizing the behavior of the system depending on the injection flow-rate, Q, and also the volume of the chamber, Vc in which the air flows before entering the nozzle at the bottom of the experiment (see Figure 1A). Note that Vc includes all the air volume between the gas flow controller and the injection point, and therefore takes into account the volume of the pipes which bring the air at the cell bottom. In most experiments (as in the 2D experiment presented in this work), there is no chamber in the system, but the tube length (in our case, about 0.03 mL in total) should be specified, as it may influence the degassing dynamics. Small Vc tend to favor an intermittent degassing regime, while large Vc favor the bubbling regime. This graph points out the importance of this parameter, often neglected or which value is not specified in similar experiments—although all experiments have injection tubes whose volume should be carefully determined.
3.3.2. Fingering and Fracturing
The previous determination of the bubble vs. intermittent regime is based on pressure signal analysis only. Indeed, in the 3D experiment, it is not possible to visualize directly the air pathway(s) through the immersed granular bed. In this last part, we report qualitative observations of a new regime, in the 2D experiment. For the smaller grains (d < 425 μm), in a given range of flow-rate, a peculiar dynamics was observed in the stationary regime, inside the fluidized zone (Figure 8). In that case, an air finger grows vertically, until reaching a critical height h*. Its velocity decreases up to this height. It then stops, but as continuous air flow-rate is injected to the system, the pressure increases in the finger, until the air suddenly fractures the above grain layer.
The transition height h* between the fingering and fracturing dynamics is quite reproducible over time, as the air crosses the system. It is interesting to note that it coincides with a maximum in the normalized flow density ρ, computed in the stationary regime (Figure 8, right). We are not able at present to provide an explanation for this spontaneous change of dynamics, which shall be at the center of a future work.
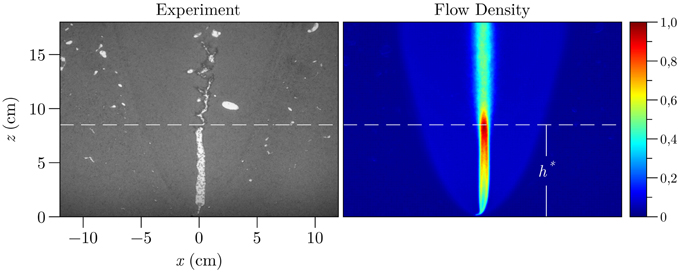
Figure 8. Transition from an invading finger, and the fracturing of the above granular layer [hg = 17 cm, hw = 2 cm, d = 250–425 μm, Q = 2 mL/s]. Left: Direct image showing the transition. Right: Normalized flow density ρ in the stationary regime, pointing out the coincidence between the fingering-to-fracturing transition, at height h*, and the zone exhibiting the maximum of motion [stacking over 2000 images].
4. Discussion and Conclusions
A thorough description of two-phase flow patterns (gas-liquid) when injecting gas in a rigid, saturated porous medium has been provided in the literature (see for example [48], [21] and references within). These patterns—air bubbles, percolation networks or air channels—mainly depend on the grain size, and prediction attempts have been made by the in-situ air sparging (ISAS) community. Typically, bubbles are characteristic of water-filled media with pore size greater than about 4 mm, air channels form when the pore size is smaller than 0.5 mm, and dendritic invasion takes place for intermediate grain size [21]. Based on the Uniform Soil Classification System [53], which provides a classification of the different types of soils—in particular, their average size—the transition zone happens for the medium to coarse sands, making it possible to roughly predict the gas patterns in a given soil.
To account for the physical mechanisms at stake when considering three-phase, buoyancy-driven systems—in particular, the invasion of a non-wetting fluid into a wetting-fluid in a saturated porous medium under the influence of gravity, we have to consider the relative importance of the dominant forces in the system, i.e., buoyancy and capillary forces. The Bond number, also called Eötvös number, has been used traditionally to characterize multiphase flow in porous media, and is defined as the ratio between gravity over capillarity forces:
where Δρ is the density difference between the liquid and gas, g the gravitational acceleration, rp the characteristic pore size and γ the liquid-gas surface tension. However, the pore size rp cannot account simultaneously for the largest buoyancy and the largest capillary overpressure to be overcome for the air to propagate in the system. Indeed, the largest capillary overpressure is governed by the narrowest interstice between grains, while the largest buoyancy force is given, at the contrary, by the wider pore space. Brooks et al. [48] proposed to introduce a modified Bond number, which compares the buoyancy forces in the so-called pore body (size rb), to capillary forces in the pore neck (size rn):
where α = rn/rb is the ratio of the pore neck size to pore body size, referred to as the aspect ratio [54]. In a crude approximation, the typical size of the pore body is often taken as the grain radius d/2, and rn = α (d/2), which gives a modified Bond number Bo* = (Δρgd2)/(4γα). Although this dimensionless parameter has been used previously to attempt a physical classification of the flow patterns [21, 48], it is not always easy to determine, due to the difficulty to determine the porous media aspect ratio [48]. Moreover, it does not take into account the pore size distribution, which can strongly vary from one grain sample to the other, even when the average size remains the same. It has already been pointed out in the literature, although qualitatively, that the soil heterogeneity—and not only the average grain size—may have a strong effect on the efficiency of air sparging [20].
The parameter χ, introduced in previous works and emphasized in Section 3.1, provides a way to quantify the importance not only of the average grain size, but also of its distribution [42–44]. Equation (1) shows that it is easy to estimate from the granular medium or soil granulometry. From its other formulation (Equation 2), it is possible to link it with the Bond number, as χ = w/Bo, where w is the relative variation of the pore size. It cannot be compared to the modified Bond number, Bo* = Bo/α, as w here takes into account the heterogeneities in the medium (grain size distribution and local packing fraction) and their impact on the flow pattern, which is not the case for α. In other words, χ can be considered as a polydisperse Bond number. However, it is also based on the physics of rigid porous media. Even if it succeeds in providing a general description of the parabolic region explored by the gas, it does not account for the grain motion, and the resulting coupling between the solid, fluid and gas phase flow. A theoretical description of this interaction would require a more complex formulation, and is out of the scope of this article.
This work has reported new experimental results evidencing an increase of the central fluidized zone extension on the flow rate. In spite of the different physical mechanisms at stake—percolation, fracturing, localized fluidized zone above the injection nozzle or lateral fracture—in most experiments, the fluidized zone boundary is always parabolic. The only exception is for large grains (d = 710–965 μm), at low flow rate. The exploration of the regime diagram for larger grains would be required to extend this description, and attempt to propose a mechanism to account for this difference.
We also introduced the normalized flow density, ρ, which provides a quantification of the average motion in the granular bed. It proves to be a useful tool not only to accurately determine, in the stationary regime, the contour of the fluidized zone, but also to image its transient growth. The detailed analysis of this latter will be the topic of a future work. We evidenced different degassing dynamics in the stationary regime, inside the fluidized zone, and underline the importance of a parameter often hidden in the experimental systems, the volume of gas Vc available before the injection nozzle. For low flow-rate Q or large Vc, air bubbles cross the deformable medium. For large Q or small Vc, we observe an intermittence between air bubbles, and open channels connecting the air nozzle to the grains free surface. In this latter regime, a continues degassing is observed, until the channel walls collapse, back to a bubbling regime. Finally, a new regime was reported in the 2D experiment, with a transition between the growth of an air finger and the fracture of the above granular layer at a given height in the cell. Such patterns as fingering and fracturing have been reported in the literature in deformable, saturated porous media, when varying the grain volume fraction [40, 55, 56]. These patterns, however, were mainly described for horizontal Hele-Shaw cell, in which buoyancy does not govern the system dynamics. To our knowledge, it is the first time that a spontaneous transition between fingering and fracturing is reported. Additional techniques of index-matching would be required to check if this peculiar dynamics is a consequence of the confinement by the lateral plates, or also occurs in the 3D experiment.
Author Contributions
GV and GR performed most of the experimental work related to Sections 3.1, 3.2, and 3.3.2. VV performed the experiments about the degassing regimes (Section 3.3.1). GV, JG, and VV provided the theoretical background, and all authors participated in the results analysis and interpretation. VV drafted the work, and all authors revised it and gave their final approval.
Funding
GV and VV acknowledge financial support from FONDECYT Project No.11121300. This work was supported by the Programa de cooperación científica ECOS/CONICYT C14E07 and by the LABEX iMUST (ANR-10-LABX-0064) of Université de Lyon, within the program “Investissements d'Avenir” (ANR-11-IDEX-0007) operated by the French National Research Agency (ANR).
Conflict of Interest Statement
The authors declare that the research was conducted in the absence of any commercial or financial relationships that could be construed as a potential conflict of interest.
Acknowledgments
The authors thank the editors of Frontiers Research Topic “Flow and Transformation in Porous Media” to ask them for this contribution. We acknowledge the three reviewers for interesting remarks and discussions which greatly improved the manuscript.
References
1. Naudts L, Greinert J, Artemov Y, Beaubien SE, Borowski C, De Batist M. Anomalous sea-floor backscatter patterns in methane venting areas, Dnepr paleo-delta, NW Black Sea. Mar Geol. (2008) 251:253–67. doi: 10.1016/j.margeo.2008.03.002
2. Flekkøy EG, Malthe-Sørenssen A, Jamtveit B. Modeling hydrofracture. J Geophys. Res. (2002) 107:2151. doi: 10.1029/2000JB000132
3. Cobbold PR Rodrigues N. Seepage forces, important factors in the formation of horizontal hydraulic fractures and bedding-parallel fibrous veins (‘beef’ and ‘cone-in-cone’). Geofluids (2007) 7:313–22. doi: 10.1111/j.1468-8123.2007.00183.x
4. Boutt DF, Goodwin L, McPherson BJO L. Role of permeability and storage in the initiation and propagation of natural hydraulic fractures. Water Resour Res. (2009) 45:W00C13. doi: 10.1029/2007WR006557
5. Hovland M, Talbot M, Olaussen S, Aasberg L. Recently formed methane-derived carbonates from the North Sea floor. In: Thomas BM, editor. Petroleum Geochemistry in Exploration of the Norwegian Shelf. London: Graham and Trottman (1985). p. 263–6.
6. Hovland M, Gardner JV, Judd AG. The significance of pockmarcks to understanding fluid flow processes and geohazards. Geofluids (2002) 2:127–36. doi: 10.1046/j.1468-8123.2002.00028.x
7. Gay A, Lopez M, Cochonat P, Sérane M, Levaché D, Sermondadaz G. Isolated seafloor pockmarks linked to BSRs, fluid chimneys, polygonal faults and stacked OligoceneMiocene turbiditic palaeochannels in the Lower Congo Basin. Math Geol. (2006) 226:25–40. doi: 10.1016/j.margeo.2005.09.018
8. Svensen H, Planke S, Jamtveit B, Pedersen T. Seep carbonate formation controlled by hydrothermal vent complexes: a case study from the Vøring Basin, the Norwegian Sea. Geo-Mar Lett. (2003) 23:351–8. doi: 10.1007/s00367-003-0141-2
9. Svensen H, Jamtveit B, Planke S, Chevallier L. Structure and evolution of hydrothermal vent complexes in the Karoo basin, South Africa. J Geol Soc. (2006) 163:671–82. doi: 10.1144/1144-764905-037
10. Walters AL, Phillips J, Brown RJ, Field M, Gernon T, Stripp G, et al. The role of fluidisation in the formation of volcaniclastic kimberlite: grain size observations and experimental investigation. J Volcanol Geotherm Res. (2006) 155:119–37. doi: 10.1016/j.jvolgeores.2006.02.005
11. Gernon TM, Gilbertson MA, Sparks RSJ, Field M. Gas-fluidisation in an experimental tapered bed: insights into processes in diverging volcanic conduits. J Volcanol Geotherm Res. (2008a) 174:49–56. doi: 10.1016/j.jvolgeores.2007.12.034
12. Gernon TM, Sparks RSJ, Field M. Degassing structures in volcaniclastic kimberlite: examples from southern African kimberlite pipes. J Volcanol Geotherm Res. (2008b) 174:186–94. doi: 10.1016/j.jvolgeores.2007.12.035
13. Planke S, Svensen H, Hovland M, Banks DA, Jamtveit B. Mud and fluid migration in active mud volcanoes in Azerbaijan. Geo-Mar Lett. (2003) 23:258–68. doi: 10.1007/s00367-003-0152-z
14. Mastalerz V, de Lange GJ, Dählmann A, Feseker T. Active venting at the Isis mud volcano, offshore Egypt: origin and migration of hydrocarbons. Chem Geol. (2007) 246:87–106. doi: 10.1016/j.chemgeo.2007.09.005
15. Mazzini A, Svensen H, Akhmanov GG, Aloisi G, Planke S, Malthe-Sørenssen A, et al. Triggering and dynamic evolution of the LUSI mud volcano, Indonesia. Earth Planet Sci Lett. (2007) 261:375–88. doi: 10.1016/j.epsl.2007.07.001
16. Mörz T, Karlik EA, Kreiter S, Kopf A. An experimental setup for fluid venting in unconsolidated sediments: New insights to fluid mechanics and structures. Sediment Geol. (2007) 196:251–67. doi: 10.1016/j.sedgeo.2006.07.006
17. Reddy KR, Kosgi S, Zhou J. A review of in-situ air sparging for the remediation of VOC-contaminated saturated soils and groundwater. Hazard Waste Hazard Mater. (1995) 12:97–118. doi: 10.1089/hwm.1995.12.97
18. Semer R, Adams JA, Reddy KR. An experimental investigation of air flow patterns in saturated soils during air sparging. Geotech Geol Eng. (1998) 16:59–75. doi: 10.1023/A:1008884213834
19. Reddy KR, Semer R, Adams JA. Air flow optimization and surfactant enhancement to remediate toluene-contaminated saturated soils using air sparging. Environ Manage Health (1999) 10:52–63. doi: 10.1108/09566169910257239
20. Reddy KR, Adams JA. Effects of soil heterogeneity on airflow patterns and hydrocarbon removal during in situ air sparging. J Geotech Geoenviron Eng. (2001) 3:234–47. doi: 10.1061/(ASCE)1090-0241(2001)127:3(234)
21. Selker JS, Niemet M, McDuffie NG, Gorelick SM, Parlange JY. The local geometry of gas injection into saturated homogeneous porous media. Transp Porous Med. (2007) 68:107–27. doi: 10.1007/s11242-006-0005-0
22. Wilhelm T, Wilmański K. On the onset of flow instabilities in granular media due to porosity inhomogeneities. Int J Multiphase Flow (2002) 28:1929–44. doi: 10.1016/S0301-9322(02)00105-2
23. Svensen H, Planke S, Renssen AMS, Jamtveit B, Myklebust R, Eidem TR, et al. Release of methane from a volcanic basin as a mechanism for initial Eocene global warming. Nature (2004) 429:542–5. doi: 10.1038/nature02566
24. Svensen H, Planke S, Chevallier L, Renssen AMS, Corfu F, Jamtveit B. Hydrothermal venting of greenhouse gases triggering Early Jurassic global warming. Earth Planet Sci Lett. (2007) 256:554–66. doi: 10.1016/j.epsl.2007.02.013
25. Nermoen A, Raufaste C, deVilliers SD, Jettestuen E, Meakin P, Dysthe DK. Morphological transitions in partially gas-fluidized granular mixtures. Phys Rev E (2010a) 81:061305. doi: 10.1103/PhysRevE.81.061305
26. Nermoen A, Galland O, Jettestuen E, Fristad K, Podladchikov Y, Svensen H, et al. Experimental and analytic modeling of piercement structures. J Geophys Res. (2010b) 115:B10202. doi: 10.1029/2010JB007583
27. Rigord P, Guarino A, Vidal V, Géminard JC. Localized instability of a granular layer submitted to an ascending liquid flow. Gran Matt. (2005) 7:191–7. doi: 10.1007/s10035-005-0214-1
28. Zoueshtiagh F, Merlen A. Effect of a vertically flowing jet underneath a granular bed. Phys Rev E (2007) 75:056313. doi: 10.1103/PhysRevE.75.056313
29. Sauter EJ, Muyakshin SI, Charlouand JL, Schlüter M, Boetius A, Jerosch K, et al. Methane discharge from a deep-sea submarine mud volcano into the upper water column by gas hydrate-coated methane bubbles. Earth Planet Sci Lett. (2006) 243:354–65. doi: 10.1016/j.epsl.2006.01.041
30. Vedvik A, Wagner G, Oxaal U, Feder J, Meakin P, Jøssang T. Fragmentation transition for invasion percolation in hydraulic gradients. Phys Rev Lett. (1998) 80:3065–8. doi: 10.1103/PhysRevLett.80.3065
31. Løvoll G, Méheust Y, Toussaint R, Schmittbuhl J, Måløy KJ. Growth activity during fingering in a porous Hele-Shaw cell. Phys Rev E (2004) 70:026301. doi: 10.1103/PhysRevE.70.026301
32. Toussaint R, Løvoll G, Méheust Y, Måløy KJ, Schmittbuhl J. Influence of pore-scale disorder on viscous fingering during drainage. Europhys Lett. (2005) 71:583–9. doi: 10.1209/epl/i2005-10136-9
33. Stauffer F, Kong XZ, Kinzelbach W. A stochastic model for air injection into saturated porous media. Adv Water Resour. (2009) 32:1180–6. doi: 10.1016/j.advwatres.2009.03.010
34. Løvoll G, Jankov M, Måløy KJ, Toussaint R, Schmittbuhl J, Schäfer G, et al. Influence of viscous fingering on dynamic saturation-pressure curves in porous media. Transp Porous Med. (2010) 86:305–24. doi: 10.1007/s11242-010-9622-8
35. Fiori A, Jankovic I. On preferential flow, channeling and connectivity in heterogeneous porous formations. Math Geosci. (2012) 44:133–45. doi: 10.1007/s11004-011-9365-2
36. Geistlinger H, Krauss G, Lazik D, Luckner L. Direct gas injection into saturated glass beads: transition from incoherent to coherent gas flow pattern. Water Resour Res. (2006) 42:W07403. doi: 10.1029/2005WR004451
37. Kong XZ, Kinzelbach W, Stauffer F. Migration of air channels: an instability of air flow in mobile saturated porous media. Chem Eng Sci. (2009) 64:1528–35. doi: 10.1016/j.ces.2008.12.028
38. Kong XZ, Kinzelbach W, Stauffer F. Morphodynamics during air injection into water-saturated movable spherical granulates. Chem Eng Sci. (2010) 65:4652–60. doi: 10.1016/j.ces.2010.05.007
39. Sandnes B, Flekkoøy EG, Knudsen HA, Måløy KJ, See H. Patterns and flow in frictional fluid dynamics. Nat Commun. (2011) 2:288. doi: 10.1038/ncomms1289
40. Chevalier C, Lindner A, Leroux M, Clément E. Morphodynamics during air injection into a confined granular suspension. J Non-Newtonian Fluid Mech. (2009) 158:63–72. doi: 10.1016/j.jnnfm.2008.07.007
41. Johnsen Ø, Chevalier C, Lindner A, Toussaint R, Clément E, Måløy KJ, et al. Decompaction and fluidization of a saturated and confined granular medium by injection of a viscous liquid or gas. Phys Rev E (2008) 78:051302. doi: 10.1103/PhysRevE.78.051302
42. Varas G, Vidal V, Géminard JC. Venting dynamics of an immersed granular layer. Phys Rev E (2011a) 83:011302. doi: 10.1103/PhysRevE.83.011302
43. Varas G, Vidal V, Géminard JC. Morphology of air invasion in an immersed granular layer. Phys Rev E (2011b) 83:061302. doi: 10.1103/PhysRevE.83.061302
44. Varas G, Géminard JC, Vidal V. Air invasion in a granular layer immersed in a fluid: morphology and dynamics. Granular Matter (2013) 15:801–10. doi: 10.1007/s10035-013-0435-7
45. Varas, G, Vidal, V, and Géminard, JC. Dynamics of crater formations in immersed granular material. Phys Rev E (2009) 79:021301. doi: 10.1103/PhysRevE.79.021301
46. Ji W, Dahmani A, Ahlfeld DP, Lin JD, Hill E. Laboratory study of air sparging: air flow visualization. Ground Water Monit Rem. (1993) 13:115–26. doi: 10.1111/j.1745-6592.1993.tb00455.x
47. Philippe P, Badiane M. Localized fluidization in a granular medium. Phys Rev E (2013) 87:042206. doi: 10.1103/PhysRevE.87.042206
48. Brooks MC, Wise WR, Annable MD. Fundamental changes in in-situ air sparging flow patterns. Ground Water Monit Rem. (1999) 19:105–13. doi: 10.1111/j.1745-6592.1999.tb00211.x
49. Gostiaux L, Gayvallet H, Géminard JC. Dynamics of a gas bubble rising through a thin immersed layer of granular material: an experimental study. Granular Matter (2002) 4:39–44. doi: 10.1007/s10035-002-0105-7
50. Divoux T, Bertin E, Vidal V, Géminard JC. Intermittent outgassing through a non-Newtonian fluid. Phys Rev E (2009) 79:056204. doi: 10.1103/PhysRevE.79.056204
51. Divoux T, Vidal V, Ripepe M, Géminard JC. Influence of non-Newtonien rheology on magma degassing. Geophys Res Lett. (2011) 38:L12301. doi: 10.1029/2011GL047789
52. Vidal V, Soubiran F, Divoux T, Géminard JC. Degassing cascades in a shear-thinning viscoelastic fluid. Phys Rev E (2011) 84:066302. doi: 10.1103/PhysRevE.84.066302
53. ASTM. Annual Book of ASTM Standards, Section 4 Construction, Vol. 04.08 Soil and Rock; Dimension Stone; Geosynthetics. Philadelphia: ASTM (1993).
54. Chatzis I, Morrow NR, Lim HT. Magnitude and detailed structure of residual oil saturation. Soc Petrol Eng J. (1983) 23:311–26. doi: 10.2118/10681-PA
55. Holtzman R, Juanes R. Crossover from fingering to fracturing in deformable disordered media. Phys Rev E (2010) 82:046305. doi: 10.1103/PhysRevE.82.046305
Keywords: granular media, saturated beds, three-phase flows, fluidization, patterns, fracture
Citation: Varas G, Ramos G, Géminard J-C and Vidal V (2015) Flow and fracture in water-saturated, unconstrained granular beds. Front. Phys. 3:44. doi: 10.3389/fphy.2015.00044
Received: 23 April 2015; Accepted: 02 June 2015;
Published: 19 June 2015.
Edited by:
Renaud Toussaint, University of Strasbourg, FranceReviewed by:
Takahiro Hatano, The University of Tokyo, JapanBjornar Sandnes, Swansea University, UK
Michael Julian Niebling, Schlumberger Limited, Norway
Copyright © 2015 Varas, Ramos, Géminard and Vidal. This is an open-access article distributed under the terms of the Creative Commons Attribution License (CC BY). The use, distribution or reproduction in other forums is permitted, provided the original author(s) or licensor are credited and that the original publication in this journal is cited, in accordance with accepted academic practice. No use, distribution or reproduction is permitted which does not comply with these terms.
*Correspondence: Valérie Vidal, Laboratoire de Physique, École Normale Supérieure - Centre National de la Recherche Scientifique, Université de Lyon, 46 Allée d'Italie, 69364 Lyon, France, valerie.vidal@ens-lyon.fr