 Christian David
- 1Laboratoire Géosciences et Environnement Cergy, Université de Cergy-Pontoise, Cergy-Pontoise, France
- 2CSIRO, Energy Flagship, Perth, WA, Australia
- 3Department of Geophysical Sciences, National Research Center, Cairo, Egypt
Several methods are compared for the detection of moving capillary fronts in spontaneous imbibition experiments where water invades dry porous rocks. These methods are: (i) the continuous monitoring of the mass increase during imbibition, (ii) the imaging of the water front motion using X-ray CT scanning, (iii) the use of ultrasonic measurements allowing the detection of velocity, amplitude and spectral content of the propagating elastic waves, and (iv) the combined use of X-ray CT scanning and ultrasonic monitoring. It is shown that the properties of capillary fronts depend on the heterogeneity of the rocks, and that the information derived from each method on the dynamics of capillary motion can be significantly different. One important result from the direct comparison of the moving capillary front position and the P wave attributes is that the wave amplitude is strongly impacted before the capillary front reaches the sensors, in contrast with the velocity change which is concomitant with the fluid front arrival in the sensors plane.
Introduction
Multiphase flow is ubiquitous in nature, and it is of fundamental importance to understand fluid displacement processes in porous media. A simple way to tackle this problem is to perform laboratory imbibition experiments, where a wetting fluid (e.g., water) spontaneously displaces a non-wetting phase (e.g., air) present in the pore space, or conversely drainage experiments where a non-wetting fluid (e.g., oil) is pushed under pressure to displace a wetting phase (e.g., water) present in the pore space [1]. It has been shown in previous works [2–4] that the geometry of the interface between the wetting and the non-wetting phase in imbibition experiments can be quite complex; the dynamics of fluid displacement is strongly controlled by the rock microstructure. These conclusions were drawn from the analysis of X-ray CT scan images obtained at various stages during water imbibition tests using a medical CT scanner. Imaging pore microstructures has proven to provide valuable quantitative information for the modeling of fluid flow processes in geomaterials. Nevertheless, imaging is not always possible, and one needs to rely on indirect techniques to characterize changes in stress state or fluid content in reservoirs rocks under in situ conditions for example. Obviously seismic techniques are good candidates for achieving a remote monitoring of reservoirs at depth, leading 4D seismic studies to have been widely used in the last decade [5]. It is still an open question to know at which extent seismic studies are reliable enough to detect accurately fluid motion or fluid substitution occurring in reservoirs at depth, for instance during hydrocarbon production or CO2 storage operations [6]. Experimental studies aiming to simultaneously image the fluid flow processes and monitor the seismic response are mostly welcome. We achieved this at the laboratory scale, by conducting water imbibition tests under a medical CT scanner with continuous recording of waveforms for P waves traveling across the tested rock samples. Doing so, it is possible to link the modification of the wave propagation signature with the fluid substitution. In this paper we will address the following questions. What primary information can be obtained from capillary imbibition tests in the lab? How accurate are seismic recordings to detect fluid motion in reservoir rocks? Which attribute of the seismic signal is the most reliable and accurate for such detection?
This paper will mainly focus on methods. Through a review of different applied techniques to study capillary imbibition processes: standard weight increase measurement, X-ray imaging, ultrasonic monitoring, we will investigate the reliability of ultrasonic monitoring by a direct comparison between wave attributes (amplitude, travel time, and spectral content) at different stages of the imbibition process, and the corresponding images of the fluid distribution in the rock, obtained by continuous X-ray CT scanning.
Standard Method for Capillary Imbibition Studies
Capillary imbibition experiments are commonly used in petrophysics to get information on porous geomaterials, as they are quite straightforward to conduct and inexpensive to implement. The standard technique to measure capillary rise in porous rocks consists in weighing a sample and/or in visually determining the height of the water front during imbibition (e.g., Siebold et al. [7]). To get a continuous data set, the sample is hooked under an electronic balance and a video recording device captures the water front rising along the sample surface while the bottom end of the sample is placed in contact with a water tank [8]. Knowing the rock porosity and the water saturation during imbibition, a reasonable agreement is found between the direct observation of the height reached by the rising water front and the one derived from the mass increase [3]. The detection of the moving front position from the mass intake involves as well the assumption that the interface between dry and wet parts of the tested sample is flat, figuring a kind of piston-like imbibition process. An example of such a study will now be presented.
Material and Methods
The data presented in this section have been obtained on a set of Paleozoic-Mesozoic Nubia sandstone samples selected from different locations in Egypt which were followed up and sampled through a cross section extending over more than 300 km through the north of the Eastern Desert and Sinai in Egypt. Four areas are studied in this cross section, namely Gebel Somr El-Qaa in the Eastern Desert, and Gebel Abu Durba, Wadi Soal (at Gebel El-Rome) and Wadi Watir (at Bir Sanafir) in Sinai Peninsula. In the studied sites, the Nubia sandstones are represented by Araba, Naqus, Abu Durba, and Malha Formations (collectively called the Nubia sandstones). More details on the geological background and rock composition will be given in a paper in preparation [Nabawy et al., under review]. Several petrophysical properties were measured on a large number of samples [9]. Among all this exhaustive characterization, capillary imbibition tests were conducted on a set of eight core samples with diameter 4 cm and length ranging between 6 and 8 cm. The selected samples presented different microstructural attributes from very fine to coarse grains and are composed mostly of brown to yellow, well sorted or sometimes ill sorted, very fine to coarse sandstones, mostly quartz arenite. These samples will be called hereafter NBS-1 to NBS-8. The dry rock samples are hooked under an electronic balance (precision 0.001 g), and at time zero the bottom end of the samples is immersed over a very short length (typically 1 mm) in a tank filled with water. Water is constantly supplied to the tank in order to maintain a constant water level. At this very early stage, several processes take place: (i) a meniscus water layer will form along the sample edge in contact with water (ii) buoyancy force in the immerged rock volume will oppose the gravity force. These effects need to be corrected in order to get the mass of water present in the pore space during capillary rise [3, 10]. For such experiments, the standard way to represent the data is to plot the water mass intake as a function of the square root of time. Doing so one would obtain a straight line if the porous rock would be replaced by a single pipe with constant radius r. The pore space of rocks being intrinsically heterogeneous, this linearity would never be observed for natural rocks. Nevertheless, it is possible to define the so-called coefficient of capillarity C [called Ws in David et al. [3]] from the mean slope of the mass vs. square root of time plot:
where m is the water mass intake and R is the sample radius. Another important feature of capillary imbibition experiments is that full saturation is never reached during spontaneous imbibition experiments. The dynamics of capillary fluid motion in porous materials with heterogeneous pore size distributions induces indeed air-trapping. It is not possible to get the water saturation at intermediate stages during capillary rise without knowing the geometry and position of the capillary front, whereas it is easy to get a mean saturation value once the water front has reached the top of the sample.
Results
As stated above, we report in Figure 1 the water mass intake plotted vs. the square root of time for eight tested samples. The values for the coefficient of capillarity C and the corresponding correlation coefficient for the linear regression (Table 1) show that, overall, the linear approximation is very satisfying. The coefficient of capillarity C varies by one order of magnitude (0.006–0.07 g/cm2/s1∕2). Porosity (17.7–22.4%), permeability (42–269 mD) and final saturation after the imbibition test (47–61%) are also reported in Table 1. Based on the analysis of a limited number of rocks, David et al. [3] expected a correlation between the permeability k and the capillary coefficient C, as both parameters involve fluid displacement within the pore space. To verify this assumption on a larger dataset, capillarity-permeability data of the present study along with those of recent studies on oolitic limestones [11], dolostones [12], sandstones and carbonates [3] and a variety of sedimentary rocks [13] are reported in Figure 2. An overall positive correlation between C and the rock permeability is observed: a narrow elliptic envelope encompasses 97% of the data allowing the prediction of the rock permeability with a maximum error of about one order of magnitude. The dashed line corresponds to a power-law with exponent 2, the experimental correlation is then consistent with a simple relationship k = αC2 where α is a constant. From Figure 2 we derived α = 1.38 10−12, k and C being in SI units. A similar relationship has been proposed recently by Benavente et al. [13] for the prediction of permeability from capillarity and microstructural data:
where η, ρ, and γ are the fluid viscosity, density and surface tension respectively, θ is the contact angle, ϕ is the porosity and r is the threshold pore radius which can be derived from mercury injection tests. A better correlation could probably be found if each of these parameters is known. In addition, the scatter in Figure 2 can be explained by the variability of all these parameters, especially the threshold radius and the rock porosity. Such correlation allowing the prediction of permeability from capillarity data justifies the interest for the development of inexpensive capillary imbibition tests in the lab.
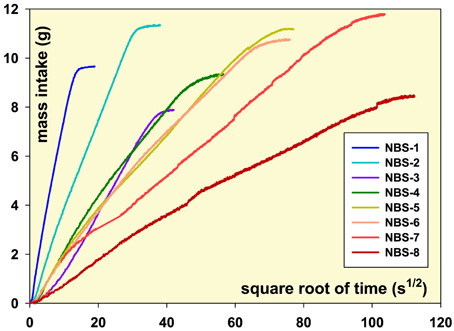
Figure 1. Water mass intake evolution of the eight Nubia sandstone samples as a function of square root of time.
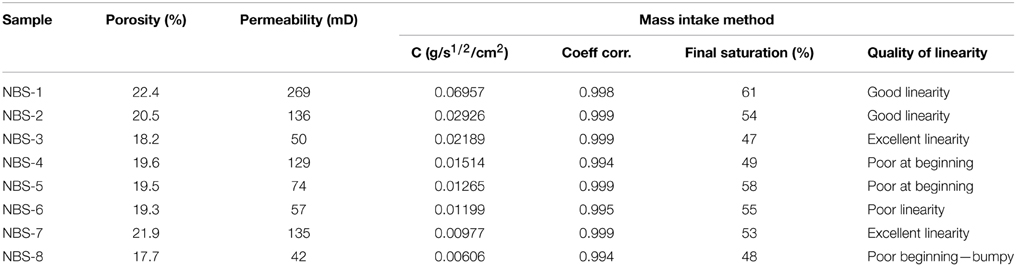
Table 1. Petrophysical properties and coefficient of capillarity C of the Nubia sandstone samples obtained with the mass intake method.
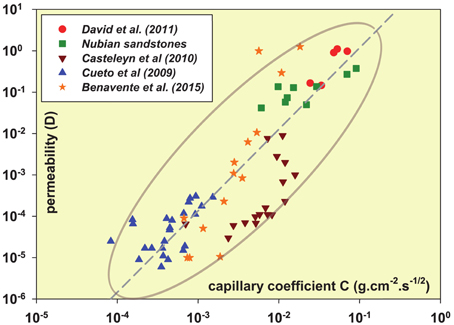
Figure 2. Correlation between the coefficient of capillarity and permeability obtained in this study and by previous authors.
X-ray Imaging of Moving Capillary Fronts
The geometry of capillary fronts can be inferred by performing capillary rise experiments under a X-ray Computerized Tomography “CT” medical scanner. However, the concomitant measurement of the water mass intake with a balance is not possible during this experiment. Indeed, one cannot place metallic objects in the field of the X-ray beam without significantly downgrade the resulting image. Multiple X-ray beams crossing the rock sample during the CT scan allows one to get a map of X-ray attenuation that can be correlated to the density, which reveals the density contrast between the dry rock and the volume where water has invaded the pore space. It is then possible to get the position and the shape of the capillary front during imbibition. Classically several parameters can be retrieved from such experiments: (i) the maximum height and (ii) the minimum height of the capillary front, (iii) the curvature of the interface when the capillary front has a smooth shape which can be approximated by an arc of a circle [3].
Material and Methods
We present the results obtained on the same eight Nubia sandstone samples presented in the previous section. As mentioned above, the key point here is to scan the cored plugs using a medical scanner: this has been done in the framework of a collaboration with IFP Energies nouvelles (IFPEN). The dry samples are placed on a stand under the X-ray CT scanner to image the fluid flow patterns and their evolution with time. The stand is located in a container filled by a continuous flux of water which allows the water surface to always be in direct contact with the bottom end of the sample. As for the previous experiments, capillary forces induce the rise of water through the pore space. We start to image the sample as soon as water enters into the rock, until it reaches the top end of the sample. The CT scanner requires a minimum time between two snapshots of 2.5 s. The typical total duration of a run is about 10 min which enables to obtain an average total number of 240 images per experiment. Only one axial slice or radiograph is taken each time, so that the geometry of the moving front is only investigated on a fixed plane: the 3D geometry of the interface cannot be obtained due to the limitation of the apparatus. The resolution of the obtained image is 0.4 mm × 0.4 mm per pixel. Following the method described in David et al. [3], image processing allows one to highlight the contrast between the dry and the wet parts of the sample, by subtracting to each image a reference image obtained on the dry rock. From these high contrasted images, it is then possible to measure automatically the maximum height H and the minimum height h reached by the water front at each time increment using an image analysis routine. The calculated heights do not correspond necessarily to the heights at the center or the border of the samples. Like for the mass intake plot, these parameters are generally plotted vs. the square root of time, and it is possible to define another capillary parameter A related to the evolution of the height:
This parameter has been estimated in the linear part of the plot related to the maximum height. In this case also, if the rock would be replaced by a single pipe with constant radius, this parameter would be constant and the capillary plot would give a straight line.
Results
Heights H (solid circles) and h (open circles) are plotted vs. the square root of time for the eight Nubia sandstone samples (Figure 3). Different background colors and symbols are used to qualitatively characterize the shape of the water front: a green background means a concave upward curvature, a red background means a concave downward curvature, and a blue background means that the interface is flat. A large variety of situations can be found, with the shape of the water front evolving during capillary rise. An example of the processed images at an intermediate stage for each sample is inserted in Figure 3: the upper dark zone on each image correspond to the dry part of the sample not invaded by water. Overall the quality of the linear fit is reasonably good (correlation coefficients higher than 0.97) and qualitatively the results for both capillary parameters A and C are in good agreement (Table 2). In a first approximation it is possible to make the link between both parameters assuming (i) a homogeneous water saturation in the water invaded part and (ii) a flat interface of the capillary front (not observed except for three samples in the ultimate stage). Doing so it is possible to predict the value for A knowing the value of C:
where Sw is the water saturation in the invaded region, assumed to be the same everywhere. For this calculation we used the final saturation value (Table 1). For three samples (NBS-2, NBS-3, and NBS-5), the slope of the predicted evolution is in good agreement with the observations on the CT scan images (Figure 3), but for the other five samples the height evolution is significantly different from the predicted one (Table 2). To account for this discrepancy, one can estimate from Equation (4) the water saturation that would be needed on the right hand side in order to get a predicted value equal to the measured one on the left hand side. Doing so, the inferred saturation values are given in Table 2, and the predicted height evolution corresponds to the dashed lines in Figure 3. As expected the slope of the predicted height agrees well with the measured ones. The saturation values need to be systematically lower in Equation (4), down to 28% in the worst case (NBS-8 in Table 2). However, these estimations need to be taken with caution because of the assumption of piston flow and uniform saturation in the invaded area, which might probably be an oversimplification of the actual situation.
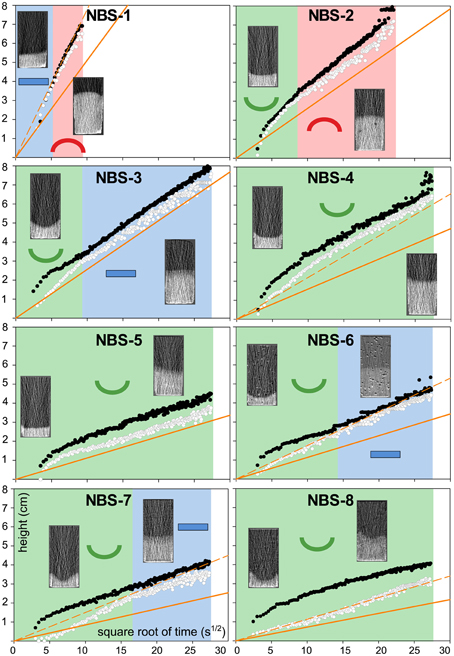
Figure 3. Heights evolution of the water front as a function of square root of time. Solid and open circles correspond to the maximum and minimum heights, respectively. The shape of the front (upward/downward concave, flat) is represented with different symbols and background colors (respectively green, red, and blue). The solid and dashed lines correspond to the prediction from capillarity coefficient C using the final saturation and an ad hoc saturation respectively.
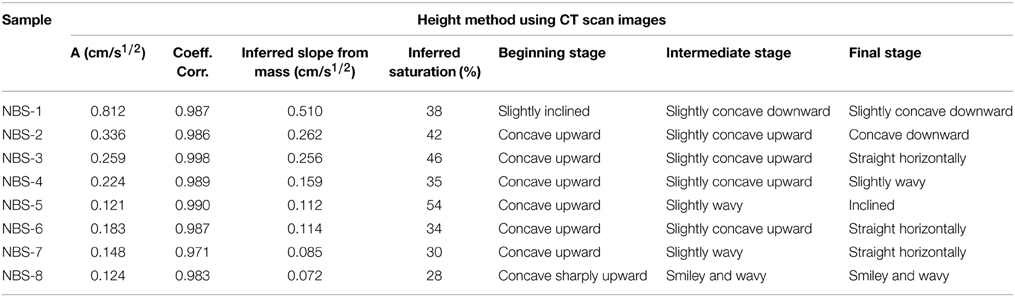
Table 2. Capillary parameter A of the Nubia sandstone samples obtained with the height method using CT scan images, and qualitative description of the capillary front geometry.
Ultrasonic Method for the Detection of Moving Capillary Fronts
In order to get more information on capillary imbibition processes, it is possible to combine the classical weight measurement technique with a system allowing for the recording of ultrasonic acoustic signals. Pairs of ultrasonic sensors can be glued at different locations on the sample surface, and the travel time for elastic waves traveling from the emitter to the receiver can be recorded at given times. This allows one to monitor the rise of capillary fronts during imbibition tests. Both seismic velocities and attenuation are sensitive to the passage of fluid fronts [14]. In the following we present the experimental device available in the rock physics lab at Cergy-Pontoise University, and we present some results obtained on two carbonate rocks.
Material and Methods
For this study the selected rocks were the Majella grainstone (30% porosity) from the central Apennines, Italy, and the Saint-Maximin limestone (37% porosity) from the Paris basin, France. Information on the mineralogical and petrophysical properties of both carbonate rocks can be found in David et al. [15] and Baud et al. [16]. As explained in Section Material and Methods (Section Standard Method for Capillary Imbibition Studies), the rock sample is hanging under an electronic balance (Figure 4). Two ultrasonic transducers were fixed with phenyl salicylate glue at 30 mm from the bottom of the sample, across a diameter. AE sensors VS600-Z1 from Vallen Company were chosen for their small size (diameter 4.75 mm) and broad bandwidth (200–850 kHz). Both sensors are connected to a Panametrics 5058PR high voltage pulse-receiver which delivers to the emitter a high voltage pulse (max. 900 V) with a frequency of about 1 MHz. This device amplifies also the signal of the receiving sensor with a maximum gain of 60 dB. The waveform captured by the receiver is sent to a digital oscilloscope Agilent 2014A which has a 100 MHz sampling frequency. During each experiment, the received waveform is manually recorded on a USB stick every 5 s. After the experiment, the waveforms are analyzed thanks to an automatic procedure implemented using the Scilab freeware. Two parameters are retrieved from the recorded waveforms: (i) the arrival time of the P wave and (ii) the amplitude of the first peak. For picking automatically the first arrival, we used the Akaike Information Criterion (AIC method), a robust technique commonly used is seismology. Additional information on the dynamics of fluid front propagation can be obtained if one plots on the same graph all the waveforms recorded during the experiment. Finally the analysis of the spectral content of the waveforms at selected times during the imbibition process was carried out. To this end, spectrograms of the selected waveforms have been constructed using the S-transform described in detail by Pinnegar [17].
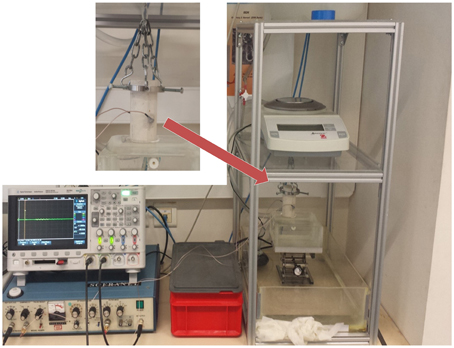
Figure 4. Experimental device for imbibition experiments coupling ultrasonic measurements with mass intake method. The sample is hanging under an electronic balance, above a water tank and ultrasonic sensors are connected to a high voltage pulse-receiver and an oscilloscope.
Results
The evolution of the normalized P wave velocity and first peak amplitude as a function of time during capillary imbibition tests on Majella grainstone (left) and Saint-Maximin limestone (right) are shown in Figure 5. The dashed lines represent the mass increase due to water intake during imbibition: we can observe that the imbibition kinetics is significantly faster in the Saint-Maximin limestone than in the Majella grainstone, probably due to the broader pore size distribution, larger internal surface area, smaller particle size and larger throat size (derived from mercury injection) in the former [16]. For both rocks the velocity and wave amplitude have been normalized to the value of the dry rock, before imbibition starts: for Majella grainstone, the initial P wave velocity is 2750 m/s and the first peak amplitude is −16.6 mV, while the initial P wave velocity is 2810 m/s and the first peak amplitude is −3.1 mV for Saint-Maximin limestone. From the comparison of the results for both rocks (Figure 5), common features but also striking differences can be highlighted. Firstly the arrival of the capillary front results in a decrease of the P wave velocity and amplitude in both samples. However, a much sharper drop in amplitude compared to velocity is systematically observed. The amplitude of the first peak seems to be more sensitive to fluid substitution than the velocity and should therefore be preferred for the detection of the capillary front arrival. Secondly the departure from the initial values of velocity and amplitude does not occur simultaneously, and the order is actually different from one rock to the other: for the Majella grainstone the amplitude decreases first, then the velocity, and the reverse is observed for the Saint-Maximin limestone. We are not able to provide further explanation on this behavior without detailed information on the capillary front position. In this kind of experiment, we can only speculate on the position and geometry of the water front inside the rock sample. Notice that for Saint-Maximin limestone we could derive the amplitude and velocity evolution only at the early stage of the imbibition process. Once the water front approaches the location of the ultrasonic sensors, the waveforms are strongly attenuated, the amplitude of the first peak becomes then so weak that the signal-to-noise ratio becomes vanishingly small and the AIC method does not work anymore. The gray boxes on the time axis correspond to the time interval when the height of the water front at the sample surface is moving from 2 mm below the sensors to 2 mm above the sensors (visual observation during the experiment). Whereas, for the Saint-Maximin limestone the passing through fluid front between the transducers is associated with major changes in the P wave amplitude and velocity, for the Majella grainstone those fluctuations are observed well before the fluid front reaches the transducer plane. This probably reveals the complex geometry of the capillary front inside the rock sample, which cannot be estimated from the observation of the sample surface. Again without a detailed knowledge of the capillary front geometry, it is not possible to get a comprehensive understanding of the waveform evolutions.
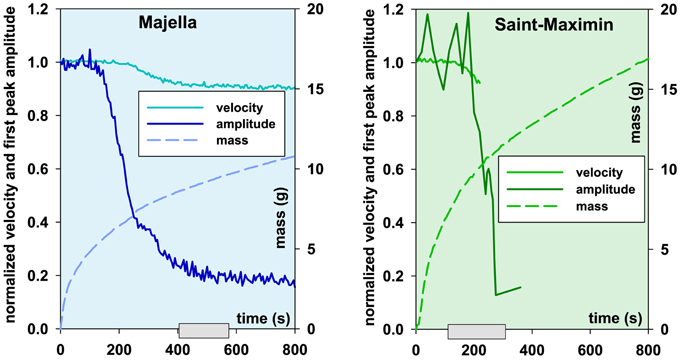
Figure 5. Results from the imbibition experiments coupling ultrasonic measurements with the mass method for the Majella grainstone and the Saint-Maximin limestone: the velocity and first peak amplitude are normalized to their respective value in the dry state.
The evolution of the waveforms recorded during both experiments on Majella grainstone and Saint-Maximin limestone are reported in Figure 6. We highlighted two end-members: the red waveform is obtained at the beginning of the test when the rock is dry, and the dark blue one corresponds to the end of the test when the capillary front is well above the plane where the ultrasonic transducers are located. A drastic change in the waveform attributes is observed: the amplitude is strongly reduced and the frequency is lowered after imbibition. However, the comparison of the continuous evolution of the waveforms between the two end-members highlights a striking difference between both rocks. For Majella, a smooth transition is observed from one waveform to the other with a monotonic reduction of both amplitude and frequency, the waveform envelope being only slightly modified and the correlation remaining strong. Conversely for Saint-Maximin the evolution is more complex and characterized by a first increase of the amplitudes in the intermediate steps followed by a decrease in both amplitude and frequency.
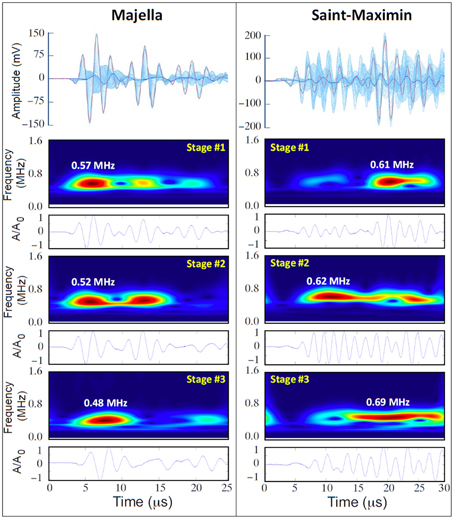
Figure 6. Superimposition of transmitted signals during imbibition tests on Majella and Saint-Maximin samples (the first waveform is displayed in red and corresponds to the dry sample and the last one is displayed in dark blue) and spectrograms with corresponding waveforms at different stages (stage #1: beginning of the test, stage #2: arrival of the water front near the sensor plane, stage #3: end of the test).
Additional insight on the frequency content of the waveforms can be gained by studying the spectrograms at three different stages:
Stage #1. corresponds to the start of the test when the rock is completely dry (red waveform);
Stage #2. corresponds to the intermediate stage where the properties are evolving quickly (Figure 5)—i.e., the capillary front is close to the transducers;
Stage #3. the moving front is well above the plane of the transducers (dark blue waveform).
Again we observe large differences between both rocks. The red color corresponds to the arrival of wavelets with the highest energy plotted with the same time scale as the waveforms in the upper plot. For Majella, two wavelets with high energy are actually present in the early stages, but one of them vanishes at Stage #3. The first arrivals carry the highest energy, and this is why the automatic detection of velocities and first peak amplitudes gives good results (Figure 5). A decrease in the frequency of the wavelet accompanied by a delay in arrival time is observed when going from Stage #1 to #3. For Saint-Maximin, the first arrivals carry very little energy, which explains why the automatic (and manual) detection of velocities and first peak amplitudes gave poor results (Figure 5). The highest energy is associated with a wavelet arriving much later, with a frequency higher than what was found for Majella. When imbibition proceeds, the first arrivals are still very weak, and there is no clear wavelet which can be identified, but rather consistent oscillations at slightly higher frequencies that spread over almost the entire length of the recordings. The picture is thus very different from what we have observed on the Majella grainstone: the complexity found in the Saint-Maximin limestone is probably due to the heterogeneity of this rock. To go further in the analysis of the recorded signals, one would need to do some wave propagation simulation taking into account the geometry of the propagation and the heterogeneity in the tested rocks.
Combined X-ray Imaging and Ultrasonic Monitoring
Finally we designed an experiment where we combine imbibition tests with acoustic monitoring and imaging under an X-ray CT scanner. The comparison of the density maps with the acoustic measurements allows one to explore how the physical properties of the tested rock are affected by fluid substitution with direct assessment of the position and geometry of the capillary front during imbibition.
Material and Methods
Two samples available in CSIRO were tested, the Saint-Maximin grainstone and the Savonnières limestone. The Saint-Maximin used for the test was different from the one presented in Section Ultrasonic Method for the Detection of Moving Capillary Fronts, however the tested samples had a similar porosity (37%, Baud et al. [16]) and permeability (2.1 D). The Savonnières limestone is a relatively homogeneous clean biogenic limestone (98% of calcite) with a porosity of 31.6% and a moderate permeability of 51.2 mD. The tested plug came from the same block used by Lopes et al. [18] and Pimienta et al. [19]. Both samples were cored in the direction parallel to bedding.
We used techniques similar to those presented in Section X-ray Imaging of Moving Capillary fronts: the sample is placed on a X-ray transparent stand providing a constant water level at the bottom end of the cylindrical rock specimen. The rock samples have a diameter of 38.1 mm and a length of 68.3 mm and 76.2 mm for the Saint Maximin and the Savonnières, respectively. Two pairs of ultrasonic sensors are glued with cyanoacrylate at two different heights (Figures 7B,C). The external diameter of the ultrasonic transducers is 9 mm. They are made of piezoceramic disks 5 mm in diameter, with a central resonant frequency of ~0.5 MHz. The surface of the transducers in contact with the rock is machined concave so as to match the cylindrical lateral surface of the specimen. Several ray paths were investigated (Figure 7C): plane 1 is the lower horizontal path (blue); plane 2 is the upper horizontal path (orange); inter-planes 1-2 (green) and 2-1 (purple) are oblique paths across planes 1 and 2. The P-wave arrival time, the amplitude of the first peak and the spectral content were analyzed on each recorded waveform using the same tools as in Section Ultrasonic Method for the Detection of Moving Capillary Fronts.
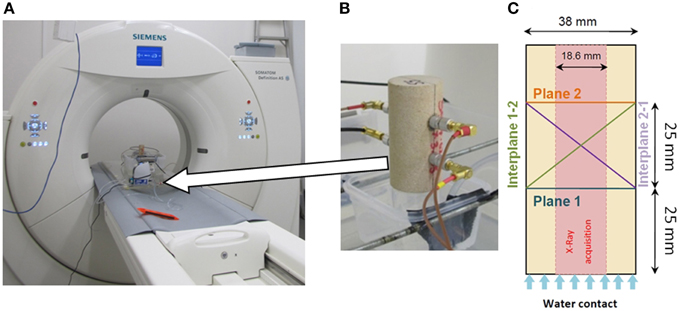
Figure 7. Experimental device used for imbibition tests coupling ultrasonic measurements with X-ray imaging. (A) X-ray CT scanner. (B) Sample on the water tank with four sensors glued on the lateral surface. (C) Scheme of the equipped sample: studied ray paths for ultrasonic monitoring and area covered by X-ray acquisition. Ultrasonic paths are in a plane perpendicular to X-ray cross-sections (32 cross-sections separated by 0.6 mm are simultaneously recorded during each acquisition).
During the imbibition test, the sample's volume is continuously scanned with an X-ray CT scanner (Siemens SOMATOM Dual Energy 64 slices, Figure 7A) following a helical pattern with an axis parallel to the specimen's axis. In this experiment, we used a 140 kV/300 mA single X-ray energy beam and a typical acquisition set is made of 32 parallel and simultaneous slices separated by 0.6 mm in the central part of the sample. To avoid artifacts related to the transducers interacting with the X-ray beams, the sample is imaged along vertical planes normal to the plane defined by the positions of the four transducers (Figures 7B,C). In contrast with the results reported in Section X-Ray Imaging of Moving Capillary Fronts, the 32 slices acquired with this apparatus can be reconstructed to generate a 3D image of the central part of the specimen at each scanning stage during the imbibition. The investigated volume is therefore a truncated cylinder 18.6 mm in width and 68.3 mm and 76.2 mm in height for Saint Maximin and Savonnières, respectively. Each scanning stage lasts 1 s and is repeated every 5 s. Note that during each 3D volume scanning (32 simultaneous slices), the capillary front keeps rising. The pixel size in each reconstructed image is 0.15 × 0.15 mm. ImageJ software package has been used to stack the longitudinal images for a selected set of reconstructed volumes. Out of each stacked volume, two slices normal to the sample axis at heights corresponding to the ultrasonic transducer planes are extracted. The mean gray level in a rectangular crop (185 × 125 pixels) of these slices is computed for selected scanning stages to assess, during the imbibition process, the local change in density of the specimen associated with water invasion.
At each X-ray scanning stage, waveforms transmitted through the rock specimen between the source and receiving ultrasonic transducers are recorded according to the ray paths described above.
Results
For the Saint-Maximin grainstone (Figure 8), waveforms corresponding only to horizontal ray paths have been recorded. The P-wave attributes (velocity and amplitude of the first peak) were normalized to their initial value in the dry state (Vp = 2740 m/s). The variations of the gray level within the transducer planes with respect to the initial (dry) state were calculated. Based on the velocity, amplitude and gray level variation with time in the Saint-Maximin specimen, seven noticeable imbibition stages were selected for further analysis, and the following observations can be made:
Stage #1. The amplitude of the P wave in plane 1 is the first parameter to be impacted (sharp decrease) by the moving capillary front. The decrease occurs when the capillary front appears to be ~6 mm below the location of the ultrasonic sensors (accounting for their actual diameter);
Stage #2. Both the velocity (decrease) and the gray level in plane 1 (increase) are impacted by the capillary front reaching plane 1;
Stage #3. Once the capillary front is about 10 mm above the sensors plane 1 (accounting for their diameter), the gray level, the P-wave velocity and amplitude remain constant;
Stage #4. The amplitude of the P wave in plane 2 decreases while the capillary front appears to still be located below the sensors;
Stage #5. Once the capillary front reaches the sensors in plane 2, both the P wave velocity and the gray level decrease;
Stage #6. The P wave velocity stabilizes while the capillary front appears located just above the sensors;
Stage #7. From that time on, all parameters are nearly constant in plane 2 except the gray level, which keeps on increasing slowly. The final P wave velocity after imbibition is Vp = 2630 m/s.
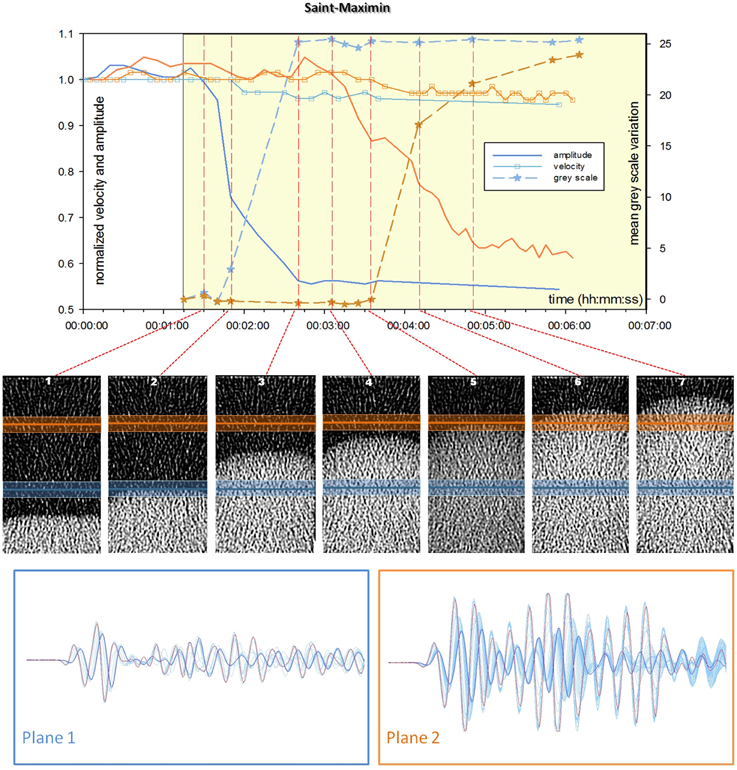
Figure 8. Results for the imbibition test on Saint-Maximin grainstone: evolution as a function of time of normalized velocity and first peak amplitude recorded on planes 1 and 2 and mean gray level value calculated along these planes on selected CT volume. Processed X-ray cross section located in the middle of the sample highlighting water front shape and position. Water is in contact with the bottom of the sample at 00:01:15. The lower part of the figure is a superimposition of transmitted signals during the test for planes 1 and 2 (the first waveform obtained on the dry sample is displayed in red, and the last one is displayed in dark blue).
The waveforms recorded in planes 1 and 2 are shown in Figure 8, with the same color coding as in Figure 6. Higher absolute P wave amplitudes were recorded in plane 2 compared to plane 1. Interestingly, except for the amplitude, the first periods of the waveforms recorded in planes are remarkably similar. However, the magnitude of the change in normalized P wave amplitude associated with the imbibition process is similar in both planes. A half period time shift is observed between the beginning (dry state) and the end of the imbibition process with only little change in frequency.
A similar analysis was carried out for the experiment on the Savonnières limestone (Figure 9). For this specimen, two additional oblique ray paths were recorded and analyzed (inter-plane rays 1-2 and 2-1). For sake of clarity we separated in Figure 9 the velocity plot from the amplitude/gray level plot. The first striking difference with the Saint-Maximin grainstone is that the Savonnières limestone exhibits no significant variation in P wave velocity which remains close to 3200 m/s. The second important difference is that the time scale for this experiment is much longer (2.5 h compared to 6 min). The fact that imbibition was much faster in the Saint-Maximin compared to the Savonnieres can be attributed to a difference in their microstructure, which impacts their macroscopic properties such as permeability (40 times lower for Savonnières) and therefore the balance between capillary and gravity forces [18]. Here five noticeable imbibition stages were selected for further analysis, and the following observations can be made:
Stage #1. The amplitude of the P wave in plane 1 decreases sharply once the capillary front appears to be ~3 mm below the sensors in the 3D images;
Stage #2. At this point the velocity along the inter-plane rays 1-2 and 2-1 as well as the gray level in plane 1 are impacted by the passage of the capillary front;
Stage #3. Once the capillary front appears to reach plane 1, the gray level and wave amplitude variations in that plane slow down;
Stage #4. When the capillary front appears to be located few millimeters above plane 1, the amplitude of the P wave reaches a plateau whereas the gray level keeps on increasing slowly;
Stage #5. The amplitude of the P wave in plane 2 decreases while the capillary front appears to be located a few millimeters below the sensors. Notice also that the amplitude of the P wave along both oblique paths decreases almost linearly between stages #2 and #5 and are very similar.
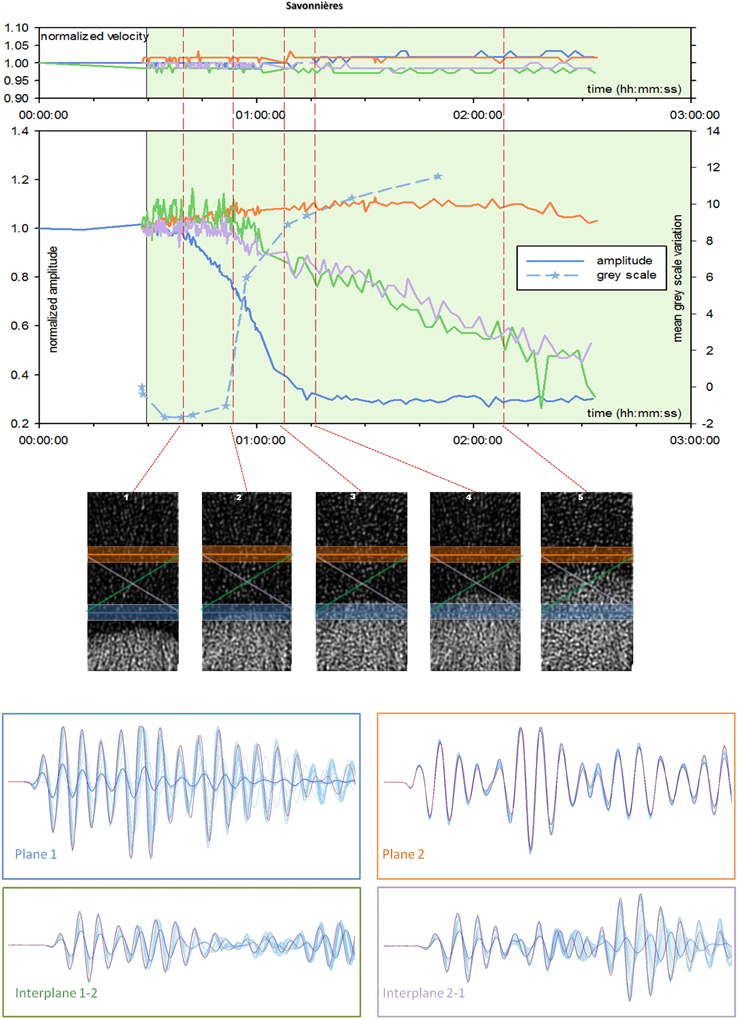
Figure 9. Results for the test on Savonnières limestone: evolution as a function of time of normalized velocity and first peak amplitude recorded on planes 1 and 2 and on interplanes 1 → 2 and 2 → 1 and mean gray level value calculated along plane 1 on selected CT volume. Water is in contact with the bottom of the sample at 00:29:20. The lower part of the figure is a superimposition of transmitted signals during the test for all planes and interplanes (the first waveform obtained on the dry sample is displayed in red and the last one is displayed in dark blue).
Consistently with the other tested rock (Figure 8), the P wave attributes, velocity and/or amplitude, are impacted by the water front approaching the sensors planes, before actually reaching it, as seen on the CT images.
The waveforms recorded in planes 1 and 2, and inter-planes 1-2 and 2-1 are shown in Figure 9. In plane 1, there is no significant change in the velocity during imbibition, only the amplitude of the arches is decreasing (no significant time shift). In plane 2, the amplitude remains nearly constant except at the very end of the experiment when the capillary front approaches the sensor plane. The shape of the waveforms recorded along both oblique paths, specially the first periods, remain remarkably similar during the imbibition process.
Figure 10 shows the spectrograms and associated normalized waveforms recorded on plane 1 for both samples at three different stages:
Stage #1. corresponds to the start of the test when the rock is completely dry (red waveforms on Figures 8, 9);
Stage #2. corresponds to an intermediate stage where the properties are evolving quickly—i.e., the capillary front is close to the transducers;
Stage #3. the moving front is well above the plane of the transducers (dark blue waveforms on Figures 8, 9).
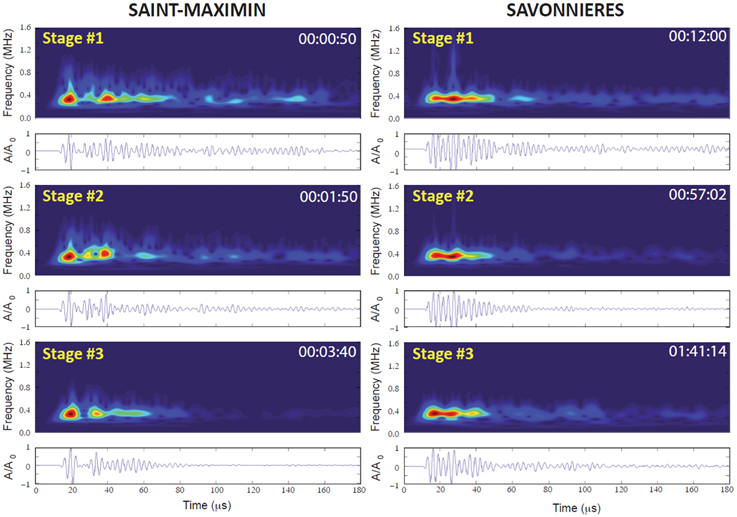
Figure 10. Spectrograms and corresponding normalized waveforms obtained at different reported times on plane 1 for the Saint-Maximin and Savonnières samples.
For Saint-Maximin, two wavelets with high energy are actually present in the stage #1, three wavelets can also be identified in the signal coda. The first wavelet carries the highest energy. When the water reaches the transducer plane, a slight migration of the second wavelength to lower flight time is observed and this feature tends to prevail in the later stage. However, the energy of the coda vanishes significantly in presence of water. The frequency content variation of the waveform allows in this case to clearly identify the water arrival. In contrast, the impact of the water front on the spectrogram of the Savonnières is not so obvious. The signal is indeed not significantly modified between stages #1 and #3. A slight migration of the highest energy from the second to the first wavelength can be noticed but the overall spectral signature of the waveform is unaffected by the water front. Again, it is difficult to state on the origin of these striking differences without proceed to wave propagation simulation accounting for the intrinsic sample heterogeneities and those induced by the fluid migration. In the Saint-Maximin experiment, the coda analysis may however provide insights on the front propagation.
The simultaneous acquisition of 32 slices on a truncated cylindrical volume (Figure 7C) every 5 s gives the opportunity to perform three-dimensional reconstructions of the capillary front at selected times. A single X-ray scanning lasts about 1 s, and water keeps rising along the specimen during this time so that the reconstructed 3D images are not strictly speaking static. If the velocity of the moving front is slow enough, i.e., the water/air interface is less than 0.15 mm/s (pixel size/time to acquire an image), we can consider that the geometry derived from CT scanning provides a realistic image of the capillary front at a given time. For the Saint-Maximin grainstone we chose to image the front using the data set obtained at the time corresponding to snapshots 1, 3, and 7 in Figure 8, and the results are shown in Figures 11A–C, respectively. For the Savonnières limestone, we selected the data sets corresponding to snapshots 1, 3, and 5 in Figure 9, and the results are shown in Figures 11D–F, respectively. Figure 11 shows at each selected time the geometry of the volume invaded by water, with the upper surface corresponding to the capillary front. To our knowledge it is the first time that such data on the three-dimensional geometry of capillary fronts are reported. For Saint-Maximin, we observe that during capillary rise the curvature of the front increases, but not symmetrically. This observation is in good agreement with the sharp decrease of the P wave amplitudes observed on plane 1 contrasting with a more progressive diminution on plane 2 (Figure 8). The other important information derived from such analysis is the “roughness” of the capillary front, which tends also to increase during water rise. This roughness can probably be associated to local fluctuations in capillary forces linked to the heterogeneous nature of the pore network in the rock. For Savonnières similar observation can be made. The geometry of the rising front is clearly evolving with time, and the “roughness” of the capillary front seems to be higher compared to Saint-Maximin.
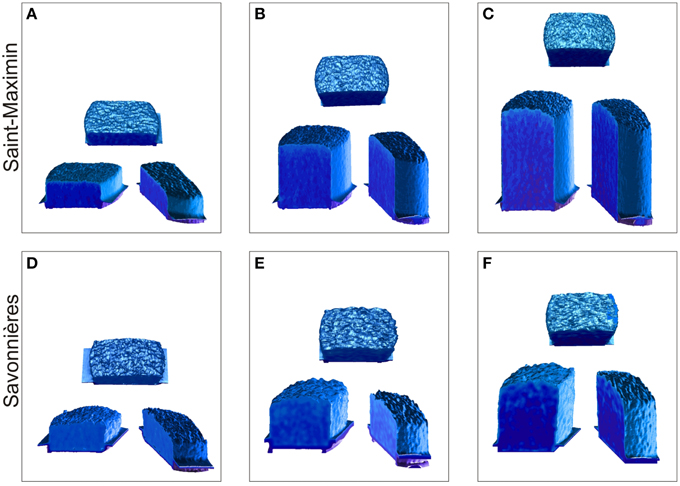
Figure 11. 3D side and top views of the region invaded by water at different times during imbibition in the Saint-Maximin (A–C) and the Savonnières (D–F) samples.
Discussion and Conclusion
This paper reports several experimental methods to monitor the dynamics of spontaneous capillary imbibition of water into dry porous rock samples.
(i) The standard weight method characterizes the mass intake dynamics. However, no detailed information is obtained on the geometry of the capillary front, except from observation of the dry-wet contact line at the sample surface. The coefficient of capillarity C can be estimated, and it was shown on a large data set that this parameter correlates reasonably well with permeability: an empirical relationship is proposed, k = 1.38 10−12 C2 with k in m2 and C in kg/m2/s1∕2.
(ii) The X-ray CT scan method characterizes the capillary front dynamics and geometry, providing information on the inner part of the sample during imbibition. We used a standard medical scanner to obtain one centered radiograph every 2.5 s. Another capillary parameter A which quantifies the kinetics of the fluid front motion is derived from such images. Knowing the water saturation and assuming a flat capillary front, it is then possible to relate A and C. However, these assumptions are not fulfilled in general. We show indeed that the geometry of the capillary front is rarely flat and that both the saturation and the geometry of the water front are evolving during capillary rise. Unfortunately it is not possible to combine the weight increase monitoring while X-ray CT scanning.
(iii) The ultrasonic monitoring method consists in recording waveforms between ultrasonic sensors glued at the sample surface during imbibition. Both the velocity and the amplitude of the P waves are impacted by the passage of the capillary front near the transducers plane. For both carbonate rocks tested in this study we found that velocity and amplitude of the first peak decrease when the water front approaches the sensors, but not simultaneously. In addition capillary rise impacts first the velocity for one rock, and the amplitude for the other. Spectrograms reveal that the frequency content is changing significantly during imbibition. This method can be coupled to the weight method.
(iv) The combined X-ray imaging and ultrasonic monitoring permits to precisely identify the impact of capillary rise on the evolution of ultrasonic wave attributes (velocity, amplitude, and spectral content). The position and geometry of the moving front can be assigned to each variation observed for one of these parameters. Our measurements show that the P wave amplitude (first peak) is impacted first and significantly, when the maximum height of the capillary front is well below the wave path. In a second time, a slight velocity decrease occurs. It is associated with the increase of the average gray level, i.e., of the sample density, along the sensor plane, which reveals the arrival of water. The last generation of X-ray CT scanner permits fast acquisition of multiple slices and allows to build 3D reconstructions of the volume invaded by the water, and therefore to get an image of the topology of the capillary front in 3D space.
Monitoring the waveforms during imbibition tests in the laboratory is definitely a powerful tool for detecting fluid motion in porous rocks. The sensitivity of the different wave attributes to such fluid motion is not the same: on the carbonate rocks tested here, the variation of the P wave amplitude is a clear precursory signal for the arrival of the fluid front, whereas velocity variations (with smaller magnitude) occur only when the front actually reaches the measurement planes. A possible explanation for this behavior is that the P wave amplitude might be affected by vapor adsorption on the minerals which changes the surface energy and the elastic moduli [20], therefore the ultrasonic velocities and possibly their amplitudes. Our results show that the P wave amplitude starts to decrease sharply when the capillary front is at a distance between 3 (for Savonnières) and 6 mm (for Saint-Maximin) from the ultrasonic sensors. Interestingly this distance is of the same order of magnitude as the size of the first Fresnel zone defined in wave propagation theory [21, 22]. This zone can be approximated for homogeneous and isotropic media by an ellipsoid with a major axis equal to the distance between the sensors D and two equivalent minor axes corresponding approximately to the wavelength λ of the P wave propagating in our rocks (λ~ 6 mm). This gives a half-width for the Fresnel clearance zone equal to about 3 mm below the sensor planes. Ray paths will be disturbed by the presence of “heterogeneities” in the Fresnel zone, like the arrival of the capillary front. The observed distances at which imbibition starts to impact the P wave propagation is of the same order as the size of the Fresnel zone estimated here. However, it is still an open question why the amplitude is impacted more and before the velocity. New results (currently being processed) from experiments done recently on other rocks confirm this observation. More work needs to be done to elucidate this particular point.
The methods applied in this paper rely on imbibition experiments on dry samples at ambient room conditions. Obviously, it remains an ideal case study but still far from in-situ conditions for which remote seismic monitoring is required. This study prefigures experimental programs aiming to simulate CO2 injection, underground storage of hydrocarbon and/or Enhanced Oil Recovery operation under stress and temperature where CT-imaging cannot be used. The results presented here provide primary information on the reliable attribute of ultrasonic signals to detect fluid motions in multiphase situation, such as amplitude evolution or modification of the waveform frequency content.
Conflict of Interest Statement
The authors declare that the research was conducted in the absence of any commercial or financial relationships that could be construed as a potential conflict of interest.
Acknowledgments
We thank Marie Claude Lynch for her help with the CT scanner at IFPEN, Lionel Esteban for his help with the CT scanner at CSIRO and Maxim Lebedev for discussions and technical support. We also acknowledge Linda Stalker from the National Geosequestration Laboratory (NGL) to authorize the use of the Dual-Beam CT Scanner. We have benefited from discussions on seismic wave propagation with Christophe Barnes (GIM-labs). The work on Nubia sandstones was possible thanks to Ville de Paris who granted a post-doctoral fellowship to BN during his stay at Cergy-Pontoise and ENS Paris. Finally many thanks to the reviewers.
References
2. David C, Menendez B, Mengus J-M. The influence of mechanical damage on fluid flow patterns investigated using CT scanning imaging and acoustic emissions techniques. Geophys Res Lett. (2008) 35:L16313. doi: 10.1029/2008GL034879
3. David C, Menendez B, Mengus JM. X-ray imaging of water motion during capillary imbibition in porous rocks. Part 1: methods, microstructures and mechanical deformation. J Geophys Res. (2011) 116:B03204. doi: 10.1029/2010JB007972
4. Pons A, David C, Fortin J, Menendez B, Stanchits S, Mengus JM. X-ray imaging of water motion during capillary imbibition in porous rocks. Part 2: influence of compaction bands. J Geophys Res. (2011) 116:B03205. doi: 10.1029/2010JB007973
5. Avseth P, Mukerji T, Mavko G. Quantitative Seismic Interpretation: Applying Rock Physics Tools to Reduce Interpretation Risks. Cambridge, UK: Cambridge University Press (2005).
6. Lumley D. 4D seismic monitoring of CO2 sequestration. Leading Edge (2010) 29:150–5. doi: 10.1190/1.3304817
7. Siebold A, Walliser A, Nardin M, Oppliger M, Schultz J. Capillary rise for thermodynamic characterization of solid particle surface. J Colloid Interface Sci. (1997) 186:60–70. doi: 10.1006/jcis.1996.4640
8. Olafuyi OA, Cinar Y, Knackstedt MA, Pinczewski WV. Spontaneous imbibition in small cores. Int J Pet Sci Technol. (2009) 3:65–82. doi: 10.2118/109724-MS
9. Nabawy B. Mechanical, Petrophysical and Magnetic Fabrics of the Nubia Sandstones in North Eastern Desert and Sinai and their Impacts on the Preferred Interstitial Fluid Paths. In: Internal Report, Ecole Normale Supérieure Paris (2010).
10. Labajos-Broncano L, Gonzalez-Martin ML, Bruque JM, Gonzalez-Garcia CM. Influence of the meniscus at the bottom of the solid plate on imbibition experiments. J Colloid Interface Sci. (2001) 234:79–83. doi: 10.1006/jcis.2000.7244
11. Casteleyn L, Robion P, Collin PY, Menendez B, David C, Desaubliaux G, et al. Interrelations of the petrophysical, sedimentological and microstructural properties of the Oolithe Blanche formation (Bathonian, saline aquifer of the Paris basin). Sediment Geol. (2010) 230:123–38. doi: 10.1016/j.sedgeo.2010.07.003
12. Cueto N, Benavente D, Martinez-Matrinez J, Garcia-del-Cura MA. Rock fabric, pore geometry and mineralogy effects on water transport in fractured dolostones. Eng Geol. (2009) 107:1–15. doi: 10.1016/j.enggeo.2009.03.009
13. Benavente D, Pla C, Cueto N, Galvan S, Martinez-Martinez J, Garcia-del-Cura MA. Predicting water permeability in sedimentary rocks from capillary imbibition and pore structures. Eng Geol. (2015). doi: 10.1016/j.enggeo.2015.06.003. (in press).
14. Wulff AM, Mjaaland S. Seismic monitoring of fluid fronts: an experimental study. Geophysics (2002) 67:221–9. doi: 10.1190/1.1451622
15. David C, Louis L, Menendez B, Pons A, Fortin J, Stanchits S, et al. X-ray imaging of fluid flow in capillary imbibition experiments – Influence of compaction and localized deformation. In: Alshibli KA, Reed AH, editors. Advances in Computed Tomography for Geomaterials – GeoX 2010. London: ISTE-Wiley (2010). p. 262–269.
16. Baud P, Vinciguerra S, David C, Cavallo A, Walker E, Reuschlé T. Compaction and failure in high porosity carbonates: mechanical data and microstructural observations. Pure Appl Geophys. (2009) 166:869–98. doi: 10.1007/s00024-009-0493-2
17. Pinnegar CR. Time-frequency and time-time filtering with the S-transform and TT-transform. Digit Signal Process. (2005) 15:604–20. doi: 10.1016/j.dsp.2005.02.002
18. Lopes S, Lebedev M, Muller TM, Clennell MB, Gurevich B. Forced imbibitions into a limestone: measuring P-wave velocity and water saturation dependence on injection rate. Geophys Prospect. (2014) 62:1126–42. doi: 10.1111/1365-2478.12111
19. Pimienta L, Esteban L, Sarout J, Liu K, Delle Piane C, Clennell MB. Experimental evidence of calcite dissolution and induced precipitation during supercritical CO2 residence. In: 76th EAGE Conference and Exhibition 2014. Amsterdam: RAI (2014a).
20. Pimienta L, Fortin J, Guéguen Y. Investigation of elastic weakening in limestone and sandstone samples from moisture adsorption. Geophys J Int. (2014b) 199:335–47. doi: 10.1093/gji/ggu257
21. Spetzler J, Snieder R. The Fresnel volume and transmitted waves. Geophysics (2004) 69:653–63. doi: 10.1190/1.1759451
Keywords: capillary imbibition, X-ray CT scanning, ultrasonic monitoring, sandstones, carbonates
Citation: David C, Bertauld D, Dautriat J, Sarout J, Menéndez B and Nabawy B (2015) Detection of moving capillary front in porous rocks using X-ray and ultrasonic methods. Front. Phys. 3:53. doi: 10.3389/fphy.2015.00053
Received: 30 April 2015; Accepted: 10 July 2015;
Published: 28 July 2015.
Edited by:
Renaud Toussaint, University of Strasbourg, FranceReviewed by:
Laurent Olivier Louis, New England Research, USAYannick Peysson, IFP Energies Nouvelles, France
Yves Gueguen, Ecole Normale Supérieure, France
Copyright © 2015 David, Bertauld, Dautriat, Sarout, Menéndez and Nabawy. This is an open-access article distributed under the terms of the Creative Commons Attribution License (CC BY). The use, distribution or reproduction in other forums is permitted, provided the original author(s) or licensor are credited and that the original publication in this journal is cited, in accordance with accepted academic practice. No use, distribution or reproduction is permitted which does not comply with these terms.
*Correspondence: Christian David, Laboratoire Géosciences et Environnement Cergy, Université de Cergy-Pontoise, 5 mail Gay-Lussac, F-95031 Cergy-Pontoise, France,christian.david@u-cergy.fr