Influence of Layering on the Formation and Growth of Solution Pipes
 Karine Petrus
 Piotr Szymczak
- Faculty of Physics, Institute of Theoretical Physics, University of Warsaw, Warsaw, Poland
In karst systems, hydraulic conduits called solution pipes (or wormholes) are formed as a result of the dissolution of limestone rocks by the water surcharged with CO2. The solution pipes are the end result of a positive feedback between spatial variations in porosity in the rock matrix and the local dissolution rate. Here, we investigate numerically the effect of rock stratification on the solution pipe growth, using a simple model system with a number of horizontal layers, which are less porous than the rest of the matrix. Stratification is shown to affect the resulting piping patterns in a variety of ways. First of all, it enhances the competition between the pipes, impeding the growth of the shorter ones and enhancing the flow in the longer ones, which therefore grow longer. This is reflected in the change of the pipe length distribution, which becomes steeper as the porosity contrast between the layers is increased. Additionally, stratification affects the shapes of individual solution pipes, with characteristic widening of the profiles in between the layers and narrowing within the layers. These results are in qualitative agreement with the piping morphologies observed in nature.
1. Introduction
The processes leading to the dissolution of a porous or fractured rock by a reactive fluid depend on a subtle interplay between the chemical reactions at mineral surfaces and fluid motion in the pores [1–3]. Strong, non-linear couplings between flow and dissolution may lead to the appearance of instabilities resulting in the formation of a variety of different geological patterns. Particularly relevant for the present study is the so-called reactive-infiltration instability [4, 5]: a relatively small change in pore geometry due to the dissolution may result in a variation of permeability, focusing the flow and leading to further changes in erosion. As a result, small inhomogeneities have a tendency to grow and get transformed into highly permeable, finger-like flow channels, which go by several different names depending on the field. In the petroleum industry, they are called “wormholes” [6] due to the resemblance with the tunnels dug by worms. Geologists call them “solution pipes,” “karst funnels,” or “geological organs” [1, 7, 8], whereas pedologists call them “soil tongues” [9].
Once formed, the channels continue to grow, focusing an ever-increasing portion of the flow, but also competing with each other: since the larger flow in the channel leads to increased dissolution—this again generates the positive feedback loop resulting in fast growth of the longer pipes and starvation of the shorter ones.
The flow-focusing instability has been known for a long time in the petroleum industry [10], where it was used to increase the effectiveness of reservoir stimulation techniques. In that context, it has also been studied experimentally [6, 11] and numerically [12–15]. In the physics community, the interest toward these systems has been sparked by classical papers of Daccord and Lenormand, which analyzed the patterns formed in a dissolving plaster and related them to other pattern-forming systems, such as diffusion-limited aggregation [16, 17]. In earth sciences, the understanding of the profound role that flow-focusing plays in karst development came with the pioneering works of Ewers [18], who has analyzed a number of analog models of karst formation made of sand or plaster of Paris. This has provided him with a number of important insights on the process of cave formation, and the role played in these processes by the competition between evolving flowpaths. Further insight into these effects has been provided by the numerical modeling of early stages of karst development [19–25].
Recent years have seen a growing number of experimental studies of dissolution-induced morphology evolution [26–29], many of them in the context of CO2 sequestration [30–38]. Since many of the potential reservoirs for CO2 storage are in carbonate strata, it is crucial to understand how the flow of CO2-acidified brine impacts the long-term changes in porosity and permeability of the reservoirs and how it affects the caprock properties. Most of the systems analyzed in these studies are relatively small (1 − 10 cm scale), however even at that scale a strongly non-uniform character of the dissolution manifests itself in a profound way, with the appearance of wormholing patterns. Due to the self-similar character of the flow-focusing process [24, 39], one expects to find the dissolution channels at all scales, up to the system size. And this is indeed the case, with the karst solution pipes appearing in many places throughout the world [1, 7, 8, 40, 41], most of them on 1–10 m scale, although much longer structures, up to kilometer length, have also been reported [42].
In this paper, we focus on solution pipes in karst systems, analogous to the ones depicted in Figure 1. In particular, we investigate the influence of rock stratification on the solution pipe growth. As it turns out, the presence of low-porosity layers impacts the shapes of the solution pipes, which tend to narrow as they cut through the layers and then widen up to form bulbous caverns. These features are visible in the pipes in Figure 1 and their detailed investigation is the goal of this study.
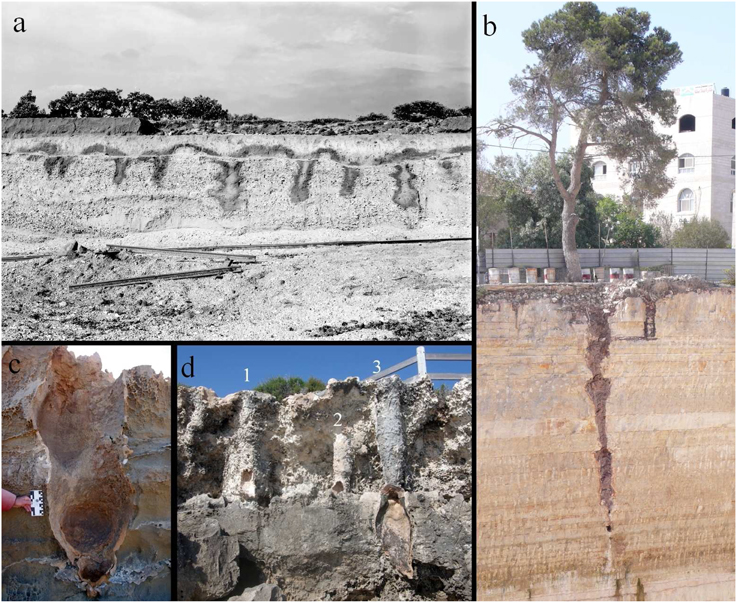
Figure 1. Examples of the solution pipe morphologies in stratified systems. (A) Solution pipes in gravel with limestone clasts: gravel-pit, west of Rauceby Station, UK. Photo by J. Rhodes courtesy British Geological Survey (catalog no. P206264). (B) Solution pipe in Ramallah, Israel, cutting through stratified dolomites with marl beds. The photograph is courtesy of Sebastian Schmidt of University of Göttingen. (C) Solution pipe cutting through layered limestone rock at Cape Bridgewater, Victoria, Australia (D) three pipes with cemented rims in limestone formations at Burns Beach, Perth, Australia. Pipe no. 3 cuts through the more resistant bed in the lower portion of the photo.
So far, the shapes of wormholes have been analyzed mainly in the context of acidization [11–13, 43, 44], where it has been established that they strongly depend on the flow rate and reaction rate. At low injection rates the growth of the dissolution channels is significantly influenced by diffusion and the resulting wormholes are conical-shaped. At higher flow rates the channels become more elongated—this regime is called in the acidization literature a “dominant wormhole” regime. In the geomorphological context, a systematic analysis of the lengths of solution pipes has been carried out by De Waele et al. [8], who have measured a collection of more than 200 solution pipes in the coastal areas of the Mediterranean and analyzed their length distribution, suggesting that it follows an exponential law. This data has been subsequently re-analyzed in Ref. [45], which led to the conclusion that—if one discards the partially buried pipes the full length of which remain unknown—the length distribution is found to be consistent with a power-law. Such scale-invariant distributions are a characteristic feature of a large number of hierarchical growth processes [46], observed experimentally e.g., in some of the viscous fingering systems [47, 48], dendritic side-branches growth in crystallization [49] or crack propagation in brittle solids [50].
To the best of our knowledge, the shapes of the solution pipes in the layered porous medium have not been analyzed in the literature. However, some of the insight into these questions can be gained from studying of the related problem of the growth of karst cutters [51, 52], i.e., solutionaly enlarged joints. The dissolution of cutters is somewhat different from that of solution pipes. In the former case the flow is focused from the very beginning within the joints, whereas in the latter the dominant flow pathways are created spontaneously due to the reactive-infiltration instability and the subsequent competition between the emerging wormholes. Nevertheless, some of the morphological features of the cutters and pipes seem to be similar. In particular, Howard [51] observes undulations on the sides of the cutters, which correlate with the strata and notes that cavernous widenings have the tendency to form predominantly beneath the layers. Analogous morphological characteristics are observed in the case of solution pipes (cf. Figure 1 and the numerical results of Section 3). Understanding of the mechanism underlying the formation of these features is one of the goals of this study. Additionally, we will also go beyond the scale of a single pipe and analyze the impact of the layering on the competition between different pipes for the available flow.
The paper is organized as follows. In Section 2 the Darcy-scale mathematical model of a dissolving porous rock is briefly recalled. In Section 3 we introduce the model of a stratified medium and analyze numerically its impact on the dissolution patterns. Finally, the conclusions are drawn in Section 4.
2. Governing Equations
Let us briefly recall the equations for the dissolution of a porous matrix [53]. The rate of groundwater flow through the porous medium is taken to be proportional to the pressure gradient (Darcy's law)
where u is the Darcy velocity, K-the permeability, μ-the viscosity of the fluid, ϕ-the porosity, and p-the fluid pressure. Here we will adopt the Carman-Kozeny relation for the permeability dependence on the porosity, K(ϕ) ~ ϕ3. We also assume that the Darcy velocity field is incompressible,
neglecting contributions to the fluid volume from reactants or dissolved products. Under typical geophysical conditions, dissolution is slow in comparison to flow and transport processes; we can therefore assume a steady state in both the flow and transport equations.
The concentration of the solute, c is calculated through the convection-diffusion-reaction equation
where D is the diffusion coefficient and R(c) is the reactive flux into the matrix. Finally, the erosion equation, which gives the increase of the porosity as a result of the dissolution, is
where csol is the mineral concentration of the solid species and R(c) is the reaction rate. Here, we assume a linear kinetic equation for the reaction rate
where k is the kinetic rate and s is the specific reactive surface area per unit volume that we assume to be constant, s = s0. Next, csat is the saturation concentration at which adding further solute results in precipitation. In the context of karst formation, c corresponds to the concentration of calcium ions, which controls the dissolution at moderate to large pH [54]. The Heaviside step function, θ(ϕmax − ϕ) guarantees that the reaction term vanishes in the region where all of the soluble material has dissolved (which corresponds to the porosity ϕ = ϕmax). In this region Equation (3) reduces to a convection-diffusion equation.
The above equations are supplemented by boundary conditions on the velocity and concentration field. Along the x direction (parallel to the flow):
and
which accounts for the applied pressure drop p0 and the inflow of unsaturated solution imposed at the inlet. In the case of solution pipes, the flow is mostly due to gravity. In the simulations, we keep the total volumetric flow rate through the system constant, and p0 is changed dynamically as the permeability of the system evolves. Along the y direction periodic boundary conditions are imposed. The above equations are solved numerically using a finite difference method, described in more detail in Ref. [23]. The initial porosity field is sampled from a lognormal distribution characterized by the standard deviation σ and the correlation length λ. In most of the simulations presented here, we choose a relatively small standard deviation of the initial porosity field, σ = 10−3.
The inverse of the specific surface area, is a characteristic length in our system, which will be chosen as a unit of length in all the reported data, with the dimensionless coordinates and defined as
On the other hand, the time is scaled by a characteristic dissolution time:
Finally, the dimensionless concentration is defined as
which is constrained to be in the interval (0,1). We also scale porosity by its maximum value, ϕmax,
The relative importance of convective, diffusive and reaction processes in the system are measured by the Péclet number and Damkölher number. The former is defined as [23]
and measures the ratio of the convective fluxes to the diffusive fluxes. Here u0 is the average Darcy flux in the initial system whereas ϕ0 is an initial porosity of the system. On the other hand, the Damkölher number
relates the surface reaction rate to the fluid flux.
As shown in a number of studies [11–13, 43, 55] the wormhole patterns depend strongly on the values of these two numbers. In particular, it has been shown that the Péclet number needs to be large enough for the instability to occur. This is why piping is often observed in unconsolidated rock and gravel, where the permeabilities (and thus flows) are large [56].
3. Dissolution of a Stratified Medium
To study the influence of stratification on pipe shapes and dynamics, we have adopted a simple conceptual model of a stratified medium (see Figure 2). The porous medium is assumed to consist of alternate layers of higher and lower porosity, ϕa (of depth La) and ϕb (of depth Lb), respectively. The two parameters characterizing such a setup are the porosity ratio C = ϕa∕ϕb and the length ratio κ = La∕Lb. In the following, we limit ourselves to two dimensions. However, the same methodology can be applied to the analysis of the 3D system, which will be the subject of a further study.
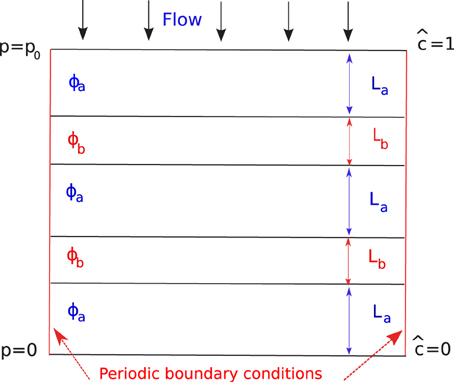
Figure 2. Schematic of a model of stratified medium: alternating layers of porosities ϕa and ϕb.
Figure 3 presents the results of the dissolution simulations for such a system for Pe = 100, Da = 0.5 with a porosity contrast of C = 2 and length ratio κ = 5. The characteristic undulations in the shape of the dissolution pipes are clearly visible here—the pipes become narrower in the less porous layers and widen up in between the layers. Another effect, clearly observed in Figure 3 is that the less porous layer acts as a dissolution barrier, which stops the growth of shorter pipes, as there is not enough reactant transported through their bodies to be able to break through the layer. As a result, the tips of the shorter pipes often coincide with the layer boundary. This effect can also be observed in Figure 1D, where only the longest pipe (pipe no. 3) has succeeded in breaking through the packed layer.
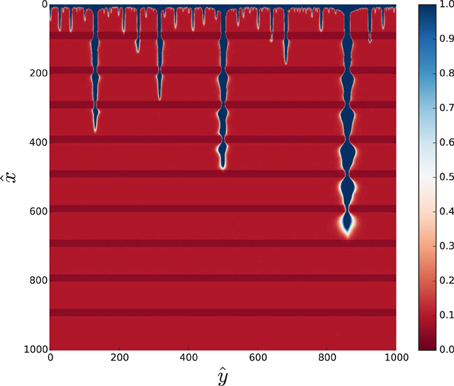
Figure 3. Solution patterns at Pe = 100, Da = 0.5, the porosity contrast C = 2 and length ratio κ = 5 for a domain of the size . The colors represent rescaled porosity, , as indicated in the colorbar on the right.
3.1. Flow and Concentration Fields Near the Tips of the Pipes
Some insights into the mechanisms underlying this behavior can be obtained by the analysis of the flow and concentration fields in the vicinity of the tip of the pipe. These are shown in Figures 4, 5 for three different positions of the tip with respect to the layers: the pipe terminating in a porous region between the layers (left panels), the pipe terminating within the packed layer (center panels), and the pipe emerging from the packed strata (right panels).
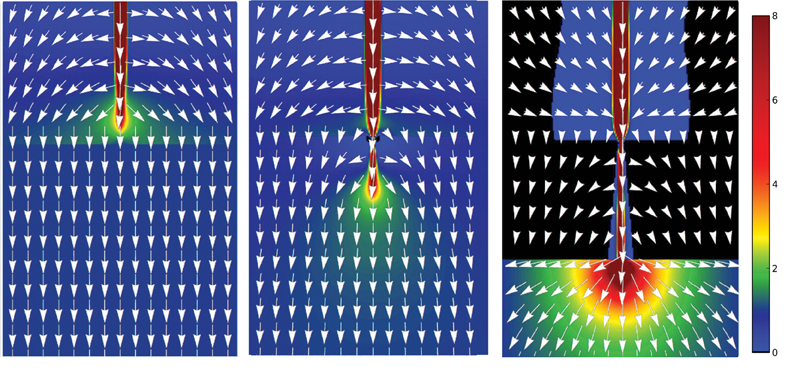
Figure 4. The Darcy flow field around the tip of the pipe before hitting one of the layers (left), with the tip located within the layer (center), and after emerging from the layer (right). The colors represent the magnitude of the flow scaled by v0. The lengths of the vectors in the overlaying vector plot has been scaled to v(x, y)1∕5 to aid visualization.
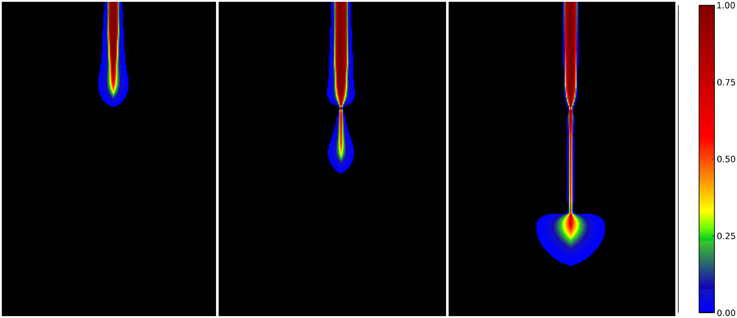
Figure 5. The concentration field, ĉ(x, y), around the tip of the pipe at the same times as in Figure 4.
There are several things to be noted here. First of all, since the permeability of the pipe is much larger than that of the surrounding medium, the tip of the pipe is a local pressure maximum, distributing the flow to the porous matrix, both in the axial and in lateral direction (cf. Figure 4). However, due to the small permeability of the matrix in the packed layers, the lateral flows are diminished when the pipe enters a layer (center panel of Figure 4) with respect to the situation when the tip find itself in a more porous layer (left panel of this Figure 4). Smaller lateral flows give rise to a narrower region of elevated concentration (cf. Figure 5), which decreases the diameter of the pipe as it enters the packed strata.
Next, as the pipe emerges from the layer, the flow is distributed almost uniformly over a semi-circle in the downstream direction with the tip as its center, analogously to the flow created by the point source at the wall (right panel of Figure 4). The unsaturated solution is carried deeper into the matrix (right panel of Figure 5) which gives rise to a significant widening of the pipes as they emerge from the layer. However, as the pipe tip moves away from the layer, this effects weakens and the pipe comes back to its original width.
As observed in Figure 5, the undersaturated solution is concentrated along the length of the pipe with a halo around the tip. However, since the inside of the pipe is fully dissolved (with ϕ = ϕmax), the reaction term vanishes there and the concentration is simply transported along the length of the pipe. The situation changes in the vicinity of the tip, where strong lateral currents push the undersaturated solution into the undissolved matrix. This is amply illustrated in Figure 6, where we plot the time derivative of the porosity field, , which marks the regions of the active reaction. Comparing Figure 6 with the corresponding concentration field (right panel of Figure 5), we see that the dissolution is mainly taking place around the tip and in a thin layer along the perimeter of the pipe.
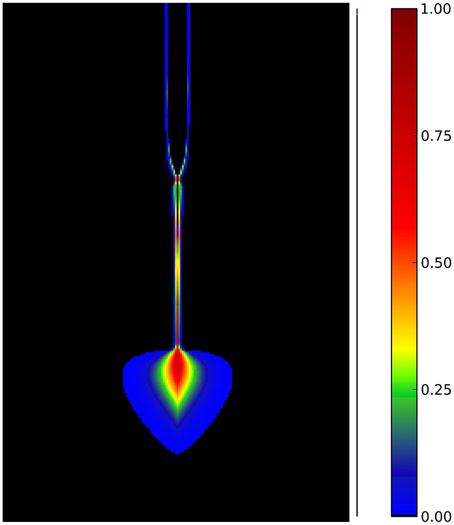
Figure 6. The porosity change, , corresponding to the concentration field in the right panel of Figure 5.
3.2. Comparison with Natural Systems
The characteristic undulations of the solution pipes observed in the simulations are consistent with the features observed in natural systems. Figure 1A presents a number of spontaneously formed solution pipes in gravel with limestone clasts. Undulations in different pipes are spatially correlated, which suggests the presence of at least three layers in this system. The dark rims along the perimeter of the pipes are most likely the result of clay and iron oxide accumulation due to the illuviation processes [57]. The clay particles are transferred by water from the upper parts of the soil and then flocculated at the clay-limestone boundary, where the pH changes from mildly acidic to alkaline. Such rims are commonly seen in solution pipes in which the infill is still present [7, 58].
In Figure 1B we see a solitary solution pipe, which might have been triggered by the presence of the tree. In fact, stemflow is usually significantly more acidic than incident precipitation [59] and thus it is often considered as one of the factors speeding up solution pipe formation [40, 41]. The pipe in Figure 1B cuts through several dolomite layers, with characteristic widenings, very similar to those observed in the numerical simulations. Finally, Figures 1C,D show the pipes formed in beach calcarenites in southern and western Australia. Again, the narrowings and widenings of the pipes as they cut through the layers are clearly visible here.
3.3. Hierarchical Growth of the Pipes and Their Length Distribution
The value of porosity contrast has a profound impact on the patterns, as it affects the intensity of the competition between the growing pipes. As observed in Figure 7, as C gets larger the number of long pipes in the system diminishes and the number of short ones increases. This means, however, that the longest pipes are getting significantly more flow in these systems (since the flow is then distributed between a smaller number of pipes). As a result, the longest pipe grows faster in the stratified systems with a large porosity contrast.
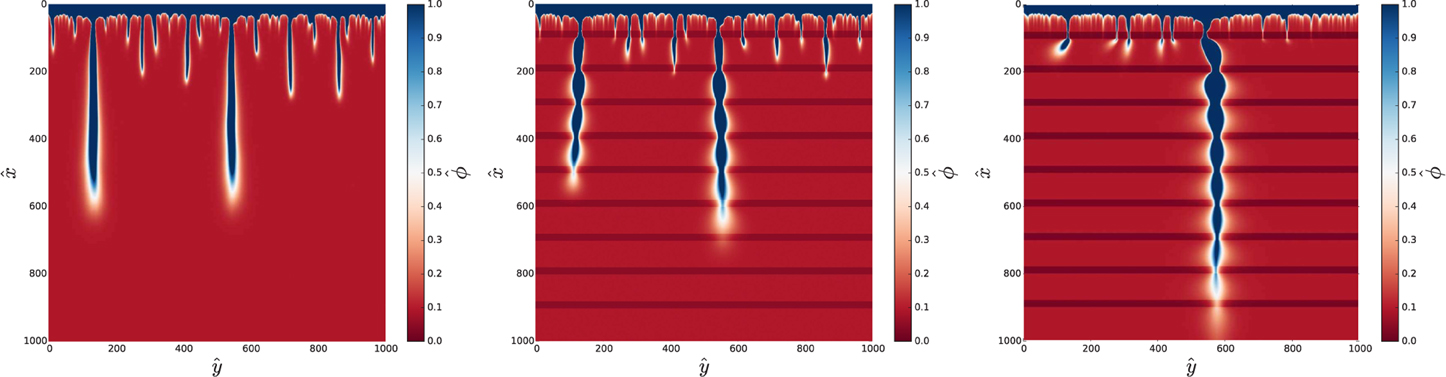
Figure 7. Piping patterns for C = 1 (no layers, left), C = 2 (center), and C = 4 (right) for Pe = 100, Da = 0.1, and κ = 5.
These observation can be quantified by the analysis of the distribution of the lengths of the pipes. As shown in a number of studies [24, 39, 45] a strong screening between the dissolution channels usually leads to the power-law distribution of their lengths,
where N denotes a number of pipes longer than Lp. In a homogeneous system, the exponent α is close to unity [24, 39, 45]. Figure 8 shows the length distributions corresponding to the patterns presented in Figure 7. In the homogenous case (C = 1) the results are in full agreement with the earlier studies, indicating distribution over the entire length range. However, the situation is different for the layered system. The region characterized by the power-law distribution is now much narrower followed by a clearly visible shoulder in the distribution extending up to the location of the first layer (at ), which corresponds to the surplus of pipes which have been stopped in their growth by the presence of the layer. Additionally, the power-law exponents for the layered case are significantly larger than 1, which confirms that the stratification indeed increases the screening between the pipes.
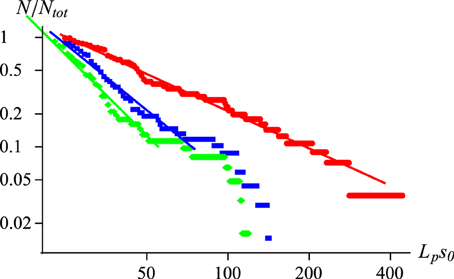
Figure 8. The cumulative distribution N(L) of solution pipe lengths for the patterns presented in Figure 7 with C = 1 (red points), C = 2 (blue), and C = 4 (green). The solid lines have slopes of 1.02 (red), 1.95 (blue), and 2.45 (green).
A quantity directly linked to the length distribution is the mean spacing between adjacent active pipes (i.e., pipes which continue to grow due to the presence of undersaturated solution). The initial spacing between the spontaneously formed pipes is determined by the spectral characteristics of the reactive-infiltration instability [4, 23, 60], which triggers the pipe formation process. Soon, however, the competition between the pipes for the available flow leads to the starvation of the shorter ones and the spacing between active pipes increases. Note that for the power-law length distribution (15) the characteristic separation between pipes of length Lp is equal to , where Ly is the width of the domain. Hence, the increase of α exponent in the stratified case results in a larger spacing between the active pipes.
Before we move on, let us analyze the impact of the amplitude of the initial noise on the dissolution patterns. Figure 9 presents the same systems as in Figure 7 but with a much higher standard deviation, σ = 0.15. As observed, the pipes are now much more irregular and winding, but the overall patterns are very similar to those in Figure 7. This conclusion agrees with a more detailed analysis of Upadhyay et al. [45] which shows that the statistical properties of the dissolution patterns are only weakly sensitive to the parameters governing the randomness in the initial porosity field. In the remainder of the paper, we focus on the low-noise regime, since a more regular geometry of the pipes in this case allows us to better discern the effects of the stratification of the porous matrix.
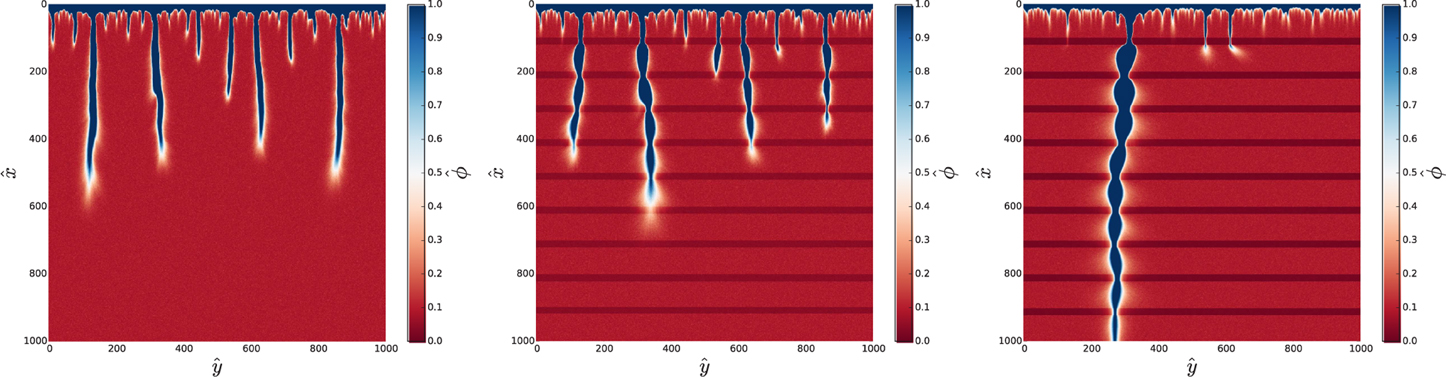
Figure 9. Same as in Figure 7 but for a larger value of the initial noise.
3.4. Two-Pipe Case
To get more insight into the nature of the competition process, we have considered a case in which two pipes grow symmetrically at equal distances from the centerline of the system. To trigger the growth of the solution pipes at these places, small regions of increased porosity (“pipe seeds”) have been placed in an initial porosity field. These seeds have a length of 3% of the system length and are placed at Ly∕4 and 3Ly∕4, respectively. Although the seeds are equal at the beginning, small noise in the initial porosity field triggers the instability which eventually leads to one of them outcompeting the other, as shown in Figure 10.
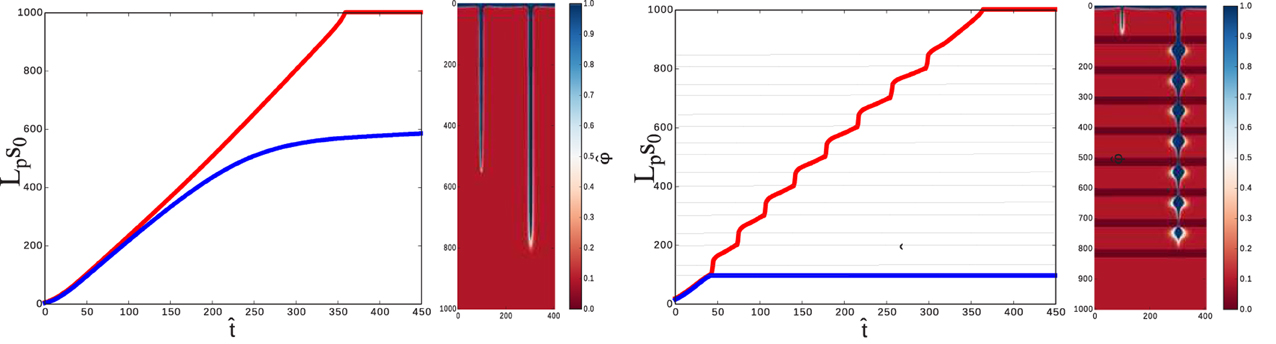
Figure 10. The positions of the pipe tip vs. time in a two-pipe system in non-stratified (left) and stratified case. Red color marks the faster, winning pipe, and blue - the slower one. The 2d contour-plots show the corresponding dissolution patterns.
An intriguing observation inferred from Figure 10 is that in the low porosity layers the speed of the pipe growth increases. This is connected with the narrowing of the pipe in the packed layers and the related increase of the axial fluid velocities. This is a strong effect, which allows the pipe tip to advance faster, even though locally, at each specific point of the packed strata, the total amount of rock to dissolve is larger than at a corresponding point in the less porous layers.
Another observation is that—in the stratified case—just after the growth of the shorter pipe is stopped, the longer pipe starts to grow faster, since it is getting a larger fluid flux. Its speed is higher than that in the case of non-stratified medium (for example, at it reaches whereas the tip of pipe in a non-stratified medium is located at at the same time). With time, however, the growth of the longer pipe in a stratified medium becomes impeded.
To understand the origin of such a slowdown of the dissolution in the stratified case, we have analysed the concentration profiles along the centreline of the winning solution pipe. Figure 11 presents such profiles for non-stratified medium at Pe = 8 and Pe = 100 and for stratified medium (C = 10, κ = 5) at Pe = 100. As observed, the undersaturation gradually decreases along the centreline. Since there is no reaction inside the pipe (the material there is fully dissolved), such a decrease must be connected with the diffusion of the calcium ions from the sides of the wormhole (where the reaction takes place) toward its center. This is further confirmed by the fact that the centreline concentration profile is strongly dependent on the Péclet number, with a characteristic lengthscale which is a function of the flow rate and diffusion within the pipe (cf. the left and center panel of Figure 11). In fact, the influence of Péclet number on the flow within the pipe is twofold. First, the total fluid flux through the cross-section of the pipe is smaller as Pe decreases. Second, the characteristic value of the local Darcy velocity within the pipe is further diminished, since the pipe diameter gets larger with the decreasing Pe.
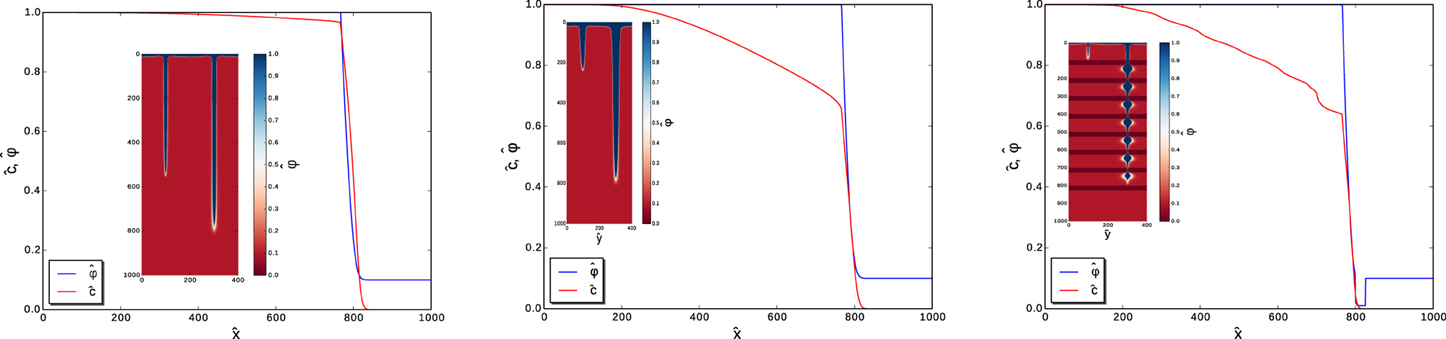
Figure 11. Concentration (red) and porosity (blue) profiles along the line y = 3∕4Ly, corresponding to the centreline of the winning pipe. Left: non-stratified case at Pe = 8, center: non-stratified case at Pe = 100, right: stratified case at Pe = 100.
Interestingly, in the stratified case, such a “diffusive” effect within the solution pipes is significantly stronger, and the profile at Pe = 100 (right panel of Figure 11) has now a decay rate similar to than in the Pe = 8 case in non-stratified medium. Although the quantitative model of this behavior still needs to be developed, the most plausible explanation is connected to the presence of widening in the pipe shape due to the stratification. The undulated shape has a much larger perimeter than its smooth counterpart, which increases the total diffusive flux of the calcium ions from the pipe walls.
3.5. Effects of the Layer Thickness, Porosity Contrast, Péclet, and Damkölher Number on the Dissolution Patterns
Let us now analyze the influence of the thickness of the packed layer on the wormhole shape. Figure 12 compares the shapes of the pipes which emerge in the system with a single packed layer of two different widths. There are several things to be noted here. First, the shape of a bulbous widening carved by the pipe as it emerges from the layer is independent of the layer thickness. Similarly, the width of the pipe at the end of the packed layer, just before the emergence, again seems to be thickness-independent. The main differences between the shapes are visible in the upstream region: whereas in the thick-layer case the pipe is seen to have a necking at the entrance of the packed strata, its counterpart in the thin-layer case bulges out slightly, first widening and then gently narrowing as it approaches the layer.
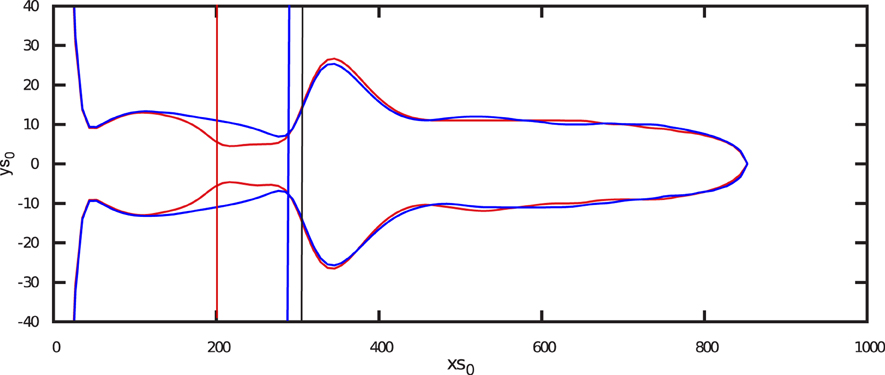
Figure 12. Influence of thickness of the layer on the wormhole shape (Pe = 100, Da = 0.1, C = 10). The solution pipe in red corresponds to the case where the layer extends from the red vertical line to the black vertical line. The solution pipe in blue corresponds to the case where the layer extends from the blue line to the black line. Note that the aspect ratio of the plot has been altered to better visualize details.
Next, let us investigate how the shapes of the pipes are affected by the values of porosity contrast C and the Damkölher number, Da. To this end we have carried out a number of simulations on the 1000 × 400 system with Pe = 100 and Da = 0.1 with different porosity contrasts (1 < C < 4) followed by a series of simulations with fixed C = 10 and different Da. The resulting wormhole shapes are presented in Figures 13, 14, respectively.
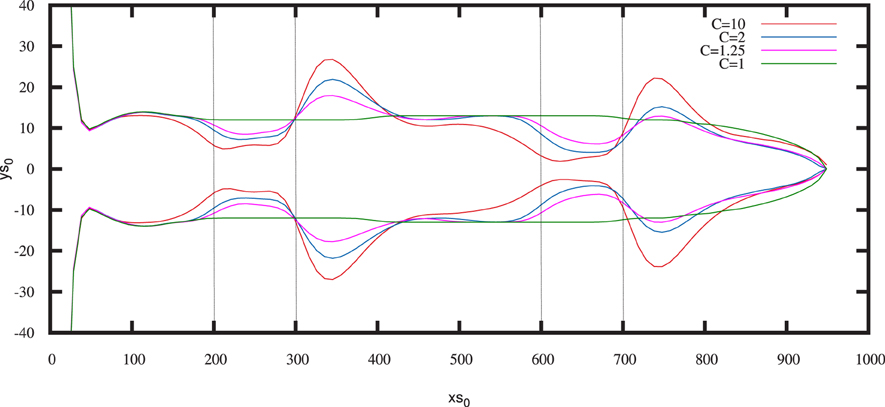
Figure 13. Piping patterns for different contrasts of porosity (as marked) for Pe = 100, Da = 0.1. The aspect ratio of the plot has been altered to better visualize details.
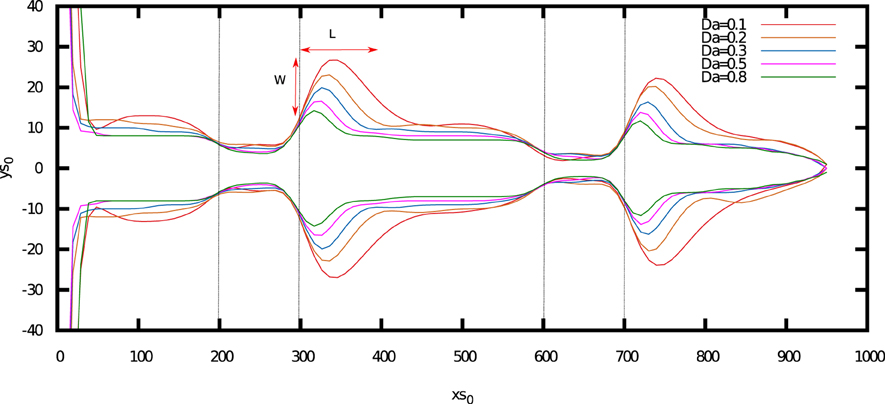
Figure 14. Piping patterns for different Damkölher numbers for a stratification with a porosity contrast of C = 10. The aspect ratio of the plot has been altered to better visualize details.
A porosity contrast is seen to affect the patterns in a significant way. Whereas, in the non-stratified case the pipe has a very regular, cigar-like shape, introduction of even a small porosity contrast (C = 1.25) results in the appearance of pronounced undulations. Their amplitude increases with C-the pipes narrow down progressively in the packed layers and then widen up in the next porous zone, following the rule that the greater the narrowing, the more pronounced the subsequent widening. This can be rationalized by noting that—due to mass conservation—a small diameter of a pipe entails large flow velocities, which then get diverted in the lateral direction as the pipe emerges from a packed layer, resulting in larger cavities. Interestingly, after the bulge, the pipes quickly come back to their original widths, which do not seem to depend on the porosity contrast.
Furthermore, a close inspection of Figure 13 reveals that the pipe begins narrowing already at some distance upstream from the low porosity layer and the higher the contrast is, the earlier the narrowing is taking place. It is particularly pronounced in the space between the first and the second layer—e.g., the C = 10 pipe (marked by an orange curve) begins to narrow down just after it has emerged from the bulge, whereas C = 2 and C = 1.25 pipes continue to grow for a while with a constant width, before eventually narrowing.
Let us now analyze Figure 14, which shows the influence of the Damkölher number on the pipe shapes. Strikingly, in this case the wormholes seem to have the same basic shape and the effect of Da comes down to the appropriate rescaling: the smaller the Da number, the larger the widenings of the pipe. In order to quantify these effects, we have measured the width and length of the bulbous widening (W and L in Figure 14) starting from the point where all of the pipe outlines overlap. Both W and L are plotted as a function of the Damkölher number in Figure 15. Interestingly, both seem to scale like , which can be understood in terms of a simple model in which we assume the tip of the pipe emerging from the packed layer distributes the flow uniformly in the semi-circle (−π∕2 < θ < π∕2). The Darcy flux near the tip is then
where r is the position vector in the polar coordinate system centered at the tip and Q = v0Ly is the total fluid flux in the system (which we assume to be focused in the pipe). Since the flows within the pipe are high, we can neglect diffusion and obtain from the transport equation (near the tip).
the solution of which reads simply
with a characteristic decay length given by
which indeed gives the Da−1∕2 scaling, as observed in the simulations. Using Ly = 400 (which corresponds to the width of the system in Figure 13), we get the coefficient of 11.3 in this power-law. The difference between this value and the values reported in the fits in Figure 15 (i.e., 6.5 and 41.5 respectively) is connected with the highly simplified character of the model. In reality, the outflow from the tip is expected to be anisotropic, with a larger flux directed along the axial direction [which is in fact reflected in a larger value of the coefficient of the L scaling (41.5) with respect to that of the W scaling (6.5)]. Next, the scaling Equation (19) has been derived for the concentration field. Porosity increase, however, is proportional to a time integral of the concentration [cf. Equation (4)]. Hence, in principle, one would need to know the entire time evolution of the c field to be able to estimate the respective porosity growth. However, as illustrated in Figure 6, the dissolution is active almost exclusively in a small region at the tip of the pipe. Hence, the cavern grows over a relatively short time only, T = L∕V, where V is the growth velocity of the pipe. Our approximation then corresponds to neglecting the flow and concentration changes over that time.
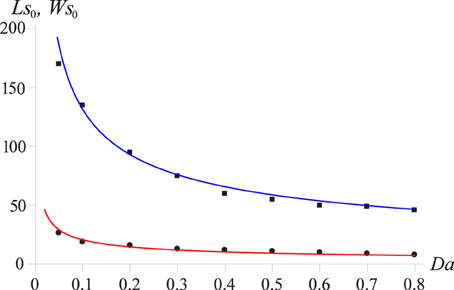
Figure 15. The width (W) and length (L) of the widenings, as marked in Figure 13, as a function of the Damkölher number. The points represent the simulation data, whereas the curves are fit to dependencies: (blue curve) and (red curve).
Moreover, the assumption that the flow from a pipe breaking through the layer corresponds to a point source at the wall is expected to hold only at large values of the porosity contrast, C. There are two reasons for this. The first is that at large C the narrowing of the pipes in the packed layers is more pronounced. Second, the smaller C ratios mean that a larger portion of the flow is transported through the porous matrix in the layer. By performing the simulations at different porosity contrast we have checked that the scaling (19) indeed deteriorates progressively as C is decreased, with both L and W decreasing less pronouncedly with Da.
It is worth noting that in three dimensions, an analysis analogous to Equations (16–19) would yield Da−1∕3 scaling, thus the dependence on the dissolution rate is weaker in 3D.
Finally, let us discuss the influence of the Péclet number on the patterns. Figure 16 presents the counterpart of Figure 7 for a relatively small value of the Péclet number (Pe = 1). Arguably the most pronounced effect that the decrease of the flow rate has on a dissolution patterns is the change of the overall shape of the pipes. Instead of the linear structures, the pipes are now more conical, with the diameter tapering toward the tip. However, the effects of the stratification remain qualitatively similar to those at higher Pe, with characteristic undulations superimposed on the conical shapes of the pipes. Getting back to the natural examples of Figure 1 we can infer that the pipe in Figure 1C has been formed at a relatively small value of Pe, since the tapering is clearly visible here, whereas more linear forms of Figures 1A,B,D are probably associated with higher Péclet numbers.
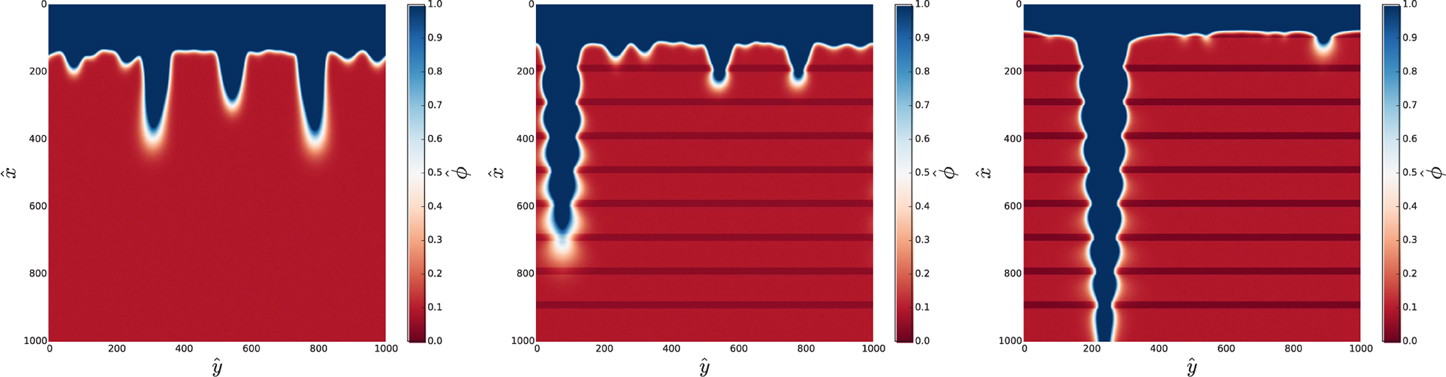
Figure 16. Piping patterns for C = 1 (no layers, left), C = 2 (center), and C = 4 (right) for Pe = 1, Da = 0.1 and κ = 5.
4. Conclusions
In this paper, we have been analyzing the formation of solution pipes in stratified soluble rocks. We have shown that stratification influences the dissolution patterns in a significant way. By serving as a flow and dissolution barrier, the packed layers impede the growth of the shorter pipes and direct the entire fluid flux into the winning pipes. This affects the distribution of pipe lengths, which becomes steeper as the porosity contrast between the layers is increased.
Interestingly, the shapes of the pipes itself are also affected by the stratification, with characteristic narrowings within the packed layers and large bulbous widenings, carved by the pipes as they emerge from the layers. We have connected the appearance of these forms to the interplay of flow and dissolution in the pipes. In particular, we have argued that as the pipe emerges from a packed layer, the flow rate around its tip resembles that produced by a point source near a wall. Large lateral currents result then in a dramatic widening of the pipe. In two dimensions, the radius of a cavity thus formed is, to a first approximation, inversely proportional to the square root of the Damkölher number.
The results presented here can help in the interpretation of the natural patterns, such as those in Figure 1. For example, if one can measure the porosity and permeability contrast between the layers, as well as estimate the reaction rate based on the petrography of the rock, then the diameters of the pipes in the widest point can be used to estimate the flow conditions under which these structures were formed. Conversely, if the flow conditions can be guessed then these data can be used to calculate the permeability contrast in the layers.
Conflict of Interest Statement
The authors declare that the research was conducted in the absence of any commercial or financial relationships that could be construed as a potential conflict of interest.
This manuscript was edited by Bjornar Sandnes; a Topic Editor of the Research Topic Flow and Transformations in porous media, in the absence of bias and to the high standards of ethical conduct expected by Frontiers.
Acknowledgments
The authors benefited from discussions with Tony Ladd, Andrew Farrant, Sebastian Schmidt, Elena Abarca, Agnieszka Budek, Paweł Kondratiuk and Michał Pecelerowicz. Tony Ladd is also acknowledged for his finite-difference code dissol, which has been used in the simulations. Sebastian Schmidt is gratefully acknowledged for the photo and helpful discussion. We also thank Ken Grimes and Matej Lipar for their invaluable help with the exploration of solution pipes in southern and western Australia. KP acknowledges funding from the European Union Seventh Framework Programme for research, technological development and demonstration under grant agreement no 316889. PS acknowledges the support from National Science Centre (Poland) under research Grant No. 2012/07/E/ST3/01734.
References
3. Jamtveit B, Meakin P. Growth, Dissolution and Pattern Formation in Geosystems. Dordrecht: Springer (1999).
4. Chadam D, Hoff D, Merino E, Ortoleva P, Sen A. Reactive infiltration instabilities. IMA J Appl Math. (1986) 36:207–21.
5. Ortoleva P, Chadam J, Merino E, Sen A. Geochemical self-organization II: the reactive-infiltration instability. Am J Sci. (1987) 287:1008–40.
6. Hoefner ML, Fogler HS. Pore evolution and channel formation during flow and reaction in porous media. AIChE J. (1988) 34:45–54.
7. Walsh P, Morawiecka-Zacharz I. A dissolution pipe palaeokarst of mid-Pleistocene age preserved in Miocene limestones near Staszów, Poland. Palaeogeogr Palaeoclimatol Palaeoecol. (2001) 174:327–50. doi: 10.1016/S0031-0182(01)00317-0
8. De Waele J, Lauritzen SE, Parise M. On the formation of dissolution pipes in quaternary coastal calcareous arenites in mediterranean settings. Earth Surf Proc Land. (2011) 36:143–57. doi: 10.1002/esp.2022
9. Yehle LA. Soil tongues and their confusion with certain indicators of periglacial climate [Wisconsin]. Am J Sci. (1954) 252:532–46.
11. Fredd CN, Fogler HS. Influence of transport and reaction on wormhole formation in porous media. AIChE J. (1998) 44:1933–49.
12. Panga M, Ziauddin M, Balakotaiah V. Two-scale continuum model for simulation of wormhole formation in carbonate acidization. AIChE J. (2005) 51:3231–48. doi: 10.1002/aic.10574
13. Cohen C, Ding D, Quintard M, Bazin B. From pore scale to wellbore scale: impact of geometry on wormhole growth in carbonate acidization. Chem Eng Sci. (2008) 63:3088–99. doi: 10.1016/j.ces.2008.03.021
14. Maheshwari P, Ratnakar RR, Kalia N, Balakotaiah V. 3-D simulation and analysis of reactive dissolution and wormhole formation in carbonate rocks. Chem Eng Sci. (2013) 90:258–74. doi: 10.1016/j.ces.2012.12.032
15. Ishibashi T, McGuire T, Watanabe N, Tsuchiya N, Elsworth D. Permeability evolution in carbonate fractures: competing roles of confining stress and fluid pH. Water Resour Res. (2013) 49:2828–42. doi: 10.1002/wrcr.20253
16. Daccord G. Chemical dissolution of a porous medium by a reactive fluid. Phys Rev Lett. (1987) 58:479–82.
18. Ewers RO. Cavern Development in the Dimensions of Length and Breadth. Ph.D. thesis, McMaster University (1982).
19. Groves CG, Howard AD. Early development of karst systems. I. Preferential flow path enlargement under laminar flow. Water Resour Res. (1994) 30:2837–46.
20. Hanna RB, Rajaram H. Influence of aperture variability on dissolutional growth of fissures in karst formations. Water Resour Res. (1998) 34:2843–53.
21. Cheung W, Rajaram H. Dissolution finger growth in variable aperture fractures: role of the tip-region flow field. Geophys Res Lett. (2002) 29:2075. doi: 10.1029/2002GL015196
22. Worthington S R., Ford D. C. Self-organized permeability in carbonate aquifers. Groundwater (2009) 47:326–36. doi: 10.1111/j.1745-6584.2009.00551.x
23. Szymczak P, Ladd AJC. The initial stages of cave formation: beyond the one-dimensional paradigm. Earth Planet Sci Lett. (2011) 301:424–32. doi: 10.1016/j.epsl.2010.10.026
24. Budek A, Szymczak P. Network models of dissolution of porous media. Phys Rev E (2012) 86:056318. doi: 10.1103/PhysRevE.86.056318
25. Chaudhuri A, Rajaram H, Viswanathan H. Early-stage hypogene karstification in a mountain hydrologic system: a coupled thermohydrochemical model incorporating buoyant convection. Water Resour Res. (2013) 49:5880–99. doi: 10.1002/wrcr.20427
26. Polak A, Elsworth D, Liu J, Grader AS. Spontaneous switching of permeability changes in a limestone fracture with net dissolution. Water Resour Res. (2004) 40:W03502. doi: 10.1029/2003WR002717
27. Noiriel C, Gouze P, Made B. 3D analysis of geometry and flow changes in a limestone fracture during dissolution. J Hydrol. (2013) 486:211–23. doi: 10.1016/j.jhydrol.2013.01.035
28. Luquot L, Rodriguez O, Gouze P. Experimental characterization of porosity structure and transport property changes in limestone undergoing different dissolution regimes. Transport Porous Med. (2014) 101:507–32. doi: 10.1007/s11242-013-0257-4
29. Garcia-Rios M, Luquot L, Soler JM, Cama J. Influence of the flow rate on dissolution and precipitation features during percolation of CO2-rich sulfate solutions through fractured limestone samples. Chem Geol. (2015) 414:95–108. doi: 10.1016/j.chemgeo.2015.09.005
30. Luquot L, Gouze P. Experimental determination of porosity and permeability changes induced by injection of CO2 into carbonate rocks. Chem Geol. (2009) 265:148–59. doi: 10.1016/j.chemgeo.2009.03.028
31. Ellis BR, Peters CA, Fitts JP, Bromhal GS, McIntyre D, Warzinski R, et al. Deterioration of a fractured carbonate caprock exposed to CO2-acidified brine flow. Greenh Gases Sci Technol. (2011) 1:248–60. doi: 10.1002/ghg.25
32. Elkhoury JE, Ameli P, Detwiler RL. Dissolution and deformation in fractured carbonates caused by flow of co2-rich brine under reservoir conditions. Int J Greenh Gas Control (2013) 16:S203–15. doi: 10.1016/j.ijggc.2013.02.023
33. Hao Y, Smith M, Sholokhova Y, Carroll S. CO2 -induced dissolution of low permeability carbonates. Part II : numerical modeling of experiments. Adv Water Res. (2013) 62:388–408. doi: 10.1016/j.advwatres.2013.09.009
34. Deng H, Ellis BR, Peters CA, Fitts JP, Crandall D, Bromhal GS. Modifications of carbonate fracture hydrodynamic properties by CO2-acidified brine flow. Energy Fuels (2013) 27:4221–31. doi: 10.1021/ef302041s
35. Carroll S, Hao Y, Smith M, Sholokhova Y. Development of scaling parameters to describe CO2-rock interactions within Weyburn-Midale carbonate flow units. Int J Greenh Gas Control (2013) 16:S185–93. doi: 10.1016/j.ijggc.2012.12.026
36. Smith M, Sholokhova Y, Hao Y, Carroll S. CO2-induced dissolution of low permeability carbonates. Part I: characterization and experiments. Adv Water Resour. (2013) 62:370–87. doi: 10.1016/j.advwatres.2013.09.008
37. Elkhoury J, Detwiler R, Ameli P. Can a fractured caprock self-heal? Earth Planet Sci Lett. (2015) 417:99–106. doi: 10.1016/j.epsl.2015.02.010
38. Ott H, Oedai S. Wormhole formation and compact dissolution in single-and two-phase CO2-brine injections. Geophys Res Lett. (2015) 42:2270–6. doi: 10.1002/2015GL063582
39. Szymczak P, Ladd AJC. A network model of channel competition in fracture dissolution. Geophys Res Lett. (2006) 33:L05401. doi: 10.1029/2005GL025334
40. Herwitz SR. Stemflow influences on the formation of solution pipes in Bermuda eolianite. Geomorphology (1993) 6:253–71.
41. Lipar M, Webb JA, White SQ, Grimes KG. The genesis of solution pipes: evidence from the middle–late pleistocene bridgewater formation calcarenite, Southeastern Australia. Geomorphology (2015) 246:90–103. doi: 10.1016/j.geomorph.2015.06.013
42. Sun Q, Cartwright J, Wu S, Chen D. 3D seismic interpretation of dissolution pipes in the South China Sea: genesis by subsurface, fluid induced collapse. Mar Geol. (2013) 337:171–81. doi: 10.1016/j.margeo.2013.03.002
43. Golfier F, Zarcone C, Bazin B, Lenormand R, Lasseux D, Quintard M. On the ability of a Darcy-scale model to capture wormhole formation during the dissolution of a porous medium. J Fluid Mech. (2002) 457:213–54. doi: 10.1017/S0022112002007735
44. Golfier F, Bazin B, Lenormand R, Quintard M. Core-scale description of porous media dissolution during acid injection - Part I: theoretical development. Comput Appl Math (2004) 23:21. doi: 10.1590/S0101-82052004000200005
45. Upadhyay VK, Szymczak P, Ladd AJC. Initial conditions or emergence: what determines dissolution patterns in rough fractures? J Geophys Res Solid Earth (2015) 120:6102–21. doi: 10.1002/2015jb012233
47. Budek A, Garstecki P, Samborski A, Szymczak P. Thin-finger growth and droplet pinch-off in miscible and immiscible displacements in a periodic network of microfluidic channels. Phys Fluids (2015) 27:112109. doi: 10.1063/1.4935225
48. Roy A, Roy S, Bhattacharyya AJ, Banerjee S, Tarafdar S. Discrete scale invariance in viscous fingering patterns. Eur Phys J B (1999) 12:1–3. doi: 10.1007/s100510050966
49. Couder Y, Maurer J, González-Cinca R, Hernández-Machado A. Side-branch growth in two-dimensional dendrites. I. experiments. Phys Rev E (2005) 71:31602. doi: 10.1103/PhysRevE.71.031602
50. Huang Y, Ouillon G, Saleur H, Sornette D. Spontaneous generation of discrete scale invariance. Phys Rev E (1997) 55:6433–47.
52. Palmer AN. Cutters and pinnacles in the Salem limestone of Indiana. In: Ginés A, Knez M, Slabe T, Dreybrodt W, editors. Karst Rock Features: Karren Sculpturing. Ljubljana: ZRC Publishing (2009). pp. 349–58.
53. Steefel CI. Geochemical kinetics and transport. In: Brantley SL, Kubicki JD, White AF, editors. Kinetics of Water-Rock Interaction. New York, NY: Springer (2008). pp. 545–89.
54. Dreybrodt W. The role of dissolution kinetics in the development of karst aquifers in limestone: a model simulation of karst evolution. J Geol. (1990) 98:639–55.
55. Kalia N, Balakotaiah V. Modeling and analysis of wormhole formation in reactive dissolution of carbonate rocks. Chem Eng Sci. (2007) 62:919–28. doi: 10.1016/j.ces.2006.10.021
56. Grimes KG. Solution pipes and pinnacles in syngenetic karst. In: Ginés A, Knez M, Slabe T, Dreybrodt W, editors. Karst Rock Features. Karren Sculpturing. Ljubljana: ZRC Publishing (2009). pp. 513–26.
57. Schaetzl R, Anderson S. Soils: Genesis and Geomorphology. New York, NY: Cambridge University Press (2005).
58. Kondratiuk P, Szymczak P. Steadily translating parabolic dissolution fingers. SIAM J Appl Math. (2015) 75:2193–213. doi: 10.1137/151003751
Keywords: karst, solution pipes, reactive flow, porous medium, dissolution
Citation: Petrus K and Szymczak P (2016) Influence of Layering on the Formation and Growth of Solution Pipes. Front. Phys. 3:92. doi: 10.3389/fphy.2015.00092
Received: 01 July 2015; Accepted: 03 December 2015;
Published: 12 January 2016.
Edited by:
Bjornar Sandnes, Swansea University, UKReviewed by:
Yves Méheust, Université de Rennes 1, FranceEspen Jettestuen, International Research Institute of Stavanger, Norway
Copyright © 2016 Petrus and Szymczak. This is an open-access article distributed under the terms of the Creative Commons Attribution License (CC BY). The use, distribution or reproduction in other forums is permitted, provided the original author(s) or licensor are credited and that the original publication in this journal is cited, in accordance with accepted academic practice. No use, distribution or reproduction is permitted which does not comply with these terms.
*Correspondence: Piotr Szymczak, piotrek@fuw.edu.pl