 David C. Randall1,2,3* Richard O. Speakman1 Dennis L. Silcox1 Laura V. Brown1 David R. Brown1 Ming C. Gong1 Abhijit Patwardhan2 L. Raymond Reynolds4,5 Dennis G. Karounos4,5 Don E. Burgess3 Chikodi N. Anigbogu1,6
- 1 Department of Physiology, University of Kentucky College of Medicine, Lexington, KY, USA
- 2 Graduate Center for Biomedical Engineering, University of Kentucky, Lexington, KY, USA
- 3 Department of Natural Sciences, Asbury University, Wilmore, KY, USA
- 4 Endocrinology Section, Veterans Administration Hospital, Lexington, KY, USA
- 5 Department of Medicine, University of Kentucky College of Medicine, Lexington, KY, USA
- 6 Department of Physiology, College of Medicine, University of Lagos, Idi-Araba, Nigeria
We recorded via telemetry the arterial blood pressure (BP) and heart rate (HR) response to classical conditioning following the spontaneous onset of autoimmune diabetes in BBDP/Wor rats vs. age-matched, diabetes-resistant control (BBDR/Wor) rats. Our purpose was to evaluate the autonomic regulatory responses to an acute stress in a diabetic state of up to 12 months duration. The stress was a 15-s pulsed tone (CS+) followed by a 0.5-s tail shock. The initial, transient increase in BP (i.e., the “first component,” or C1), known to be derived from an orienting response and produced by a sympathetic increase in peripheral resistance, was similar in diabetic and control rats through ∼9 months of diabetes; it was smaller in diabetic rats 10 months after diabetes onset. Weakening of the C1 BP increase in rats that were diabetic for >10 months is consistent with the effects of sympathetic neuropathy. A longer-latency, smaller, but sustained “second component” (C2) conditional increase in BP, that is acquired as a rat learns the association between CS+ and the shock, and which results from an increase in cardiac output, was smaller in the diabetic vs. control rats starting from the first month of diabetes. A concomitant HR slowing was also smaller in diabetic rats. The difference in the C2 BP increase, as observed already during the first month of diabetes, is probably secondary to the effects of hyperglycemia upon myocardial metabolism and contractile function, but it may also result from effects on cognition. The small HR slowing concomitant with the C2 pressor event is probably secondary to differences in baroreflex activation or function, though parasympathetic dysfunction may contribute later in the duration of diabetes. The nearly immediate deficit after disease onset in the C2 response indicates that diabetes alters BP and HR responses to external challenges prior to the development of structural changes in the vasculature or autonomic nerves.
Introduction
The autonomic nervous control of the cardiovascular function can be profoundly altered from normal in diabetes. A quantitative analysis of the changes in the expression of autonomically mediated changes in cardiovascular function, evoked in a precisely controlled manner in the experimental animal, would contribute meaningfully to our understanding of the implications of this pervasive disease in man. Classical aversive conditioning has proven to be an effective tool to study the autonomic regulation of cardiovascular function in a variety of rat strains (e.g., Randall et al., 1993, 1994; Li et al., 1997; Brown et al., 1999). This is particularly true because we know a great deal about the autonomic nervous mediation of the conditional cardiovascular response and the hemodynamic underpinnings of the changes in mean arterial blood pressure (mBP) and heart rate (HR). In particular, we have reported (Randall et al., 1994) that classical aversive conditioning elicits stereotypic changes in autonomic nervous activity in rat that, in turn, drive patterned changes (Randall et al., 1993, 1994) in mBP, HR, stroke volume (SV), cardiac output (CO), and peripheral resistance (Li et al., 1998). The 24-h average mBP and HR, and mBP power spectra across ∼9 months duration of type 1 diabetes have been described elsewhere (Anigbogu et al., submitted). The objective of the present study is to probe the progressive effects of diabetes over many weeks upon the cardiovascular response to this acute behavioral challenge in a rodent model of spontaneous-onset diabetes (BBDP/Wor rat) vs. age-matched controls (BBDR/Wor rat). We interpret the observed progressive effects of diabetes upon the conditional response in terms of our knowledge of the neural mediation of the response, and, where applicable, in terms of diabetic autonomic neuropathy as previously described in these animals (Vinik et al., 2003).
Materials and methods
Animals
A total of 12 diabetes prone (BBDP/Wor; hereafter the “BB rat”) and 12 diabetes-resistant age-matched controls (BBDR/Wor; hereafter “control”) rats were used in one or more stages of this study. All animals were obtained from the Biomedical Models Inc. (Rutland, MA, USA). The diabetes-prone rats spontaneously develop an autoimmune, abrupt onset Type 1 diabetes mellitus between 50 and 120 days of age characterized by polydipsia, polyuria, and hyperglycemia (Chappel and Chappel, 1983). The study was approved by the University of Kentucky Animal Care and Use Committee. The rats were obtained from the vendor at 31–45 days of age. The animals were housed in an isolated, sound shielded, limited access room where the temperature was controlled at 72°F/22°C, 56% humidity, and a 12/12-h light/dark cycle. The rats were fed on standard rat chow (Harlan Teklad 2018, Madison, WI, USA) and had access to water ad libitum.
The BB animals were weighed each morning, including weekends, and blood glucose was measured in a drop of blood from the saphenous vein using the One-Touch Ultra glucometer (LifeScan Inc., Milpitas, CA, USA). The control animals were weighed each Friday, and their plasma glucose determined, also from prick of the saphenous vein.
The day the animal first showed a morning blood glucose level above 250 mg/dl was taken as onset of diabetes mellitus and designated “Day 0.” The diabetes duration, in days, was calculated from this time. The diabetic rats were maintained on an insulin dose schedule developed by the breeder to manage blood glucose levels appropriately. This involved giving protamine–zinc insulin (PZI) 0.9 U/100 g/day, subcutaneously. The dose was increased or reduced by 0.2 units/day, depending on weight gain or loss and plasma glucose level.
Surgery
All surgery was performed under anesthesia (sodium pentobarbital; 65 mg/kg, IP) with procedures appropriate for rodent survival surgery. The average age at surgery was 61 days (range: 43–89 days). The abdominal aorta was accessed via a laparotomy. The sensory element of a Data Sciences International (DSI) probe (model TA11PA-C40) was placed into the aorta via a puncture. The catheter containing the sensitive element of the probe was secured in place with surgical glue. The body of the probe that contains the sensor, transmitter, and battery was secured to the interior abdominal wall with sutures. The incision was closed and the rat monitored until it aroused from the anesthetic. The animal was returned to the home cage once it had aroused and was self grooming. Rats were allowed a minimum of 10 days recuperation before any cardiovascular data were used.
Behavioral Conditioning
The classical conditioning paradigm has been described in detail elsewhere (Randall et al., 1993, 1994). Briefly, the animals were habituated for 1–2 h daily for several days to handling and restraint in a comfortable cloth sock. Each rat was then exposed daily to five trials of a 15-s pulsed tone (CS+) and another five trials of a steady tone (i.e., non-pulsed; CS−) that was identical in pitch and intensity to the pulsed-sound. CS+ and CS− were presented in pseudorandom pairs (e.g., …CS−, CS+, CS+, CS−,…). On this initial training day only the last (i.e., fifth) pulsed tone was reinforced with the 0.5-s tail shock (i.e., the unconditional stimulus, US); the US shock was delivered via bipolar electrodes held by a plastic cuff placed around the subject’s tail prior to each day’s trials. The US was adjusted to the lowest value that caused the rat to flinch and squeak which was usually 0.2 mA and never exceeded 0.3 mA. Training continued for two additional days during which each CS+ was shock reinforced. A minimum of 5 min was allowed between presentations of successive trials to allow the studied variables to return to baseline. Each rat was removed from the sock at the end of each daily session and was returned to the animal quarters.
Once trained, each animal’s conditional response was elicited every 2 weeks. An initial set of five CS+ and five CS− trials was run to “refresh” the conditional response; the next day a second set of five CS+ and five CS− trials was run, data were recorded and analyzed for this set. Subjects were started in the paradigm at different times during the course of their diabetes to probe function starting at the onset (i.e., starting within a day or two of conversion) and extending through 1 year of the diabetic state. Since animals died or implants failed during the course of the study, the total number of potential subjects changed over time. To eliminate the effects upon the average values for any variable of any given animal’s dropping out of the data set three “cadres” were identified, each of which contained a fixed set of animals across a specified time post-conversion. Cadre 1 included four diabetic and four control rats that provided a complete set of data for months 1–3 after the diabetic animals’ conversions. These animals were sock habituated, trained in the paradigm and conditioning sessions started at, or immediately after, their conversion to the diabetic state to assess the responses before any “structural” effects of diabetes could be manifest. Cadre 2 included six diabetic and eight control rats whose data set remained intact from months 4–9; their training, etc., started at ca. 3–9 weeks post-conversion. Finally, Cadre 3 included three diabetic and six control subjects, each of which provided conditioning data for months 10 through 12; their behavioral training started at ca. 15 weeks post-conversion. Some rats participated in more than one cadre.
Data Acquisition and Analysis
The arterial BP telemetry data were obtained during the conditioning trials using the PhysioTel RPC 1 receiver. The received signal was fed into a DSI Data Exchange Matrix to which was connected an ambient pressure reference (APR 1). The output from the matrix was sent via a Dataquest PCI card into the Pentium IV computer based workstation running a Dataquest A.R.T system software program. The output from this computer was cross fed into an analog output Data Exchange Matrix. The analog output of the DEM was passed through a BNC-2110 A–D converter (National Instruments) into an analysis and output computer for further processing or display. The data were analyzed using an in-house developed computer program (ViiSoftware, Lexington, KY, USA) running on a Pentium IV based computer. HR was computed from the pulsatile blood pressure signal. Each “trial” started 15 s before tone onset and extended for 15 s after shock delivery. For any given animal, for any given daily set of CS+ trials (and for CS− trials), a “high resolution analysis” of the conditional mBP and HR response was constructed by computerized “ensemble averaging” the five individual trials (Randall et al., 1993, 1994). Again, for any given animal the individual high resolution trials were ensemble averaged for month 1, for month 2, etc. [see Figure 4 for an example taken from month 6 for a control (black) and diabetic (red) animal].
The baseline mBP (and HR) was assessed by a beat-by-beat average during the 15-s prior to tone onset for each monthly ensemble, as immediately above, for each rat. The conditional response was assessed in each rat in terms of the initial peak mBP change (relative to baseline) following tone onset (referred to as the C1 pressor response), the change in mBP averaged across the last 10 s of the tone (the C2 pressor response) and the corresponding change in HR (the C2 bradycardia), and the change in mBP relative to baseline over the ∼15 s interval immediately following shock delivery (see Figure 1). The latency from tone onset to the time at which the peak C1 pressor response was achieved (tpeak) was also determined. Each of the aforementioned values was determined for both CS+ and CS− trials. The ability to discriminate between the “neutral” CS− and shock-reinforced CS+ is best assessed by the relative lack of change in mBP during C2 in response to CS− as compared to the response during CS+ (Randall et al., 1994); this was indexed by the ratio of the (C2 change in mBP during CS−)/(C2 change in mBP during CS+). A ratio of 1 indicates no discrimination between conditions, whereas a ratio of 0 indicates perfect discrimination. Data are presented as mean ± SD. Two-factor mixed analysis of variance (ANOVA) was applied to the strains with repeated measures across time (months) within a given cadre. One way within-subjects ANOVA for each cadre was used to test for changes across time (months) for the diabetic rats, or for the control rats, with appropriate post hoc tests. Significance was taken as p < 0.05.
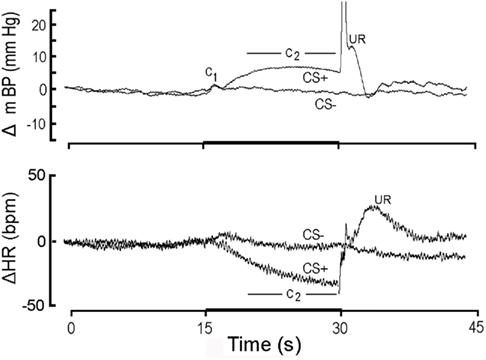
Figure 1. High resolution analysis (see text) showing change (Δ; relative to initial 15 s baseline) in mean arterial blood pressure (mBP; top) and in heart rate (HR; bottom) classically conditioned to 15 s CS+ tone (dark bar, abscissa) followed by 1/2 s tail shock or to 15 s CS− tone never followed by shock in Cadre 1 Control rats. Each tracing is an ensemble average of conditional responses computed from non-diabetic control rats (n = 4) for month 1 (i.e., corresponding in time to first month after the age-matched diabetic rats “converted” to diabetes). The mBP response to CS+ consists of an initial, short-latency pressor component (C1) followed by a sustained “second component” (C2) increase; the period over which C2 is assessed for analytical purposes is indicated in the figure. The US evokes a very sharp mBP increase (truncated here), temporally coincident with the rat’s flinching in response to shock, followed by rounded “hump” elevation in mBP. CS− also evokes a C1, presumably because the rat is unable to determine instantaneously whether the tone is pulsed (i.e., CS+) or steady (i.e., CS−). The failure of CS− to evoke C2 demonstrates that the rats discriminated between the two tones. The major HR response to CS+ is a bradycardia coincident with C2; CS− does not evoke a concomitant slowing, again indicating discrimination. The unconditional HR response (i.e., to the US) is a tachycardia. Young control rats demonstrate a clear conditional mBP and HR response and discriminate between CS+ and CS−.
Results
Baseline Plasma Glucose, BP, and HR in Diabetic and Control Rats
Plasma glucose concentrations averaged 112 ± 18 mg/dl over all diabetes-prone rats as measured at 7 days before their conversion to the diabetic state. The corresponding value for the diabetes-resistant animals was 97 ± 18 mg/dl (NS). The Cadre 1 diabetic animals, for example, averaged 335 ± 18, 387 ± 22, and 415 ± 26 mg/dl for months 1, 2, and 3 after their conversion, respectively; the corresponding values for the age-matched resistant rats in Cadre 1 were 99 ± 1, 101 ± 2, and 100 ± 1 mg/dl. Table 1 summarizes baseline mBP and HR for each month post-conversion for which conditioning data are reported (see below). ANOVAs within each cohort found no between group differences for mBP, but revealed a significant decline in mBP across months 4–9 (cohort 2: F5,60 = 2.95) and months 10–12 (cohort 3: F2,14 = 4.33); there were no significant group (resistant, diabetic) by time (months post-conversion) interactions. There was a significant between group difference in HR for all three cohorts (cohort 1: F1,6 = 6.10; cohort 2: F1,12 = 7.23; cohort 3: F1,7 = 6.77), but no cohort showed a change over time or a group × time interaction.
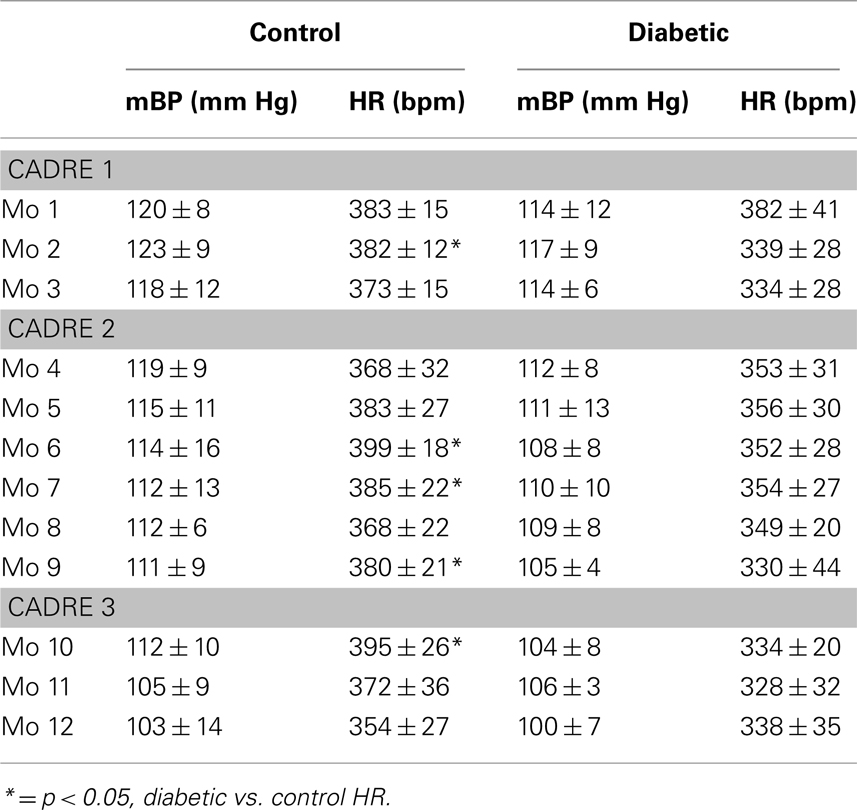
Table 1. Baseline average mean arterial pressure and heart rate (±) at designated times pre- and post-conversion for diabetic and age-matched control rats.
Blood Pressure and Heart Rate Changes during CS+ and CS− in Control vs. Diabetic Subjects
CS+ vs. CS− response in control rats during month 1
Figure 1 illustrates the conditional change (Δ; vs. baseline) in mBP (top panel) and HR (bottom panel) in response to CS+ and CS− averaged over the four control rats of Cohort 1 during month 1 (i.e., trials for the age-matched controls during the first 30 days that their BB partners were diabetic). To create this figure each of the four rat’s conditional response for mBP and for HR was determined separately by averaging the ∼25 CS+ trials (and 25 CS− trials) given to that animal over the month to construct a “high resolution analysis.” These four individual high resolution files were then averaged to create the composites shown in the figure; that is, all statistical analyses of these data are based upon an “n” of 4 for each group. The mBP response to CS+ includes the initial, short-latency pressor response, C1, followed by the sustained C2 mBP increase. The period over which mBP and HR changes were measured to quantify C2 (i.e., last 10 s of the tone) is indicated. Note the substantial C2 HR slowing during CS+. The changes in mBP and in HR concomitant with shock delivery and immediately thereafter constitute the unconditional response (UR). The typical topography of the unconditional mBP response in the controls, as is seen here, consists of a sharp, very brief increase associated with delivery of the shock itself (shown truncated in this figure), followed immediately by a transient, rounded “hump” in pressure, and then a rapid decline in mBP toward baseline. There were, of course, no such changes at the end of CS− (i.e., when no US was ever delivered). Finally, the failure of mBP and HR to demonstrate sustained changes during CS− tone presentation demonstrates that the rats discriminated between the two tones (Randall et al., 1993, 1994).
CS+ response in diabetic vs. control rats during months 1–3
Figure 2 is similar in construction to Figure 1 except it compares the response to CS+ alone in non-diabetic control rats (n = 4; here, and hereafter, shown in black) and in diabetic rats (n = 4; here, and hereafter, shown in red) during the first 30 days after the latter converted to the diabetic state (i.e., month 1). The inserts show the group average ± SD changes in mBP (top panel) for peak mBP increase during C1 (C1 pk; top panel, left), average mBP change during C2 (C2; top panel, center) and average mBP change during the recovery phase (post-US; top panel, right). The single insert in the bottom panel shows the group average change (i.e., slowing) in HR during C2. Both diabetic and control groups showed generally equal C1 pressor responses (diabetic: +2.9 ± 3.6 mm Hg; resistant: 2.2 ± 1.6 mm Hg), but the C2 and post-US increases in mBP were effectively absent in the BB animals (C2: −0.4 ± 0.8 mm Hg; post-US: −0.5 ± 2.3 mm Hg) as compared to the controls (C2: +7.0 ± 4.1 mm Hg; post-US: +3.2 ± 3.0 mm Hg). Likewise, HR slowed markedly during C2 (bottom panel, center) in the control animals (−24 ± 6 bpm), with significantly less slowing in the diabetics (−9 ± 10 bpm). The latency from tone onset to the peak C1 pressor response, tpeak, in the controls averaged across months 1, 2, and 3 was 1.4 ± 0.4 s. The corresponding average for the diabetic animals was similar (i.e., 1.5 ± 0.4 s). Similar differences in the various components of the response were seen throughout each of the first 3 months of the study (see below).
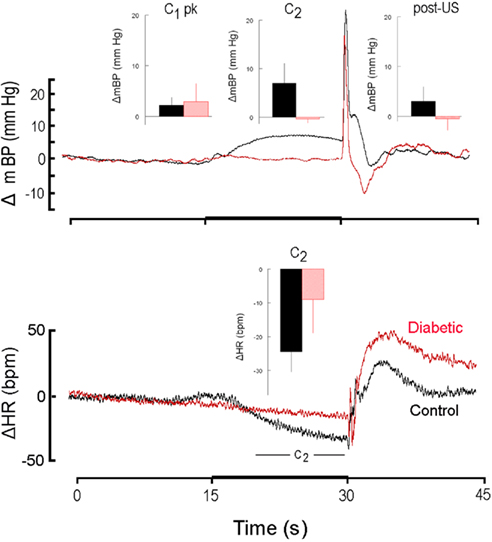
Figure 2. High resolution analysis showing change (Δ, as in Figure 1) in mean arterial blood pressure (mBP; top) and in heart rate (HR; bottom) for CS+ trials in non-diabetic control rats (n = 4; black) and in diabetic rats (n = 4; red) in response to CS+ tone (dark bar, abscissa) presented in trials conducted during the first 30 days after the latter converted to the diabetic state (i.e., month 1). The inserts show the group average ± SD changes vs. baseline in mBP and in HR for peak increase during C1 (C1 pk, left-most insert), average change during C2 (middle insert) and average change during the recovery phase (post-US, right insert). Average amplitude of C1 was similar in control and diabetic rats at 1 month. In rats that were in their first month of diabetes there was no C2 mBP increase, and, on the average, HR slowing (insert, lower panel) was smaller in diabetic vs. control subjects. The “hump” in mBP that normally (i.e., control state) follows immediately after tail shock was replaced by a clear drop in pressure in the diabetic animals. The presence of the C1 mBP increase in the diabetic rats suggests that a “sudden burst” in sympathetic nerve activity normally evoked by CS+ also occurs in the diabetic animals and yields an increase in peripheral resistance characteristic of the conditional response pattern (see text). The failure of the diabetic animals to show a C2 mBP increase is consistent with known effects of diabetes upon myocardial metabolism and contractile function (see text), or with a deficit in cognitive function.
The CS− tone evokes a C1 mBP component (Randall et al., 1993, 1994), but no sustained cardiovascular change; the peak amplitude of this response to CS− was not different in resistant (month 1: +2.8 ± 1.2 mm Hg; month 2: +4.1 ± 4.7 mm Hg; month 3: +2.8 ± 1.3 mm Hg) vs. Cadre 1 diabetic rats (month 1: +1.1 ± 1.0 mm Hg; month 2: 1.5 ± 2.4 mm Hg; month 3: 2.4 ± 2.6 mm Hg). The primary practical purpose for CS− is to test the rat’s discrimination between CS+ and CS−. The discrimination ratios for months 1, 2, and 3 were 0.09 ± 0.15, 0.29 ± 0.32, and 0.00 ± 0.14, respectively for the controls. Discrimination could not be reliably assessed for the BB animals given the small mBP during C2 even for CS+.
Table 2 abandons, for the moment, the cadre classification and documents baseline mBP and HR, and the various changes in mBP and HR, as given above, for each key component of the behavioral response for all diabetic (n = 10) and all control (n = 11) rats tested during month 3. Baseline mBP and HR were significantly (Student’s t) lower between these larger groups of BB vs. control rats, but, as in Cadre 1, the amplitude of the peak mBP C1 increase, and the time to peak increase, were similar across groups. Likewise, the amplitude of the C2 pressor response was large in the control animals, but virtually absent in the diabetic subjects, though the concomitant HR decreases were small, and similar in size. There was no between group difference in the post-US mBP response.
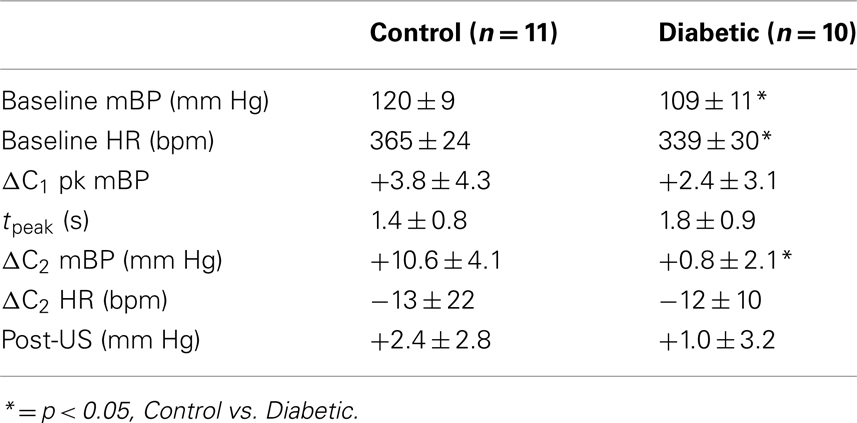
Table 2. Average ± SD baseline mean arterial pressure and heart rate, and changes vs. baseline in pressure and heart rate for key components of conditional response in control and diabetic rats tested at 3 months diabetes duration.
CS+ response in diabetic vs. control rats during months 4–9
Like Cadre 1, the peak increase in mBP for C1 for Cadre 2 rats averaged over 4–9 months diabetes duration was similar for the matched control (+ 3.5 ± 1.3 mm Hg) and diabetic rats (+ 2.6 ± 0.8 mm Hg; NS) and neither group showed a trend to change the magnitude of the response across time. As was illustrated above, the C2 component of the conditional cardiovascular response is particularly telling. Figure 3 shows the group average change ± SD in mBP and in HR during C2 across Cadre 2 rats for months 4–9. By month 4 the diabetic animals had developed a modest C2 mBP increase (+ 2.2 ± 2.2 mm Hg) and a concomitant HR decrease (−14.2 ± 9.1 bpm). The amplitude of the increase in mBP was smaller in diabetic vs. control (F1,12 = 5.93), as was the HR slowing (F1,12 = 5.48). Figure 4 gives a more dynamic impression of the rats’ responses during this stage of the development of diabetes by showing the conditional responses to CS+ of a diabetic animal at 6 months compared to an age-matched control; the inserts show group averages during month 6. The clear, but relatively smaller C2 component of the mBP response in the diabetic animal vs. its control partner is evident. Moreover, the concomitant HR slowing in the control animal manifests as very modest acceleration in this particular diabetic rat. Note also that the post-US change in BP vs. baseline in the controls was decidedly different (F1,10 = 7.85) vs. the diabetic rat(s); indeed, mBP fell below baseline in the seconds immediately following shock delivery in the BB animals, but rose, at least transiently, in the controls. The average latency from tone onset to the peak C1 pressor component (1.5 ± 0.4 s) did not change across the 6-months in controls. It tended to increase across months in the BB animals from the shortest latency of 1.3 ± 1.2 s at 5 months to the longest latency of 3.3 ± 1.5 s at 8 months, though the trend toward increasing latency did not attain significance (F5,20 = 1.8), nor did the 6-month average of 1.9 ± 0.7 s for the BB differ significantly from that of the controls (1.7 ± 0.3 s). The peak mBP C1 response to CS− was similar in resistant (6 month average: +3.1 ± 1.0 mm Hg) and diabetic rats (6 month average: +1.7 ± 1.4 mm Hg). Both groups discriminated between CS+ and CS− (control index over the 6-months = 0.17 ± 0.38; diabetic = −0.01 ± 0.63; NS).
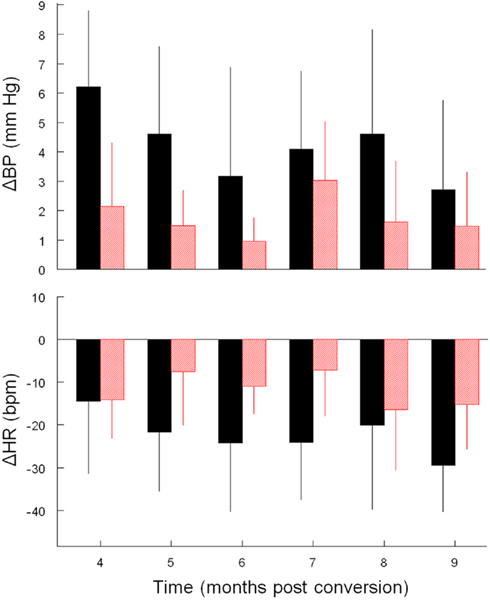
Figure 3. Average ± SD change (vs. baseline) in mBP (top) and in HR (bottom) during C2. Conditional changes in mBP and HR are evident, but both were consistently smaller in diabetic (red) vs. control (black) rats for trials conducted during months 4–9.
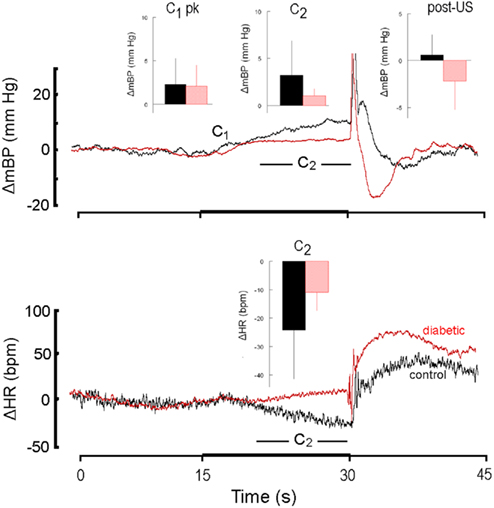
Figure 4. High resolution analysis of changes in mBP (top) and in HR (bottom) in a diabetic rat (red) from Cadre 2 for trials conducted during the sixth month after it converted and corollary analysis for an age-matched control (black). Inserts are group averages as in Figure 2. Both groups showed similar peak C1 increases in mBP, and clear C2 changes in mBP, but the magnitude of the latter was smaller in diabetic vs. control animals. This animal showed a small tendency for HR to increase during C2, but as a group the diabetic animals at 6 months of duration showed a moderate bradycardia. As in Figure 2, mBP dropped after shock delivery in the diabetic subjects.
CS+ response in diabetic vs. control rats during months 10–12
Cadre 3 consisted of six control animals and three diabetic rats that were maintained through months 10–12. Figure 5 illustrates these differences for one diabetic and a matched control for trials conducted during the 11th month of diabetes; the inserts are computed, as above, across the rats of Cadre 3 for month 11. In contrast to the conditional responses for both groups shown in Figure 2, the diabetic rats had lost the initial C1 mBP pressor response at this later phase in the development of diabetic pathophysiology (upper left insert, Figure 5), though, given the small “n” for the BB animals, this between group difference fell short of significance (CS+: F1,18 = 3.97; CS−: F1,18 = 1.49). Likewise, the magnitude of the C2 bradycardia tended to be smaller in the diabetic animals (Figure 5, lower panel), but again failed of statistical significance (F1,7 = 3.79). As with Cadre 2, however, the post-US mBP increased above baseline in the control animals and decreased in the BB animals (F1,7 = 10.15).
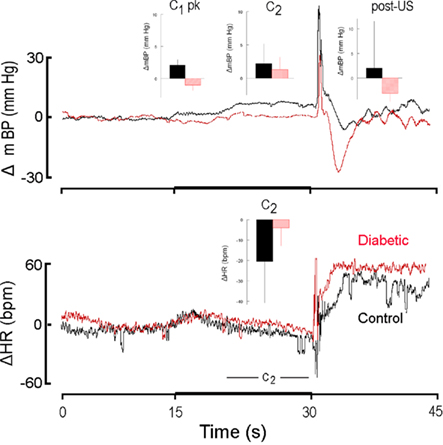
Figure 5. High resolution analysis of changes in mBP (top) and in HR (bottom) in a diabetic rat (red) from Cadre 3 for trials conducted during the 11th month after it converted and corollary analysis for an age-matched control (black). Inserts are group averages as in Figures 2 and 4. The C1 mBP increase was not evoked by presentation of CS+ in the diabetic rat, and the C2 pressor event and concomitant HR slowing were small in the diabetic vs. control. Mean arterial BP dropped after shock delivery in the diabetic subjects. The lack of a C1 pressor response is consistent with the development of diabetic sympathetic dysfunction by ∼1 year of disease duration.
ΔHR/ΔmBP in diabetic vs. control rats during months 10–12
There were no differences between the control and diabetic rats in the ratio of the change in HR to the change in mBP during C2 for CS+ trials through month 8. For rats in Cadre 3, however, the ratio was positive for the diabetic rats for months 10 (10.1 ± 12.6 bpm/mm Hg), 11 (16.0 ± 28.0 bpm/mm Hg), 12 (1.7 ± 5.9 bpm/mm Hg). The same ratio was negative for the controls (n = 6) for months 10 (−10.3 ± 9.1 bpm/mm Hg), 11 (−13.0 ± 38.2 bpm/mm Hg), and 12 (−4.9 ± 33.4 bpm/mm Hg). The between group difference was significant (F1,7 = 13.3).
Discussion
The major findings of this study as relates to diabetes are: (1) during the first months after conversion the amplitude of C1 was similar in both the control and diabetic rats, but C1 diminished in the BB subjects relative to the controls after the former had been diabetic for ≥10 months; (2) the smaller (than the C1 mBP increase), but sustained C2 increase in mBP was either absent (Cadre 1) or smaller (Cadre 2) in the diabetic as compared to the control animals; (3) the C2 HR slowing was smaller in the diabetic animals vs. controls; (4) mBP fell relative to baseline during the post-US interval in the BB animals vs. an increase in control rats; (5) the latency to the initial peak C1 mBP increase tended to increase progressively with time in the diabetic animals; (6) the ratio of ΔHR/ΔmBP was positive in diabetic and negative in control subjects starting in month 10; (7) both groups discriminated between CS+ and CS− (tested from month 4 onward). The discussion below suggests explanations for these observations in terms of the hemodynamics underlying the conditional response and what is known about the autonomic nervous control of the response pattern, and speculates about the mechanisms underlying these effects.
The Short-Latency Conditional Pressor Response (C1)
The initial pressor response, which we call C1, is preceded by a large-amplitude, but short-lived “sudden burst” (SB) in sympathetic nerve activity (SNA) in Sprague-Dawley rats (Randall et al., 1994); the amplitude of the SB predicts the amplitude of the C1 pressor response (Burgess et al., 1997). Immediately following the SB the SNA decreases momentarily below baseline (the “quiet period”); this drop in SNA precedes a decline in mBP from the peak C1 value (Randall et al., 1994), and is probably attributable to the action of the baroreflex (Willingham et al., 2004). In the Sprague-Dawley the C1 BP increase is produced by an increase in peripheral resistance, there being little-or-no concomitant change in either SV or HR and, thereby, none in CO (Li et al., 1998). C1 originates as an “inherent” orienting or startle response (though it subsequently attains properties of a conditional response); that is, no “learning” is required for the animal to demonstrate this component of the response (El-Wazir et al., 2005). The similarity of the amplitude of C1 in both the control and diabetic rats of Cadre 1 indicates that the amplitudes of the SB in SNA were similar in both groups, and that the sympathetic innervation of vascular smooth muscle in the newly diabetic rats retained the ability to elicit vasoconstriction. Cadre 2 animals were followed serially from the fourth to ninth months after the diabetic rats’ conversion to the diabetic state; this is a period over which incipient, but progressive, deterioration in autonomic function has been described in the diabetic BB rat (see below). The C1 pressor response continued to be preserved in both groups, again suggesting the sympathetic control of vasomotor function was intact, despite the progressively prolonging diabetic condition. The latency (from tone onset) to attainment of the peak C1 mBP increase tended to increase progressively across time in these rats, perhaps indicating that the sympathetic nervous mediation of the peripheral resistance increase was becoming more “sluggish” with longer diabetes duration or that structural changes in the vascular bed altered the response to sympathetic activity. Finally, the C1 pressor response was no longer evident in those rats studied during the 10th to 12th month of diabetes; this difference approached statistical significance, but failed presumably because of the small “n” for the diabetic group. This observation suggests either that the SB in SNA was no longer evoked by the CS+ tone, or that, if present, it no longer evoked an increase in peripheral resistance. Either possibility is tenable given the known diabetic dysautonomia by this time (e.g., Vinik et al., 2003).
The C2 Pressor Response
One of the more remarkable observations was the absence (Cadre 1) or decreased magnitude (Cadre 2) in the diabetic animals vs. controls of the C2 pressor and HR components of the conditional response. We reported previously that the C2 pressor event, which occurs following the SB in SNA and the subsequent “quiet period,” is accompanied in time by a modest (ca. +24%), but sustained increase in sympathetic activity (Randall et al., 1994). Relative to baseline, peripheral resistance during C2 decreases on the average by 4 ± 2 dyn·s/cm5 while CO increases by 2 ± 1 ml/min (Li et al., 1998). The sustained C2 mBP increase is dependent, therefore, upon the heart’s developing and maintaining an increase in CO over baseline. In contrast to C1, C2 is acquired as the animal learns the association between the CS+ tone and the US shock (El-Wazir et al., 2005) – the rat must learn the paradigm to display a C2.
Three explanations for these observations in our BB subjects seem possible. The first is that cognitive function was depressed in the young diabetic rats so that they were unable to learn the association between the CS+ tone and US shock, or that it took longer to learn the association so that, by 4 months Cadre 2, for example, did display a small C2. Diabetes is, in fact, associated with cognitive decrements, particularly during the period of brain development in childhood and during aging (e.g., Biessels et al., 2008). The BB rat shows significantly prolonged latencies in the Morris water maze test at 8 months after onset of diabetes, but not at 2 months (Li et al., 2002). Given the latter observation, it seems unlikely that a failure of the young animals in Cadre 1 to learn the association between CS+ and the shock explains the missing C2, though we cannot dismiss this potential explanation. The second possibility is that the diabetic state limits the ability of the heart to elevate CO in response to the increased SNA during C2. Again, diabetes and/or hyperglycemia is known to be associated with an early deficit in myocardial diastolic relaxation which progresses with time to combined diastolic and systolic dysfunction (reviewed in Sack, 2009). By 4 weeks after administration of streptozotocin to Sprague-Dawley rats the slower beta myosin heavy chain content in small, but multicellular, myocardial preparations increased from 34 ± 15% in control hearts to 100% in the diabetic (Mitov et al., 2009) These changes in composition were associated with functional changes in the elastic properties of the preparations, and support the hypothesis that pathological changes in the mechanical properties of diabetic hearts are primarily attributable to alterations in the cycling cross-bridge contributions to ventricular stiffness (Mitov et al., 2009). Such changes might, in turn, be functionally related to alterations in myocardial metabolism resultant from diabetes (reviewed in Taegtmeyer et al., 2002; Young et al., 2002). Finally, it is possible that diabetic sympathetic neuropathy has already manifest itself so that the failure of mBP to increase during C2 is because SNA failed to increase. For reasons discussed below, this latter possibility seems unlikely for Cadre 1.
The C2 Bradycardia
The modest C2 mBP increase seen in the diabetic animals in Cadre 2 was coincident with a definite, concomitant HR slowing, though the magnitude of this bradycardia was small relative to that seen in the age-matched controls. The C2 bradycardia is eliminated by atropine, but only modestly (though significantly) attenuated by beta-adrenergic blockade in lean Zucker rat (El-Wazir et al., 2008). The HR slowing is therefore attributable primarily to elevated parasympathetic nervous drive to the SA-node. One viable explanation, therefore, for the modest C2 bradycardia is an incipient dysfunction of these nerves. This possibility is attractive in light of the actual tachycardia seen in the diabetic rat in Figure 4. Nonetheless, a second possibility for the smaller C2 bradycardia is the diminished concomitant pressor event, which, in turn, would occasion a more modest activation of the baroreflex and less HR slowing. Finally, it could be that the baroreflex itself was becoming dysfunctional in the diabetic animals at ≥9 months. The ΔHR/ΔmBP computation based upon the corresponding C2 data is an index of baroreflex function, but only if one assumes that there is little-or-no “central control” component to the slowing. While the latter assumption seems somewhat problematic, the findings in this regard are interesting. That is, the fact that this ratio was positive for the diabetic animals, but was negative for the controls, as expected for a functioning reflex, supports the final explanation, above. We have published a more specific preliminary analysis of baroreflex function in the rats at >1 year diabetic duration (Burgess et al., 2009). In the final analysis, all three mechanisms, above, may well contribute to the small C2 HR slowing.
Post-US Arterial Blood Pressure Changes
One additional and striking difference between the control and diabetic animals was manifest essentially in each Cadre of BB animals: the post-US increase in mBP normally seen at ∼32 s (i.e., immediately after the sharp spike coincident with actual delivery of the shock) was replaced by a drop in mBP (e.g., Figure 4, upper right insert). CO drops from its elevated value during C2 immediately following US delivery (Li et al., 1998), so this transient pressor event is attributable to a short-lived increase in peripheral resistance. Given that the diabetic state reportedly (e.g., Agrawal et al., 1987; Xie et al., 2010) is associated with vascular smooth muscle hypercontractility, and our belief that the rat’s ability to elevate peripheral resistance remains intact, at least through ∼9 months of diabetes, these findings suggest that CO drops even more profoundly in the BB animals after US delivery than it does in the control animals. This would be consistent with our hypothesized inability of the diabetic animals to increase CO normally during C2. However, the possibility of a reduced vasodilator function, and a shift toward vasoconstriction in diabetic animals during the baseline condition, could also produce a reduced reserve capacity for further increase in vascular resistance and thereby in BP.
Diabetic Autonomic Neuropathy
Autonomic and sensory neuropathies have been described in the BB rat. Alterations in nerve collagens can be detected by 4 months (Wang et al., 2003). Nerve conduction velocity slows progressively over time, declining by 17% at 14 months (Sima et al., 2000). At 4 and 8 months the BBDP/Wor show a progressive redistribution of nodal Na+ channels across the paranodal and internodal regions that are associated with the conduction slowing (Cherian et al., 1996). Axonal dystrophic changes in sympathetic fibers, which are the hallmark of autonomic neuropathy in human diabetics, are consistently evident in the BB rat after ca. 8 months of diabetes (Yagihashi and Sima, 1985a; Schmidt et al., 2003). The main structural abnormality consists of expanded axons containing a variety of normal and abnormal subcellular structures, prompting the investigators to conclude that “dystrophic and degenerative axonopathy is a reproducible structural hallmark of diabetic sympathetic neuropathy” in the BB rat (Yagihashi and Sima, 1985b). BB rats diabetic for 28 weeks reportedly have a 57% loss relative to controls in ventricular myocardial sympathetic nerve fibers and varicosities and, in atrial tissue, a 42% loss in sympathetic axon profiles containing varicosities (Addicks et al., 1993). Likewise, comparisons of parasympathetic nerves from the diabetic BB rat with non-diabetic, age-matched controls revealed abnormalities in the former including increased numbers of axonal glycogenosomes, axonal sequestration, and diminished fiber size (Yagihashi and Sima, 1986). Similar pathological changes have been described in sensory nerves in the BB rat (Yagihashi et al., 1989), including the carotid sinus nerve (Salgado et al., 2001). These findings are consistent with our suggestions, above, that the loss of the C1 pressor response by ∼10 months, is primarily attributable to sympathetic neuropathy.
Conclusion
This study examined in a rat model of Type 1 diabetes the changes in mBP and HR performance and autonomic cardiovascular regulatory and reflex functions in a chronic and managed diabetic state across the first year of the disease process. The nearly immediate expression of deficits after disease onset in the C2 component of the conditional response normally elicited by CS+ demonstrates that the disease alters mBP and HR control much earlier than one could expect there to be any structural changes in the vasculature or autonomic nerves. While it is possible that this results from effects of hyperglycemia on cognition, it seems more reasonable in light of available data to attribute these early consequences to effects on myocardial function and metabolism. These ultimately impact the ability of the heart to elevate CO in response to acute challenges. Conversely, the diminution of the C1 event as the duration of the disease approaches 1 year is consonant with what is known about the progression of diabetic dysautonomia.
Conflict of Interest Statement
The authors declare that the research was conducted in the absence of any commercial or financial relationships that could be construed as a potential conflict of interest.
Acknowledgments
Supported by grant RO1 NS39774 and P20RR021954 from the National Institutes of Health.
References
Addicks, K., Boy, C., and Rosen, P. (1993). Sympathetic autonomic neuropathy in the heart of the spontaneous diabetic BB rat. Ann. Anat. 175, 253–257.
Agrawal, D. K., Bhimji, S., and McNeill, J. H. (1987). Effect of chronic experimental diabetes on vascular smooth muscle function in rabbit carotid artery. J. Cardiovasc. Pharmacol. 9, 584–593.
Biessels, G. J., Deary, I. J., and Ryan, C. M. (2008). Cognition and diabetes: a lifespan perspective. Lancet Neurol. 7, 184–190.
Brown, D. R., Li, S.-G., Lawler, J. E., and Randall, D. C. (1999). Sympathetic control of BP and BP variability in borderline hypertensive rats on high- vs. low-salt diet. Am. J. Physiol. Regul. Integr. Comp. Physiol. 277, R650–R657.
Burgess, D., Randall, D. C., and Stocker, S. D. (2009). Influence of diabetes on baroreflex (BR) sensitivity of sympathetic nerve activity (SNA). FASEB J. 23, 610.6.
Burgess, D. E., Hundley, J. C., Li, S., Randall, D. C., and Brown, D. R. (1997). Multifiber renal sympathetic nerve activity recordings predict mean arterial blood pressure in unanesthetized rat. Am. J. Physiol. Regul. Integr. Comp. Physiol. 273, R851–R857.
Chappel, C. I., and Chappel, W. R. (1983). The discovery of the development of the BB rat colony: an animal model of spontaneous diabetes mellitus. Metab. Clin. Exp. 32(Suppl. 1), 8–10.
Cherian, P. V., Kamijo, M., Angelides, K. J., and Sima, A. A. (1996). Nodal Na+ channel displacement is associated with nerve-conduction slowing in the chronically diabetic BB/W rat: prevention by aldose reductase inhibition. J. Diabetes Complicat. 10, 192–200.
El-Wazir, Y. M., Li, S. G., Williams, D. T., Sprinkle, A. G., Brown, D. R., and Randall, D. C. (2005). Differential acquisition of specific components of a classically conditioned arterial blood pressure response in rat. Am. J. Physiol. Regul. Integr. Comp. Physiol. 289, R784–R788.
El-Wazir, Y. M., Li, S.-G., Smith, R. G., Silcox, D. L., Brown, D. R., and Randall, D. C. (2008). Parasympathetic response to acute stress is attenuated in young Zucker obese rats. Auton. Neurosci. 143, 33–39.
Li, S., Lawler, J. E., Randall, D. C., and Brown, D. R. (1997). Sympathetic nervous activity and arterial pressure responses during rest and acute behavioral stress in SHR vs. WKY rats. J. Autonom. Nerv. Sys. 62, 147–154.
Li, S.-G., Randall, D. C., and Brown, D. R. (1998). Roles of cardiac output and peripheral resistance in mediating blood pressure response to stress in rats. Am. J. Physiol. Regul. Integr. Comp. Physiol. 274, R1065–R1069.
Li, Z.-G., Zhang, W., Grunberger, G., and Sima, A. A. F. (2002). Hippocampal neuronal apoptosis in type 1 diabetes. Brain Res. 946, 221–231.
Mitov, M. I., Callahan, L. A., and Campbell, K. S. (2009). Short-range mechanical properties of myocardium from diabetic rats. Biophys. J. 98(Suppl. 1), :717a.
Randall, D. C., Brown, D. R., Brown, L. V., and Kilgore, J. M. (1994). Sympathetic nervous activity and arterial blood pressure control in conscious rat during rest and behavioral stress. Am. J. Physiol. Regul. Integr. Comp. Physiol. 267, R1241–R1249.
Randall, D. C., Brown, D. R., Brown, L. V., Kilgore, J. M., Behnke, M. M., Moore, S. K., and Powell, K. R. (1993). Two-component arterial blood pressure conditional response in rat. Integr. Physiol. Behav. Sci. 28, 258–269.
Sack, M. N. (2009). Type 2 diabetes, mitochondrial biology and the heart. J. Mol. Cell. Cardiol. 46, 842–849.
Salgado, H. C., Fazan, R. Jr., Fazan, V. P., DaSilva, V. J., and Barreira, A. A. (2001). Alterial baoreceptors and experimental diabetes. Ann. N. Y. Acad. Sci. 940, 20–27.
Schmidt, R. E., Dorsey, D. A., Beaudet, L. N., and Peterson, R. G. (2003). Analysis of the Zucker diabetic fatty (ZDF) type 2 diabetic rat model suggests a neurotrophic role for insulin/IGF-I in diabetic autonomic neuropathy. Am. J. Pathol. 163, 21–28.
Sima, A. A., Zhang, W., Xu, G., Sugimoto, K., Guberski, D., and Yorek, M. A. (2000). A comparison of diabetic polyneuropathy in type II diabetic BBZDR/Wor rats and in type I BB/Wor rats. Diabetiologia 43, 786–793.
Taegtmeyer, H., McNulty, P., and Young, M. E. (2002). Adaption and maladaptation of the heart in diabetes: part I general concepts. Circulation 105, 1727–1733.
Vinik, A. I., Maser, R. E., Mitchell, B. D., and Freeman, R. (2003). Diabetic autonomic neuropathy. Diabetes Care 26, 1553–1579.
Wang, H., Layton, B. E., and Sastry, A. M. (2003). Nerve collagens from diabetic and nondiabetic Sprague-Dawley and biobreeding rats: an atomic force microscopy study. Diabetes Metab. Res. Rev. 19, 288–298.
Willingham, A., Williams, D., Brown, L., Brown, D., Cassis, L., Silcox, D., Anigbogu, C., and Randall, D. (2004). Arterial blood pressure response to an acute stress in rat following sino-aortic denervation. FASEB J. 18, A673–A674.
Xie, Z., Gong, M. C., Su, W., Xie, D., Turk, J., and Guo, Z. (2010). Role of calcium-independent phospholipase A2β in high glucose-induced activation of RhoA, Rho Kinase, and CPI-17 in cultured vascular smooth muscle cells and vascular smooth muscle hypercontractility in diabetic animals. J. Biol. Chem. 285, 8628–8638.
Yagihashi, S., and Sima, A. A. (1985a). Diabetic autonomic neuropathy. The distribution of structural changes in sympathetic nerves of the BB rat. Am. J. Pathol. 121, 138–147.
Yagihashi, S., and Sima, A. A. (1985b). Diabetic autonomic neuropathy in the BB rat. Ultrastructural and morphometric changes in sympathetic nerves. Diabetes 34, 558–564.
Yagihashi, S., and Sima, A. A. (1986). Diabetic autonomic neuropathy in BB rat. Ultrastructural and morphometric changes in parasympathetic nerves. Diabetes 35, 733–743.
Yagihashi, S., Zhang, W. X., and Sima, A. A. (1989). Neuroaxonal dystrophy in distal symmetric sensory polyneuropathy of the diabetic BB-rat. J. Diabet. Complications 3, 202–210.
Keywords: cardiovascular system, autonomic nervous system, dysautonomia, Pavlovian (classical) conditioning, anxiety, telemetry
Citation: Randall DC, Speakman RO, Silcox DL, Brown LV, Brown DR, Gong MC, Patwardhan A, Reynolds LR, Karounos DG, Burgess DE and Anigbogu CN (2011) Longitudinal analysis of arterial blood pressure and heart rate response to acute behavioral stress in rats with type 1 diabetes mellitus and in agematched controls. Front. Physio. 2:53. doi: 10.3389/fphys.2011.00053
Received: 25 April 2011; Accepted: 09 August 2011;
Published online: 27 August 2011.
Edited by:
Debra Diz, Wake Forest University School of Medicine, USACopyright: © 2011 Randall, Speakman, Silcox, Brown, Brown, Gong, Patwardhan, Reynolds, Karounos, Burgess and Anigbogu. This is an open-access article subject to a non-exclusive license between the authors and Frontiers Media SA, which permits use, distribution and reproduction in other forums, provided the original authors and source are credited and other Frontiers conditions are complied with.
*Correspondence: David C. Randall, Department of Physiology, University of Kentucky College of Medicine, Lexington, KY 40536-0298, USA. e-mail: randall@pop.uky.edu