 Kari K. Kalliokoski1,2* Robert Boushel3 Henning Langberg1 Celena Scheede-Bergdahl3 Ann Kathrine Ryberg1 Simon Døssing1 Andreas Kjær4 Michael Kjær1,3
- 1 Institute of Sports Medicine, Bispebjerg Hospital, Copenhagen, Denmark
- 2 Turku PET Centre, University of Turku, Turku, Finland
- 3 Department of Biomedical Sciences, Centre for Healthy Aging, University of Copenhagen, Copenhagen, Denmark
- 4 Department of Clinical Physiology, Nuclear Medicine, and PET, Rigshospitalet, University of Copenhagen, Copenhagen, Denmark
One-legged dynamic knee-extension exercise (DKE) is a widely used model to study the local cardiovascular and metabolic responses to exercise of the quadriceps muscles. In this study, we explored the extent to which different muscles of the quadriceps are activated during exercise using positron emission tomography (PET) determined uptake of [18F]-fluoro-deoxy-glucose (GU) during DKE. Five healthy male subjects performed DKE at 25 W for 35 min and both the contracting and contralateral resting leg were scanned with PET from mid-thigh and distally. On average, exercise GU was the highest in the vastus intermedius (VI) and lowest in the vastus lateralis (VL; VI vs VL, p < 0.05), whereas the coefficient of variation was highest in VL (VL vs VI, p < 0.05). Coefficient of variation between the mean values of the four quadriceps femoris (QF) muscles in the exercising leg was 35 ± 9%. Compared to mean GU in QF (=100%), GU was on average 73% in VL, 84% in rectus femoris, 115% in vastus medialis, and 142% in VI. Variable activation of hamstring muscles and muscles of the lower leg was also observed. These results show that GU of different muscles of quadriceps muscle group as well as between individuals vary greatly during DKE, and suggests that muscle activity is not equal between quadriceps muscles in this exercise model. Furthermore, posterior thigh muscles and lower leg muscles are more active than hitherto thought even during this moderate exercise intensity.
Introduction
One-legged dynamic knee-extension exercise (DKE) has been one of the most used models to study the effects of acute exercise on human skeletal muscle since its introduction in mid 1980s’ (Andersen et al., 1985). Early electromyography studies suggested that DKE causes quite even activation of the superficial quadriceps femoris (QF) muscles with no or minor activation in other leg muscles (Andersen et al., 1985). Later, it was shown with magnetic resonance imaging (MRI) that other than QF muscles remain fairly inactive during DKE even with relatively high exercise intensity (90% of VO2max; Richardson et al., 1998). On the other hand, it was shown that the different QF muscles are perhaps not so evenly activated during DKE as previously anticipated (Richardson et al., 1998). In a more recent series of experiments, it has been shown by use of measurements of muscle heat accumulation in the early phase of exercise (within the first 90 s), that all QF muscles are relatively equally activated during intense DKE (Gonzalez-Alonso et al., 2000; Krustrup et al., 2004, 2009), but not during moderate 50% intensity of max workload (Krustrup et al., 2009).
The findings of considerable heterogeneity in muscle blood flow during DKE measured with positron emission tomography (PET) conforms with variable muscle activation determined by heat production (Laaksonen et al., 2003; Heinonen et al., 2007). On the other hand, the rectus femoris (RF) was the most activated muscle in the study by Krustrup et al. (2009), whereas blood flow has usually been found to be the highest in vastus intermedius (VI) or medialis (VM; Laaksonen et al., 2006). This discrepant finding can partly be explained by the different time frame in the studies as Krustrup and colleagues studied the early response after commencing the exercise, while muscle blood flow has been measured during more prolonged steady-state exercise. However, further studies are warranted to more clearly elucidate how tightly muscle metabolism and blood flow are linked.
Glucose uptake measured with PET and [18F]-fluoro-deoxy-glucose ([18F]-FDG) has been recently applied to provide an estimate for metabolic activity and thus muscle activation in humans (Fujimoto et al., 1996; Tashiro et al., 1999; Pappas et al., 2001; Oi et al., 2003; Bojsen-Moller et al., 2006; Kalliokoski et al., 2007). Due to the fact that this particular tracer accumulates into the tissues where it has been taken up, it can be administered before PET scanning, for example during exercise. PET scanning can then be performed after the exercise and the obtained images show the tracer accumulation during the exercise (Figure 1). Thus, this method provides an excellent way to investigate the activation of different muscles during long-term steady-state DKE.
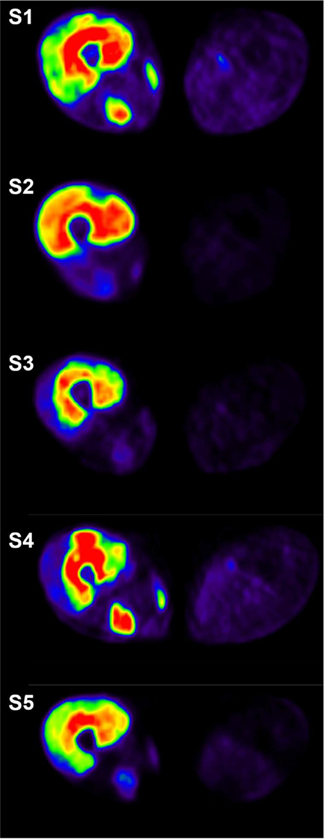
Figure 1. Cross-sectional positron emission tomography images taken from the mid-thigh immediately after 35 min of dynamic knee-extension exercise. [18F]-fluoro-deoxy-glucose ([18F]-FDG) was injected after 10 min of exercise and the image reflects cumulated activity during the period 10–35 min of exercise. Red color depicts the highest activity followed by yellow, green, and blue. Image from each subject is shown in different absolute scale to best visualize the relative individual differences in the different muscles.
In the present study we hypothesized that individual muscles of QF are not evenly activated during long-term steady-state moderate-intensity DKE. To test this we measured [18F]-FDG uptake with PET in five healthy men during DKE.
Materials and Methods
Subjects
Five healthy men participated in this study (age 25 ± 5, height 182 ± 7, weight 77 ± 8, and BMI 23 ± 3). Written informed consent was obtained after the purpose, nature, and potential risks were explained to the subjects. The study protocol was reviewed and approved by the Ethical Committee of Copenhagen and Frederiksberg communities (11-140/03) and the study was performed in accordance with the Declaration of Helsinki.
Study Protocol
This study was a part of larger study and microdialysis catheters were therefore inserted into the vastus lateralis (VL) muscle in the beginning of the study day (Kalliokoski et al., 2006). The fibers did not interfere with the region of interest for determination of glucose uptake in muscle, and furthermore, the fibers were not limiting for the exercise performance by the subjects. After fiber insertion the subjects were allowed to rest for 3 h during which two intravenous catheters were put into the antecubital veins in both arms. Thereafter, the subjects were moved to the DKE ergometer and one-leg exercise with the intensity of 25 W was started. Ten minutes after the beginning of the exercise 396 ± 27 MBq of [18F]-FDG in 5 mL of saline was infused and blood sampling commenced and continued until the end of the study. In total, 23 venous blood samples for the determination of blood radioactivity were taken. After the injection of the tracer the subject continued kicking for another 25 min. Immediately after the exercise subjects were moved into the PET scanner and the PET scanning was performed.
PET Image Acquisition and Processing
For PET scanning, a GE Advance scanner (General Electric Medical Systems, Milwaukee, WI, USA) was used. The scanner has 18 crystal rings forming 35 two-dimensional imaging planes spaced by 4.25 mm. In the emission scans both legs distal to the mid-thigh were scanned in 3 × 4-min time frames from four different areas of the legs. After the emission scans, transmission scans for attenuation correction were performed for the four different areas of the leg using germanium-68 pin sources. The data sets were reconstructed using the filtered back-projection method with a Hanning filter. All data sets were corrected for dead-time and random coincidences. The axial and in-plane resolution of the reconstructed images was approximately 5 mm full-width at half maximum.
Regions of Interest
In the thigh area, regions of interest (ROIs) were drawn over one mid-thigh plane that is shown in Figure 1. For other muscles the cross-sectional plane where each particular muscle was best shown was selected based on anatomical reference images.
Calculation of Glucose Uptake Index
Glucose uptake index of the muscles was calculated by dividing the tissue radioactivity with blood radioactivity (Yokoyama et al., 2003). Yokoyama et al. (2003) have compared this method to traditional graphical analysis (Patlak and Blasberg, 1985) demonstrating an excellent linear relationship (r = 0.968–0.984) between absolute glucose uptake from graphical analysis and glucose uptake index from the simplified method The first time frames of the scanning were used for the analysis as also the blood sample from the respective time point. Since the PET imaging was performed immediately after the exercise the results reflect very well the uptake of [18F]-FDG during the exercise period (Kemppainen et al., 2002). Since the tracer content in the blood is very low (less than 5% of the injected amount left) 25 min after the tracer injection and exercise, the period between the end of exercise and the start of the scan has only a minor influence on the measured values of skeletal muscle glucose uptake.
Statistical Analysis
Statistical analysis was performed with the SAS statistical program package version 8.2 (SAS Institute, Cary, NC, USA). ANOVA for repeated measurements was used to test the differences between resting and exercising muscle and between the muscle regions. When differences were found, paired comparison was made using Tukey’s post hoc test. p-Value < 0.05 was considered statistically significant. The results are expressed as means ± SD.
Results
On average glucose uptake was highest during exercise in VI and lowest in VL muscle but the individual variation was large (Figure 2). In the resting muscle glucose uptake was also highest in VI but lowest in RF (Figure 2). The coefficient of variation in the four resting muscles was 21 ± 3% and it increased (p = 0.044) to 35 ± 9% between exercising muscles showing heterogeneous activation of QF muscles. The same phenomenon from another point of view was observed in the relative increases in glucose uptake caused by exercise (11.5-fold in VL, 15.1-fold in RF, 14.6-fold in VM, and 18.4-fold in VI). Only the difference between VL and VI was significant (p = 0.04).
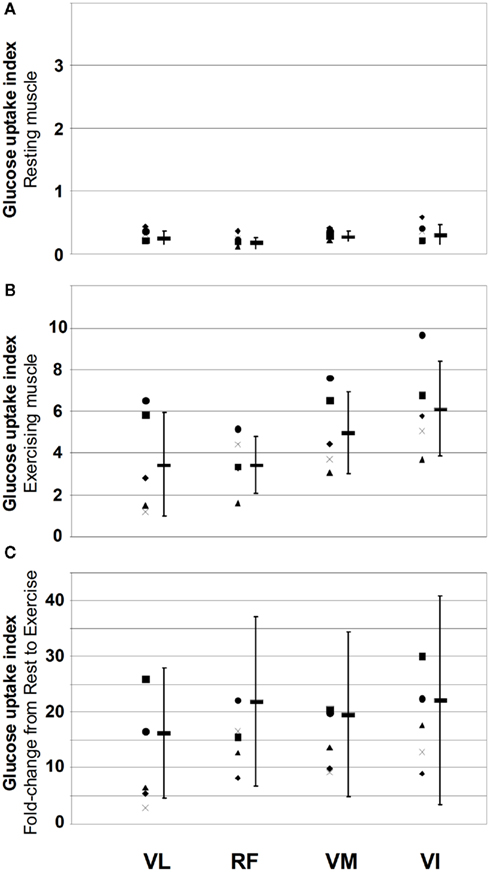
Figure 2. Muscle glucose uptake index at rest (A) and during exercise (B) and the fold-increase in glucose uptake from rest to exercise (C) in the for different quadriceps femoris muscles in the five study subjects. Different symbols on the left-hand side of each muscle depict different subjects and the thick line and error bars depict the mean and SD within each muscle. Muscle abbreviations are: vastus lateralis (VL), rectus femoris (RF), vastus medialis (VM), and vastus intermedius (VI).
The largest variation in glucose uptake between the subjects in the exercising muscle was observed in the VL (69%) while in the other three muscles variation was almost the same (38% in RF, 38% in VM, and 36% in VI) as in the entire QF (41%). Compared to the mean glucose uptake in QF (=100%), glucose uptake was similar in RF (84% of the QF value, VM 115%, but in VL (73%) and in VI (142%) it differed significantly.
Other than QF muscles were also variably activated between the subjects. In the posterior thigh region biceps femoris was markedly activated in four out of the five subjects (Table 1; Figure 1). Some activation was also seen in the sartorius muscle as seen in the posterio-medial side of the thigh in Figure 1. Also, lower leg muscles were metabolically active. Three of the subjects activated the tibialis anterior muscle (Table 1). The same subjects had also increased activation in the popliteus muscle (Table 1). Soleus muscle was not significantly activated in any of the subjects, but there was increased activation of lateral gastrocnemius muscle in all subjects and of medial gastrocnemius muscle in two subjects.
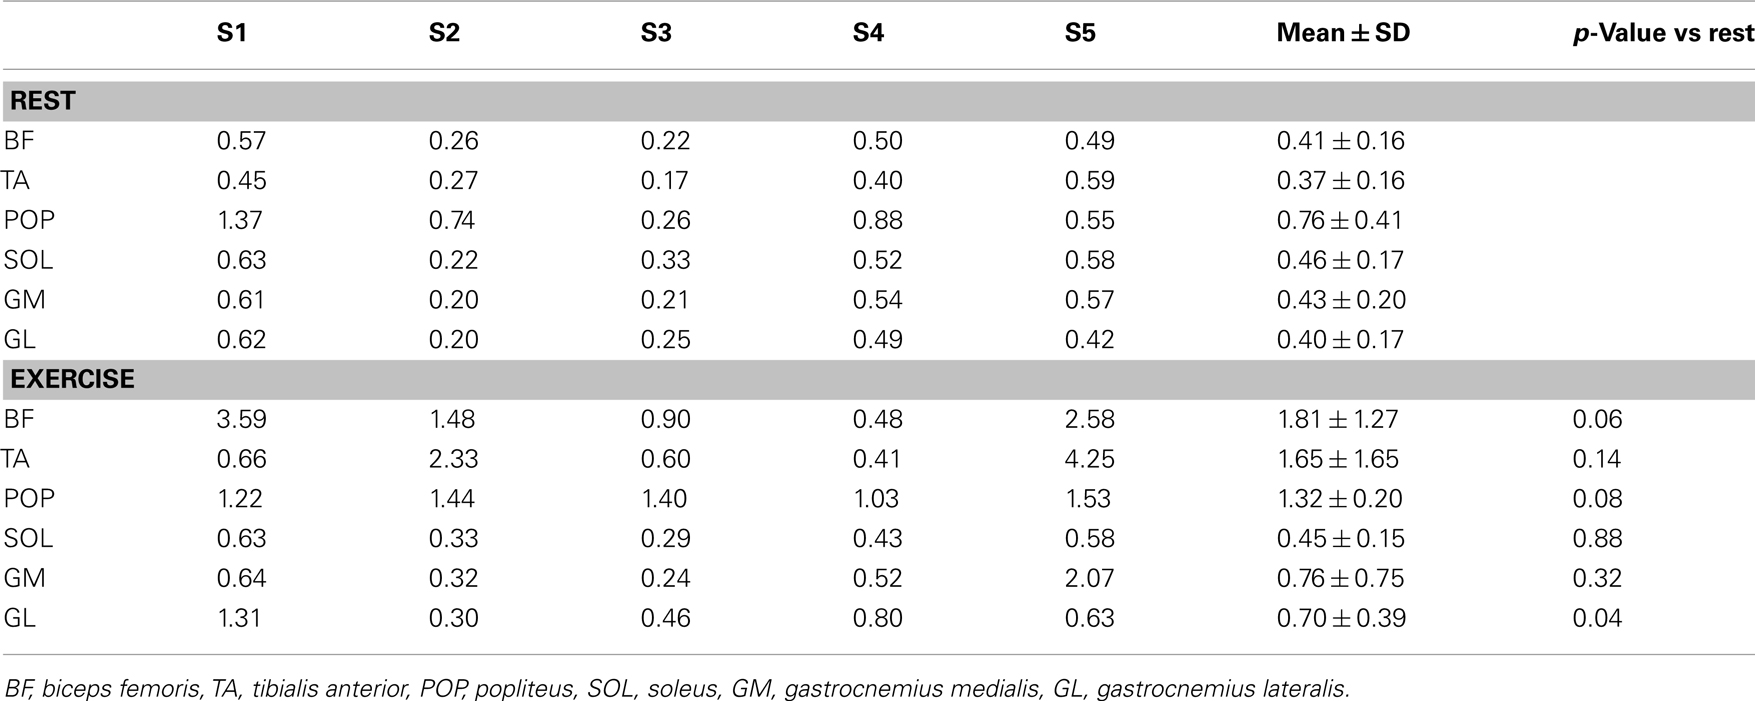
Table 1. Muscle glucose uptake index at rest and during exercise in other selected thigh and leg muscles in five study subjects (S1–S5) and the mean ± SD of the subjects.
Discussion
Since its introduction in the mid-eighties the one-legged DKE model has been widely applied in different settings to study acute and chronic responses to exercise of an isolated skeletal muscle group (Andersen et al., 1985). It has been assumed that the DKE model activates all QF muscles with limited contribution from other leg and thigh muscles. In the present study we used FDG–PET to study activation of QF and other thigh and leg muscles during this same exercise model and found several interesting novel findings. First, QF muscles have an uneven glucose uptake during moderate-intensity long-term steady-state one-leg DKE. Second, the pattern in QF muscles differs significantly between subjects and the variation between the subjects is largest in VL. Third, glucose uptake in RF and VM is closest to the mean glucose uptake of whole QF, while glucose uptake in VL is lower than the value for the whole QF. Finally, variable activation was also observed during knee-extension in the posterior thigh and lower leg muscles. These findings are in concordance with the recent findings by Krustrup et al. (2009) and emphasize that metabolism in the leg muscles is not homogenous during knee-extension exercise.
The discrete differences in the patterns of metabolic activity in RF between the study of Krustrup et al. (2009) likely stem from differences in muscle recruitment patterns over time. They studied the early response after commencing exercise, while we studied the activation during a longer period of steady-state exercise (cumulative activity during the period of 10–35 min of steady-state exercise).
It has generally been assumed that muscle glucose uptake distribution among QF muscles varies in parallel with blood flow distribution during exercise (Laaksonen et al., 2003; Heinonen et al., 2007). However, there was large inter-individual variation in the activation pattern (see Figure 2). In two subjects (S3 and S4), VL was minimally activated compared to VM and VI, while one (S2) had almost even activation of VL, VM, and VI. Subjects 1 and 5 had more similar metabolic activation of all muscles. On average the largest increase from rest to exercise was observed in VI and the smallest was observed in VL, which displayed large individual variation (3- to 26-fold-increase). The implications of this study are that local measures of metabolism of VL muscle for example, from biopsy analysis may not be representative of the whole muscle. Although we measured only glucose uptake and nothing is known regarding the use of other substrates (blood FFA, glycogen, muscle triglycerides), our findings could at least partly implicate variation in the mechanical efficiency of muscular work and that it may be larger in moderate-intensity exercise than previously estimated during high-intensity exercise (Bangsbo, 1996).
Muscle activity was lowest in VL relative to the whole QF and highest in VI. RF and VM were somewhat closer to the mean QF values, but still ∼15–20% under- and overestimated, respectively. Within individuals, variation was large both in VL and RF. In the VL of one subject glucose uptake was 60% lower than the mean of whole QF, while another had almost exactly the same value in VL as in the whole QF. Similarly in one subject, glucose uptake in the RF was 40% lower and in another it was 40% higher than the mean of whole QF.
Our results showed also a variable activation of other than QF muscles. In the biceps femoris and tibialis anterior muscles of the exercising limb glucose uptake was on average about 4.5-fold higher than that of the resting contralateral muscle and roughly half of the glucose uptake in the exercising VL and RF. In contrary to our results, Andersen et al. (1985) found minimal EMG activity in these particular muscles. This could imply that, although these muscles seem not to be voluntarily activated, glucose uptake was elevated due to passive movement. The experimental approach is not entirely comparable to this study since an occlusion cuff was placed above the knee to isolate the thigh region. Yet it has been recently shown that muscle blood flow during knee-extension is approximately tripled during passive leg movement (Hellsten et al., 2008). However, Hellsten et al. (2008) did not observe statistically significant increase in oxygen uptake in the passively moved leg, though on average oxygen uptake was twice as high in the passively moved leg. Taken together, these findings could imply that glucose taken up by the biceps muscle was not used for energy production, but stored for future use as muscle glycogen and warrants further investigation.
Methodological Considerations
Traditionally muscle activation has been measured with electromyography (EMG), but this method has limitations, especially for the measurements of profundus muscles. This has been circumvented by the use of fine wire electrodes introduced into the muscle via needle catheter. A similar method that has been used to measure muscle activity during exercise is the measurements of muscle heat production with thermistors (Gonzalez-Alonso et al., 2000; Krustrup et al., 2004, 2009). More recently, non-invasive imaging techniques such as functional MRI and PET have been applied for the measurement of muscle activity during different exercises (Fujimoto et al., 1996; Richardson et al., 1998; Tashiro et al., 1999; Bojsen-Moller et al., 2006; Kinugasa et al., 2006; Damon et al., 2007; Kalliokoski et al., 2007; Wen et al., 2008). The strength of these methods includes the possibility to measure activity in the large number of superficial and more importantly also deeper muscles. These methods neither require any invasive procedures in the muscles that are to be studied. The weaknesses include relatively high costs of the experiments and thereby poor accessibility among the researchers.
In conclusion, the results of the present study show that glucose uptake and activation of QF muscles is heterogeneous and the activation strategy of QF muscles shows large individual variation. The largest individual variation in glucose uptake during exercise is observed in VL muscle. These findings point to the need for further study of the links between muscle activation, blood flow distribution and metabolic regulation at the micro-tissue level during exercise.
Conflict of Interest Statement
The authors declare that the research was conducted in the absence of any commercial or financial relationships that could be construed as a potential conflict of interest.
Acknowledgments
Academy of Finland (grants 206970 and 204240), Ministry of Education in Finland (grants 143/722/2002, 51/722/2003, and 40/627/2005), Juho Vainio Foundation (Finland), the Danish National Research Foundation (Denmark), Danish Medical Research Council, Lundbeck Foundation (Denmark), Novo-Nordisk Foundation, Nordea Foundation and Fonds de la recherche en Sante Quebec, Natural Science and Engineering Research Council of Canada have given financial support for this work. The authors want to thank the personnel at the Department of Clinical Physiology, Nuclear Medicine, and PET, Rigshospitalet, Copenhagen, Denmark for help during the study.
References
Andersen, P., Adams, R. P., Sjogaard, G., Thorboe, A., and Saltin, B. (1985). Dynamic knee extension as model for study of isolated exercising muscle in humans. J. Appl. Physiol. 59, 1647–1653.
Bangsbo, J. (1996). Physiological factors associated with efficiency in high intensity exercise. Sports Med. 22, 299–305.
Bojsen-Moller, J., Kalliokoski, K. K., Seppanen, M., Kjaer, M., and Magnusson, S. P. (2006). Low intensity tensile loading increases intratendinous glucose uptake in the Achilles tendon. J. Appl. Physiol. 101, 196–201.
Damon, B. M., Louie, E. A., and Sanchez, O. A. (2007). Physiological basis of muscle functional MRI. J. Gravit. Physiol. 14, 85–88.
Fujimoto, T., Itoh, M., Kumano, H., Tashiro, M., and Ido, T. (1996). Whole-body metabolic map with positron emission tomography of a man after running. Lancet 348, 266.
Gonzalez-Alonso, J., Quistorff, B., Krustrup, P., Bangsbo, J., and Saltin, B. (2000). Heat production in human skeletal muscle at the onset of intense dynamic exercise. J. Physiol. 524(Pt 2), 603–615.
Heinonen, I., Nesterov, S. V., Kemppainen, J., Nuutila, P., Knuuti, J., Laitio, R., Kjaer, M., Boushel, R., and Kalliokoski, K. K. (2007). Role of adenosine in regulating the heterogeneity of skeletal muscle blood flow during exercise in humans. J. Appl. Physiol. 103, 2042–2048.
Hellsten, Y., Rufener, N., Nielsen, J. J., Hoier, B., Krustrup, P., and Bangsbo, J. (2008). Passive leg movement enhances interstitial VEGF protein, endothelial cell proliferation, and eNOS mRNA content in human skeletal muscle. Am. J. Physiol. Regul. Integr. Comp. Physiol. 294, R975–R982.
Kalliokoski, K. K., Bojsen-Moller, J., Seppanen, M., Johansson, J., Kjaer, M., Teras, M., and Magnusson, S. P. (2007). Contraction-induced [18F]-fluoro-deoxy-glucose uptake can be measured in human calf muscle using high-resolution PET. Clin. Physiol. Funct. Imaging 27, 239–241.
Kalliokoski, K. K., Langberg, H., Ryberg, A. K., Scheede-Bergdahl, C., Doessing, S., Kjaer, A., Kjaer, M., and Boushel, R. (2006). Nitric oxide and prostaglandins influence local skeletal muscle blood flow during exercise in humans: coupling between local substrate uptake and blood flow. Am. J. Physiol. Regul. Integr. Comp. Physiol. 291, R803–R809.
Kemppainen, J., Fujimoto, T., Kalliokoski, K. K., Viljanen, T., Nuutila, P., and Knuuti, J. (2002). Myocardial and skeletal muscle glucose uptake during exercise in humans. J. Physiol. (Lond.) 542, 403–412.
Kinugasa, R., Kawakami, Y., and Fukunaga, T. (2006). Quantitative assessment of skeletal muscle activation using muscle functional MRI. Magn. Reson. Imaging 24, 639–644.
Krustrup, P., Soderlund, K., Mohr, M., Gonzalez-Alonso, J., and Bangsbo, J. (2004). Recruitment of fibre types and quadriceps muscle portions during repeated, intense knee-extensor exercise in humans. Pflugers Arch. 449, 56–65.
Krustrup, P., Soderlund, K., Relu, M. U., Ferguson, R. A., and Bangsbo, J. (2009). Heterogeneous recruitment of quadriceps muscle portions and fibre types during moderate intensity knee-extensor exercise: effect of thigh occlusion. Scand. J. Med. Sci. Sports 19, 576–584.
Laaksonen, M. S., Kalliokoski, K. K., Kyrolainen, H., Kemppainen, J., Teras, M., Sipila, H., Nuutila, P., and Knuuti, J. (2003). Skeletal muscle blood flow and flow heterogeneity during dynamic and isometric exercise in humans. Am. J. Physiol. Heart Circ. Physiol. 284, H979–H986.
Laaksonen, M. S., Kyrolainen, H., Kalliokoski, K. K., Nuutila, P., and Knuuti, J. (2006). The association between muscle EMG and perfusion in knee extensor muscles. Clin. Physiol. Funct. Imaging 26, 99–105.
Oi, N., Iwaya, T., Itoh, M., Yamaguchi, K., Tobimatsu, Y., and Fujimoto, T. (2003). FDG-PET imaging of lower extremity muscular activity during level walking. J. Orthop. Sci. 8, 55–61.
Pappas, G. P., Olcott, E. W., and Drace, J. E. (2001). Imaging of skeletal muscle function using (18)FDG PET: force production, activation, and metabolism. J Appl. Physiol. 90, 329–337.
Patlak, C. S., and Blasberg, R. G. (1985). Graphical evaluation of blood-to-brain transfer constants from multiple-time uptake data. Generalizations. J. Cereb. Blood Flow Metab. 5, 584–590.
Richardson, R. S., Frank, L. R., and Haseler, L. J. (1998). Dynamic knee-extensor and cycle exercise: functional MRI of muscular activity. Int. J. Sports Med. 19, 182–187.
Tashiro, M., Fujimoto, T., Itoh, M., Kubota, K., Fujiwara, T., Miyake, M., Watanuki, S., Horikawa, E., Sasaki, H., and Ido, T. (1999). 18F-FDG PET imaging of muscle activity in runners. J. Nucl. Med. 40, 70–76.
Wen, H., Dou, Z., Finni, T., Havu, M., Kang, Z., Cheng, S., Sipila, S., Sinha, S., Usenius, J. P., and Cheng, S. (2008). Thigh muscle function in stroke patients revealed by velocity-encoded cine phase-contrast magnetic resonance imaging. Muscle Nerve 37, 736–744.
Keywords: glucose uptake, muscle activation, knee-extensors, EMG, PET
Citation: Kalliokoski KK, Boushel R, Langberg H, Scheede-Bergdahl C, Ryberg AK, Døssing S, Kjær A and Kjær M (2011) Differential glucose uptake in quadriceps and other leg muscles during one-legged dynamic submaximal knee-extension exercise. Front. Physio. 2:75. doi: 10.3389/fphys.2011.00075
Received: 16 September 2011; Accepted: 05 October 2011;
Published online: 25 October 2011.
Edited by:
Derek John Hausenloy, University College London, UKReviewed by:
Thorsten Rudroff, University of Colorado at Boulder, USAHeikki Kainulainen, University of Jyväskylä, Finland
Copyright: © 2011 Kalliokoski, Boushel, Langberg, Scheede-Bergdahl, Ryberg, Døssing, Kjær and Kjær. This is an open-access article subject to a non-exclusive license between the authors and Frontiers Media SA, which permits use, distribution and reproduction in other forums, provided the original authors and source are credited and other Frontiers conditions are complied with.
*Correspondence: Kari K. Kalliokoski, Turku PET Centre, University of Turku, Kiinamyllynkatu 4-8, FI-20520 Turku, Finland. e-mail: kari.kalliokoski@tyks.fi