
- Institute of Physiology, University of Hohenheim, Germany
Monitoring the luminal content in the stomach is of vital importance for adjusting the gastric activities, including the release of gastric hormones such as gastrin. Our previous studies have shown that in mice the gastrin-secreting G-cells express receptor types which are responsive to amino acids. Since the pig is considered as more suitable model for studying gastro-physiological aspects relevant for men, in this study we have analyzed the distribution of G-cells and D-cells in the gastric antrum of men, swine, and mouse and the expression of receptor types which may render these cells responsiveness to protein breakdown products. The results indicate that the number of G-cells per antral invagination was significantly higher in swine and human compared to mice and also the distribution pattern of G-cells differed between the species. The molecular phenotyping revealed that the receptors GPRC6A and CaSR were also expressed in G-cells and in a subpopulation of D-cells from swine and men. As an additional receptor type, the peptone-receptor GPR92, was found to be expressed in G-cells and a subpopulation of D-cells; this receptor type may be particular suitable for sensing protein breakdown products and thus be a key element to adjust the activity of G-cells and D-cells according to the progress of the digestive processes in the stomach. In search for elements of an intracellular signaling cascade it was found that G-cells express the G-protein subunit Gαq as well as the phospholipase C subtype PLCβ3; in contrast, D-cells expressed the subtype PLCβ2 and neither Gαq. These results indicate that there are significant species differences concerning the number and distribution pattern, but not concerning the molecular phenotype of the gastric endocrine cells. However, G-cells and D-cells significantly differ from each other regarding the repertoire of receptors and signaling elements.
Introduction
Physiological processes in the gastrointestinal tract, such as motility, acid secretion, and the release of hormones must permanently be adjusted according to the composition of ingested food. Therefore, it is essential to continuously monitor the luminal content by appropriate sensory systems. In the stomach, sensing of protein breakdown products is of particular significance as they activate antral G-cells which release gastrin, the central hormone for controlling gastric activities (Zeng et al., 1995; Dockray et al., 2001, 2005). The activity of G-cells is negatively controlled by somatostatin which is released from antral D-cells. Thus, it is essential for both cell types to fine-tune their activities according to the amount of proteins and their breakdown products in the luminal content of the stomach. The mechanisms which regulate the activities of G- and D-cells according to luminal nutrients are still elusive. Previous studies have demonstrated that in mice the endocrine G-cells and D-cells express receptor types which are responsive to amino acids (Feng et al., 2010; Haid et al., 2011). However, the mice gastrointestinal physiology differs considerably from that of human which is much more similar to that of swine (Pond and Houpt, 1978; Tumbleson and Schook, 1996; Kuzmuk and Schook, 2011). In view of pathological disorders such as antral G-cell hyperfunction (AGCH; Delle Fave et al., 1990; Kwan and Tytgat, 1995) it is important to evaluate the most appropriate model organism for studying human gastro-physiological processes. Therefore, comparative studies were performed to elucidate the distribution and molecular phenotype of G-cells and D-cells in the antral mucosa of men, swine, and mouse. Expression of amino acid responsive receptors has led to the concept that these receptors may provide the capacity for sensing amino acids in the luminal content. However, it is unclear whether these receptor types are sufficient to determine the receptive requirements of G-cells to accommodate the release of gastrin according to general breakdown products of protein digestion. In this context it is interesting to note that a recent deorphanization revealed that the receptor type GPR92 (also named GPR93; LPAR5) was activated by protein-hydrolysates (Choi et al., 2007a,b) which may render this receptor type as a candidate which may contribute to the responsiveness of G-cells to protein digests. The notion that signaling via the GPCRs may affect the release of hormones implies that the distinct signaling elements compatible with the receptor types, such as the Gαq-proteins (Buchan et al., 2001; Hofer and Brown, 2003) or the Gαi-proteins (Brown and MacLeod, 2001; Ward, 2004; Pi et al., 2005) are expressed in G- and D-cells.
Materials and Methods
Murine Tissue
Analyses were performed with wild type mouse strains C57/BL6J from Charles River (Sulzfeld, Germany). Animals were fed with standard laboratory chow ad libitum and had free access to water. All experiments comply with the Principles of animal care, publication no. 85–23, revised 1985, of the National Institutes of Health and with the current laws of Germany.
Porcine Tissue
Porcine stomach tissue (Sus scrofa) was obtained from a slaughterhouse. Immediately after slaughter, tissue was washed with 1× PBS (0.85% NaCl, 1.4 mM KH2PO4, 8 mM Na2HPO4, pH 7.4) and immediately transferred into freezer bags, frozen on dry ice and stored at −70°C until use.
Human Tissue
Human gastric tissue samples were taken during endoscopic gastric biopsies for routine diagnostic purposes in the department for general, visceral, and transplant surgery in the University Hospital in Tübingen and in the Clinic of surgery Munich-Bogenhausen. Macroscopically normal tissue specimens were obtained from the antral mucosa of the greater curvature of patients in whom peptic ulcer, gastritis, instable body weight, type 2 diabetes or infection with Helicobacter pylori were excluded. After sampling of mucosal tissue, material was immediately transferred into a collection tube, frozen on dry ice, and stored at −7ºC until use. Sample collection and experiments were performed in accordance to the approval of the Ethics Commission Board of the University Hospital in Tübingen and written informed consent was obtained from all patients.
RNA Isolation and cDNA Synthesis
Total RNA was isolated from dissected tissue preparations of the gastric antrum with a NucleoSpin RNA kit (Macherey-Nagel, Düren, Germany) according to the manufacturer’s protocol. To ensure the complete removal of DNA, a DNase digestion (DNase I, Life Technologies, Carlsbad, CA, USA) step was included. Subsequently, 1.0 μg total RNA was reversely transcribed using oligo(dT) primers and SuperScript III Reverse Transcriptase (RT; Invitrogen, Carlsbad, CA, USA). RNA integrity of each sample was controlled by the amplification of the housekeeping gene for the ribosomal protein L8 (RpL8) with intron spanning primers for each species to verify the DNA removal.
Reverse Transcriptase Polymerase Chain Reaction
Reverse transcriptase polymerase chain reaction (RT-PCR) amplification was conducted by using normalized cDNA from accordant tissues as described above. PCR amplifications were performed with the following primer combinations:
Mouse
mPLCβ1 forward, 5′-CCA CAA GAA AAC CAC GGA GC-3′; mPLCβ1 reverse, 5′-CTG CTG GCG GAT CTC ATT G-3′; mPLCβ2 forward, 5′-TGG AGG CTG AAG TAA AGG AGT CGG-3′; mPLCβ2 reverse, 5′-CCT GAG TGT CTG CCT TGC TCA CAA-3′; mPLCβ3 forward, 5′-TGG AGC ATC TAC GAC AGG C-3′; mPLCβ3 reverse, 5′-GTT CTC CTC CTG GCT CTC CGA G-3′; mPLCβ4 forward, 5′-GCC AGG AAG CCA AGA AAG GT-3′; mPLCβ4 reverse, 5′-TGC TGG GTC TGC TGC TCA T-3′; degenerate primers for mGαq based on sequence motifs of the corresponding Gαq family members (Gα11, Gα14, Gαq): mGαq forward, 5′-GAG AAC CGC ATG GAG GAG AG-3′; mGαq reverse, 5′-GCR AAS ACR AAG CGG ATR TT-3′; mGαi2 forward, 5′-GCC ATC ATC TTC TGT GTC GC-3′; mGαi2 reverse, 5′-CTG CAC GTT CTT GGT GTC G-3′; mRpL8 forward, 5′-GTG CCT ACC ACA AGT ACA AGG C-3′; mRpL8 reverse, 5′-CAG TTT TGG TTC CAC GCA GCC G-3′.
Swine
sGPRC6A forward, 5′-CAC RRG CTT YTT YRT TGG AGA A-3; sGPRC6A reverse, 5′-GGA TRA TGA CTC TRG GCA AGG A-3′; sCaSR forward, 5′-TGC CCA GAT GAC TTC TGG TCC A-3′; sCaSR reverse, 5′-GCA CGA GAT GCA GAG CAC GAA GC-3′; degenerate primers for sGPR92 (matching conserved sequence motifs of human, simian, bovine, and murine genes): sGPR92 forward, 5′-TTC CTG CTG TGC TTC GTG CC-3′; sGPR92 reverse, 5′-GCC AGC AGC ACC ATB AYC ATC A-3′; sRpL8 forward, 5′-GTG TGG TGG CTG GAG GTG GCC GC-3’s; RpL8 reverse, 5′-CTT GGT TCC TCG GAG ACG CCC TG-3′.
Human
hGPRC6A forward, 5′-TCC TTG CCC AGA GTC ATC ATC C-3′; hGPRC6A reverse, 5′-TGC TGC TCA CAC TAT GGG AAG A-3′; hCaSR forward, 5′-CGC ACC AGA ACT CCC TGG AGG C-3′; hCaSR reverse, 5′-CAC TAC GTT TTC TGT AAC AGT G-3′; hGPR92 forward, 5′-CTC CTG CTG GCT AAC CTC GTC A-3′; hGPR92 reverse, 5′-GAC GGC GGA CCT TCC GGA TT-3′; hRpL8 forward, 5′-CAA GAA GAC CCG TGT GAA GC-3′; hRpL8 reverse, 5′-GGC AGC AAT GAG ACC CAC TTT-3′.
Reverse transcriptase polymerase chain reaction was carried out using High Fidelity PCR Enzyme Mix (Fermentas, St. Leon-Rot, Germany) and a Peltier PTC-200 thermo cycler (MJ Research). For amplification the following PCR cycling profile was used with annealing temperatures adjusted to the used primer combinations and optimized numbers of amplification cycles. One cycle: 3 min at 94°C; 20 cycles: 30 s at 94°C, 40 s at 65°C with −0.5°C per cycle, 40 s at 72°C; 20–31 cycles: 30 s at 94°C, 20 s at 55°C, 40 s at 72°C; and one cycle: 1 min at 72°C. PCR products were run on a 1.5% agarose gel containing EtdBr. Amplification of the housekeeping gene for the RpL8 with intron spanning primers for each species was used as control to confirm equal quality and quantity of the cDNA preparations. PCR products were subsequently cloned into pGem-T vector (Promega, Madison, WI, USA) and subjected to sequence analysis in an ABI PRISM 310 Genetic Analyzer (Applied Biosystems, Foster City, CA, USA).
Tissue Preparation
Murine Tissue
For immunohistochemistry removed stomachs were rinsed in 1× PBS and immersed in 4% ice-cold paraformaldehyde (in 150 mM phosphate buffer, pH 7.4) for 4 h or in 4% formalin solution (Roti-Histofix, Roth, Karlsruhe, Germany) for 1 h. After fixation the tissue was cryoprotected by incubation in 25% sucrose overnight at 4°C. Finally, the tissue was embedded in Tissue Freezing Medium (Leica Microsystems, Bensheim, Germany) and quickly frozen on dry ice or liquid nitrogen. Cryosections (4 μm) were generated using a CM3050S cryostat (Leica Microsystems) and adhered to Superfrost Plus microscope slides (Menzel Gläser, Braunschweig, Germany).
For immunoreactivity to GPRC6A and PLCβ3 mice were gassed with CO2 and perfused via the left heart ventricle with 1× PBS (0.85% NaCl, 1.4 mM KH2PO4, 8 mM Na2HPO4, pH 7.4) followed by 4% ice-cold paraformaldehyde with (PLCβ3) or without (GPRC6A) 0.1% glutardialdehyde (in 150 mM phosphate buffer, pH 7.4). The stomach was removed and rinsed with 1× PBS. After fixation in the same fixative for 10 min to 26 h, the tissue was cryoprotected by incubation in 25% sucrose overnight at 4°C. Finally, the tissue was embedded in Tissue Freezing Medium and quickly frozen on dry ice or liquid nitrogen. Cryosections (4 μm) were generated using a CM3050S cryostat (Leica Microsystems) and adhered to Superfrost Plus microscope slides (Menzel Gläser).
Porcine Tissue
Frozen tissue was thawed in 1× PBS (0.85% NaCl, 1.4 mM KH2PO4, 8 mM Na2HPO4, pH 7.4) and fixed in 4% formalin solution (Roti-Histofix, Roth, Karlsruhe, Germany) for 30 min to 24 h. After fixation the tissue was cryoprotected by incubation in 25% sucrose overnight at 4°C. Finally, the tissue was embedded in Tissue Freezing Medium and quickly frozen on dry ice or liquid nitrogen. Cryosections (4 μm) were generated using a CM3050S cryostat (Leica Microsystems) and adhered to Superfrost Plus microscope slides (Menzel Gläser).
Human Tissue
Frozen tissue was thawed in 1× PBS (0.85% NaCl, 1.4 mM KH2PO4, 8 mM Na2HPO4, pH 7.4) and fixed in 4% formalin solution (Roti-Histofix, Roth, Karlsruhe, Germany) for 20 min to 26 h. After fixation the tissue was cryoprotected by incubation in 25% sucrose overnight at 4°C. Finally, the tissue was embedded in Tissue Freezing Medium and quickly frozen on dry ice or liquid nitrogen. Cryosections (4 μm) were generated using a CM3050S cryostat (Leica Microsystems) and adhered to Superfrost Plus microscope slides (Menzel Gläser).
Immunohistochemistry
Cryosections (4 μm) were air-dried, rinsed in 1× PBS for 10 min at room temperature and blocked in 0.3% Triton X-100 in 1× PBS containing either 10% normal goat serum (NGS; Dianova, Hamburg, Germany) or 10% normal donkey serum (NDS; Dianova, Hamburg, Germany) for 30 min at room temperature.
For immunoreactivity to CaSR cryosections underwent citrate-antigen-retrieval. Therefore, frozen sections were incubated in sodium citrate buffer (10 mM sodium citrate, 0.05% Tween 20, pH 6.0) for 45 min at 4°C. Afterward sections were immersed in the same sodium citrate buffer for 3 min to 10 min at 100°C. After three rinses for 5 min in 1× PBS, cryosections were blocked in 0.3% Triton X-100 in 1× PBS containing either 10% NGS or 10% NDS for 30 min at room temperature.
For single- and double-labeling experiments, primary antibodies were diluted in 0.3% Triton X-100 in 1× PBS containing either 10% NGS or 10% NDS. Antibodies were used in the following dilutions: rabbit anti-GPRC6A (SP4276P, Acris Antibodies, Herford, Germany) 1:50; guinea pig anti-gastrin (BP5046, Acris Antibodies, Herford, Germany) 1:300–1:2500; goat anti-somatostatin (sc-7819, Santa Cruz Biotechnology, Santa Cruz, CA, USA) 1:500–1:2500; mouse anti-calcium sensing receptor (MA1-934, ABR Affinity BioReagents, Golden, USA) 1:100–1:150; rabbit anti-PLCβ2 (sc-206, Santa Cruz Biotechnology, Santa Cruz, CA, USA) 1:50–1:100; rabbi anti-PLCβ3 (sc-13958, Santa Cruz Biotechnology, Santa Cruz, CA, USA) 1:50; rabbit anti-GPR92 (sc-135237, Santa Cruz Biotechnology, Santa Cruz, CA, USA) 1:50; rabbit anti-Gαq (sc-393, Santa Cruz Biotechnology, Santa Cruz, CA, USA) 1:50; rabbit anti-Gαq (raised against a c-terminal peptide: LQLNLKEYNLV) 1:100 and rabbit anti-Gαi2 (raised against a c-terminal peptide: NLREDGEKAAREV) 1:50, which were a kind gift from Prof. G. Schultz, Institute of Pharmacology, Freie Universität Berlin. Blocked sections were incubated with the diluted primary antibodies overnight at 4°C. After washing in 1× PBS, the bound primary antibodies were visualized using appropriate secondary antibodies conjugated to Alexa 488, Alexa 568, or Cy3 (Invitrogen, Karlsruhe, Germany, 1:500) diluted in 1× PBS with 0.3% Triton X-100 containing either 10% NGS or 10% NDS for 2 h at room temperature. After three rinses for 5 min in 1× PBS the sections were counterstained with 4,6-diamidino-2-phenylindole (DAPI; 1 μg/mL, Sigma Aldrich, Schnelldorf, Germany) for 3 min at room temperature, rinsed with bidest, and finally mounted in MOWIOL (10% polyvinylalcohol 4-88 (Sigma), 20% glycerol in 1× PBS). No immunoreactivity could be observed when the primary antibodies were omitted.
Microscopy and Photography
Immunohistochemical staining was documented by using a Zeiss Axiophot microscope (Carl Zeiss MicroImaging, Jena, Germany). Images were captured using a Zeiss Axiocam for transmitted light and a “Sensi-Cam” CCD-camera (PCOimaging, Kelheim, Germany) for fluorescent images. Images were adjusted for contrast in AxioVision LE Rel. 4.3 (Carl Zeiss MicroImaging, Jena, Germany) and arranged in PowerPoint (Microsoft).
Cell Quantification
Cell nuclei were counted manually on consecutive horizontal sections from antral glandular regions of each species that were stained with DAPI to visualize cell nuclei. For quantification the total numbers of cell nuclei on three 4 μm horizontal sections per species were counted on an area of 96 mm2 and the average cell count of DAPI-positive cell nuclei was determined.
For the evaluation of the relative distribution of G-cells in antral glands gastrin-positive cells were counted manually on longitudinal sections through the antral mucosa of each species that were stained with the anti-gastrin antibody and DAPI to visualize cell nuclei. Antral invaginations were divided into three equal areas: lower third (basal), middle third, and upper third (apical). G-cells were counted manually per antral gland and area on seven to eight invaginations per species. The average cell count of immunopositive cells per invagination was determined.
Statistical Analysis
For cell quantification, values are given as mean ± SEM for the quantification of three consecutive sections per species. Significant differences between the groups were analyzed by the unpaired t-test with GraphPad Prism (Graphpad Software, www. graphpad.com). Statistical significance was set at P < 0.05.
Results
In order to establish a solid basis for comparing number and distribution of distinct gastric cell types in the stomach of mouse, swine, and human we initially set out to investigate some structural features of the antral mucosa. Experiments using DAPI to visualize cell nuclei were performed to determine the structural set-up of the antral mucosa of human, swine, and mouse. Tissue sections from the pyloric antral region of each species are depicted in Figures 1A–C indicating that the antral mucosa from mouse consists of very densely arranged annuli (Figure 1A; annulus diameter: 23 ± 3 μm), whereas in swine (Figure 1B) and human (Figure 1C) the antral annuli were arranged more loosely and are much larger in size (annulus diameter pig: 34 ± 4 μm; human: 41 ± 3 μm). To roughly quantify the visible differences we have counted the number of cell nuclei per field (96 mm2) on consecutive sections through the antral mucosa of each species. The results are summarized in Figure 1D. In the murine antrum the average number of cell nuclei per field was determined as 933.34 ± 26.03, whereas in the porcine antrum the number of cell nuclei was significantly lower (694 ± 8.61 per field; p < 0.001), and even lower in the human antrum (538.34 ± 38.36) compared to mice (p < 0.001). To explore the localization and distribution of G-cells within the antral mucosa we performed immunohistochemical experiments with longitudinal sections through the antrum mucosa. It turned out that in the murine antral mucosa the G-cells were almost exclusively located at the base of antral invaginations (Figure 2A), whereas in swine and human gastrin-positive cells were distributed over the lower and middle third of antral glands (Figures 2B,C). To evaluate these findings and further specify the relative distribution of G-cells within antral glands of each species we have counted gastrin-positive cells. For that purpose the antral invagination was divided into three equal areas: lower third (basal), middle third, and upper third (apical). G-cells were counted per antral gland and area on seven to eight invaginations. The results revealed two obvious differences between the three species; firstly, the number of G-cells per antral invagination was significantly higher in swine and human compared to mouse; secondly, the distribution pattern of the cells was different. In mice, the G-cells were indeed located only in the lower third of the antral glands; the number of gastrin-positive cells was determined as 2.5 ± 0.87 (Figure 2D). In pig and human the gastrin-positive cells mainly reside in the lower and middle part of the antral invaginations (swine: lower part: 2.0 ± 1.7; middle part: 5.27 ± 1.28; human: lower part: 6.86 ± 2.36; middle part: 2.43 ± 1.5 G-cells; Figure 2D). These findings indicate some clear differences regarding the structural set-up of the antrum mucosa and the distribution of G-cells. Moreover, it turned out that the structural features are more similar in human and swine than in human and mouse. In a next step attempts were made to identify candidate receptors for nutrients, especially protein breakdown products in human and porcine G- and D-cells. In a previous study we have shown that in mice the receptors GPRC6A and CaSR are expressed in G-cells and in a subpopulation of D-cells (Haid et al., 2011). In order to assess if these candidate receptors are also expressed in the antral mucosa of human and swine RT-PCR experiments were performed using species specific primers. The results are depicted for human cDNA in Figure 3A and for porcine cDNA in Figure 3B. Amplicons of the expected molecular size were obtained for all primer pairs. Subsequent cloning and sequencing of the amplicons revealed that they indeed encoded hGPRC6A, hCaSR, sGPRC6A, and sCaSR, respectively. To compare if these receptors are expressed in the endocrine cells double-immunohistochemical analyses were conducted on horizontal sections of the murine, porcine, and human antrum. As depicted in Figure 4, in tissue sections from all three species the vast majority of GPRC6A-positive cells also displayed strong gastrin immunoreactivity; the results for murine samples are shown in Figures 4A–C, for swine in Figures 4D–F, and for men in Figures 4G–I. Interestingly, in human specimen the GPRC6A immunoreactivity was most intense at the apical part of cells contacting the central lumen, whereas gastrin immunoreactivity was predominantly found at the base of cells. Comparative immunohistochemical analyses of the murine, porcine, and human gastric antrum using antibodies for CaSR and gastrin revealed that in all three species also the CaSR-positive cells displayed strong immunoreactivity for gastrin (Figure 5). Yet, a small number of GPRC6A- and CaSR-immunoreactive cells showed no labeling with the gastrin antibody in all investigated species. This observation suggested that they may represent somatostatin producing D-cells as previously shown for mice (Haid et al., 2011). To compare whether in all three species D-cells express receptors responsive to protein breakdown products, tissue sections were immunostained with specific antibodies for somatostatin and GPRC6A or CaSR, respectively. The results demonstrated that individual somatostatin-positive cells express GPRC6A in mice, pig, and also in men; the results for murine samples are shown in Figures 6A–C, for swine in Figures 6D–F and for men in Figures 6G–I. Additionally, a small number of D-cells in the three species were found to be also positive for CaSR (Figure 7). Although amino acids might contribute to the activation of gastric endocrine cells in the antrum, generally breakdown products of protein digestion are considered as major stimuli for G-cells to release gastrin. Peptone, a mixture of enzymatically derived peptide fragments, appears to mimic dietary proteins digest in the luminal chyme (Cuber et al., 1990; Choi et al., 2007a), and has been shown to stimulate gastrin secretion (Walsh, 1988; Schubert et al., 1992; Varga et al., 1993). In search for a receptor type that could render the responsiveness of G-cells to protein digests, the recently described family A receptor GPR92 (also named GPR93; LPAR5) which is activated by protein-hydrolysates (Choi et al., 2007a,b) was considered as a putative candidate. RT-PCR analyses using specific primers for mGPR92 and hGPR92, respectively, resulted in amplification products of the expected size (Figure 8). The identity of the encoded mGPR92 and hGPR92 was confirmed by sequencing the amplicons. Since the sequence for the pig GPR92 is unknown, degenerate oligonucleotides had to be used. The primer combination resulted in an amplification product of the expected size for GPR92 (Figure 8). Sequence analysis revealed that the partial swine GPR92 sequence shared an 84% identity with the human GPR92 nucleotide sequence (NM_001142961.1). The partial nucleotide sequence of GPR92 from pig is deposited in the EMBL Data Bank. To visualize and identify the cells which express GPR92 double-immunohistochemical analyses were conducted using antibodies for GPR92 and gastrin. A result of this approach is exemplarily shown in Figure 9 for mouse and pig. A large population of GPR92-positive cells was visible in the antrum mucosa (Figures 9A,D). Furthermore, double-labeling with gastrin antibodies revealed, that the vast majority of GPR92-positive cells in mouse and pig were also immunoreactive for gastrin (Figures 9C,F). In addition, it was found that also D-cells express the peptone-receptor GPR92, which is exemplarily shown for swine in Figures 9G–I. The finding that in addition to CaSR and GPRC6A also GPR92 is expressed in gastrin-cells and somatostatin-cells indicates that apparently these endocrine cells have an enormous capability to sense luminal protein breakdown products. The identification of several amino acid-/peptone-responsive receptors in G-cells and in subpopulations of D-cells of all three species suggests that an ensemble of different receptor types may represent the molecular basis underlying the responsiveness of gastrin-cells and somatostatin-cells to luminal constituents.
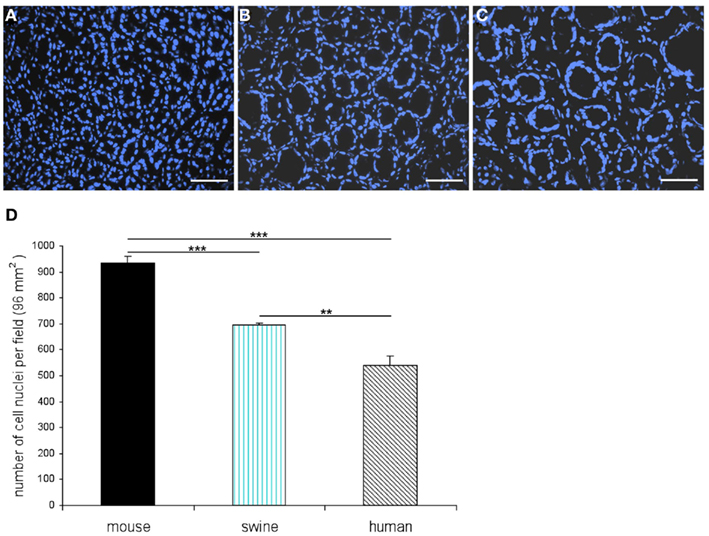
Figure 1. Different structures of the antral mucosa from mouse, swine, and men. Quantitative evaluation of cell nuclei per field (96 mm2). Cell nuclei were visualized with a DAPI-staining (blue). (A) Exemplary view onto a horizontal section through the antral mucosa of mouse reveals the characteristic, densely arranged annuli. (B) Horizontal tissue section through the porcine antral mucosa clearly indicates that the annuli in the antral mucosa of swine are bigger in size and are arranged in a lower density when compared with the murine antrum (B). (C) The antral mucosa of men comprises loosely arranged annuli which are comparatively large in diameter compared to murine and porcine antral mucosa. (D) DAPI-stained cell nuclei were counted in a field of 96 mm2 on three consecutive horizontal sections through the gastric antral mucosa of each species. Whereas the average number of cell nuclei per field in the antrum of mouse is determined as 933.34 ± 26.03 the average numbers for swine (694 ± 8.61) and human (538.34 ± 38.36) are significantly lower. Data are expressed as mean numbers ± SEM. Statistically significant results determined by the unpaired t-test are indicated by **P < 0.001 to 0.01; ***P < 0.001. Scale bars: (A–C) = 50 μm.
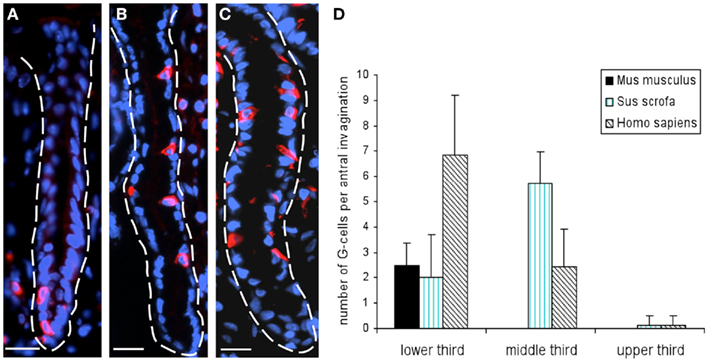
Figure 2. Localization of G-cells in the antral mucosa of mouse, swine, and human. Distribution pattern of G-cells was assessed on longitudinal tissue sections immunostained for gastrin (red). (A) Longitudinally truncated mucosal invaginations of the murine antrum. Gastrin-positive cells are mainly located at the base of antral glands. (B) Exemplary view onto a longitudinal section through the porcine antral mucosa demonstrates that G-cells are primarily located in the middle third of the gland. (C) In the human antrum mucosa gastrin-positive cells are distributed over the lower – and middle third of antral glands. (D) Evaluation of the distribution of gastrin-positive cells on longitudinal sections through the antral mucosa of mouse, swine, and men. For cell counting antral glands were divided into three equal areas: lower third, middle third, and upper third. Gastrin-positive cells were counted per invagination and area on seven to eight antral invaginations per species. Analyses revealed the same scenario as depicted in (A–C); in the mouse G-cells are mainly located in the lower third of antral glands (lower third: 2.5 ± 0.87 G-cells; middle and upper third: 0 gastrin-positive cells), whereas in the porcine and human antrum, G-cells are primarily located in the lower – and middle third of antral glands (swine: lower third: 2 ± 1.7; middle third: 5.27 ± 1.28; human: lower third: 6.86 ± 2.36; middle third: 2.43 ± 1.5 G-cells). Data are expressed as mean numbers ± SEM. Sections are counterstained with DAPI (blue). Scale bars: (A–C) = 20 μm.
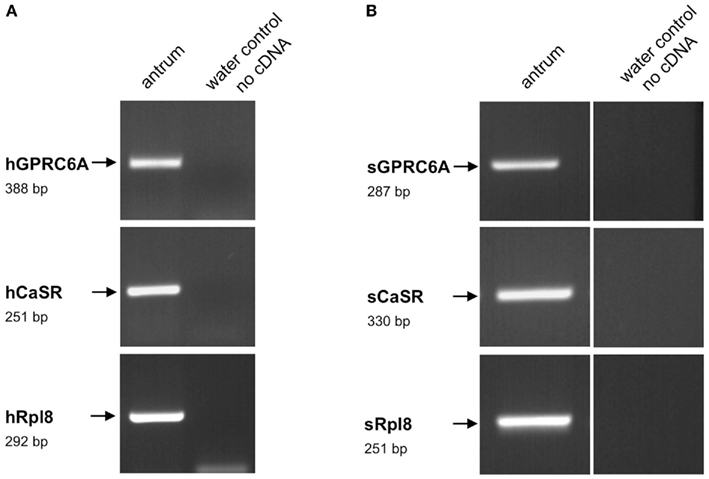
Figure 3. Reverse transcriptase polymerase chain reaction analysis for GPRC6A, CaSR, and ribosomal protein l8 (Rpl8) mRNA from human (A) and porcine (B) antrum, respectively. Reverse transcription polymerase chain reaction (RT-PCR) experiments were performed with primer pairs specific for hGPRC6A (388 bp), hCaSR (251 bp), and hRpl8 (292 bp), as well as for sGPRC6A (287 bp), sCaSR (330 bp), and sRpl8, respectively. With cDNA from human or porcine antrum tissue distinct bands of the expected molecular size could be amplified. No bands were observed in water controls lacking template.
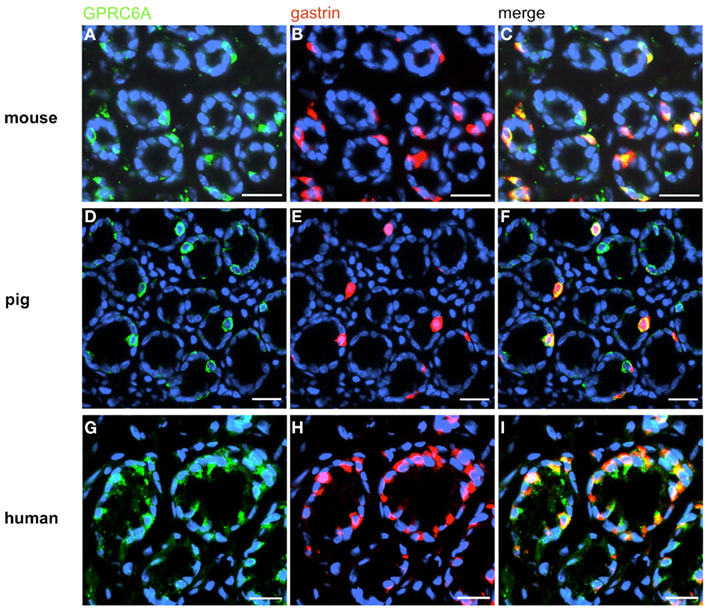
Figure 4. Visualization of GPRC6A in G-cells of mouse, swine, and human. Double-immunolabeling of horizontal tissue sections through the antral mucosa of mouse, swine, and human for GPRC6A (green) and gastrin (red). (A,D,G) GPRC6A-positive cells in antral annuli of mouse (A), swine (D), and men (G). (B,E,H) In the same annuli numerous gastrin-positive cells can be visualized. (C,F,I) The overlay of accordant images clearly reveals that the vast majority of G-cells is immunoreactive for GPRC6A in the three species. Sections are counterstained with DAPI (blue). Scale bars: (A–I) = 20 μm.
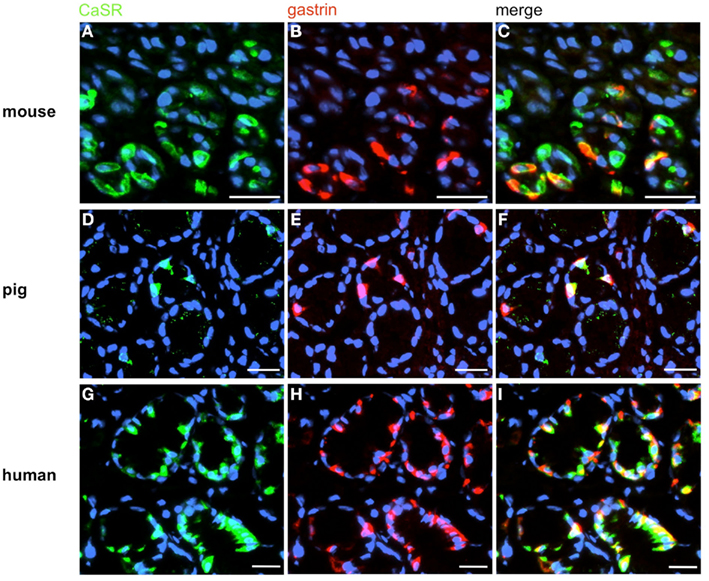
Figure 5. Visualization of CaSR in murine, porcine, and human G-cells. Double-immunolabeling of horizontal tissue sections through the antral mucosa of mouse, swine and men for CaSR (green), and gastrin (red). (A,D,G) The CaSR antibody labels numerous cells in the antrum mucosa of mouse (A), pig (D), and men (G). (B,E,H) Gastrin-positive cells are located in the same antral regions. (C,F,I) Overlay of accordant images; murine (C), porcine (F), and human (I) CaSR-positive cells are also immunoreactive for gastrin. Sections are counterstained with DAPI (blue). Scale bars: (A–I) = 20 μm.
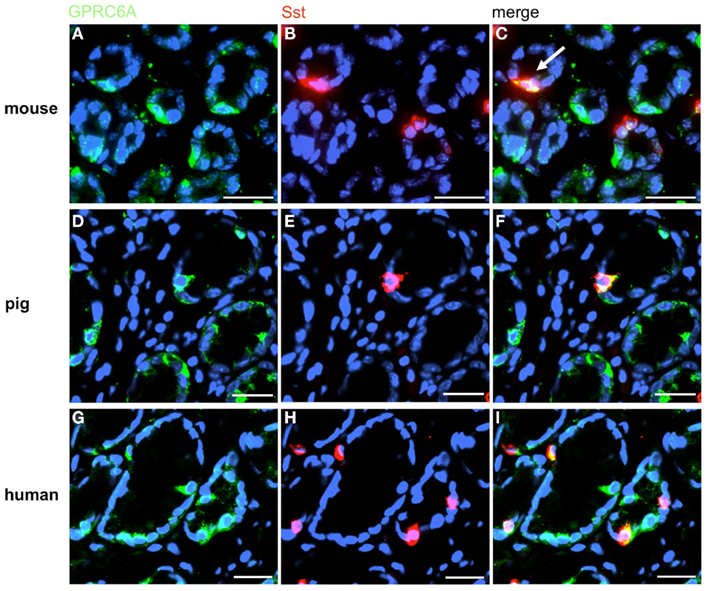
Figure 6. A small subpopulation of GPRC6A-positive cells contains somatostatin (Sst). Double-label immunohistochemistry employing antibodies for GPRC6A (green) and Sst (red) on horizontal tissue sections through the murine, porcine, and human antrum, respectively. (A,D,G) GPRC6A-positive cells in the antrum mucosa of mouse (A), pig (D), and men (G). (B,E,H) Sst-immunoreactive cells in the same antral regions. (C,F,I) The overlay of accordant images reveals the coexpression of Sst in a small subset of GPRC6A-positive cells in the three species. Sections are counterstained with DAPI (blue). Scale bars: (A–I) = 20 μm.
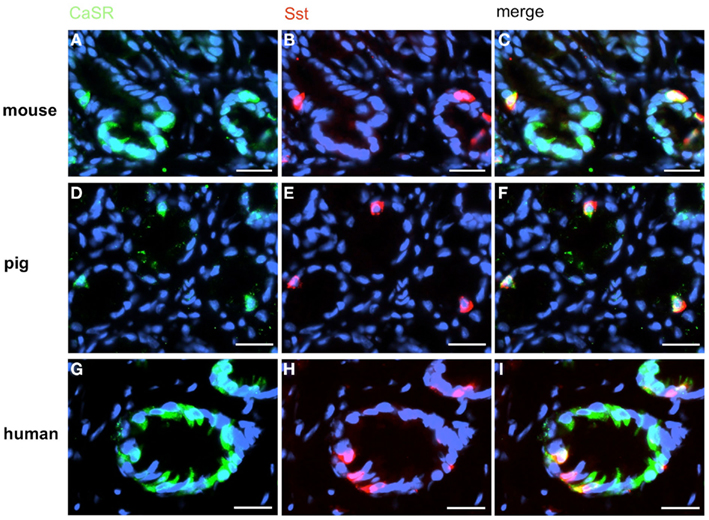
Figure 7. A small subpopulation of CaSR-positive cells contains somatostatin (Sst). Double-label immunohistochemistry employing antibodies for CaSR (green) and Sst (red) on horizontal tissue sections through the antrum of mouse, pig, and men. (A,D,G) The CaSR antibody labels numerous cells in the antrum mucosa of mouse (A), pig (D), and men (G). (B,E,H) In the same annuli numerous Sst-positive cells can be visualized. (C,F,I) Overlay of accordant images; subpopulations of murine (C), porcine (F), and human (I) CaSR-positive cells show immunoreactivity for somatostatin. Sections are counterstained with DAPI (blue). Scale bars: (A–I) = 20 μm.
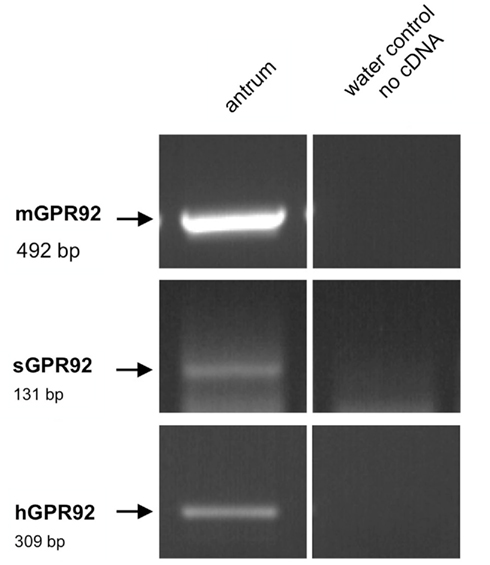
Figure 8. Reverse transcriptase polymerase chain reaction analysis for the peptone-receptor GPR92 in the antrum of mouse, swine, and men. RT-PCR experiments performed with primer pairs specific for mGPR92 (492 bp) and hGPR92 (309 bp). Since the sequence for the porcine GPR92 is unknown we used degenerate oligonucleotides for the amplification of sGPR92 (131 bp). PCR products of the expected sizes were amplified from murine, porcine, and human antrum tissue, respectively. No bands were observed in water controls lacking template.
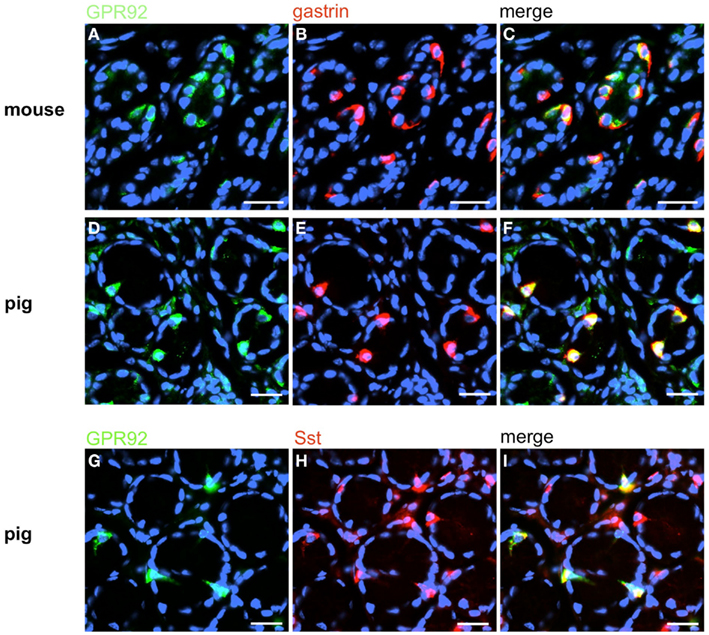
Figure 9. GPR92 is expressed in G-cells and D-cells of mouse and pig. Double-label immunostaining with antibodies for GPR92 and gastrin on horizontal tissue sections through the antrum of mouse (A–C) and swine (D–I), respectively. (A) The GPR92 antibody labels numerous cells in the murine antrum mucosa. (B) Murine G-cells are located in the same antrum area. (C) The overlay of (A,B) clearly shows the coexpression of GPR92 and gastrin in the antrum of mouse. (D) GPR92-positive cells in the antrum of swine. (E) The gastrin antibody immunostained numerous cells in this porcine antrum region. (F) The overlay of (D,E) reveals that the majority of porcine GPR92-positive cells is also gastrin-positive. (G) GPR92-immunoreactive cells in the porcine antrum mucosa. (H) Sst-positive cells are located in the same antral annuli. (I) Overlay of (G,H); a subpopulation of Sst-positive cells is immunoreactive for the peptone-receptor GPR92. Sections are counterstained with DAPI (blue). Scale bars: (A–I) = 20 μm.
To address the question how the activation of the GPCRs is linked to an intracellular signaling cascade leading to a release of gastrin, we set out to identify putative downstream signaling elements. Heterologous expression studies have proposed that GPRC6A, as well as CaSR and GPR92 may couple to a Gαq-mediated pathway involving the effector enzyme phospholipase Cβ (PLCβ; Buchan et al., 2001; Hofer and Brown, 2003; Kuang et al., 2005; Pi et al., 2005; Choi et al., 2007a; Christiansen et al., 2007; Wellendorph et al., 2007). However, some studies suggested that GPRC6A and CaSR may also couple to Gαi (Brown and MacLeod, 2001; Ward, 2004; Pi et al., 2005). To explore whether members of the Gαq family and Gαi are expressed in the gastric antrum of mouse RT-PCR experiments were performed. Using degenerate oligonucleotides based on conserved sequence motifs of the Gαq family members Gαq, Gα11, and Gα14 resulted in an amplification product which displayed the expected size of 293 bp (Figure 10). Sequence analysis revealed that the partial sequence displayed a 100% identity to the murine nucleotide sequence for Gαq11 (NM_010301.3). RT-PCR experiments with primer pairs specific for Gαi2 yielded an amplification product of the expected molecular size (Figure 10) and the identity of the encoded mGαi2 was confirmed by sequencing of the amplicon. Subsequently we tried to visualize and identify Gαq-positive and Gαi2-positive cells in the antrum mucosa. Immunohistochemical experiments with antibodies for Gαqq/11/14 and gastrin revealed that the vast majority of murine and human G-cells indeed express the G protein subunit Gαq (Figures 11A–C and G–I). Moreover, double-labeling experiments employing antibodies for Gαi2 and gastrin demonstrate that murine G-cells also coexpress the G-protein subunit Gαi2 (Figures 11D–F). However, neither Gαq nor Gαi2 immunoreactivity was visible in D-cells (data not shown). In addition, no evidence was found that D-cells might express the G-protein subunits gustducin or Gαs (data not shown); so the G-protein subtypes in D-cells remain elusive.
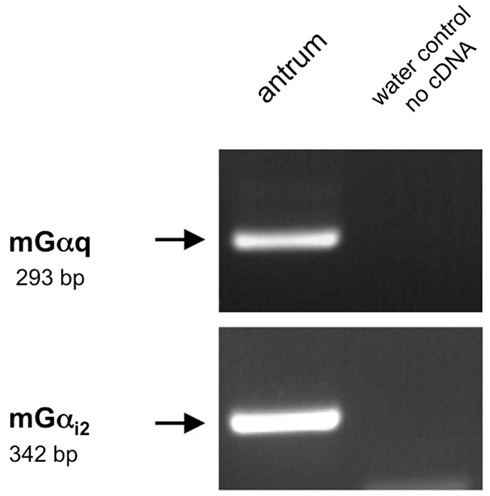
Figure 10. Reverse transcriptase polymerase chain reaction analysis for Gαq family members and Gαi2 in the murine antrum. RT-PCR experiments were conducted with primer pairs specific for Gαi2 (342 bp). On using cDNA from murine antrum tissue an amplicon of the expected size was obtained. For the amplification of Gαq family members (293 bp) we employed a degenerate primer pair based on sequence motifs of the corresponding Gαq family members (Gα11, Gα14, Gαq). Sequence analysis revealed that the partial sequence displayed a 100% identity to the murine nucleotide sequence for Gα11 (NM_010301.3). No bands were observed in water controls lacking template.
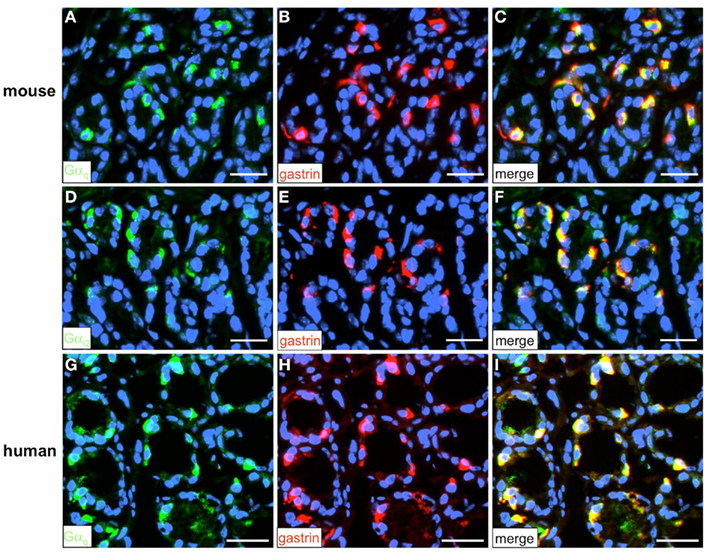
Figure 11. Visualization of the G-protein subunit Gαq and Gαi2 in G-cells. Double-labeling experiments employing antibodies for either Gαq (green) and gastrin [red (A–C) and (G–I)] or Gαi2 (green) and gastrin [red (D–F)] on horizontal tissue sections through the antrum of mouse or the human antrum. (A,G) Gαq-positive cells in the gastric antrum of mouse and men. (B,H) In the same area numerous G-cells can be visualized with the gastrin antibody. (C,I) The overlay of accordant images reveals the coexpression of the G-protein subunit Gαq and gastrin in murine (C) and human G-cells (I). (D) Numerous Gαi2-positive cells in the murine antrum mucosa. (E) Gastrin-positive cells are located in the same antral region. (F) Overlay of (D,E); murine G-cells coexpress the G-protein subunit Gαi2. Sections are counterstained with DAPI (blue). Scale bars: (A–I) = 20 μm.
Four PLCβ isoforms are known (β1–β4), which are activated by interaction with the α-subunit of a heterotrimeric G-protein of the Gαq family which include Gαq, Gα11, Gα14, and Gα15/16 (Exton, 1996; Rebecchi and Pentyala, 2000; Rhee, 2001). In order to investigate whether any of these PLCβ isoforms might be expressed in G-cells and D-cells we performed RT-PCR studies using primers for PLCβ1, PLCβ2, PLCβ3, and PLCβ4, and normalized cDNA from the murine antrum. Amplification products of the expected size were obtained for PLCβ2, PLCβ3, and PLCβ4 (Figure 12). For PLCβ1 a negligible weak band was obtained with cDNA from the antrum, whereas cDNA from brain yielded an adequate amplification product (data not shown). The identity of PLCβ2, PLCβ3, and PLCβ4 was confirmed by sequencing of the amplicons.
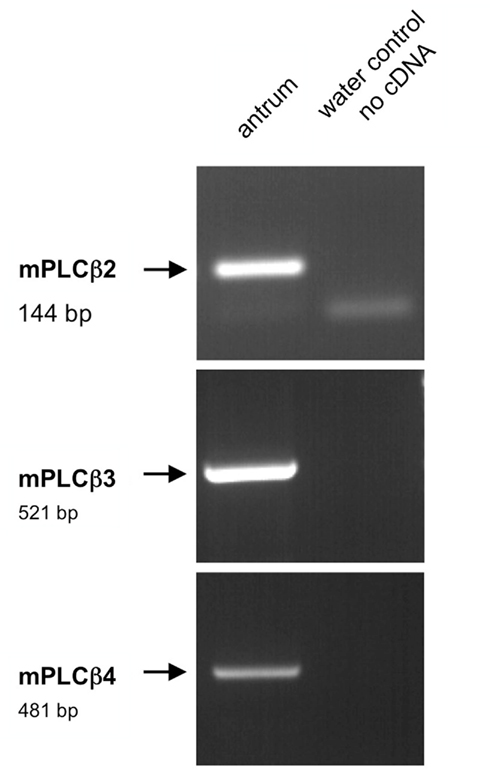
Figure 12. Reverse transcriptase polymerase chain reaction analysis for the effector enzymes PLCβ2, PLCβ3, PLCβ4 in the murine antrum. RT-PCR experiments were conducted with primer pairs specific for PLCβ2 (144 bp), PLCβ3 (521bp), and PLCβ4 (431 bp). On using cDNA from murine antrum tissue amplicons of the expected size were obtained for all primer combinations. No bands were observed in water controls lacking template.
Based on the crucial role of PLCβ2 for taste transduction (Rössler et al., 1998; Zhang et al., 2003) and the observation, that PLCβ2 is expressed in ghrelin cells of the murine stomach (Hass et al., 2007) double-labeling experiments for PLCβ2 and gastrin were performed. Numerous PLCβ2-positive cells were visualized in the antrum mucosa of mouse and men (Figures 13A,D). Although many gastrin-positive cells were present (Figures 13B,E), no co-labeling was visible (Figures 13C,F). Similarly double-labeling experiments were conducted with specific antibodies for PLCβ3 and gastrin on horizontal antrum sections of mouse and men. A typical result is shown in Figure 14. Numerous PLCβ3-positive cells are visible (Figures 14A,D) and almost all of them were also immunoreactive for gastrin (Figures 14C,F). In contrast, double staining with specific antibodies for PLCβ2 and somatostatin resulted in an overlap of staining which indicates an expression of PLCβ2 in D-cells (Figure 15); in the investigated species nearly all somatostatin-positive cells express the effector enzyme PLCβ2 (Figures 15C,F). These results indicated that D- and G-cells express different elements for a downstream signaling cascade and these differences seem to exist in all three species, suggesting some relevant physiological implications.
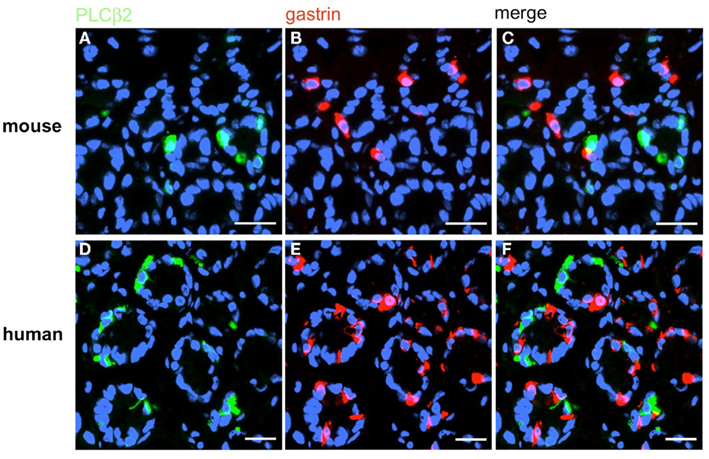
Figure 13. G-cells do not express the effector enzyme PLCβ2. Double-label immunohistochemistry combining antibodies for PLCβ2 (green) and gastrin (red) on horizontal tissue sections through the antrum of mouse (A–C) or the human antrum (D–F). (A,D) PLCβ2-positive cells in the antrum of mouse (A) and men (D). (B,E) G-cells are located in the same antral regions. (C,F) The overlay of accordant images clearly demonstrates that neither murine (C) nor human (F) G-cells coexpress PLCβ2. Sections are counterstained with DAPI (blue). Scale bars: (A–F) = 20 μm.
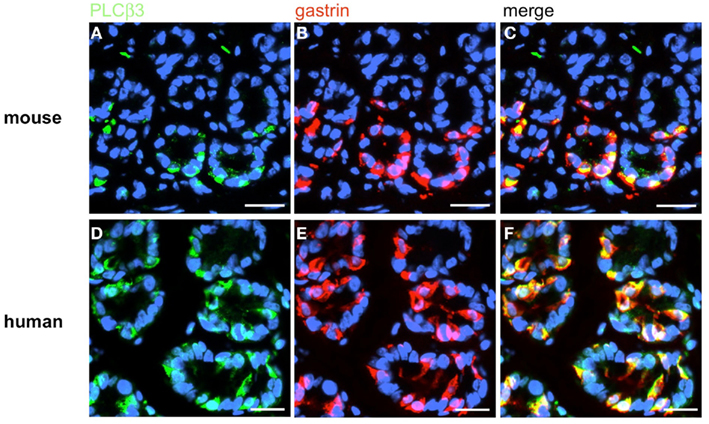
Figure 14. Immunohistochemical analyses of G-cells for the coexpression of the taste effector enzyme PLCß3. Double-label immunohistochemistry combining antibodies for PLCβ3 (green) and gastrin (red) on horizontal tissue sections through the antrum of mouse and the human antrum, respectively. (A,D) The PLCβ3 antibody labels numerous cells in the antral annuli of mouse (A) and men (D). (B,E) In the same annuli numerous G-cells can be visualized with the gastrin antibody. (C,F) The overlay of accordant images clearly demonstrates the coexpression of the taste effector enzyme PLCβ3 in murine G-cells as well as in human G-cells. Sections are counterstained with DAPI (blue). Scale bars: (A–F) = 20 μm.
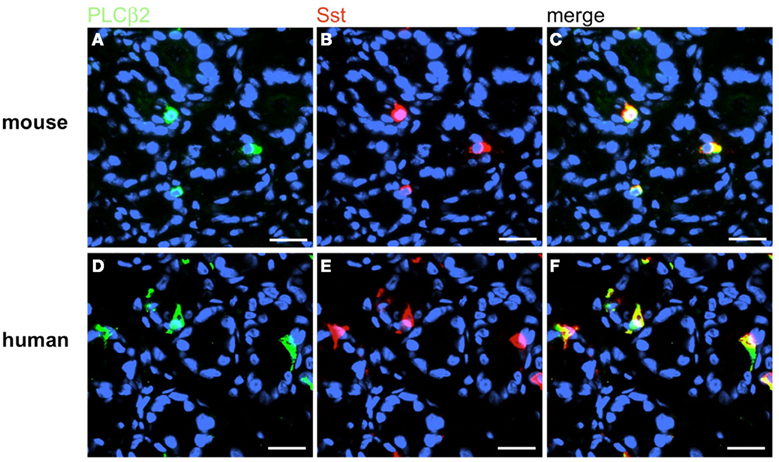
Figure 15. Sst-positive D-cells express the effector enzyme PLCβ2. Double-label immunohistochemistry combining antibodies for PLCβ2 (green) and Sst (red) on horizontal tissue sections through the antrum of mouse and men, respectively. (A,D) The PLCβ2 antibody labels numerous cells in the antrum mucosa of mouse (A) and men (D). (B,E) Sst-positive cells in the corresponding antrum regions. (C,F) The overlay of accordant images clearly reveals that murine (C) as well as human (F) D-cells are also positive for PLCβ2. Sections are counterstained with DAPI (blue). Scale bars: (A–F) = 20 μm.
The main findings of this study are summarized in Table 1. The structural features of the antrum mucosa from mouse, swine, and human differ significantly concerning annulus diameter and cell density as well as the number and distribution of G-cells. The results indicate a closer similarity between pig and human than between mouse and human. The enteroendocrine G-cells and D-cells of all species comprise a similar repertoire of receptors and signaling elements. However, the two cell types differ significantly from each other concerning the expression of Gα proteins and PLCβ subtypes. Moreover, the receptors GPRC6A, CaSR, and GPR92 appear to be expressed in all G-cells, but they were only found in a subpopulation of D-cells.
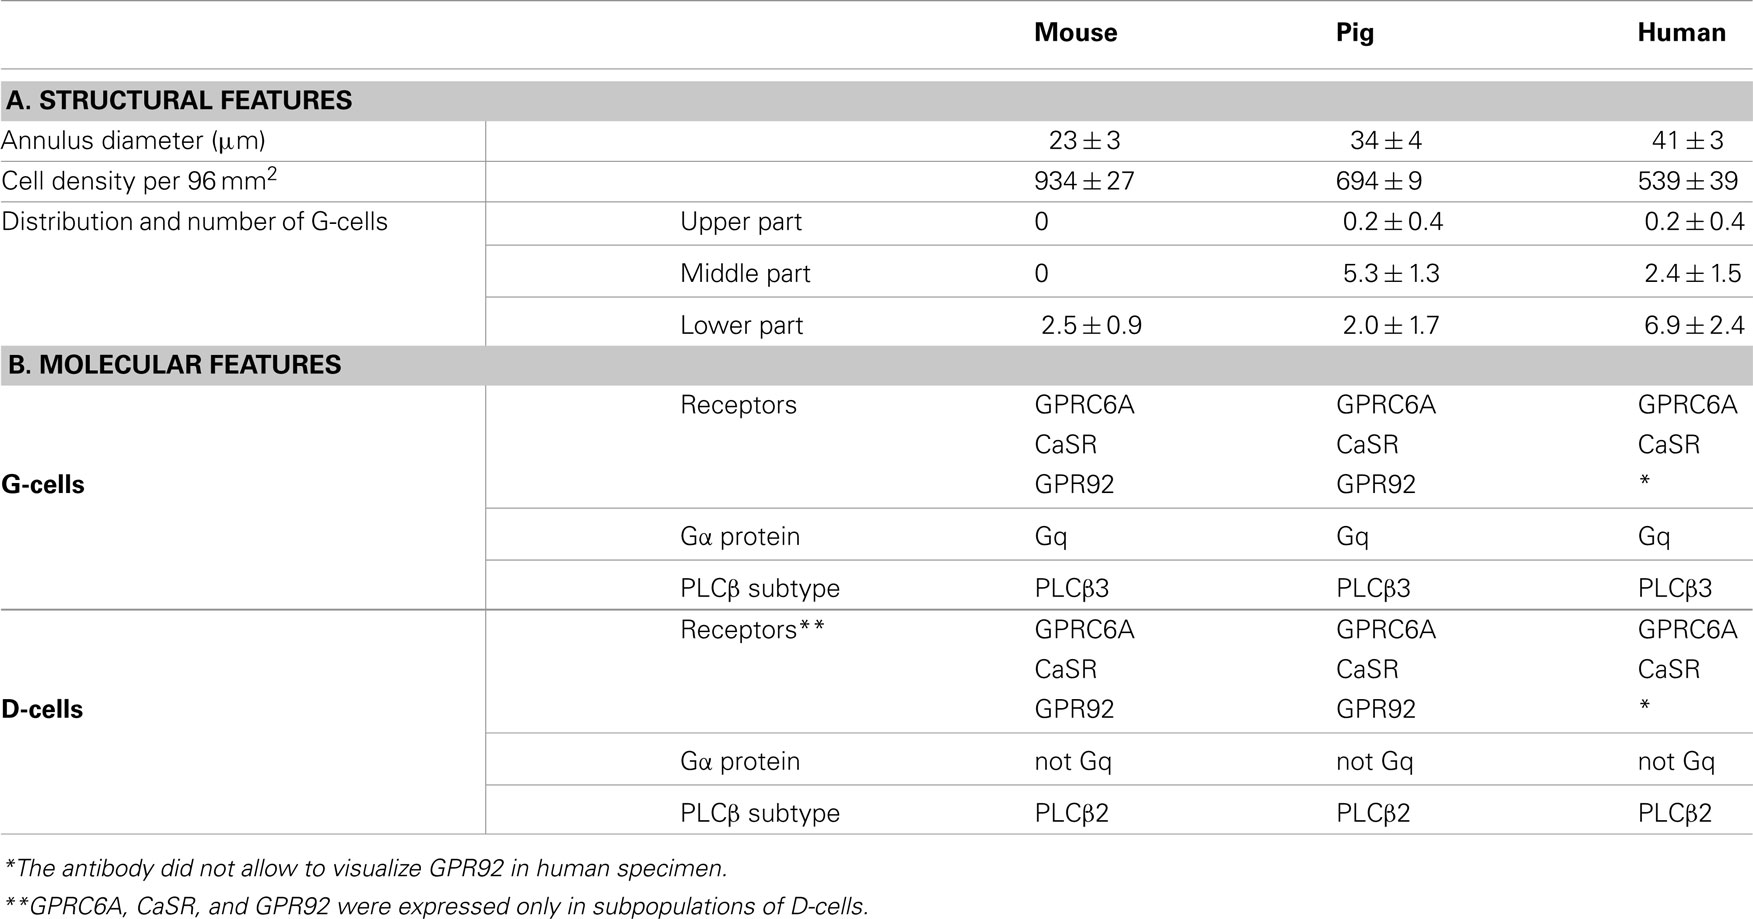
Table 1. Features of the antral mucosa: comparison of mouse, pig, and human.
Discussion
The gastric antrum represents a stomach compartment of paramount importance as it initiates and regulates fundamental gastric activities including the release of gastrin and somatostatin, which subsequently regulate the secretion of pepsinogen and hydrochloric acid; key steps for digestive processes in the stomach. Given that rodents are not the most appropriate model organism for studying gastro-physiological processes relevant for men (Houpt et al., 1979; Rowan et al., 1994; Kararli, 1995) it is indispensable to unravel the differences between species regarding the morphology and physiology of the antrum mucosa. The notion that the gastrointestinal system of swine may be more related to human (Pond and Houpt, 1978; Tumbleson and Schook, 1996; Kuzmuk and Schook, 2011) was supported by comparing some structural features of the antrum mucosa from human, swine, and mouse, indicating significant differences concerning the structural set-up of the antral mucosa (Figure 1; Table 1A) and the distribution of G-cells within antral glands (Figure 2; Table 1A), and can be added to the list of differences between gastrointestinal systems of rodents and men (Kararli, 1995; DeSesso and Jacobson, 2001). The finding that the number of G-cells per antral invagination in swine and men is significantly higher compared to mouse (Figure 2; Table 1A) is in line with the observation that the acidification of the luminal content is much stronger in swine and human (pH 1.6–1.8) when compared to mouse (pH 3.1; Kararli, 1995). Despite of the structural differences, no immediate differences between the species were observed concerning the molecular set-up of G-cells, such as the expression of receptor types and transduction elements (Table 1B). The similarities across species may reflect a particular relevance of the molecular elements for the function of the specialized endocrine cells. Based on the limitation of the experimental approaches it can not be excluded that the number of receptors per cell and thereby the chemosensory sensitivity of the cells may vary considerably. Functional analyses of single cells combined with quantitative real-time PCR experiments may provide some insight concerning the expression level of the different receptor types.
A major finding of this study is the expression of the recently discovered family A receptor GPR92 (also named GPR93; LPAR5) in G-cells. In heterologous expression studies it has been demonstrated that GPR92 is activated by dietary protein hydrolysate and appears to be coupled to Gαq and to a pertussis-toxin sensitive G-protein (Choi et al., 2007a). Moreover, indirect evidence was provided that this receptor may contribute to the secretion of CCK from intestinal cells after application of protein hydrolysate (Choi et al., 2007b). However, for the first time, we were able to visualize cells in the gastrointestinal tract, which express the peptone responsive receptor GPR92. In view of these results, the presence of GPR92 in G-cells may be particular relevant for the responsiveness of these cells since an activation of G-cells elicits a cascade of reactions which unleashes the protein digestion machinery of the stomach. Thus, one would expect protein fragments rather than free amino acids as more relevant activators for G-cells. In this context, it is conceivable that the receptor GPR92 may play a central role in triggering gastrin secretion from G-cells in response to protein digest in the chyme, whereas free amino acids may have a more weak effect, or even an inhibitory effect on gastrin secretion. The observation by DelValle and Yamada (1990), that amino acids can elicit a release of gastrin, could be due to rather high amino acid concentrations.
The unexpected finding that G-cells and the antagonistic acting D-cells have the same receptor repertoire is plausible as the primary function of both cell types is based on the amount of protein breakdown products and the progress of digestive processes in the luminal content of the stomach. However, the activation of the same receptor repertoire by protein breakdown products has to elicit different effects in these endocrine cell populations. Under conditions when G-cells secrete gastrin, which in turn activates chief cells to release pepsinogen and parietal cells to secrete hydrochloric acid, one would expect that D-cells prevent the release of somatostatin. In fact, previous studies have shown that peptone, a mixture of enzymatically derived protein fragments, increased the secretion of gastrin and inhibited the release of somatostatin (Saffouri et al., 1984). Consequently, it seems conceivable that the receptor types elicit different responses in each cell type. One could hypothesize, that large protein fragments activate G-cells and inhibit D-cells via receptors such as GPR92, thus accelerating the digestion of proteins in the stomach. In view of this concept it is possible that proceeding proteolysis yields breakdown products, which activate amino acid responsive receptors such as GPRC6A and CaSR leading to an attenuation of G-cells and stimulation of D-cells. This hypothesis would imply that in each cell type the receptor couples to different downstream signaling pathways. In fact, the presence of the same GPCRs and Gα protein subtypes in functional quite different cell types does not imply that the cellular responses upon receptor activation are identical; firstly, receptor types can promiscuously couple to different G-protein subtypes and secondly, the transduction cascades can be modulated, e.g., by “regulators of G-protein signaling” (RGS) proteins which negatively affect G-protein mediated signaling processes (Bansal et al., 2007). The findings of this study that G- and D-cells express different G-protein subunits and effector enzymes (Table 1B) is in line with this view. While G-cells express the G-protein subunits Gαq and Gαi2 together with the PLCβ subtype PLCβ3, D-cells express PLCβ2, and neither Gαq nor Gαi2. It is interesting to note that Gαq and Gα11 are good activators of PLCβ3, whereas PLCβ2 is poorly activated by both (Singer et al., 1997; Rhee, 2001). Several studies revealed that PLCβ3 can be activated by Gq via its Gαq subunit and also by Gi acting via its Gβγ subunit (Park et al., 1993; Rebecchi and Pentyala, 2000; Philip et al., 2010). The coexistence of both Gαq and Gαi2 in G-cells offers the possibility for a synergistic activation of PLCβ3 as observed, e.g., in macrophages (Roach et al., 2008). In contrast, the Gαi subunit may exert inhibitory effects on gastrin secretion by attenuating the production of cAMP as it is proposed for the inhibition of parietal cells by somatostatin (Park et al., 1987). Exploring the transduction machinery downstream of the receptors for protein breakdown products in the two cell types will elucidate mechanisms underlying the opposing responsiveness of G-cells and D-cells to stimuli from the gastric lumen.
Conflict of Interest Statement
The authors declare that the research was conducted in the absence of any commercial or financial relationships that could be construed as a potential conflict of interest.
Acknowledgments
The authors would like to thank Kerstin Bach for excellent technical assistance. This work was supported by the Deutsche Forschungsgemeinschaft, BR 712/25-1.
References
Bansal, G., Druey, K. M., and Xie, Z. (2007). R4 RGS proteins: regulation of G-protein signaling and beyond. Pharmacol. Ther. 116, 473–495.
Brown, E. M., and MacLeod, R. J. (2001). Extracellular calcium sensing and extracellular calcium signaling. Physiol. Rev. 81, 239–297.
Buchan, A. M., Squires, P. E., Ring, M., and Meloche, R. M. (2001). Mechanism of action of the calcium-sensing receptor in human antral gastrin cells. Gastroenterology 120, 1128–1139.
Choi, S., Lee, M., Shiu, A. L., Yo, S. J., and Aponte, G. W. (2007a). Identification of a protein hydrolysate responsive G protein-coupled receptor in enterocytes. Am. J. Physiol. Gastrointest. Liver Physiol. 292, G98–G112.
Choi, S., Lee, M., Shiu, A. L., Yo, S. J., Halldén, G., and Aponte, G. W. (2007b). GPR93 activation by protein hydrolysate induces CCK transcription and secretion in STC-1 cells. Am. J. Physiol. Gastrointest. Liver Physiol. 292, G1366–G1375.
Christiansen, B., Hansen, K. B., Wellendorph, P., and Bräuner-Osborne, H. (2007). Pharmacological characterization of mouse GPRC6A, an L-alpha-amino-acid receptor modulated by divalent cations. Br. J. Pharmacol. 150, 798–807.
Cuber, J. C., Bernard, G., Fushiki, T., Bernard, C., Yamanishi, R., Sugimoto, E., and Chayvialle, J. A. (1990). Luminal CCK-releasing factors in the isolated vascularly perfused rat duodenojejunum. Am. J. Physiol. 259, G191–G197.
Delle Fave, G., Annibale, B., Puoti, M., Giordano, E., Corleto, V., de Magistris, L., and Torsoli, A. (1990). Medical treatment of antral gastrin cell hyperfunction: role of nonantisecretory therapy. Digestion 46, 65–71.
DelValle, J., and Yamada, T. (1990). Amino acids and amines stimulate gastrin release from canine antral G-cells via different pathways. J. Clin. Invest. 85, 139–143.
DeSesso, J. M., and Jacobson, C. F. (2001). Anatomical and physiological parameters affecting gastrointestinal absorption in humans and rats. Food Chem. Toxicol. 39, 209–228.
Dockray, G., Dimaline, R., and Varro, A. (2005). Gastrin: old hormone, new functions. Pflugers Arch. 449, 344–355.
Dockray, G. J., Varro, A., Dimaline, R., and Wang, T. (2001). The gastrins: their production and biological activities. Annu. Rev. Physiol. 63, 119–139.
Exton, J. H. (1996). Regulation of phosphoinositide phospholipases by hormones, neurotransmitters, and other agonists linked to G proteins. Annu. Rev. Pharmacol. Toxicol. 36, 481–509.
Feng, J., Petersen, C. D., Coy, D. H., Jiang, J. K., Thomas, C. J., Pollak, M. R., and Wank, S. A. (2010). Calcium-sensing receptor is a physiologic multimodal chemosensor regulating gastric G-cell growth and gastrin secretion. Proc. Natl. Acad. Sci. U.S.A. 107, 17791–17796.
Haid, D., Widmayer, P., and Breer, H. (2011). Nutrient sensing receptors in gastric endocrine cells. J. Mol. Histol. 42, 355–364.
Hass, N., Schwarzenbacher, K., and Breer, H. (2007). A cluster of gustducin expressing cells in the mouse stomach associated with two distinct populations of enteroendocrine cells. Histochem. Cell Biol. 128, 457–471.
Hofer, A. M., and Brown, E. M. (2003). Extracellular calcium sensing and signalling. Nat. Rev. Mol. Cell Biol. 4, 530–538.
Houpt, K. A., Houpt, T. R., and Pond, W. G. (1979). The pig as a model for the study of obesity and of control of food intake: a review. Yale J. Biol. Med. 52, 307–329.
Kararli, T. T. (1995). Comparison of the gastrointestinal anatomy, physiology and biochemistry of humans and commonly used laboratory animals. Biopharm. Drug Dispos. 16, 351–380.
Kuang, D., Yao, Y., Lam, J., Tsushima, R. G., and Hampson, D. R. (2005). Cloning and characterization of a family C orphan G-protein coupled receptor. J. Neurochem. 93, 383–391.
Kuzmuk, K. N., and Schook, L. B. (2011). “Pigs as a model for biomedical sciences,” in The Genetics of the Pig, 2nd Edn, eds M. F. Rothschild, and A. Ruvinsky (Wellington: CAB International), 426–444.
Kwan, C. P., and Tytgat, G. N. (1995). Antral G-cell hyperplasia: a vanishing disease? Eur. J. Gastroenterol. Hepatol. 7, 1099–1103.
Park, D., Jhon, D. Y., Lee, C. W., Lee, K. H., and Rhee, S. G. (1993). Activation of phospholipase C isozymes by G protein beta gamma subunits. J. Biol. Chem. 268, 4573–4576.
Park, J., Chiba, T., and Yamada, T. (1987). Mechanisms for direct inhibition of canine gastric parietal cells by somatostatin. J. Biol. Chem. 262, 14190–14196.
Philip, F., Kadamur, G., Silos, R. G., Woodson, J., and Ross, E. M. (2010). Synergistic activation of phospholipase C-beta3 by Galpha(q) and Gbetagamma describes a simple two-state coincidence detector. Curr. Biol. 20, 1327–1335.
Pi, M., Faber, P., Ekema, G., Jackson, P. D., Ting, A., Wang, N., Fontilla-Poole, M., Mays, R. W., Brunden, K. R., Harrington, J. J., and Quarles, L. D. (2005). Identification of a novel extracellular cation-sensing G-protein-coupled receptor. J. Biol. Chem. 280, 40201–40209.
Pond, W. G., and Houpt, K. A. (eds). (1978). The Biology of the Pig. Ithaca: Cornell University Press.
Rebecchi, M. J., and Pentyala, S. N. (2000). Structure, function, and control of phosphoinositide-specific phospholipase C. Physiol. Rev. 80, 1291–1335.
Rhee, S. G. (2001). Regulation of phosphoinositide-specific phospholipase C. Annu. Rev. Biochem. 70, 281–312.
Roach, T. I., Rebres, R. A., Fraser, I. D., Decamp, D. L., Lin, K. M., Sternweis, P. C., Simon, M. I., and Seaman, W. E. (2008). Signaling and cross-talk by C5a and UDP in macrophages selectively use PLCbeta3 to regulate intracellular free calcium. J. Biol. Chem. 283, 17351–17361.
Rössler, P., Kroner, C., Freitag, J., Noè, J., and Breer, H. (1998). Identification of a phospholipase C beta subtype in rat taste cells. Eur. J. Cell Biol. 77, 253–261.
Rowan, A. M., Moughan, P. J., Wilson, M. N., Maher, K., and Tasman-Jones, C. (1994). Comparison of the ileal and faecal digestibility of dietary amino acids in adult humans and evaluation of the pig as a model animal for digestion studies in man. Br. J. Nutr. 71, 29–42.
Saffouri, B., DuVal, J. W., and Makhlouf, G. M. (1984). Stimulation of gastrin secretion in vitro by intraluminal chemicals: regulation by intramural cholinergic and noncholinergic neurons. Gastroenterology 87, 557–561.
Schubert, M. L., Coy, D. H., and Makhlouf, G. M. (1992). Peptone stimulates gastrin secretion from the stomach by activating bombesin/GRP and cholinergic neurons. Am. J. Physiol. 262, G685–G689.
Singer, W. D., Brown, H. A., and Sternweis, P. C. (1997). Regulation of eukaryotic phosphatidylinositol-specific phospholipase C and phospholipase D. Annu. Rev. Biochem. 66, 475–509.
Tumbleson, M. E., and Schook, L. B. (eds). (1996). Advances in Swine in Biomedical Research, Vol. 1–2. New York: Plenum Press.
Varga, G., Campbell, D. R., Bussjaeger, L. J., and Solomon, T. E. (1993). Role of gastrin and cholecystokinin receptors in regulation of peptone-stimulated gastric acid secretion in conscious rats. Eur. J. Pharmacol. 250, 37–42.
Walsh, J. H. (1988). Peptides as regulators of gastric acid secretion. Annu. Rev. Physiol. 50, 41–63.
Wellendorph, P., Burhenne, N., Christiansen, B., Walter, B., Schmale, H., and Bräuner-Osborne, H. (2007). The rat GPRC6A: cloning and characterization. Gene 396, 257–267.
Zeng, N., Zeng, T. K., Walsh, J. H., Scott, D., and Sachs, G. (1995). Specific amino acids activate calcium signals in isolated G cells of rat antrum. Gastroenterology 108, A1020.
Keywords: receptors, GPR92, GPRC6A, CaSR, G- and D-cells, mouse, swine, human
Citation: Haid DC, Jordan-Biegger C, Widmayer P and Breer H (2012) Receptors responsive to protein breakdown products in G-cells and D-cells of mouse, swine and human. Front. Physio. 3:65. doi: 10.3389/fphys.2012.00065
Received: 27 January 2012; Accepted: 05 March 2012;
Published online: 10 April 2012.
Edited by:
Ravinder Abrol, California Institute of Technology, USAReviewed by:
R. John MacLeod, Queen’s University, CanadaGregory W. Aponte, University of California at Berkeley, USA
Copyright: © 2012 Haid, Jordan-Biegger, Widmayer and Breer. This is an open-access article distributed under the terms of the Creative Commons Attribution Non Commercial License, which permits non-commercial use, distribution, and reproduction in other forums, provided the original authors and source are credited.
*Correspondence: Désirée Christine Haid, Institute of Physiology, University of Hohenheim, Garbenstrasse 30, 70599 Stuttgart, Germany. e-mail: desi.haid@gmx.de