 Paul A. Walton* Michael Pizzitelli
- Department of Anatomy and Cell Biology, University of Western Ontario, London, ON, Canada
Peroxisomes produce hydrogen peroxide as a metabolic by-product of their many oxidase enzymes, but contain catalase that breaks down hydrogen peroxide in order to maintain the organelle’s oxidative balance. It has been previously demonstrated that, as cells age, catalase is increasingly absent from the peroxisome, and resides instead as an unimported tetrameric molecule in the cell cytosol; an alteration that is coincident with increased cellular hydrogen peroxide levels. As this process begins in middle-passage cells, we sought to determine whether peroxisomal hydrogen peroxide could contribute to the oxidative damage observed in mitochondria in late-passage cells. Early-passage human fibroblasts (Hs27) treated with aminotriazole (3-AT), an irreversible catalase inhibitor, demonstrated decreased catalase activity, increased levels of cellular hydrogen peroxide, protein carbonyls, and peroxisomal numbers. This treatment increased mitochondrial reactive oxygen species levels, and decreased the mitochondrial aconitase activity by ∼85% within 24 h. In addition, mitochondria from 3-AT treated cells show a decrease in inner membrane potential. These results demonstrate that peroxisome-derived oxidative imbalance may rapidly impair mitochondrial function, and considering that peroxisomal oxidative imbalance begins to occur in middle-passage cells, supports the hypothesis that peroxisomal oxidant release occurs upstream of, and contributes to, the mitochondrial damage observed in aging cells.
Introduction
Peroxisomes are ubiquitous subcellular organelles present in almost all eukaryotic cells and house a wide variety of indispensable metabolic reactions, the majority of which produce hydrogen peroxide (H2O2) as by-product (reviewed by Schrader and Fahimi, 2006). Under normal circumstances, peroxisomally generated H2O2 is quickly degraded to water and oxygen by the primary peroxisomal antioxidant enzyme, catalase. Peroxisomes lack DNA and translational machinery and thus all peroxisomal membrane and matrix proteins are encoded by the nuclear genome, synthesized in the cytosol on free polyribosomes and imported post-translationally (reviewed by Lazarow and Fujiki, 1985). To accomplish this task peroxisomes possess dynamic import machinery, including cystolic receptors, membrane docking and translocation activities, and recycling capabilities.
Previous work has demonstrated that peroxisomes of late-passage cells (>PDL40) display mislocalized catalase and diminished antioxidant capacity as peroxisomal import competency is compromised (Legakis et al., 2002). Furthermore, the progressive mislocalization of catalase has been demonstrated to occur in cells as early as middle-passage (PDL30-40). Importantly, this leads to the disequilibrium between H2O2 producing and clearing reactions within the organelle, thus, transitioning the peroxisome into a significant source of reactive oxygen species (ROS) and contributing to the elevated levels characteristic of late-passage cells and tissues (Terlecky et al., 2006).
While the contribution of peroxisomes to cellular aging is a relatively new area of investigation, mitochondria have been implicated in the Free Radical Theory of Aging since its initial development (Harman, 1972). This is primarily because mitochondria are not only a constitutive source of ROS, but also because basic mitochondrial function has a fundamental role in overall cellular metabolism. For this reason age-associated mitochondrial dysfunction has been intensively investigated and is often regarded as a pivotal factor in the aging process (Beckman and Ames, 1998; Atamna et al., 2000; Cadenas and Davies, 2000; Muller, 2009). As peroxisomes share many of these features with mitochondria, the focus of the current study has been to investigate how peroxisomal oxidative imbalance may contribute to mitochondrial dysfunction.
Peroxisomes are a potentially significant source of intracellular ROS under circumstances of inadequate antioxidant protection. Furthermore, this appears to be a naturally occurring (age-associated) event in the sense that cells exhibit a progressive mislocalization of peroxisomal catalase due its endogenous targeting signal, which possesses a relatively poor affinity for the Pex5p cycling import receptor as demonstrated in cell culture (Legakis et al., 2002; Koepke et al., 2007). Supporting this concept in animals, quantitative analysis of hepatic peroxisomes comparing old rats (39 months) to young rats (2 months) revealed a respective decrease in catalase content, yet an increase in urate oxidase levels and peroxisome volume density (Beier et al., 1993). Not only are peroxisomes a significant source of ROS which may elicit downstream effects on other cellular functions, but they also exhibit an age-associated decline in metabolic function and may contribute to aging and age-associated degenerative diseases (Périchon et al., 1998). Peroxisomes are therefore linked to the “Free Radical Theory of Aging” (Beckman and Ames, 1998; Hagen, 2003). Peroxisome metabolism is particularly important with respect to membrane composition and function and therefore peroxisomal dysfunction is also linked to the “Membrane Theory of Aging” (Shinitzky, 1987; Singh, 1997). Previously it has been demonstrated that the restoration of peroxisomal catalase import in late-passage cells via retroviral expression of catalase-SKL, a version of the enzyme with a more effective targeting signal, results in the rescue of many functions, including age-associated mitochondrial inner membrane depolarization (Koepke et al., 2007). Together with the observations that catalase mislocalization to the cytosol and subsequent peroxisomal oxidative imbalance begins to occur as early as middle-passage, has lead to the hypothesis that peroxisomally generated ROS may be an upstream initiator of age-associated mitochondrial dysfunction.
While peroxisomes and mitochondria have been metabolically linked (reviewed by Schrader and Yoon, 2007; Van Veldhoven, 2010), and cells with defects in peroxisomal biogenesis and/or metabolic pathways have coincident mitochondrial defects (Baumgart et al., 2001; Dirkx et al., 2005), we sought to determine whether these organelles were oxidatively linked as well.
Materials and Methods
Reagents and Antibodies
Amplex® Red, 5,5′,6,6′-tetrachloro-1,1′,3,3′-tetraethylbenzimidazolyl-carbocyanine iodide (JC-1) and MitoTracker® Red CM-H2XRos were purchased from Invitrogen/Molecular Probes (Eugene, OR, USA). 2,7-Dichlorofluorescin diacetate was purchased from Acros Organics (Fisher Scientific). The catalase inhibitor 3-amino-1,2,4-triazole, titanium (IV) oxysulfate, and anti-aconitase (Aco2) antibodies were obtained from Sigma-Aldich Chemical (St. Louis). All other reagents were obtained from standard sources.
Cell Culture
Hs27 diploid human fibroblasts were purchased from ATCC (Manassas, VA, USA). Cells were grown in DMEM (Invitrogen/Gibco) containing 10% FBS, 1% penicillin/streptomycin, and 2 mM L-glutamine while maintained at 37°C in 5% atmospheric CO2. The catalase inhibitor 3-AT was added to 2 mM.
Catalase Activity
Catalase activity was measured by its ability to degrade hydrogen peroxide, as previously described (Storrie and Madden, 1990; Koepke et al., 2008). Hs27 cells grown in 60 mm culture dishes to 90% confluency were trypsinized, pelleted, and resuspended in 2% Triton-X 100 solution on ice for at least 2 min. Cell samples were added to a reaction mixture of 20 mM imidazole buffer (pH 7.0), 1 mg/mL BSA, and 0.01% hydrogen peroxide and incubated on ice for 10 min. The reaction was stopped by addition of saturated Titanium (IV) oxysulfate (TiOSO4) in 1M H2SO4, which reacts with hydrogen peroxide to produce a yellow peroxotitanium complex. Absorbance at 410 nm was measured for “cell” and “no cell” samples, whereby the difference yielded a rate expressed as ΔOD410/min. Rates were then adjusted for protein concentration as determined by a BCA protein assay (Pierce Chemical), yielding a ΔOD410/min/mg total protein.
Aconitase Activity
Hs27 cells grown in 100 mm culture dishes until 90% confluence were semi-permeabilized in 25 μg/mL digitonin in PBS for 10 min, washed and scraped into 0.1% Triton-X 100 in PBS and left on ice for an additional 5 min. Lysate samples were added to 1 mL of aconitase reaction mix consisting of 50 mM Tris–Cl (pH 7.4), 5 mM sodium citrate, 0.6 mM manganese chloride, 0.2 mM NADP, and 1–2 units of isocitrate dehydrogenase. Absorbance at 340 nm was measured using a (Beckman Coulter DU 640) spectrophotometer over a 1 h time period. Rates of aconitase activity were calculated as ΔOD340/min and adjusted for protein concentration of lysate samples using a BCA protein assay (Pierce Chemical), yielding a ΔOD340/min/mg total protein.
ROS Measurements
2′,7′-Dichlorofluorescin diacetate (DCFH-DA) was used as previously described (Legakis et al., 2002) to visualize ROS production in live cells. Briefly, cells growing on glass-bottomed culture dishes (MatTech, Ashland, MA, USA) were washed with PBS and incubated for 5 min at 37°C with 25 μM DCFH-DA. Cells were subsequently washed and incubated with DMEM minus phenol red. The resultant cellular fluorescence due to oxidized DCFH was immediately visualized by confocal microscopy using an excitation wavelength of 488 nm.
Protein Carbonylation Measurements
Oxidative damage to total cellular protein was measured using the quantitative assay of Reznick and Packer (1994). Cells were grown in 100 mm culture dishes, trypsinized, pelleted, and dissolved in 0.1% Triton-X 100 in PBS. Equal amounts of cellular protein from treated and untreated samples, as determined by a BCA protein assay, were then used to determine protein carbonyl levels. Each sample was divided into two and mixed with either 10 mM 2,4-dinitrophenylhydrazine in 2.5 M HCl or 2.5 M HCl alone and allowed to incubate in the dark for 1 h with vortex mixing every 15 min. Trichloroacetic acid [20% (w/v)] was then added to samples to a final concentration of 10% (w/v), left on ice for 10 min, and then centrifuged for 5 min at 4°C using a table top centrifuge to collect protein precipitates. Supernatant was discarded and a second wash with 10% (w/v) trichloroacetic acid was performed. Samples were then washed three times in ethanol-ethyl acetate (1:1; v/v) to remove free DNPH after which precipitates were dissolved in 6 M guanidine hydrochloride and left for 10 min with intermittent vortexing. Absorbance at 365 nm was then obtained using a (Beckman Coulter DU 640) spectrophotometer. The difference in values from derivatized (DNPH) and control (only HCl) subsamples were then determined. The molar extinction coefficient of dinitrophenylhydrazine (ε of 22,000 M−1) was then used to calculate carbonyl values (nmol/mg protein).
Immunocytochemistry and Peroxisomal Quantitation
Peroxisomal numbers in control and 3-AT treated cells were measured by immunostaining and imaging cells for the peroxisomal membrane protein, Pmp70p, as previously described (Koepke et al., 2008). A quantitative measure of the number of peroxisomes per square unit was performed using Image J software (NIH). Using the digital images, cells of interest were outlined and their image areas (in pixels) were measured. Next, these outlined cells were analyzed for the number of particles greater than 4 × 4 pixels they contained. These particles were the Pmp70p-positive peroxisomes. To account for the different sizes of the cells, the number of peroxisomes was divided by the image area, to give a measure of the number of peroxisomes per 1000 pixels (≈1.5 μm2). Average areas per cell were not significantly different between the treated and control groups. The averages and SD from between 6 and 14 cells were analyzed for each time treatment and treatment group.
Mitochondrial Dye Assays
Mitochondrial ROS production was measured using MitoTracker Red CM-H2XRos dye. For these assays, cells were first grown on coverslips in appropriate culture medium. Pre-warmed growth medium containing 10 nM MitoTracker probe was then incubated with the cells for 15 min. After staining, cells were washed with PBS and incubated with DMEM minus phenol red. Live cells were imaged using confocal microscopy under identical settings between control and treated groups. Fixing cells with formaldehyde prior to imaging yielded a poorer signal to noise ratio, and an altered mitochondrial morphology.
Mitochondrial membrane potential was determined using JC-1, a cationic dye which accumulates in potential-dependent manner in the mitochondria. Depolarization of the organelle is observed as a fluorescence shift from the red (525 nm) J aggregate (polarized mitochondria), to the green (590 nm) J monomer (depolarized mitochondria). Thus, a decline in the red/green fluorescence intensity ratio is associated with depolarization of the organelle. Cells were grown on glass bottom 30 mm culture dishes, incubated with JC-1 dye in DMEM for 15 min at 37°C, rinsed in PBS, and incubated in pre-warmed DMEM minus phenol red. Cells were then immediately imaged using fluorescent confocal microscopy, under identical settings between control and treated groups. Average pixel intensity of the monomeric JC-1 dye (green) from untreated and 3-AT treated cells was obtained using Image J analyses. Regions used for the analyses were depicted in outline masks, with the threshold set from 34 to 255 on the grayscale, and the lower limit for analyses were performed on objects larger than 300 pixels (≈0.4 μm2). The averages and SD from between 7 and 10 cells were analyzed for each treatment group.
Statistical Analyses
All statistical analyses were performed using GraphPad Prism software. For experiments with two treatment groups a two-tailed, unpaired Student’s t-test was used. For experiments with greater than two treatment groups a one-way ANOVA with the Tukey’s Multiple Comparison post hoc test was employed. Differences between groups were considered statistically significant when p values of <0.05 were measured.
Results
Inhibition of Peroxisomal Catalase
3-AT has previously been demonstrated to be an irreversible inhibitor of catalase from a number of eukaryotes (Sheikh et al., 1998). While we have previously demonstrated the inhibition of catalase in human cultured Hs27 cells over a broad range of concentrations and times (Koepke et al., 2007), we sought to study the inhibitory effects of intermediate levels of 3-AT (2 mM) over a 24 h time course. Results (Figure 1) indicated that ∼80% of the initial catalase activity in Hs27 cell cultures was lost after 4 h of treatment with 2 mM 3-AT. The time for half of the initial activity to be inhibited was estimated to be just less than 1 h of incubation in the presence of 2 mM 3-AT. No further decrease in catalase activity, beyond that seen at 4 h, was observed at 24 h.
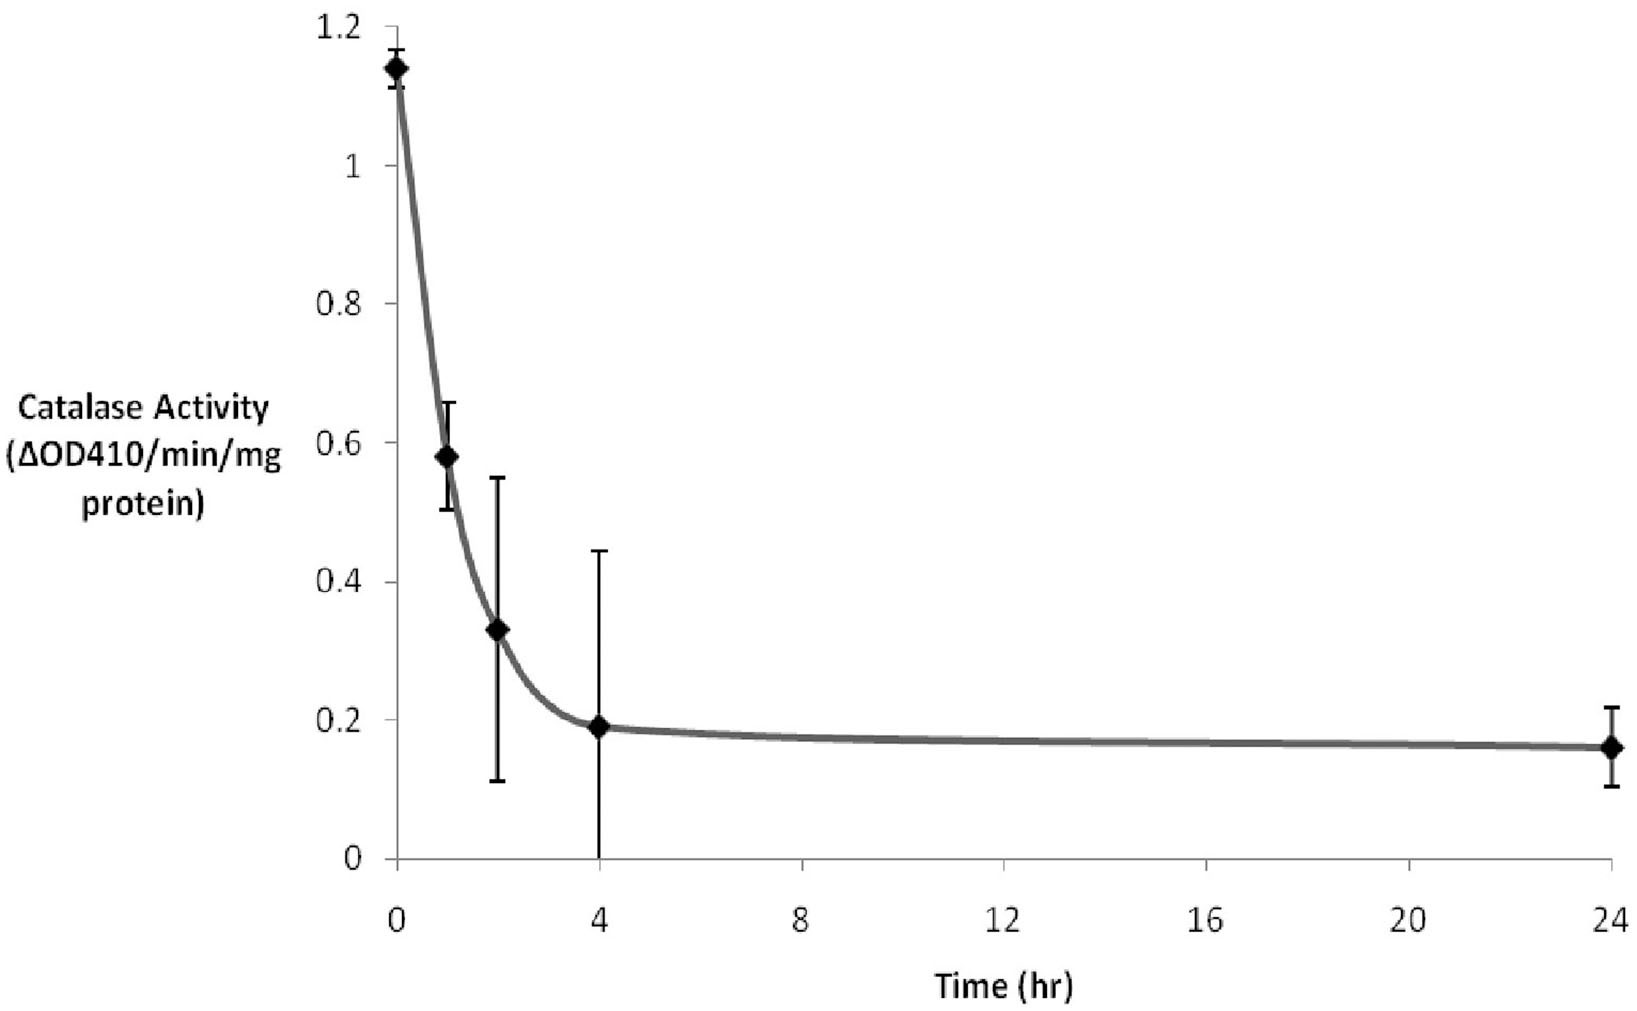
Figure 1. 3-AT inhibits catalase activity. Hs27 fibroblasts were treated with 2 mM 3-AT for varying durations. Catalase activity was determined by adding cell lysates to a 1 mM H2O2 solution. The difference in absorbance at 410 nm was due to the remaining H2O2 being converted to a yellow peroxotitanium complex by addition of TiSO4 following the 10 min incubation. Within ∼4 h of 3-AT treatment catalase activity was reduced to ∼15% that observed in untreated cells. The residual catalase activity did not diminish between 4 and 24 h of 3-AT treatment.
To characterize catalase recovery after 3-AT treatment, wash out experiments were performed after 24 h exposure to 3-AT; thereafter cells were allowed to recover in the absence or presence of 100 μg/mL of cycloheximide, an inhibitor of protein synthesis. Removal of aminotriazole permitted a 50% recovery of catalase activity within 24 h (Figure 2), a result originally observed by Hayflick and colleagues (Mellman et al., 1972). As expected, this restoration was repressed by treatment with cycloheximide; indicating synthesis of new protein is required for recovery to occur, owing to the covalent and irreversible interaction of 3-AT with catalase protein (Margoliash et al., 1960).
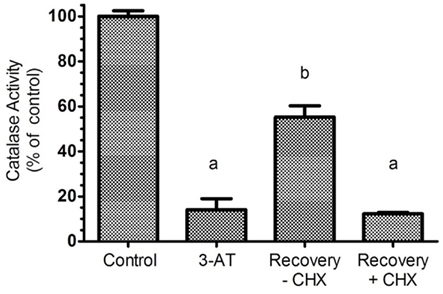
Figure 2. Recovery of catalase activity requires protein synthesis. Hs27 cells were treated with 2 mM aminotriazole for 24 h followed by a 24 h recovery period (in the absence of aminotriazole) with or without 100 μg/mL of cycloheximide, an efficient inhibitor of protein synthesis. Results indicate that aminotriazole is an irreversible inhibitor of catalase, and for cells to recovery activity, synthesis of new catalase protein must occur. Determination of catalase activity is described in Section “Materials and Methods.” Letters represent values significantly different from the control and/or each other based on ANOVA analysis where p < 0.05.
Inhibition of Catalase Results in Increased Levels of Intracellular ROS, Protein Carbonyls, and Peroxisomal Numbers
Inhibition of peroxisomal catalase would be expected to result in increased levels of hydrogen peroxide, generated by the peroxisomal oxidase enzymes. As hydrogen peroxide is capable of passing through biological membranes (Bienert et al., 2006; Koopman et al., 2010), we would expect to observe elevated levels of hydrogen peroxide within the cell. As Figure 3 depicts, increased levels of hydrogen peroxide, as measured by 2,7-DCF staining, could be observed in 3-AT treated cells within 24 h of treatment. In addition, subcellular structures with mitochondrial morphology (arrowheads) were observed with high levels of 2,7-DCF staining in many of the treated cells. This observation was explored in more detail in Figure 5.
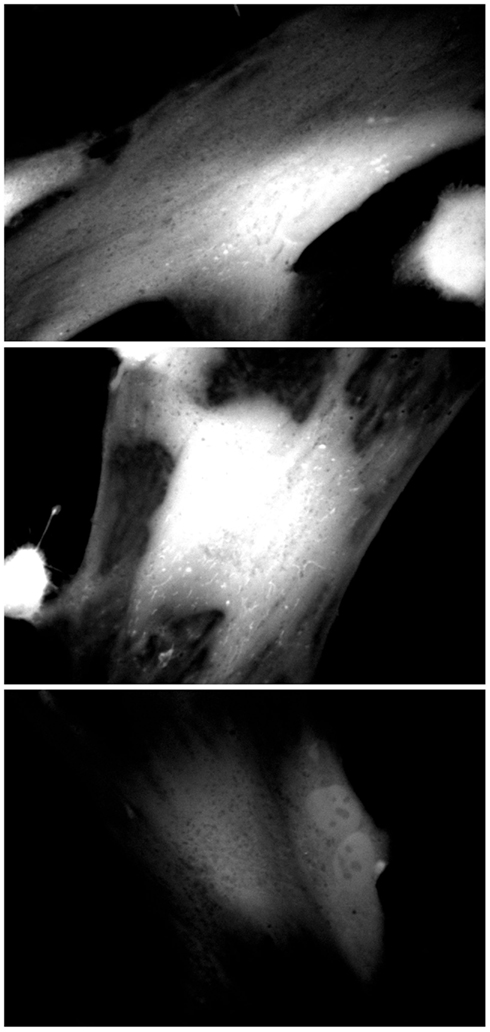
Figure 3. Catalase inhibition increases cellular 2,7-DCF staining. Hs27 fibroblasts were grown in the presence (top two panels) or absence (bottom panel) of 2 mM 3-AT for 24 h, after which they were treated with the ROS-sensitive dye 2,7-DCF (Invitrogen/Molecular Probes). Cells were live-imaged using confocal microscopy and FITC optics. Images are representative of numerous fields, imaged under identical conditions.
We have previously demonstrated oxidative damage to cellular components following treatment of cells with low levels (250 μM) of 3-AT for extended periods of time (Koepke et al., 2007). As can be seen in Figure 4, a quantitative measure of protein carbonyls demonstrated a greater than 25% increase in the levels of cellular protein carbonyls in 3-AT treated cells, when compared to untreated fibroblasts.
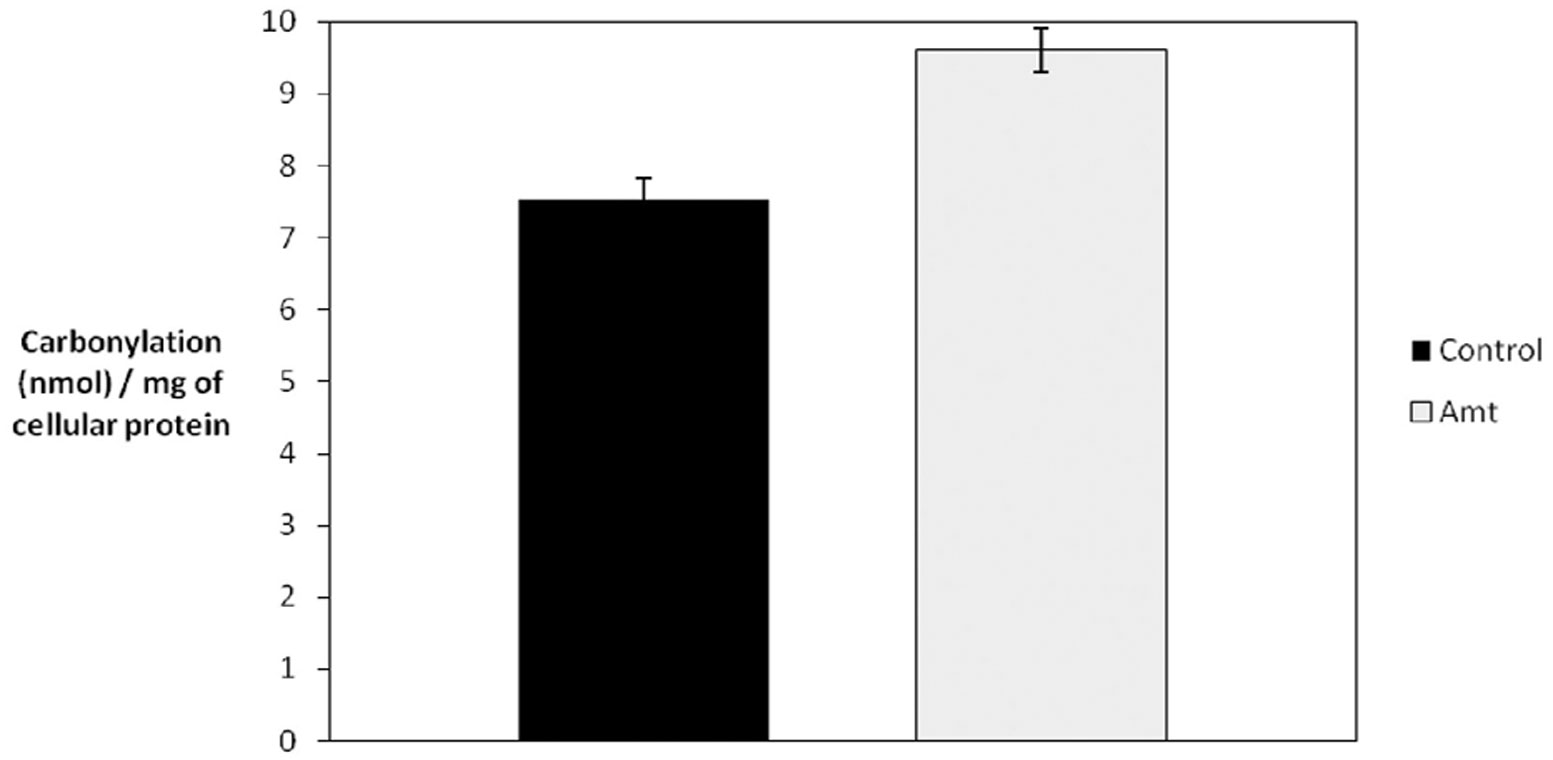
Figure 4. Catalase inhibition results in increased protein carbonylation. Hs27 fibroblasts were grown in the presence or absence of 2 mM 3-AT for 4 days and protein carbonylation was determined. A quantitative spectrophotometric assay involving the derivatization of carbonyl groups with 2,4-dinitrophenylhydrazine was used, as described in Section “Materials and Methods.” An ∼7% increase in total cellular carbonyls was observed in cells treated with 3-AT (p < 0.05).
As a response to a decrease in catalase activity, either in late-passage cells (Legakis et al., 2002; Ivashchenko et al., 2011), diseased cells (Wood et al., 2006), or cells treated with 3-AT (Sheikh et al., 1998; Koepke et al., 2008), cells demonstrate an increase in the number of peroxisomes, although not with a corresponding increase in peroxisomal enzyme activities. In order to determine whether this increase in peroxisomal number occurred shortly after inactivation of catalase with 3-AT, we immunostained control and treated cells for the peroxisomal membrane protein pmp70 after 24 and 48 h of treatment with 3-AT. We employed Image J software to count the number of peroxisomes within cells and normalized the numbers of peroxisomes per 1000 pixels of cell area (≈1.5 μm2). The results (Table 1) indicate that, while there was no significant increase in peroxisomal numbers after 24 h of 3-AT treatment, there was a statistically significant increase in peroxisomal numbers of ∼25% after 48 h of 3-AT treatment. While this increase in peroxisomal numbers is less than previously reported, these results demonstrate that cells lacking catalase activity are eliciting a compensatory response very shortly after the levels of hydrogen peroxide begin to increase.
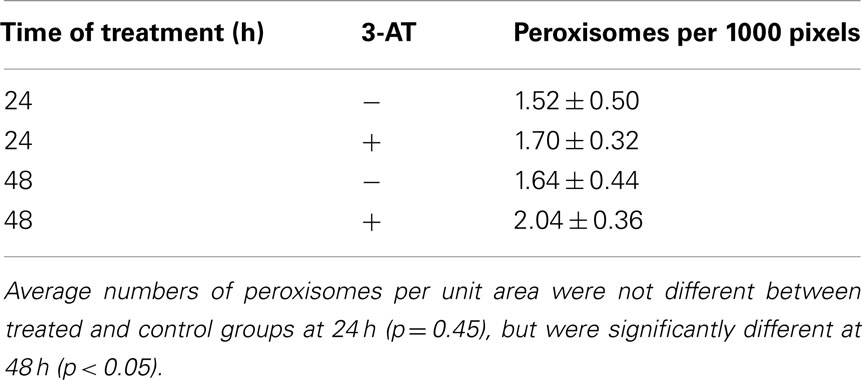
Table 1. Effects of 3-AT treatment on pmp70-positive peroxisome numbers per unit area of cell.
Inhibition of Peroxisomal Catalase Results in Oxidative Damage to Mitochondria
Having confirmed that treatment of human fibroblasts with 3-AT resulted in the increase in peroxisomally derived ROS and subsequent cellular oxidative damage, we sought to determine the downstream effects of 3-AT treatment on mitochondria. Results presented in Figure 3 demonstrate that following the inhibition of peroxisomal catalase activity with 3-AT, 2,7-DCF stained structures with mitochondrial morphology appear in treated cells. In order to confirm whether these ROS staining structures were mitochondria, we double-stained cells following 48 h of 3-AT treatment, staining living cells for both general cellular ROS with 2,7-DCF, and mitochondrial ROS with MitoTracker Red Ros. The results confirmed that the 2,7-DCF staining structures observed following the inhibition of peroxisomal catalase were indeed mitochondria (Figure 5). Thus, the peroxisomal oxidative imbalance generated by inhibiting catalase was yielding downstream oxidative effects on mitochondria.
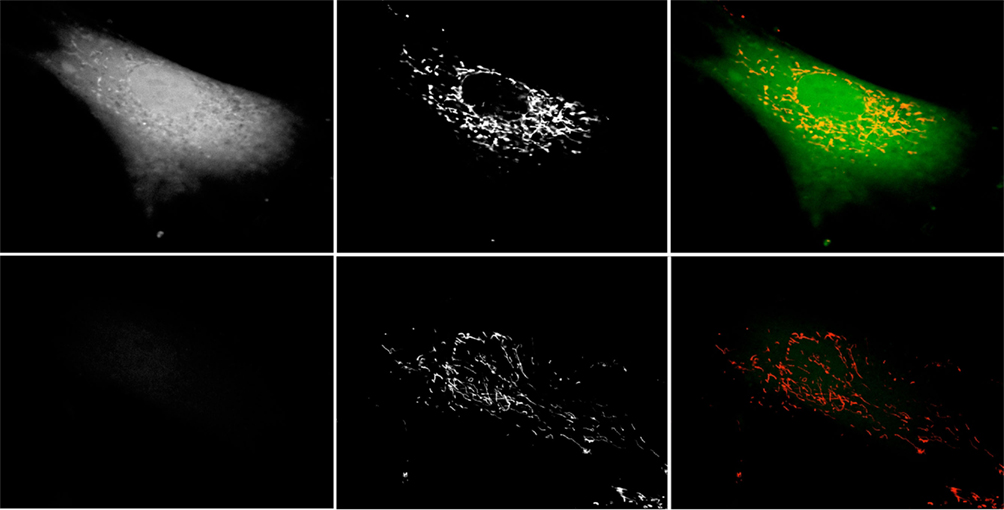
Figure 5. Catalase inhibition increases mitochondrial DCF staining. Hs27 fibroblasts were grown in the presence (top row) or absence (bottom row) of 2 mM 3-AT for 48 h, after which they were treated with the ROS-sensitive dye 2,7-DCF (left column) and the mitochondrial ROS-sensitive dye MitoTracker Red CM-H2XRos (center column). Cells were live-imaged using confocal microscopy employing FITC optics for DCF and Texas Red optics for MitoTracker Red. Right column is a false-color overlay of the DCF and MitoTracker images. Images are representative of numerous fields, imaged under identical conditions.
Time course experiments (Figure 6), staining for mitochondrial ROS with MitoTracker Red Ros demonstrated increased staining in treated cells beginning 24 h after 3-AT treatment. As was also observed in Figure 5, an increased mitochondrial ROS staining was observed at 48 h of 3-AT treatment, this staining appeared to be increased following 5 days of 3-AT treatment. Thus, there appeared to be a progressive accumulation of mitochondrial ROS, beginning ∼24 h after the inhibition of peroxisomal catalase.
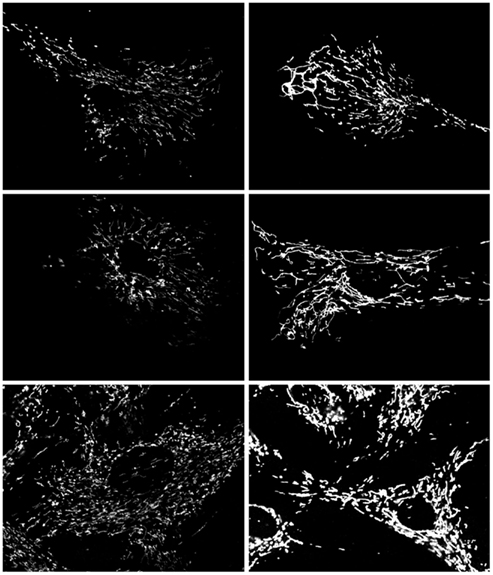
Figure 6. Effects of treatment with 2 mM 3-AT on mitochondrial ROS staining. Control Hs27 cells (left column) demonstrate less mitochondrial ROS staining than 3-AT treated cells (right column) after 24 h (top row), 48 h (middle row), and 5 days (bottom row). In addition, staining in 3-AT treated cells appeared homogeneous throughout the mitochondria. Live cells were imaged under identical conditions, and are representative of numerous fields viewed and imaged.
Inhibition of Mitochondrial Aconitase Activity
In order to determine whether the increase in mitochondrial ROS was reflected in the inhibition of mitochondrial enzyme activities, we chose to study the effects of 3-AT-induced catalase inhibition on mitochondrial aconitase. One of the Krebs Cycle enzymes, aconitase possesses an iron–sulfur cluster at its active site, and as such is very sensitive to inactivation in an oxidizing environment (Gardner et al., 1994). The inhibition of peroxisomal catalase resulted in a greater than 90% inhibition in aconitase activity within 24 h of treatment of cells with 3-AT (Figure 7). In order to confirm that 3-AT was not inhibiting aconitase directly, lysates from untreated cells were assayed for aconitase in the presence of 3-AT (Figure 8). No decrease in aconitase activity was observed in treated cell lysates when compared with untreated controls. Thus the inhibition of mitochondrial aconitase was secondary to the effects of 3-AT on peroxisomal catalase.
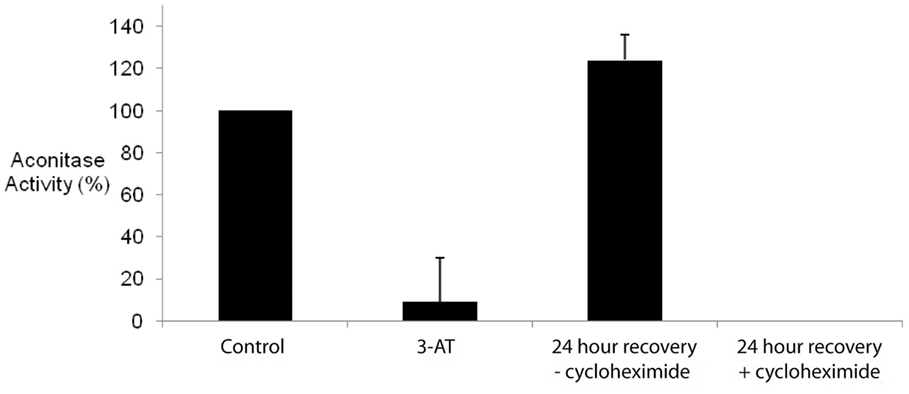
Figure 7. Inhibition of peroxisomal catalase results in the inhibition of mitochondrial aconitase. Hs27 cells were grown in the presence or absence of 2 mM 3-AT for 24 h. Aconitase activity was determined using a linked assay, as described in Section “Materials and Methods.” For recovery experiments, Hs27 cells were treated with 3-AT for 24 h followed by a 24 h recovery period (in the absence of 3-AT) with or without 100 μg/mL of cycloheximide, an inhibitor of protein synthesis. Results indicate the inhibition of the peroxisomal antioxidant enzyme, catalase, results in significant inhibition of the oxidatively sensitive mitochondrial enzyme, aconitase (p < 0.05). While aconitase activity recovers following the removal of 3-AT, this activity fails to recover and was undetectable in the presence of cycloheximide.
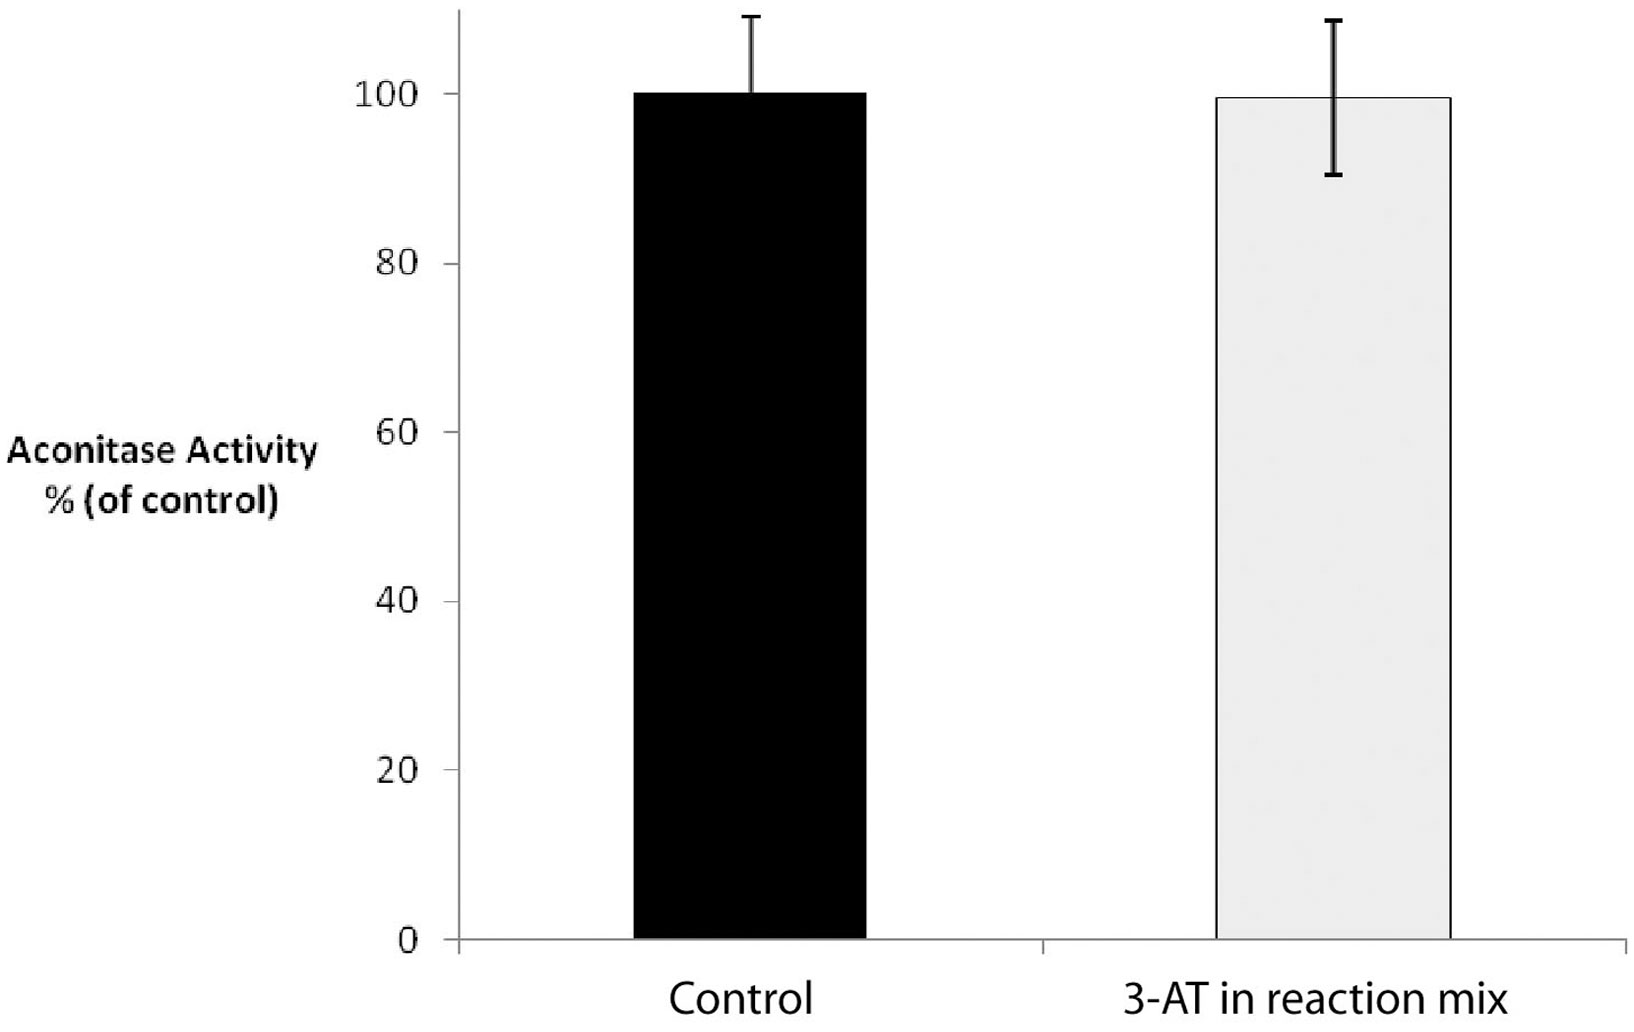
Figure 8. 3-AT does not directly inhibit aconitase activity. Untreated Hs27 cell lysates were assayed for aconitase activity in the presence of absence of 2 mM 3-AT. No significant decrease in aconitase activity was observed in treated cell lysates when compared with untreated controls.
The recovery of mitochondrial aconitase activity following removal of 3-AT paralleled the recovery of catalase activity, with the restoration of control levels of aconitase activity being observed after 24 h (Figure 7). However, in the presence of cycloheximide, aconitase activity failed to recover following the removal of 3-AT. While one possible explanation for these results is that the peroxisomal catalase activity must be restored in order to correct the cellular oxidative balance and thus the mitochondrial aconitase activity, however, inhibition of aconitase by oxidation is known to occur by both reversible and irreversible methods (Bulteau et al., 2003). Therefore, it is also possible that the oxidatively damaged aconitase protein must be replaced in order for the activity to be restored.
Effects of Peroxisomal Catalase Inhibition on Mitochondrial Function
We have previously demonstrated the age-dependent decrease in mitochondrial inner membrane potential in late-passage human fibroblasts, which could be restored to normal, early-passage levels by the introduction of catalase bearing the more efficient – SKL peroxisomal targeting signal (Koepke et al., 2008). In light of this correction of mitochondrial function, we sought to determine whether the inhibition of peroxisomal catalase decreased the mitochondrial inner membrane potential in early-passage cells. Results presented in Figure 9 indicate an increase in the monomeric form of the JC-1 dye, indicative of a decrease in mitochondrial inner membrane potential following treatment of cells with 3-AT, over the 4-day time course. As we have previously observed the loss of mitochondrial inner membrane potential in late-passage cells (Koepke et al., 2007), and in cells treated with 3-AT over 20 population doublings (Koepke et al., 2008), our present results imply that the beginnings of the loss of inner membrane potential begins only a few days following the loss of peroxisomal oxidative homeostasis.
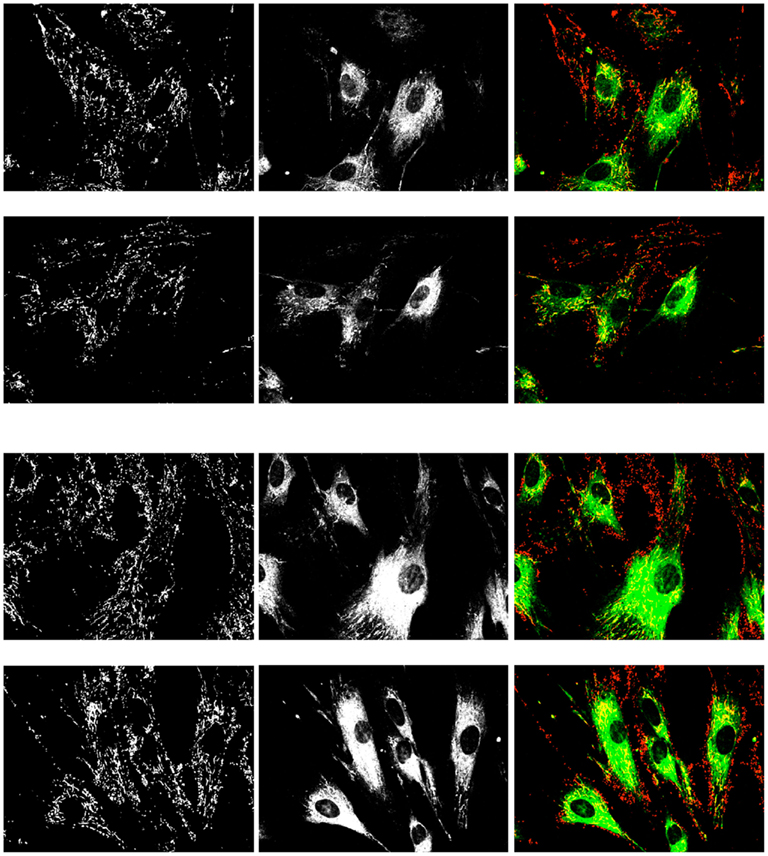
Figure 9. Effects of treatment with 2 mM 3-AT for 4 days on mitochondrial inner membrane potential. Control Hs27 cells (upper two rows) and 3-AT treated cells (lower two rows) were incubated with JC-1 dye and imaged for the presence of the aggregate (left column, red) and the monomeric (center column, green) forms of the dye. Live cells were imaged under identical conditions, and are representative of numerous fields viewed and imaged. The increase in the monomeric, green form of the dye is indicative of a depolarization of the mitochondrial inner membrane. Treated cells had a 30% higher mean pixel intensity than control cells (143 ± 14 vs. 110 ± 10) in the monomeric form of the dye (p < 0.05).
Discussion
Our interest in the order of the formation of cellular oxidants is predicated on two previous observations. First, the process described as “peroxisomal senescence,” that being the age-dependant decrease in the import of peroxisomal proteins (Legakis et al., 2002), particularly of catalase, begins in middle-passage cells, before they demonstrate mitochondrial or other peroxisomal dysfunctions. Secondly, the restoration of mitochondrial inner membrane potential that occurs following the targeting of catalase-SKL to peroxisomes in late-passage cells (Koepke et al., 2007) provides strong support to the hypothesis that oxidative damage of peroxisomal origin occurs upstream of that derived from mitochondria. In an attempt to address this order, we sought to determine the effects of the inhibition of peroxisomal catalase on mitochondrial functions in early-passage cells.
The catalase inhibitor, 3-amino-1,2,4-triazole, has been previously demonstrated to make a covalent bond with catalase during its first reactive cycle (Margoliash and Novogrodsky, 1958; Margoliash et al., 1960), forming an irreversible inhibitory complex. This inhibition of catalase activity has been exploited in a number of ways, including the biochemical functioning (Middelkoop et al., 1993) and structure of the enzyme (Kirkman and Gaetani, 1984), and the cellular effects of this inhibition (Sheikh et al., 1998; Koepke et al., 2008). While it remains possible that 3-AT possesses other, direct effects on other mammalian cellular constituents, no effects similar to the direct binding and inhibition of catalase have been reported. Thus, being cognisant of other potential effects of 3-AT, we employed this molecule to study the downstream effects of catalase inhibition on mitochondrial function.
We observed the time and concentration dependent inhibition of peroxisomal catalase, as has been reported in other studies (Sheikh et al., 1998). The inhibition of catalase resulted in the accumulation of ROS within the cells, and the subsequent formation of cellular oxidative damage, including protein carbonyls.
Importantly, we observed oxidation-based changes to mitochondria in the treated cells. We have previously reported increased mitochondrial oxidative changes, as indicated by MitoROS staining, in cells treated with lower levels of 3-AT for longer periods of time (Koepke et al., 2008). However, in this study we demonstrate that the increase in mitochondrial oxidative damage and the decrease in mitochondrial function occur very rapidly following the inhibition of peroxisomal catalase. Within 24 h increases in mitochondrial ROS can be observed, and an inhibition of the oxidation sensitive mitochondrial protein aconitase can be measured. Thus, we demonstrate a linkage between the loss of the peroxisomal oxidative balance and the loss of oxidation sensitive components of the mitochondria. This places peroxisomal dysfunction upstream of subsequent mitochondrial effects. Recent results from Fransen and coworkers (Ivashchenko et al., 2011) have employed redox sensitive probes and demonstrated that excess ROS generated within peroxisomes disturbs mitochondrial redox balance within a few minutes.
It has been established that the inhibition of catalase with 3-AT for 20 cell passages results in elevated levels of ROS, creating an oxidizing intracellular environment (Koepke et al., 2008). Early-passage treated cells exhibited increased staining for the ROS-sensitive dye, 2,7-DCF, as well as increased general levels of protein carbonylation both of which are in agreement with previous long-term results reported by Koepke et al. (2008). A novel finding of the present study was the observation that 3-AT treated cells displayed not only a general increase in 2,7-DCF staining but also specific sub-cellar regions of intensified staining which resembled mitochondrial morphology. These structures were confirmed as mitochondria by co-staining with 2,7-DCF and the MitoTracker Red CM-H2XRos probe. Thus, these data support the hypothesis that peroxisomally derived ROS elicited a downstream effect causing an increase in mitochondrial ROS production or accumulation. Indeed, mitochondria of 3-AT treated cells were shown to accumulate ROS. This chain-reaction like effect is potentially significant as it demonstrates how the uncoupling of antioxidant defense of one cellular organelle, the peroxisome, leads to the uncoupling of another, the mitochondria. 3-AT treated mouse embryonic fibroblast cells have also been demonstrated to show a dysregulation in mitochondrial redox status (Ivashchenko et al., 2011). How exactly this effect is taking place is currently unclear but a straightforward explanation may simply be that the mitochondrial antioxidant defense system becomes overwhelmed in the presence of additional oxidative burden contributed by peroxisomally derived ROS. In particular, H2O2, expected to be the dominant species of ROS generated through catalase inhibition is freely diffusible across biological membranes and thus capable of “spilling” out into other cellular compartments (Bienert et al., 2006; Koopman et al., 2010). Hydrogen peroxide is not only diffusible through biological membranes, regulated in part by lipid composition, but may also pass through aquaporin (8) channels present in the plasma and mitochondrial membranes (Bienert et al., 2006). Hydrogen peroxide is also the enzymatic product of superoxide dismutase. Therefore the accumulation of hydrogen peroxide may be altering this reaction’s equilibrium, according to the Le Chatelier’s Principle, resulting in an increase in mitochondrial superoxide concentration. It has also been suggested that oxidative damage to the mitochondrial inner membrane proteins that comprise the electron transport chain alters their efficiency in electron transfer. This is proposed to lead to increased leakage in electron flow to the terminal electron acceptor cytochrome C, thus resulting in an increase in and hydrogen peroxide generation (Bandy and Davison, 1990). Indeed it has been demonstrated that Complex I deficiency results in a 2- to 10-fold increase in hydroxyl radical production under basal conditions (Luo et al., 1997). Furthermore, complexes I and IV show selectively diminished activities in aged rat brain and liver (Navarro, 2004) and are known to be dysfunctional in various age-associated neurological disorders (Navarro and Boveris, 2007). Experiments in transgenic mice have demonstrated that targeting catalase to the mitochondria increases the lifespan of these animals (Schriner et al., 2005). Our results indicate that this localization of catalase may ameliorate the mitochondrial effects of the excess hydrogen peroxide.
Based on previous and current work, the following model as to how peroxisomes may contribute to mitochondrial dysfunction in the cellular aging process is proposed. In this scenario the relatively weak affinity of the PTS1 import cycling receptor, Pex5, for the divergent (-KANL) targeting signal of catalase leads to a pre-disposed disequilibrium between the import of catalase and more effectively targeted, – SKL bearing, oxidases. As the organelle slowly loses the ability to clear generated ROS, the peroxisomal import machinery situated within the organelle’s membrane becomes compromised. With the reduced functioning of the import machinery catalase import becomes even more dramatically affected perpetuating a “negative spiral-like” effect. This is supported by the observation that PTS1 import shows reduced functionality in late-passage cells and while – SKL mediated import is maintained (albeit with reduced efficiency) catalase import is practically non-existent (Legakis et al., 2002; Koepke et al., 2007). This progressively transitions the peroxisome into a significant source of intracellular ROS, contributing to elevated levels observed in late-passage cells. As the primary peroxisomal ROS, hydrogen peroxide, is freely diffusible, it elicits oxidative damage throughout the cell and in particular to mitochondria. The resulting excessive oxidative burden may overwhelm the mitochondrial antioxidant defense system and/or decrease the efficiency of ETC complexes causing it to generate more ROS. At the same time the oxidatively sensitive mitochondrial enzyme, aconitase, becomes inactive as its active site is disassembled by oxidative attack. This negative effect of peroxisome-derived oxidants on mitochondrial function occurs within a very short time course, certainly within a few hours. This is potentially detrimental in two ways; the first being that loss of aconitase activity may compromise functionality of the tricarboxylic acid cycle which may contribute to mitochondrial dysfunction over sufficient time and secondly that its inactivation may result in an increase in free iron, which is capable of escalating oxidative insult by catalyzing the production of the more reactive hydroxyl radical through the Fenton reaction. After prolonged incubation this process is believed to culminate in the loss of mitochondrial inner membrane potential and subsequent impaired oxidative phosphorylation, which is characteristic of late-passage and aged cells as well as certain age-related pathologies. The loss of peroxisomal oxidative balance may also mitigate some of the important protective “anti-aging” mitochondrial functions, as reviewed by Titorenko and Terlecky (2011). Coupled with the long-term effects of catalase inhibition on mitochondrial function (Koepke et al., 2008) and the restoration of mitochondrial inner membrane potential observed in late-passage cells expressing peroxisomally targeted catalase-SKL (Koepke et al., 2007) our present short-term results support the hypothesis that peroxisomal oxidative damage is upstream of, and contributes to, the mitochondrial damage observed in the aging process.
Conflict of Interest Statement
The authors declare that the research was conducted in the absence of any commercial or financial relationships that could be construed as a potential conflict of interest.
Acknowledgments
This work was supported by a Discovery Grant from NSERC (Canada) to Paul A. Walton.
References
Atamna, H., Paler-Martinez, A., and Ames, B. N. (2000). N-t-butyl hydroxylamine, a hydrolysis product of a-phenyl-N-t-butyl nitrone, is more potent in delaying senescence in human lung fibroblasts. J. Biol. Chem. 275, 6741–6748.
Bandy, B., and Davison, A. J. (1990). Mitochondrial mutations may increase oxidative stress: implications for carcinogenesis and aging? Free Radic. Biol. Med. 8, 523–539.
Baumgart, E., Vanhorebeek, I., Grabenbauer, M., Borgers, M., Declercq, P. E., Fahimi, H. D., and Baes, M. (2001). Mitochondrial alterations caused by defective peroxisomal biogenesis in a mouse model for Zellweger syndrome (PEX5 knockout mouse). Am. J. Pathol.159, 1477–1494.
Beckman, K. B., and Ames, B. N. (1998). The free radical theory of aging matures. Physiol. Rev. 78, 547–581.
Beier, K., Volkl, A., and Fahimi, H. D. (1993). The impact of aging on enzyme proteins of rat liver peroxisomes: quantitative analysis by immunoblotting and immunoelectron microscopy. Virchows Arch. B Cell. Pathol. 63, 139–146.
Bienert, G. P., Schjoerring, J. K., and Jahn, T. P. (2006). Membrane transport of hydrogen peroxide. Biochim. Biophys. Acta 1758, 994–1003.
Bulteau, A. L., Ikeda-Saito, M., and Szweda, L. I. (2003). Redox-dependent modulation of aconitase activity in intact mitochondria. Biochemistry 42, 14846–14855.
Cadenas, E., and Davies, K. J. A. (2000). Mitochondrial free radical generation, oxidative stress, and aging. Free Radic. Biol. Med. 29, 222–230.
Dirkx, R. I., Vanhorebeek, I., Martens, K., Schad, A., Grabenbauer, M., Fahimi, D., Declercq, P., Van Veldhoven, P. P., and Baes, M. (2005). Absence of peroxisomes in mouse hepatoctyes causes mitochondrial and ER abnormalities. Hepatology 41, 868–878.
Gardner, P. R., Ngyuyen, D. D. H., and White, C. W. (1994). Aconitase is a sensitive and critical target of oxygen poisoning in cultured mammalian cells and in rat lungs. Proc. Natl. Acad. Sci. U.S.A. 91, 12248–12252.
Hagen, T. M. (2003). Oxidative stress, redox imbalance, and the aging process. Antioxid. Redox Signal. 5, 503–506.
Ivashchenko, O., Van Veldhoven, P. P., Brees, C., Ho, Y. S., Terlecky, S. R., and Fransen, M. (2011). Intraperoxisomal redox balance in mammalian cells: oxidative stress and interorganellar cross-talk. Mol. Biol. Cell 22, 1440–1451.
Kirkman, H. N., and Gaetani, G. F. (1984). Catalase: a tetrameric enzyme with four tightly bound molecules of NADPH. Proc. Natl. Acad. Sci. U.S.A. 81:4343–4347.
Koepke, J. I., Nakrieko, K. A., Wood, C. S., Boucher, K. K., Terlecky, L. J., Walton, P. A., and Terlecky, S. R. (2007). Restoration of peroxisomal catalase import in a model of human cellular aging. Traffic 8, 1590–1600.
Koepke, J. I., Wood, C. S., Terlecky, L. J., Walton, P. A., and Terlecky, S. R. (2008). Progeric effects of catalase inactivation in human cells. Toxicol. Appl. Pharmacol. 232, 99–108.
Koopman, W. J., Nijtmans, L. G., Dieteren, C. E., Roestenberg, P., Valsecchi, F., Smeitink, J. A., and Willems, P. H. (2010). Mammalian mitochondrial complex I: biogenesis, regulation, and reactive oxygen species generation. Antioxid. Redox Signal. 12, 1431–1470.
Legakis, J. E., Koepke, J. I., Jedeszko, C., Barlaskar, F., Terlecky, L. J., Edwards, H. J., Walton, P. A., and Terlecky, S. R. (2002). Peroxisome senescence in human fibroblasts. Mol. Biol. Cell 13, 4243–4255.
Luo, X., Pitkanen, S., Kassovska-Bratinova, S., Robinson, B. H., and Lehotay, D. C. (1997). Excessive formation of hydroxyl radicals and aldehydic lipid peroxidation products in cultured skin fibroblasts from patients with complex I deficiency. J. Clin. Invest. 99, 2877–2882.
Margoliash, E., and Novogrodsky, A. (1958). A study of the inhibition of catalase by 3-amino-1:2:4-triazole. Biochem. J. 68, 468–475.
Margoliash, E., Novogrodsky, A., and Schejter, A. (1960). Irreversible reaction of 3-amino-1:2:4:-triazole and related inhibitors with the protein of catalase. Biochem. J. 74, 339–348.
Mellman, W. K., Schimke, R. T., and Hayflick, L. (1972). Catalase turnover in human diploid cell cultures. Exp. Cell Res. 73, 399–409.
Middelkoop, E., Wiemer, E. A., Schoenmaker, D. E., Strijland, A., and Tager, J. M. (1993). Topology of catalase assembly in human skin fibroblasts. Biochim. Biophys. Acta 1220, 15–20.
Muller, M. (2009). Cellular senescence: molecular mechanisms, in vivo significance, and redox considerations. Antioxid. Redox Signal. 11, 59–98.
Navarro, A. (2004). Mitochondrial enzyme activities as biochemical markers of aging. Mol. Aspects Med. 25, 37–48.
Navarro, A., and Boveris, A. (2007). The mitochondrial energy transduction system and the aging process. Am. J. Physiol. Cell Physiol. 292, C670–C686.
Périchon, R., Bourre, J. M., Kelly, J. F., and Roth, G. S. (1998). The role of peroxisomes in aging. Cell. Mol. Life Sci. 54, 641–652.
Reznick, A. Z., and Packer, L. (1994). Oxidative damage to protein: spectrophotometric method for carbonyl assay. Meth. Enzymol. 233, 357–363.
Schrader, M., and Fahimi, H. D. (2006). Peroxisomes and oxidative stress. Biochim. Biophys. Acta 1763, 1755–1766.
Schrader, M., and Yoon, Y. (2007). Mitochondria and peroxisomes: are the big brother and the little sister closer than assumed? Bioessays 29, 1105–1114.
Schriner, S. E., Linford, N. J., Martin, G. M., Treuting, P., Ogburn, C. E., Emond, M., Coskun, P. E., Ladiges, W., Wolf, N., Van Remmen, H., Wallace, D. C., and Rabinovitch, P. S. (2005). Extension of murine life span by overexpression of catalase targeted to mitochondria. Science 308, 1909–1911.
Sheikh, F. G., Pahan, K., Khan, M., Barbosa, E., and Singh, I. (1998). Abnormality in catalase import into peroxisomes leads to severe neurological disorder. Proc. Natl. Acad. Sci. U.S.A. 95, 2961–2966.
Shinitzky, M. (1987). Patterns of lipid changes in membranes of the aged brain. Gerontology 33, 149–154.
Storrie, B., and Madden, E. A. (1990). Isolation of subcellular organelles. Meth. Enzymol. 182, 203–225.
Terlecky, S. R., Koepke, J. I., and Walton, P. A. (2006). Peroxisomes and aging. Biochim. Biophys. Acta 1763, 1749–1754.
Titorenko, V. I., and Terlecky, S. R. (2011). Peroxisome metabolism and cellular aging. Traffic 12, 252–259.
Van Veldhoven, P. P. (2010). Biochemistry and genetics of inherited disorders of peroxisomal fatty acid metabolism. J. Lipid Res. 51, 2863–2895.
Keywords: peroxisome, subcellular organelle, catalase, mitochondria, hydrogen peroxide, redox, aging, senescence
Citation: Walton PA and Pizzitelli M (2012) Effects of peroxisomal catalase inhibition on mitochondrial function. Front. Physio. 3:108. doi: 10.3389/fphys.2012.00108
Received: 15 February 2012; Paper pending published: 26 March 2012;
Accepted: 03 April 2012; Published online: 23 April 2012.
Edited by:
Vladimir Titorenko, Concordia University, CanadaReviewed by:
Christopher Baines, University of Missouri-Columbia, USAGregory A. Graf, University of Kentucky, USA
Copyright: © 2012 Walton and Pizzitelli. This is an open-access article distributed under the terms of the Creative Commons Attribution Non Commercial License, which permits non-commercial use, distribution, and reproduction in other forums, provided the original authors and source are credited.
*Correspondence: Paul A. Walton, Department of Anatomy and Cell Biology, University of Western Ontario, Dental Science Building, Room 00077, London, ON, Canada N6A 5C1. e-mail: pwalton@uwo.ca