 Fatemeh Momen-Heravi1† Leonora Balaj2,3† Sara Alian4 Alexander J. Trachtenberg1 Fred H. Hochberg2 Johan Skog5 Winston Patrick Kuo1,6*
- 1 Harvard Catalyst Laboratory for Innovative Translational Technologies, Harvard Medical School, Boston, MA, USA
- 2 Department of Neurology and Radiology, Massachusetts General Hospital, Boston, MA, USA
- 3 Neuro-Oncology Research Group, Cancer Center Amsterdam, Amsterdam, Netherlands
- 4 Biopolymers Facility, Harvard Medical School, Boston, MA, USA
- 5 Exosome Diagnostics Inc, New York, NY, USA
- 6 Department of Developmental Biology, Harvard School of Dental Medicine, Boston, MA, USA
Microvesicles are nano-sized lipid vesicles released by all cells in vivo and in vitro. They are released physiologically under normal conditions but their rate of release is higher under pathological conditions such as tumors. Once released they end up in the systemic circulation and have been found and characterized in all biofluids such as plasma, serum, cerebrospinal fluid, breast milk, ascites, and urine. Microvesicles represent the status of the donor cell they are released from and they are currently under intense investigation as a potential source for disease biomarkers. Currently, the “gold standard” for isolating microvesicles is ultracentrifugation, although alternative techniques such as affinity purification have been explored. Viscosity is the resistance of a fluid to a deforming force by either shear or tensile stress. The different chemical and molecular compositions of biofluids have an effect on its viscosity and this could affect movements of the particles inside the fluid. In this manuscript we addressed the issue of whether viscosity has an effect on sedimentation efficiency of microvesicles using ultracentrifugation. We used different biofluids and spiked them with polystyrene beads and assessed their recovery using the Nanoparticle Tracking Analysis. We demonstrate that MVs recovery inversely correlates with viscosity and as a result, sample dilutions should be considered prior to ultracentrifugation when processing any biofluids.
Introduction
Exosomes are nano-sized vesicles (MVs; 30–100 nm) of endosomal origin produced by different parental cells (Keller et al., 2006; Skog et al., 2008; Muralidharan-Chari et al., 2010). Nanoparticles formed through membrane budding are also called microvesicles and their corresponding process of formation is called microvesiculation (Muralidharan-Chari et al., 2010). Their sizes differ from 30 nm in diameter and have been reported up to 5 μm, the former including the more homogenous population of exosomes released from multivesicular bodies (MVBs) and the latter shedding from the plasma membrane which are commonly referred to as MVs (Di Vizio et al., 2009; Théry et al., 2009). In this article, we will refer to all types of shed vesicles under the common term of microvesicles (MVs).
Microvesicles have been extensively studied in serum and culture media from a variety of tumors (Balaj et al., 2011; Koumangoye et al., 2011); a great body of evidence shows that they can be secreted into the extracellular space and are involved in intercellular communication by transferring functional proteins and RNA molecules between cells (Skog et al., 2008; Grange et al., 2011; Yang et al., 2011). MVs are also known to carry antigens from microorganisms like viruses and bacteria and can be potential biomarkers for a variety of diseases (Jayachandran et al., 2011; Raymond et al., 2011). MVs are found in different biofluids such as plasma (Ashcroft et al., 2012), serum (Dalton, 1975), cultured media (CM; Bastida et al., 1984), saliva (Keller et al., 2011), breast milk (Hata et al., 2010), amniotic fluid (Keller et al., 2011), and urine (Wiggins et al., 1987).
A variety of methods have been utilized to isolate microvesicles including sucrose gradient, ultracentrifugation, Exoquick™, microfiltration, and immune affinity capture method (Taylor et al., 2011; Tauro et al., 2012). A standardized method for isolation and assessment of MVs from various body fluids and culture media has not yet been established and hinders reproducible studies for downstream analysis of isolated MVs (Yuana et al., 2011). Ultracentrifugation is considered the “gold standard” for harvesting microvesicles, though inconsistencies have been reported in reproducibility and repeatability of the data. Ultracentrifugation protocols vary across users and this leads to inconsistencies in recovery of MVs (Sustar et al., 2011; Taylor et al., 2011; Tauro et al., 2012).
Viscosity of a fluid is the resistance of a fluid that is being deformed by either shear or tensile stress. Due to different chemical and/or molecular compositions, the makeup of different biofluids will result in their varying viscosities. This manuscript explores the recovery of MVs derived from different biofluids (serum, plasma, and culture media) with different viscosities, using ultracentrifugation. To the best of our knowledge, this is the first study to assess this parameter.
Materials and Methods
Samples and Preliminary Sample Preparation
In this study we used biobanked plasma and serum as well as CM from HEK-293T cells. Whole blood samples were obtained from healthy volunteers upon approved IRB protocols at Massachusetts General Hospital and Harvard Medical School. Serum samples were collected in 10 ml tiger top tubes (BD vacutainer), allowed to coagulate at room temperature for 30 min and spun at 1,300 × g for 10 min to separate serum from coagulated blood. The serum was then filtered through a 0.8-μm filter, aliquoted into 2 ml cryovials, and stored at −80°C. Plasma was collected into EDTA-containing tubes (BD vacutainer), spun at 1,500 × g for 10 min to separate plasma from the buffy coat. Plasma was then transferred to a clean tube and filtered through a 0.8-μm filter and stored at −80°C until further processing. Culture media was collected from HEK-293T cells, cultured for 48 h in MV-depleted media, and spun at 300 × g for 10 min. The supernatant was transferred to a clean tube and spun at 2,000 × g for 15 min, filtered through a 0.8-μm filter and stored at −80°C. As controls, polystyrene beads (Thermo Scientific, Fremont, USA) with the specific diameter of 100 nm were used to make control samples (plasma + beads, serum + beads, CM + beads, PBS + beads). Two microliters of serum, plasma, CM, and PBS were spiked with a total of 7.22 × 10¹⁰ polystyrene beads without any pretreatment and used for ultracentrifugation. A total of seven samples which included three samples and four controls were used in this study. We use the term MVs for the plasma, CM, and serum without beads and microparticles (MPs) as a term for mixture of MVs of each biofluid plus synthetic added beads.
Ultracentrifugation
At the time of analysis 2 ml of serum, plasma, CM, serum + beads, plasma + beads, and PBS + beads were thawed at room temperature for ultracentrifugation. We defined “pre-ultracentrifugation” (pre-UC) as aliquots of each sample prior ultracentrifugation, obtained after vortexing and used for quantity measurement of MVs/MPs. All samples were ultracentrifuged at 100,000 × g for 90 min in a Optima Max-XP, fixed angle MLA-55 rotor (k factor = 116; Beckman Coulter, Miami, FL, USA), at 4°C. After ultracentrifugation, pellets of samples were collected, and re-suspended in 50 μl PBS and now considered as “post-ultracentrifugation” (post-UC) aliquots of each sample post-ultracentrifugation, used for quantity measurement of MVs/MPs.
NanoSight
Concentration and size analysis of MVs/MPs
The concentration of MVs/MPs for pre-UC samples and post-UC was identified by measuring the rate of Brownian motion using the NanoSight LM10 system (NanoSight, Amesbury, UK) supplemented with a fast video capture and Nanoparticle Tracking Analysis (NTA) software. The instrument was calibrated based on NanoSights’s protocol. The samples were measured for 30 s with manual shutter and gain adjustments. Measurements were made for each sample in triplicate after re-calibration of instrument as suggested by NanoSight. NTA was used to measure particle size (measured in nanometers); Pre-UC, Post-UC, and supernatant samples were measured at room temperature in triplicate after calibration of the instrument based on the manufacturer’s protocol. Each measurement repeated for three times.
Viscometer
Relative viscosities of pre-UC samples (serum, plasma, CM, and PBS) were measured using an Ostwald-type viscometer (Cannon Instrument Co., State College, PA, USA) at constant temperature as described by Fahey et al. (1965), based on time of flow through a volumetric capillary. The viscosity of each liquid (η1) was determined using the following equation:
where, ρ1 = density of unknown liquid, ρ2 = density of other liquids (water), t1 = time of the other liquids, t2 = time of the known liquid, η2 = viscosity of known liquid. We used the American Society for Testing and Materials (ASTM) standards for measuring dynamic viscosity, centipoise (cP).
Statistical analysis
Three measurements (concentration, size, and diffusion coefficient) per sample were generated from the NanoSight instrument for pre-UC and post-UC. Data was averaged and the standard deviation was calculated. The sedimentation efficiency is defined as the difference between initial MVs’/MPs’ amount and resulting pellet amount of microvesicles. The sedimentation efficiency of MVs/MPs in the samples was analyzed by one-way ANOVA (Post hoc Tukey). Only the data with normal distribution (assessed by the Kolmogorov–Smirnov test) were used. A value of p < 0.05 was considered significant. Statistical analyses were performed by using SPSS 15.0 (SPSS Inc., Chicago, USA). The error bars displayed on the NTA graphs were obtained by the standard deviation of the different measurements of each sample. All data is represented as mean ± standard deviation (SD).
Results
Higher Viscosity Results in Lower Sedimentation Efficiency
Table 1 summarizes the mean and standard deviation of pre-UC concentration, post-UC concentration, and sedimentation efficiency for each experimental sample. We noticed a significant difference between sedimentation efficiency of plasma, serum and culture media (p < 0.001). The viscosity of the plasma, serum, CM, and PBS were 1.65, 1.4, 1.1, and 1.0 cP, respectively. The Pearson correlation was −0.912 (p < 0.001), indicating that a greater viscosity leads to lower sedimentation efficiency. The sedimentation efficiency of plasma with 1.65 cP viscosity was lower because of higher viscosity in comparison to serum (1.4 cP), but the difference was not statistically significant (p > 0.05). Figure 1, illustrates the comparison of pre-UC MVs/MPs with post-UC concentration. It shows that in spite of lower initial concentration of pre-UC MVs, the sedimentation efficiency was higher in CM when comparing MVs’ quantities pre-UC with post-UC. Also depicted in Figure 1, due to differences in viscosity of plasma and serum when compared to CM, the differences between pre-UC and post-UC was higher in CM when compared to MV quantities (p < 0.05). This trend is also seen in plasma + beads and serum + beads versus media + beads (p < 0.05), because of plasma and serum’s greater viscosity. There were no significant differences between sedimentation efficiency of PBS + beads and culture media + beads pre-UC and post-UC. As presented by Table 1, the less viscous fluids (PBS and CM) have higher sedimentation efficiency.
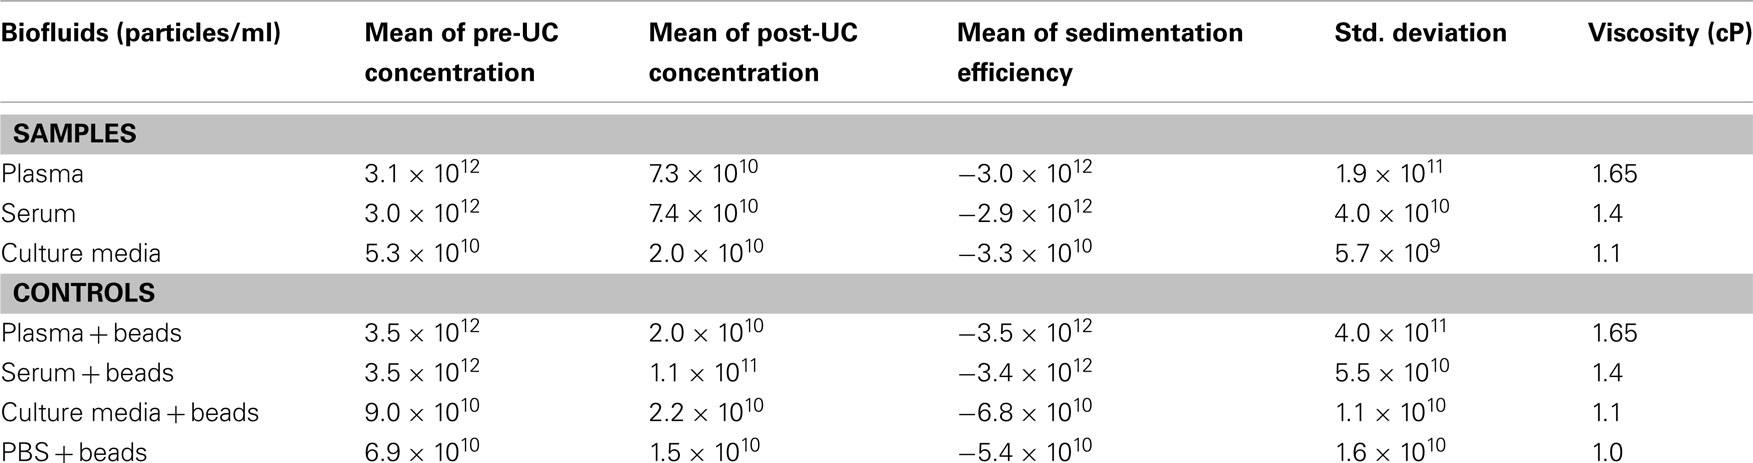
Table 1. Evaluation of microvesicles/microparticles concentration (particles/ml) and viscosity before and after ultracentrifugation.
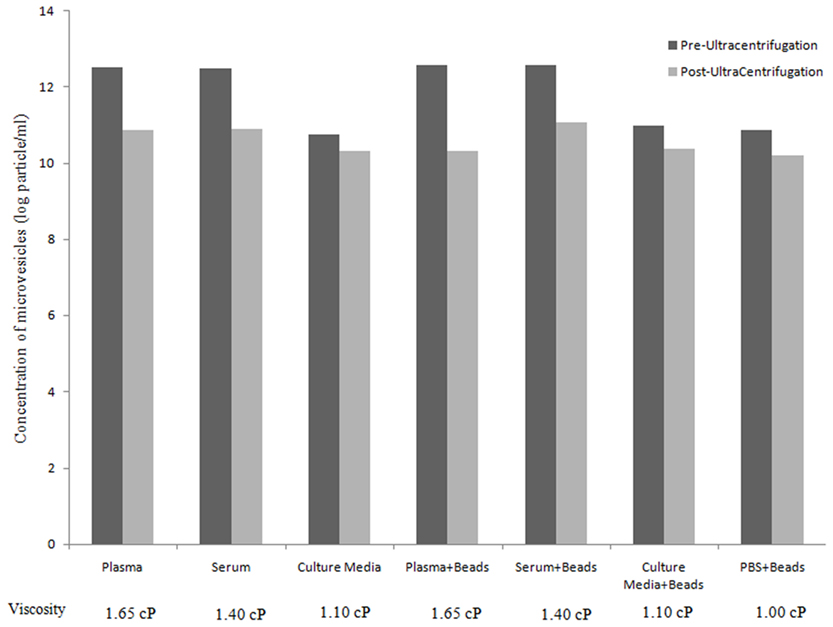
Figure 1. Assessment of microvesicles/microparticles concentration (particles/ml) before and after ultracentrifugation. Bar graph represent the concentration (particles/ml) of MVs/MPs pre-UC (black) and post-UC (gray; Y axis) for different tested samples and controls (X axis) along with viscosity of each fluid (cP).
Size Distribution of pre-UC, post-UC, and Supernatant
As shown in Table 2, the mean size ± SD (nm) of the MVs/MPs in both plasma and serum were found to be significantly larger in Post-UC (plasma = 134.3 ± 11.2 nm; serum = 131.3 ± 2.9 nm) compared to Pre-UC (plasma = 84.0 ± 2.6 nm; serum = 102.0 ± 6.0 nm; p < 0.05). Difference between the size of MVs in CM pre-UC (mean ± SD of 107.0 ± 7.0 nm) and post-UC (mean ± SD of 118.0 ± 7.9 nm) were insignificant. Additionally, MVs in the supernatant of plasma and serum samples were smaller in diameter when compared to same MVs post-UC (mean ± SD of supernatant: plasma = 93.7 ± 8.9 nm, serum = 100.3 ± 2.1 nm; mean ± SD of Post-UC samples: plasma = 134.3 ± 11.2 nm; serum = 131.3 ± 2.9 nm; Table 2). Also, PBS + beads showed a significant decrease in average size of MPs post-UC (mean ± SD of pre-UC = 160.0 ± 13.0 versus mean ± SD of post-UC = 115.7 ± 7.4; p < 0.05). Figure 2 shows the NanoSight distribution of MVs for plasma pre-UC and post-UC.
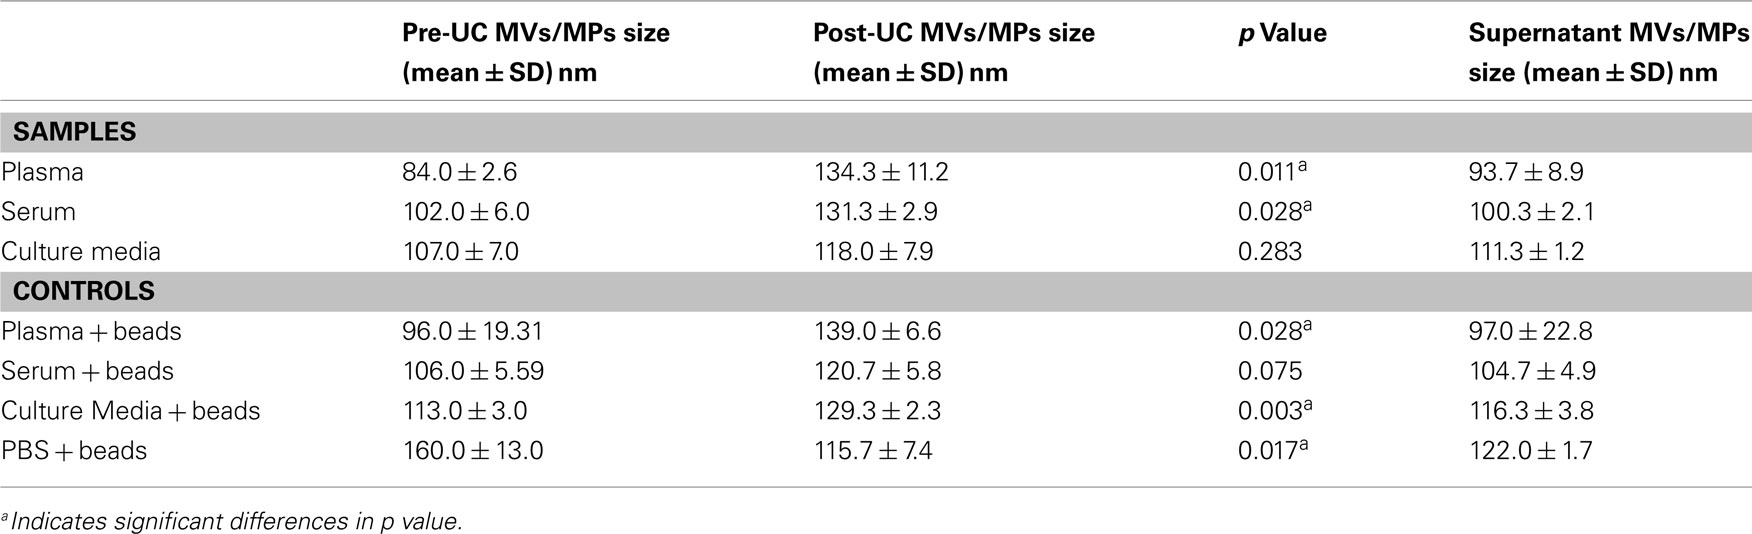
Table 2. Evaluation of microvesicles/microparticles size pre-UC and post-UC.
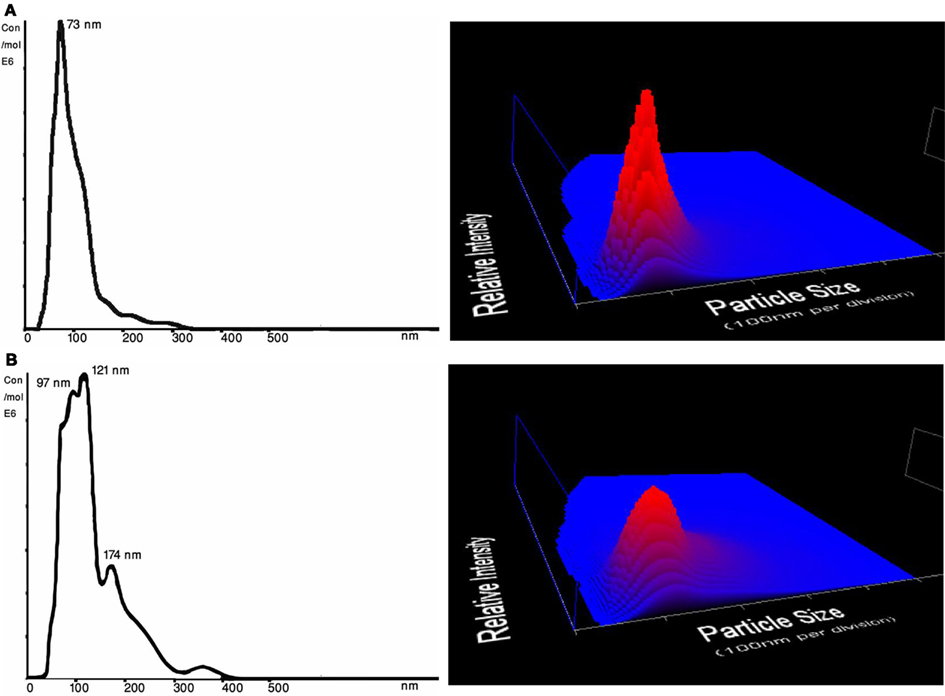
Figure 2. Size distribution (nm) and concentration (particles/ml) from NTA measurements of a representative plasma samples. Three dimensional graph illustrating size versus intensity (relative frequency of each size range among the entire population of MVs) versus concentration (particles/ml) of microvesicles from plasma. (A) Plasma MVs Pre-UC – Average size of plasma MVs were 73 nm before ultracentrifugation; 3D graph representing particle size versus intensity versus concentration (particles/ml) of microvesicles before ultracentrifugation (B) Plasma MVs Post-UC – Average size of plasma MVs were 137 nm after ultracentrifugation; 3D graph representing particle size versus intensity versus concentration (particles/ml) of microvesicles before ultracentrifugation.
Discussion
Microvesicles are emerging as a source of potential biomarkers with putative prognostic and diagnostic value. One of the interests in the field is to use MVs in a format that could detect initial stages of disease, and accurately predict risk assessment and patient response to therapy. In this study we have examined how viscosity affects sedimentation of MVs using ultracentrifugation. A fluid is termed viscous when the internal frictions are high and as a result, it takes a great deal of energy for particles to initiate and sustain their motion. Viscosity increases with decreasing temperature and most ultracentrifugation steps are carried at +4°C, the highest water density, which suggests that viscosity is at its highest. Viscosity also increases with pressure. Hydrostatic pressure increases up to 200 bar/min in a sample spun at 50,000 rpm (Wattiaux et al., 1971) and this should be taken into account when spinning/comparing different biofluids, assuming all other conditions are kept equal. Here we used a viscometer to determine the “fluid’s resistance to flow” which is defined as viscosity. The strain rates are defined by the geometry of the instrument and the corresponding stresses are defined by the fluid’s resistance to flow. When one variable is fixed and known, the other force will depend on the viscosity of the fluid. Our results demonstrated that ultracentrifugation of MVs is greatly affected by the viscosity of the biofluid used. Plasma had the highest viscosity (1.65 cP), followed by serum (1.4 cP), culture media (1.1 cP), and lastly PBS (1.0 cP). The viscosity of serum and plasma were concordant with Tangney et al. (1997).
We found that viscosity has a significant correlation with the recovery of MVs/MPs. Because plasma has more proteins, e.g., fibrinogen and other clotting factors, the internal frictions are high and as a result, it requires more energy for particles to move (Tangney et al., 1997). The same extrapolation may be attributed to serum because, although it lacks clotting factors, it has other proteins that increase its internal friction when compared with less viscous fluids like culture media and PBS. The sedimentation efficiency of plasma was lower because of higher viscosity in comparison to serum and culture media. Culture media had a viscosity very close to that of PBS and a higher number of MVs were pelleted in culture media. These results were confirmed when the samples were spiked with 100 nm polystyrene beads. The data suggests that viscosity is an important parameter to consider when working with a biofluid where a lower viscous fluid yields more MVs in the pellet, and that comparison of different biofluids should be avoided unless samples have been diluted to reach similar viscosity values.
Additionally, the result of this study showed that the average size of the MVs increased significantly after ultracentrifugation in plasma and serum (p < 0.05); while average size of culture media derived MVs increased insignificantly. The average size of pelleted beads derived from PBS + beads, the less viscous fluid, decreased significantly (p < 0.05). This finding contradicts the belief that plasma/serum has MVs that are larger in size in comparison with cell lines. It may indicate that longer ultracentrifugation time is needed because of viscosity, providing the capability of extracting smaller particles from plasma and serum. Another factor that should be taken into account is sedimentation stability (streaming) which affects both accuracy and resolution. Streaming, a factor that is related to Brownian motion of small particles, causes the reported size distribution to be larger than actual size distribution (Scott et al., 2005). MVs derived from plasma and serum had smaller sizes that reflect more Brownian motion during sedimentation, which could lead to reduced resolution and sedimentation efficiency. Another factor that could lead to greater MVs’ diameter is lipoprotein fusion; Ala-Korpela et al. (1998) assessed particle fusion based on fluorescent resonance energy transfer and showed that lipoprotein particle fusion could occur after sequential ultracentrifugation.
The following formula considers the centrifugal force, buoyancy, and Stokes law which governs the sedimentation velocity of a spherical particle:
Where Δρ is the difference in densities of the microparticles and the medium, d is the effectual diameter of the MVs, a is the acceleration of the centrifugal force generated in the centrifuge rotor, and η is the viscosity of the medium (Sustar et al., 2011). Based on this formula, along with the effect of ultracentrifugation force and density of MVs, larger particles would sediment more effectively in the same conditions. Also, according to Scott et al. (2005), materials with higher densities (for example higher concentration of MVs) have additional instability after sedimentation, which cause pelletted MVs to detach and return into supernatant. This could be a reason for lower efficiency and smaller average size of MVs/MPS observed in plasma and serum (Scott et al., 2005; Sustar et al., 2011). According to the formula, there are many other factors that could affect sedimentation efficacy such as difference between density of MVs and fluid, centrifugal force (g), temperature, type of rotor (fixed angle versus swing out) and time; further studies are required to assess each factor along with their synergism to improve efficacy of ultracentrifugation protocol. As mentioned above, another factor that should be taken into account is the great likelihood of MVs/MPs fusion, based on natural stickiness of MVs/MPs, which could be influenced by their different derived media and its buffer characteristics such as salt concentration, and ionic contents (Balaj et al., 2011; Jayachandran et al., 2012). Follow-up studies exploring the differences in MVs concentration and size over a range of RCFs (e.g., 100K, 150K, 200K × g), various ultracentrifugation time spans, and different rotors and subsequently different k factors, investigating the stability of vesicles isolated at those conditions could be of great importance.
In conclusion, by comparing concentration and size of MVs in different biofluids, we determined that viscosity of biofluids could significantly affect sedimentation efficiency. Also, this study revealed that the size of MVs in more viscous biofluids significantly increase after ultracentrifugation. Considering MVs and their extensive diagnostic and therapeutic potential, more systematic research studies regarding the standardization of isolation protocols and identification of effective factors for sedimentation efficiency are necessary.
Conflict of Interest Statement
The authors declare that the research was conducted in the absence of any commercial or financial relationships that could be construed as a potential conflict of interest.
Acknowledgments
We thank Xandra Breakefield for helpful discussions. This work was conducted, at least in part, through the Harvard Catalyst Laboratory for Innovative Translational Technologies (HC-LITT) with support from Harvard Catalyst/The Harvard Clinical and Translational Science Center (NIH Award #UL1 RR 025758 and financial contributions from Harvard University and its affiliated academic health care centers). The content is solely the responsibility of the authors and does not necessarily represent the official views of Harvard Catalyst, Harvard University and its affiliated academic health care centers, the National Center for Research Resources, or the National Institutes of Health.
References
Ala-Korpela, M., Pentikäinen, M. O., Korhonen, A., Hevonoja, T., Lounila, J., and Kovanen, P. T. (1998). Detection of low density lipoprotein particle fusion by proton nuclear magnetic resonance spectroscopy. J. Lipid Res. 39, 1705–1712.
Ashcroft, B. A., de Sonneville, J., Yuana, Y., Osanto, S., Bertina, R., Kuil, M. E., and Oosterkamp, T. H. (2012). Determination of the size distribution of blood microparticles directly in plasma using atomic force microscopy and microfluidics. Biomed. Microdevices. doi:10.1007/s10544-012-9642-y. [Epub ahead of print].
Balaj, L., Lessard, R., Dai, L., Cho, Y. J., Pomeroy, S. L., Breakefield, X. O., and Skog, J. (2011). Tumour microvesicles contain retrotransposon elements and amplified oncogene sequences. Nat. Commun. 2, 180.
Bastida, E., Ordinas, A., Escolar, G., and Jamieson, G. A. (1984). Tissue factor in microvesicles shed from U87MG human glioblastoma cells induces coagulation, platelet aggregation, and thrombogenesis. Blood 64, 177–184.
Dalton, A. J. (1975). Microvesicles and vesicles of multivesicular bodies versus “virus-like” particles. J. Natl. Cancer Inst. 54, 1137–1148.
Di Vizio, D., Kim, J., Hager, M. H., Morello, M., Yang, W., Lafargue, C. J., True, L. D., Rubin, M. A., Adam, R. M., Beroukhim, R., Demichelis, F., and Freeman, M. R. (2009). Oncosome formation in prostate cancer: association with a region of frequent chromosomal deletion in metastatic disease. Cancer Res. 69, 5601–5609.
Fahey, J. L., Barth, W. F., and Solomon, A. (1965). Serum hyperviscosity syndrome. JAMA 192, 464–467.
Grange, C., Tapparo, M., Collino, F., Vitillo, L., Damasco, C., Deregibus, M. C., Tetta, C., Bussolati, B., and Camussi, G. (2011). Microvesicles released from human renal cancer stem cells stimulate angiogenesis and formation of lung premetastatic niche. Cancer Res. 71, 5346–5356.
Hata, T., Murakami, K., Nakatani, H., Yamamoto, Y., Matsuda, T., and Aoki, N. (2010). Isolation of bovine milk-derived microvesicles carrying mRNAs and microRNAs. Biochem. Biophys. Res. Commun. 396, 528–533.
Jayachandran, M., Litwiller, R. D., Lahr, B. D., Bailey, K. R., Owen, W. G., Mulvagh, S. L., Heit, J. A., Hodis, H. N., Harman, S. M., and Miller, V. M. (2011). Alterations in platelet function and cell-derived microvesicles in recently menopausal women: relationship to metabolic syndrome and atherogenic risk. J. Cardiovasc. Transl. Res. 4, 811–822.
Jayachandran, M., Miller, V. M., Heit, J. A., and Owen, W. G. (2012). Methodology for isolation, identification and characterization of microvesicles in peripheral blood. J. Immunol. Methods 375, 207–214.
Keller, S., Ridinger, J., Rupp, A. K., Janssen, J. W., and Altevogt, P. (2011). Body fluid derived exosomes as a novel template for clinical diagnostics. J. Transl. Med. 9, 86.
Keller, S., Sanderson, M. P., Stoeck, A., and Altevogt, P. (2006). Exosomes: from biogenesis and secretion to biological function. Immunol. Lett. 107, 102–108.
Koumangoye, R. B., Sakwe, A. M., Goodwin, J. S., Patel, T., and Ochieng, J. (2011). Detachment of breast tumor cells induces rapid secretion of exosomes which subsequently mediate cellular adhesion and spreading. PLoS ONE 6, e24234. doi:10.1371/journal.pone.0024234
Muralidharan-Chari, V., Clancy, J. W., Sedgewick, A., and D’Souza-Schorey, C. (2010). Microvesicles: mediators of extracellular communication during cancer progression. J. Cell Sci. 123, 1603–1611.
Raymond, A. D., Campbell-Sims, T. C., Khan, M., Lang, M., Huang, M. B., Bond, V. C., and Powell, M. D. (2011). HIV Type 1 Nef is released from infected cells in CD45(+) microvesicles and is present in the plasma of HIV-infected individuals. AIDS Res. Hum. Retroviruses 27, 167–178.
Scott, D. J., Harding, E., and Rowe, A. J. (2005). Analytical Ultracentrifugation: Techniques and Methods. Cambridge: The Royal Society of Chemistry, 273–276.
Skog, J., Wurdinger, T., van Rijn, S., Meijer, D. H., Gainche, L., Sena-Esteves, M., Curry, W. T. Jr., Carter, B. S., Krichevsky, A. M., and Breakefield, X. O. (2008). Glioblastoma microvesicles transport RNA and proteins that promote tumour growth and provide diagnostic biomarkers. Nat. Cell Biol. 10, 1470–1476.
Sustar, V., Bedina-Zavec, A., Stukelj, R., Frank, M., Bobojevic, G., Jansa, R., Ogorevc, E., Kruljc, P., Mam, K., Simunic, B., Mancek-Keber, M., Jerala, R., Rozman, B., Veranic, P., Hagerstrand, H., and Kralj-Iglic, V. (2011). Nanoparticles isolated from blood: a reflection of vesiculability of blood cells during the isolation process. Int. J. Nanomedicine 6, 2737–2748.
Tangney, C. C., Hafner, J. M., McQuiston, B. D., Domas, A. J., and Rosenson, R. S. (1997). Postprandial changes in plasma and serum viscosity and plasma lipids and lipoproteins after an acute test meal. Am. J. Clin. Nutr. 65, 36–40.
Tauro, B. J., Greening, D. W., Ji, H., Mathivanan, S., Scott, A. M., and Simpson, R. J. (2012). Comparison of ultracentrifugation, density gradient separation, and immunoaffinity capture methods for isolating human colon cancer cell line LIM1863-derived exosomes. Methods 56, 293–304.
Taylor, D. D., Zacharias, W., and Gercel-Taylor, C. (2011). Exosome isolation for proteomic analyses and RNA profiling. Methods Mol. Biol. 728, 235–246.
Théry, C., Ostrowski, M., and Segura, E. (2009). Membrane vesicles as conveyors of immune responses. Nat. Rev. Immunol. 9, 581–593.
Wattiaux, R., Wattiaux-De Coninck, S., and Ronveaux-Dupal, M. F. (1971). Deterioration of rat-liver mitochondria during centrifugation in a sucrose gradient. Eur. J. Biochem. 22, 31–39.
Wiggins, R., Glatfelter, A., Kshirsagar, B., and Beals, T. (1987). Lipid microvesicles and their association with procoagulant activity in urine and glomeruli of rabbits with nephrotoxic nephritis. Lab. Invest. 56, 264–272.
Yang, M., Chen, J., Su, F., Yu, B., Su, F., Lin, L., Liu, Y., Huang, J. D., and Song, E. (2011). Microvesicles secreted by macrophages shuttle invasion-potentiating microRNAs into breast cancer cells. Mol. Cancer 10, 117.
Keywords: biofluids, viscosity, micovesicles, sedimentation efficiency, size, ultracentrifugation
Citation: Momen-Heravi F, Balaj L, Alian S, Trachtenberg AJ, Hochberg FH, Skog J and Kuo WP (2012) Impact of biofluid viscosity on size and sedimentation efficiency of the isolated microvesicles. Front. Physio. 3:162. doi: 10.3389/fphys.2012.00162
Received: 04 April 2012; Paper pending published: 26 April 2012;
Accepted: 07 May 2012; Published online: 29 May 2012.
Edited by:
Claudia Verderio, CNR Institute of Neuroscience, ItalyReviewed by:
Michael Graner, University of Colorado Denver, USAAntonio Chiesi, HansaBioMed OU, Italy
Copyright: © 2012 Momen-Heravi, Balaj, Alian, Trachtenberg, Hochberg, Skog and Kuo. This is an open-access article distributed under the terms of the Creative Commons Attribution Non Commercial License, which permits non-commercial use, distribution, and reproduction in other forums, provided the original authors and source are credited.
*Correspondence: Winston Patrick Kuo, Harvard Catalyst Laboratory for Innovative Translational Technologies, Harvard Medical School, 4 Blackfan Circle, Room 144, Boston, 02115 MA, USA. e-mail: wkuo@catalyst.harvard.edu
†Fatemeh Momen-Heravi and Leonora Balaj have contributed equally to this work.