
- Center for Biomedical Engineering, University of Kentucky, Lexington, KY, USA
Background: Alternans of early phase and of duration of action potential (AP) critically affect dispersion of refractoriness through their influence on conduction and repolarization. We investigated the phase relationship between the two alternans and its effect on conduction. Methods and Results: Transmembrane potentials recorded from ventricles of eight swine and three canines during paced activation intervals of ≤300 ms were used to quantify alternans of maximum rate of depolarization (|dv/dt|max) and of action potential duration (APD). Incidence of APD alternans was 62 and 76% in swine and canines. Alternans of APD was frequently accompanied with alternans of |dv/dt|max. Of these, 4 and 26% were out of phase in swine and canines, i.e., low |dv/dt|max preceded long APD. Computer simulations show that out of phase alternans attenuate variation of wavelength and thus minimize formation of spatially discordant alternans. Conclusion: The spontaneous switching of phase relationship between alternans of depolarization and repolarization suggests that mechanisms underlying these alternans may operate independent of each other. The phase between these alternans can critically impact spatial dispersion of refractoriness and thus stability of conduction, with the in phase relation promoting transition from concord to discord while out of phase preventing formation of discord.
Introduction
Beat-to-beat variation in action potential (AP) morphology is termed as alternans. Several studies suggest that alternans of repolarization, i.e., of action potential duration (APD), play an important role in mechanisms of ventricular fibrillation (VF; Koller et al., 1998; Fox et al., 2002; Banville et al., 2004). Spatial discord in alternans of APD is particularly conducive to initiation of arrhythmia (Qu et al., 2000), presumably, because of the increase in dispersion of repolarization. Transition of concord (where the alternating pattern is same everywhere) to discord is partly influenced by conduction (de Diego et al., 2008; Mironov et al., 2008). More recently, supernormal conduction (SNC), i.e., where a wave with shorter wavelength has faster velocity, has been shown to promote concordant alternans (de Diego et al., 2008; de Lange and Kucera, 2010). SNC is characterized by a negative slope of conduction velocity (CV) restitution, which is typically obtained using a S1S2 protocol. In addition to the cell to cell coupling, conduction is critically affected by maximum rate of depolarization (|dv/dt|max). Consequentially, there has been a renewed interest in alternans of the early phase of an AP, i.e., of depolarization (Karagueuzian et al., 1993; Lalani et al., 2008). Our objective in this study was to investigate the phase relationship between alternans of repolarization and of depolarization, and to determine how this phase relationship may affect formation of concord and discord. The ionic mechanisms governing early and later parts of an AP are distinct but interlinked. We hypothesized, therefore, that alternans in early and late parts of an AP, i.e., alternans of |dv/dt|max and of APD, although correlated most of the time, could operate independently. Further, because of the interplay between the speed of a conducted AP (CV) and recovery from previous activation, the phase relationship between the two will impact conduction of APs importantly. Our results show that while these two alternans are frequently correlated, the phase relationship between the two does change. Simulations show a mechanism by which the phase relationship between the two affects generation of spatial discord in repolarization. These results suggest that the phase relationship between alternans of early phase of AP and of APD plays an important role in stability of activation.
Materials and Methods
All animal studies were approved by the Institutional Animal Care and Use Committee (IACUC) at the University of Kentucky. Data were collected from eight farm pigs (18–21 kg) and three dogs. For swines, animals were anesthetized using a combination of telazol (4–8 mg/kg), ketamine (2–4 mg/kg), and xylazine (2–4 mg/kg), followed by thiopental sodium (Pentothal, 10–11 mg/kg, IV). After anesthesia, the hearts were rapidly excised and placed in cold Tyrode’s solution. A small piece of ventricular tissue, approximately 20 mm × 10 mm × 5 mm, was isolated and pinned in a plastic chamber and superfused with warmed (36 ± 1°C) Tyrode’s solution bubbled with a mixture of 95% O2 and 5% CO2. Composition of the Tyrode’s solution was (in mmol/L): 0.5 MgCl2, 0.9 NaH2PO4, 2.0 CaCl2, 137.0 NaCl, 4.0 KCl, and 5.5 glucose. To this solution, NaHCO3 was added until the pH was between 7.3 ± 0.05. Tissue samples were obtained from the mid to apical anterior-lateral region of right ventricular free wall. Transmembrane potentials (TMP) were recorded from the endocardial side. Samples were equilibrated for about 60 min while being paced at a cycle length (CL) of 500 ms using 3 ms wide biphasic stimuli with intensities three to four times the diastolic threshold. Glass microelectrodes, filled with 3 M KCl solution, were used to record TMP. Non-alternans related data collected from six swines have been reported previously (Jing et al., 2010). Data from only those trials where APs observed during the preceding 500 ms CL pacing did not display obvious signs of ischemia, i.e., were not of triangular shape, were used for further analyses. For canines, we analyzed data collected as a part of a previous study (Wu and Patwardhan, 2006). Details of the experimental protocol used for canines are provided elsewhere (Wu and Patwardhan, 2006), however, they were similar to that described above for the swine, i.e., TMPs were recorded using microelectrodes from endocardial side of superfused right ventricular tissues. Not all TMP recordings from canines that we analyzed for the present study were used in the results reported previously (Wu and Patwardhan, 2006).
The TMP were digitized using a commercial data acquisition system at a rate of 10,000 samples/s and were analyzed offline using custom developed code in Matlab (MathWorks, Natick, MA, USA). In two pigs, we collected data at 50,000 samples/s to verify that the computed |dv/dt|max values were not affected by sampling rates. In order to quantify frequency of incidence of alternans we analyzed data from trials where the average activation intervals (i.e., the sum of diastolic interval, DI, and preceding APD) were ≤300 ms. A trial, in this context, refers to one continuous recording of TMP from the beginning to the end of a pacing protocol. The pacing stimuli were delivered either with fixed CL, i.e., the activation intervals were constant, or with fixed DI, i.e., the DIs preceding each AP were held constant by using a feed-back based pacing protocol as described before (Wu and Patwardhan, 2006). Although for the purposes of the present study, control of DI was not germane, a difference between fixed CL and fixed DI is noteworthy: under fixed DI pacing, alternans of APD lead to alternans of CL; likewise, during fixed CL, alternans of APD lead to alternans of DIs.
All analyses were conducted offline: TMPs were lowpass filtered (cutoff 1000 Hz) and start of each AP was determined using the slope of lowpass filtered TMP as the instant at which the slope became positive. End of an AP was determined when the TMP repolarized to 90%. During analysis, these markings were identified by color coded symbols and were manually inspected for each AP. A change of alternating sign between successive differences in APD ≥4 ms for at least five consecutive beats was considered as occurrence of APD alternans. The threshold of 4 ms change is consistent with that used previously by others (Pruvot et al., 2004).
The |dv/dt|max was computed when APD alternans occurred. To minimize high frequency amplification during differentiation, we used a 10 point combined lowpass and differentiation filter implemented using the “smooth_diff.m” function in Matlab. Because of the “built-in” filtering, the smoothed differentiation was computed from non-lowpass filtered TMPs. Alternans of |dv/dt|max was considered out of phase with APD alternans if large |dv/dt|max was associated with short APD and in phase if large |dv/dt|max was associated with long APD.
We note that statistical analysis, i.e., estimating odds of an event happening by chance, of the results that we obtained was not necessary to meet the objectives of our study, which were to determine the frequency of occurrence of an event, e.g., out of phase relationship, and to determine what impact it may have on conduction of an impulse.
We simulated the effects of phase relationship on conduction in a linear strand of 1000 cells using the canine ventricular myocyte (CVM) mathematical model, developed by Fox et al. (2002), with parameters as given in reference (Hua and Gilmour, 2004) to simulate discordant alternans. Custom code developed in Fortran was used to implement the model. The simulated cells had a cell length of 200 μm and membrane capacitance of 1 μF/cm2. Cell to cell coupling was modeled using diffusion (diffusion coefficient = 0.0007 cm2/ms). No-flux boundary conditions were used on the ends.
The strand was paced at one end (cell 5) with a CL of 169 ms for 90 beats to obtain steady state. Each simulation was run for additional 90 beats following the steady state obtained as described above. Our objective was to determine the effects of the change in phase, therefore, to simulate phase change, we increased the sodium current INa for all cells based on an “one step ahead” prediction of APD for each cell. That is, a change in APD from two previous activations was used to predict whether the “about to begin” AP was going to have a long or short duration. The default relation between APD and |dv/dt|max at CL of 169 ms is in phase, therefore, no current change was applied to produce the in phase relationship. To simulate out of phase, we increased INa of the short AP by 80%. We chose this magnitude of change in INa because this change produced alternans of comparable magnitude at the paced cell (cell 5) between the in and out of phase trials. Traces of TMPs and of INa from different sites in the linear strand were analyzed to confirm that the imposed current change was as expected. From simulations, APD and |dv/dt|max were computed using the same approach as that used for experimental data.
In order to quantify the oscillation of wavelength, we used a threshold method to compute the wavelength as follows: the membrane potentials of all cells for 90 beats were stored in a 2-D matrix V(i, j), where i represents spatial distance (or cell number) and j represents time (ms). Threshold V0 was defined as the voltage at 90% repolarization. The potential matrix V was then converted to an index matrix I with ones [if an element V(i, j) ≥ V0] and zeros [if V(i, j) < V0], and the spatial derivative of index matrix I, i.e., matrix D was created. At any given time instance t, the wavefront anywhere was defined when D(i, t) = −1, and the wave end as D(i, t) = 1. Therefore, wavelength was computed as the distance (in number of cells) between the wavefront and wave end. Mean wavelength and coefficient of variation (COV), defined as standard deviation divided by mean wavelength, was computed for each wave and the average of these for all waves was used as an estimate of wavelength oscillation in a given simulation.
Results
Alternans of |dv/dt|max and APD in Canines
In 56 trials (n = 3), all with CL ≤300 ms, incidence of APD alternans was 76% and they were always accompanied with alternans of |dv/dt|max. Figure 1B shows an example of the relationship between |dv/dt|max and CL obtained using stepwise decreasing CL pacing. As CL decreased, |dv/dt|max also decreased. An example from a trial of the in phase relationship between |dv/dt|max and APD alternans is shown in Figure 2 (closed diamonds), and an example of out of phase relationship is shown by the open circles in Figure 2, i.e., long APD was associated with slower rate of depolarization and short APD was associated with faster rate of depolarization. The incidence of out of phase |dv/dt|max alternans was 26% with 74% in phase. The average amplitude of |dv/dt|max alternans was 10%. Figure 3 shows an example of a continuous 20 AP sequence of in phase (Figures 3A–C) and out of phase (Figures 3D–F) relationship between alternans of APD and |dv/dt|max. Both APD (Figures 3A,D) and |dv/dt|max (Figures 3B,E) traces show a beat-to-beat alternating pattern. The overlay of APD and |dv/dt|max (Figures 3C,F) clearly show that, during in phase, a change in APD is accompanied by change of |dv/dt|max in the same direction, while for out of phase, these two change in opposite directions for the same AP. We note that these are conducted APs in tissue and that the shapes of APs change remarkably at faster activation rates compared to what is seen during slower activation. As has also been previously reported by others (Omichi et al., 2000; Rubart et al., 2000; Huang et al., 2004, 2007), at faster activation rates (note the very short activation intervals in the figure), the upstroke velocity was decreased, the peak and the notch was blunted due to loss of Ito, the plateau phase nearly disappeared and the APs generally displayed a triangular-like shape. These changes in shapes of APs are an expected effect of faster activation rates.
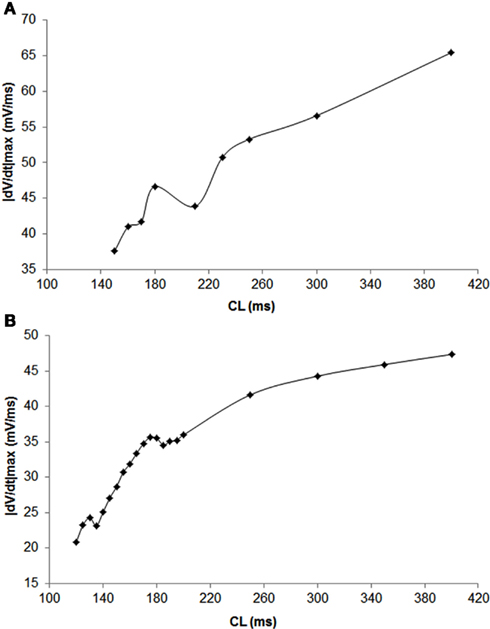
Figure 1. Dependence of |dv/dt|max on CL during a trial in swine (A) and canine (B) obtained using stepwise decreasing CL pacing.
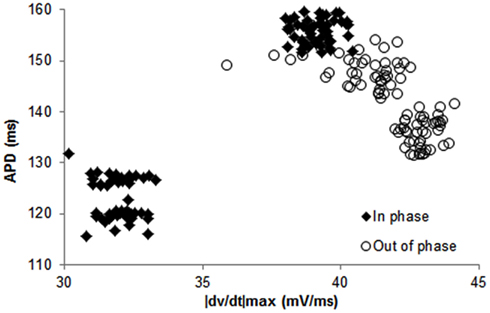
Figure 2. Examples of data from a trial in canines showing in phase (closed diamonds) and out of phase (open circles) relationship between APD and its preceding |dv/dt|max, i.e., APD and |dv/dt|max for the same beat. These data were obtained using constant CL pacing.
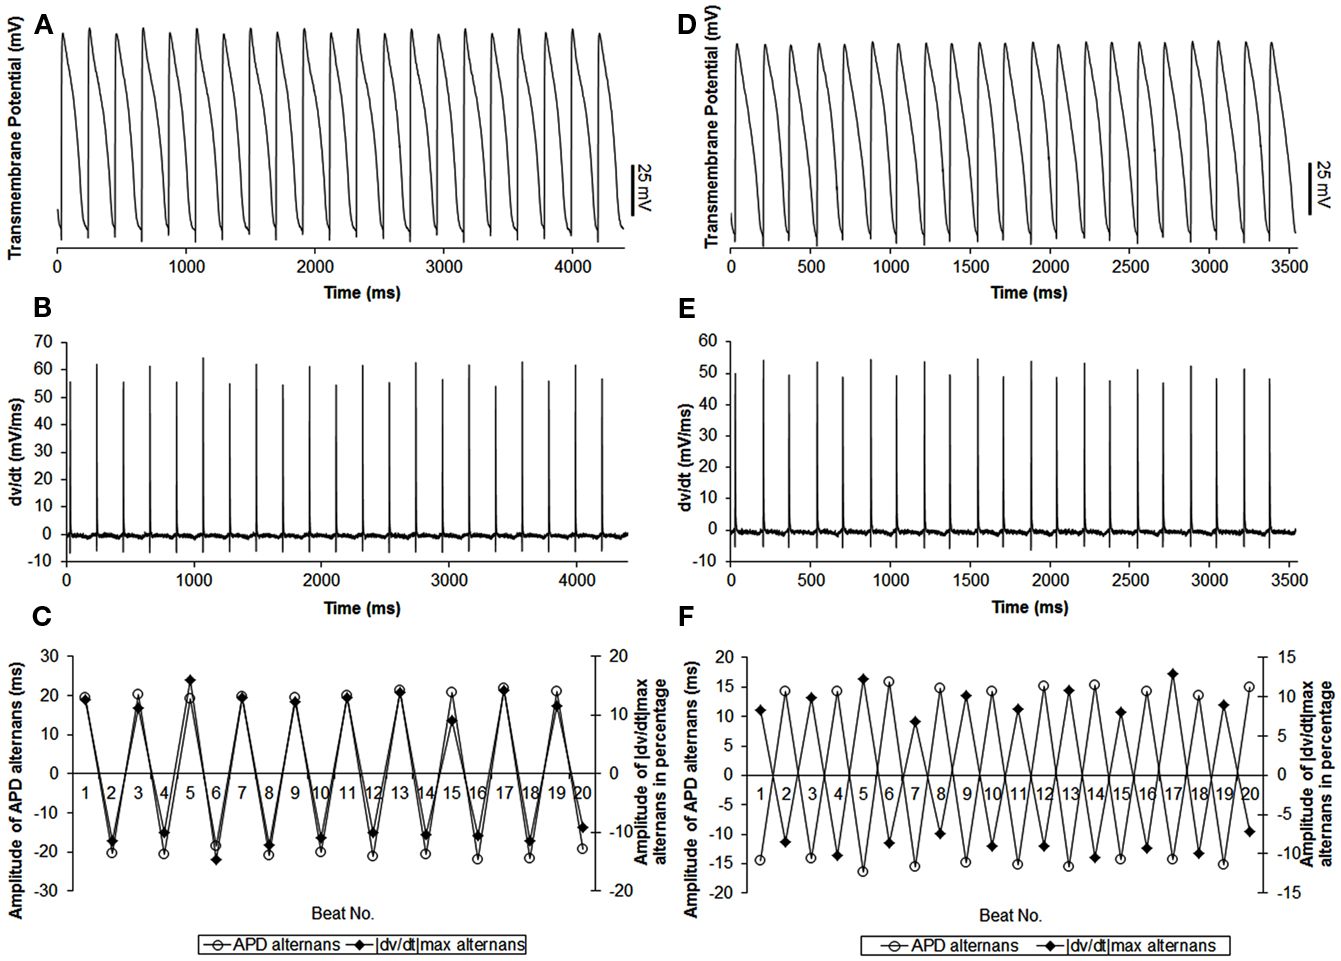
Figure 3. Example of continuous recordings, during constant CL pacing, showing in phase (A–C) and out of phase (D–F) relationship between APD and |dv/dt|max alternans in canines. Both APD (A,D) and |dv/dt|max(B,E) traces display beat-to-beat alternating patterns. (C,F) Show overlays of APD alternans (open circle) and alternans of |dv/dt|max (closed diamonds). In this example, average amplitudes of APD alternans were 20.4 ms for in phase (C) and 14.8 ms for out of phase (F). Average amplitudes of |dv/dt|max alternans were 11.9% (C) and 9.3% (F) respectively.
Alternans of |dv/dt|max and APD Alternans in the Swine
In 27 trials (n = 8), all with activation intervals ≤300 ms, we observed that the incidence of APD alternans was 62%. Alternans of |dv/dt|max occurred for all APs when APD alternans occurred. Figure 1A shows an example of the relationship between |dv/dt|max and CL. As expected, |dv/dt|max decreased as the activation intervals decreased, i.e., the CL decreased. Similar decrease in |dv/dt|max as a function of decreasing CL has also been reported in the swine by Huang et al., 2007 (their Figure 2). When APD alternans occurred, incidence of out of phase |dv/dt|max was 4%, with 96% in phase. The average amplitude of |dv/dt|max alternans was 13%. Figure 4 shows an example of continuous recording of in phase (Figures 4A–C) and out of phase (Figures 4D–F) APD alternans with |dv/dt|max alternans, similar to that in canines (Figure 3).
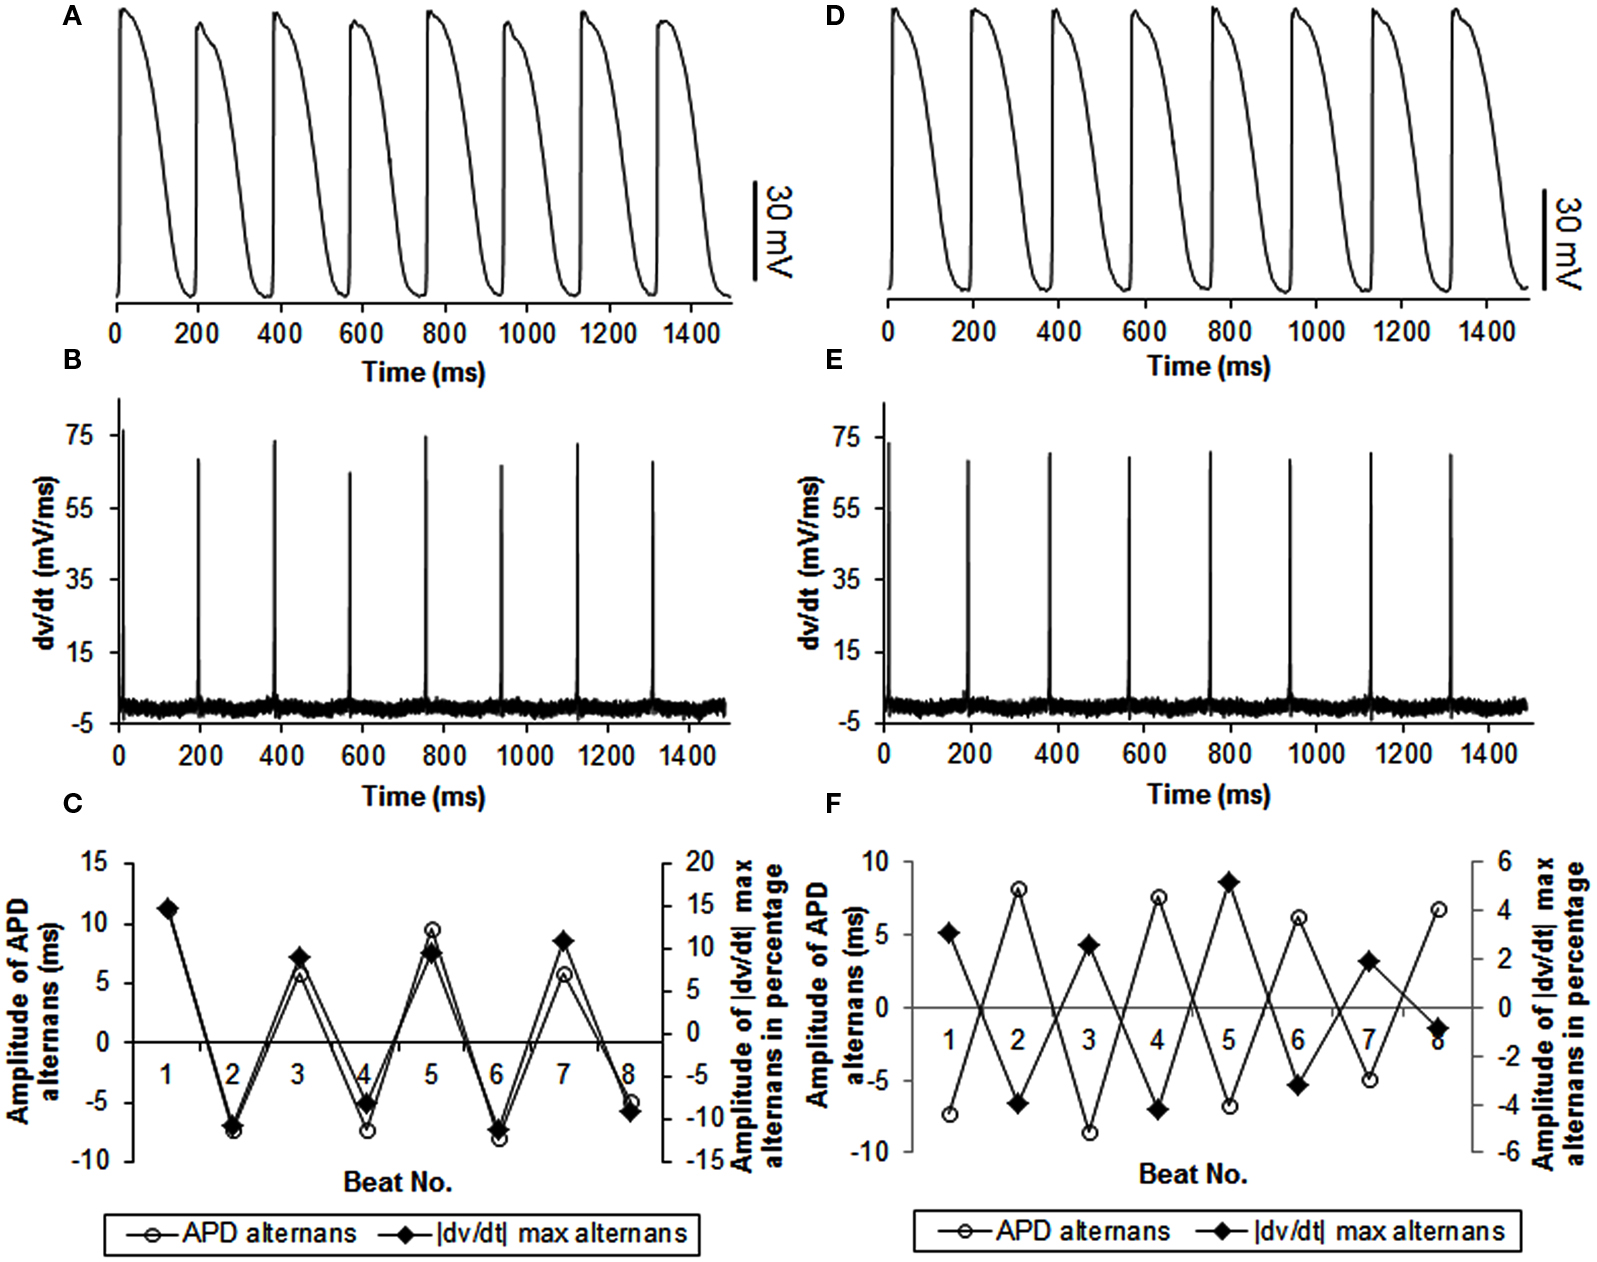
Figure 4. Example of continuous recordings, during constant CL pacing, showing in phase (A–C) and out of phase (D–F) relationship between APD and |dv/dt|max alternans in swines. The format is the same as in Figure 3. Note that the stimulus artifact for each action potential was blanked to better show |dv/dt|max alternans.
Simulated Activation in a Linear Strand of Cells
To explore possible effects of phase change between alternans of |dv/dt|max and APD alternans on conduction of an impulse, we simulated activation in a linear strand of 1000 cells. Before starting the imposed current change, we ran the simulation for 90 beats to reach a steady state, which produced discordant alternans at the chosen CL (169 ms). The simulation was continued for another 90 beats with (without) INa change to produce and compare the effects of out of phase (in phase) on conduction. Figure 5 shows the time-space plots for the last 90 beats of simulation during in phase (Figures 5A–C) and out of phase (Figures 5D–F) relationship between alternans of APD and |dv/dt|max. Each panel successively represents data from 30 beats of simulation. When alternans of |dv/dt|max was in phase with APD alternans (Figures 5A–C), APD alternans transitioned into discord after about 100 cells, and several nodes were formed along the length of the tissue. Vertical lines drawn on the time-space plots (Figures 5C,F) show that the wavelength, which is the product of APD and CV, oscillated along the length of the strand. However, with a similar amplitude of APD alternans at the paced cell (64.4 ms for in phase vs 63.2 ms for out of phase, Table 1), during out of phase (Figures 5D–F), the originally formed discordant alternans were gradually eliminated by the out of phase relationship and totally disappeared after about 50 beats. After that, APD alternans remained concordant throughout, and there were no oscillations of wavelength. Results of simulation are summarized in Table 1. These time-space plots are similar to those reported by Echebarria et al., 2011 (their Figure 3) with SNC, suggesting that the supernormal CV observed by them and the out of phase |dv/dt|max alternans may share similar mechanistic pathways.
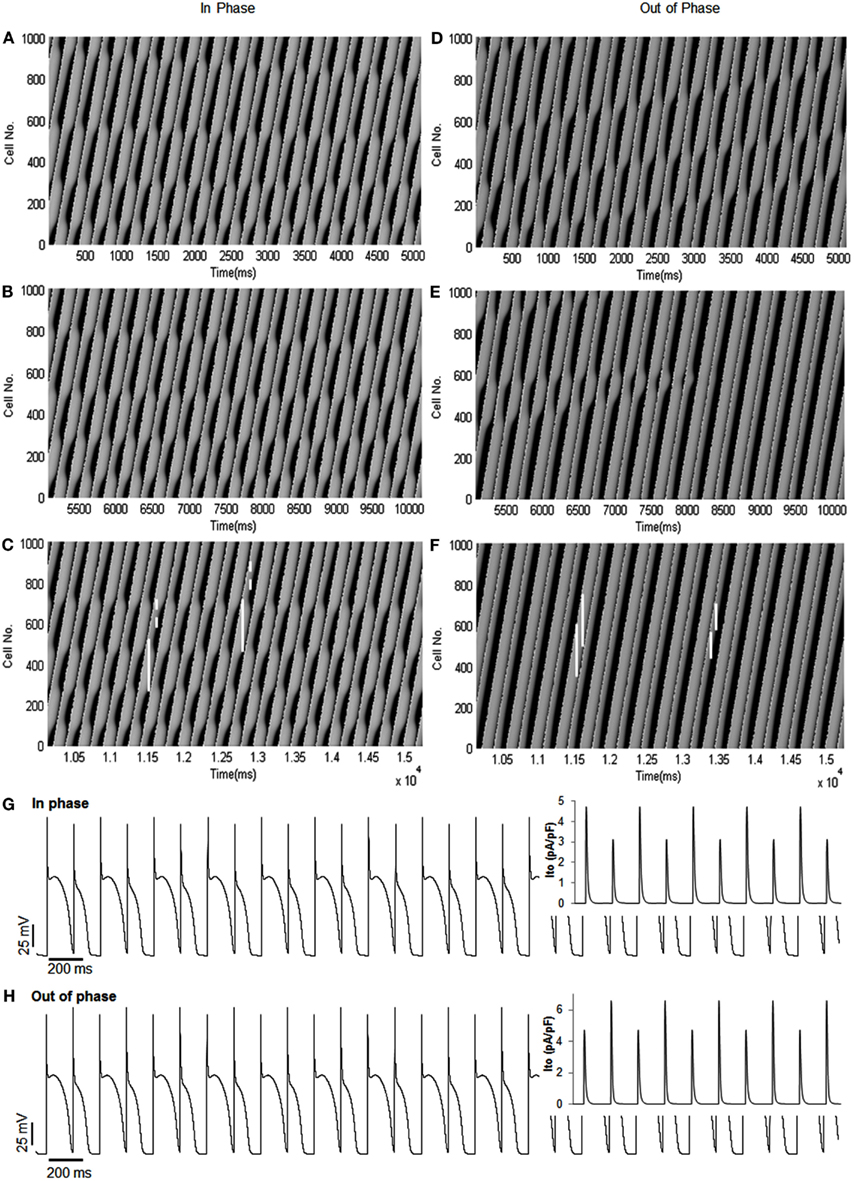
Figure 5. Time-space plots of simulated in phase and out of phase relationship between APD alternans and alternans of |dv/dt|max. (A–C) Ninety beats of in phase |dv/dt|max with APD alternans, shown in three sections (30 beats for each panel). The figure shows that the transition between concordant and discordant alternans occurred several times. The vertical white lines (solid and dashed) show wavelengths (long and short, respectively) at different time instances. Note the pronounced spatial oscillation in wavelength. (D–F) Ninety beats of out of phase |dv/dt|max with APD alternans. The figure shows that the discordant alternans produced by the initial conditions were removed progressively by the out of phase relationship, and concordant alternans persisted along the tissue afterward. Compared to (A–C), the change in wavelength was minimal. (G,H) Show the TMP traces at the paced cell (cell 5) for the last 30 beats, corresponding to (C,F), respectively. In [(G,H); inset] are traces of Ito current for the last 10 APs which show that, as expected, Ito mimics changes in |dv/dt|max.
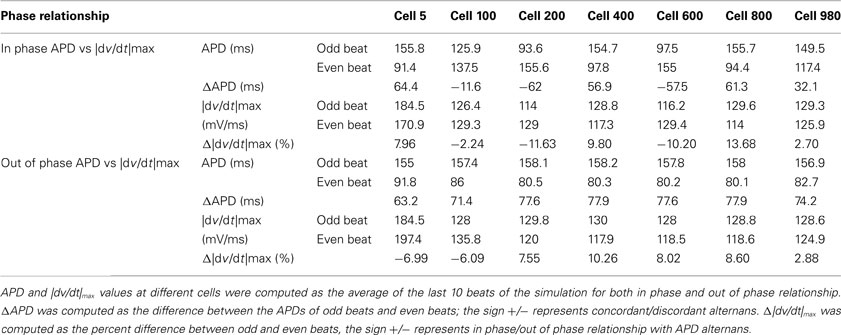
Table 1. Summary of results of simulated activations.
In order to quantify the wavelength variation, we computed the wavelength at different time instances for each wave. The values of mean wavelength and COV for different waves are summarized in Table 2. The table shows that the COV was markedly reduced during out of phase (0.12) as compared to in phase (0.21). To better explore how the out of phase relationship progressively minimizes discord, the 90 beats of simulation were segmented into three 30 beat sections. As the discord decreased, the COV decreased from 0.22 (first 30 beats) to 0.02 (last 30 beats). Compared to in phase, the difference in mean wavelengths (in number of cells) between long and short beats for out of phase was more prominent, i.e., 244 and 227 vs 203 and 305, this difference was especially noteworthy during the last 30 beats (beats 61–90) when all discord was absent (238 and 230 vs 170 and 319) because of the reduced variation of wavelength during the out of phase (0.12 overall and 0.02 for the last 30 beats). Figure 6 shows the distribution of wavelength during the in phase and out of phase relationship. The overall distribution (Figures 6A,E) shows that the wavelengths for in phase were more widely distributed while during out of phase, they were more concentrated in two bins centered at 176 and 326 (cell numbers). As discordant alternans reduced with time, the distribution became more concentrated for out of phase (Figures 6F–H), however, for in phase (Figures 6B–D), the distribution pattern nearly stayed the same through out the simulation.
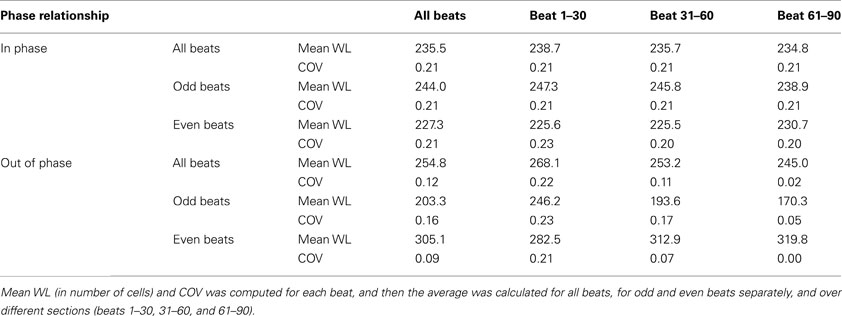
Table 2. Mean wavelength (WL) and coefficient of variation (COV) computed for in phase and out of phase relationship.
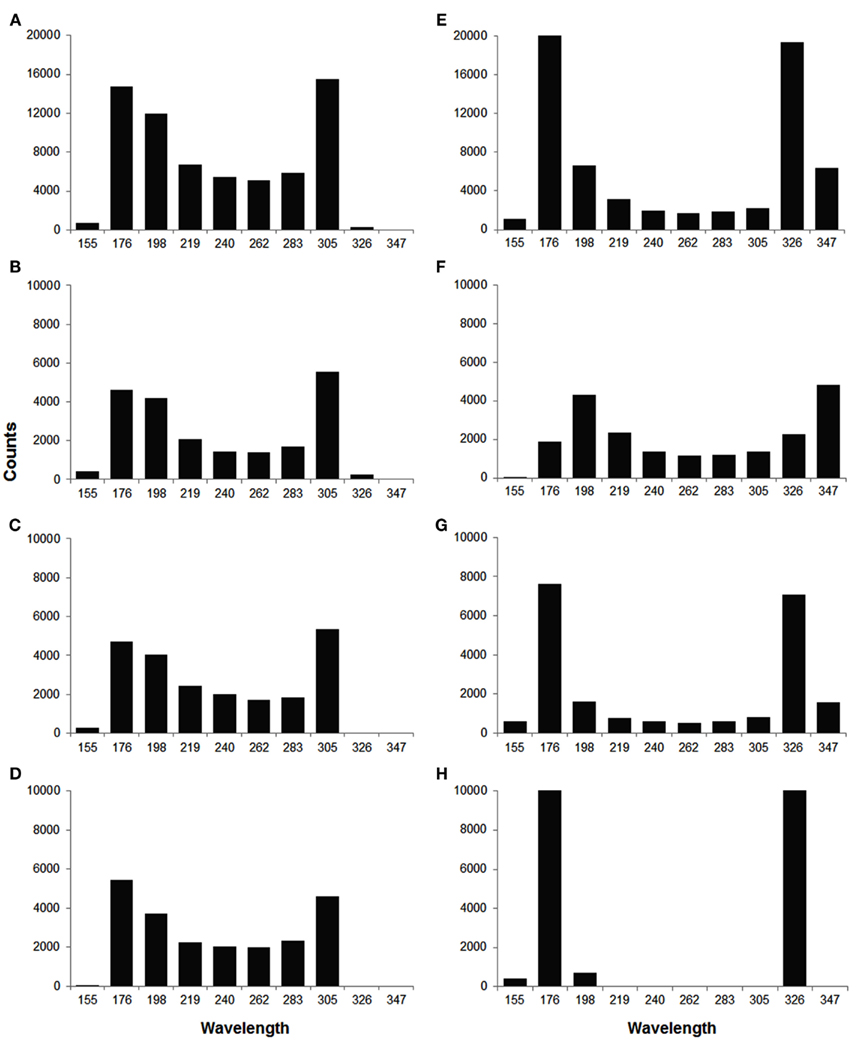
Figure 6. Histograms of wavelength distribution for in phase (A–D) and out of phase (E–H) relationship. (A,E) Show the overall wavelength distribution for all 90 beats. (B–D,F–H) Show the distribution in different sections (beat 1–30, 31–60, 61–90, from top to bottom), with 30 beats in each section. During in phase, the wavelength was more widely distributed between 150 and 350 (in number of cells), while during out of phase, it was more concentrated in two bins centered at 176 and 326, especially in the last section (H).
Discussion
The primary results of our study show that the phase relationship between alternans in early and late phases of an AP is not invariant and that variations in the phase can have an important effect on conduction. Therefore, the phase relation may play a critical role in formation of discordant alternans and in dispersion of repolarization.
In the context of clinical utility of alternans, T wave alternans (the so called micro-volt TWA) is seen at high activation rates, i.e., at high heart rates. Likewise, APD alternans is also observed at high activation rates, which is why we focused only on TMP recordings made during high activation rates (CL ≤300 ms). We note again that the shape of an AP changes considerably as a function of increasing activation rates. Rubart et al. (2000) reported that during high activation rates, the transient outward potassium current Ito, which plays a dominant role in early phase of repolarization, is remarkably reduced. This expected decrease in Ito is the reason for the lack of distinct shape of phase 1 in our TMP traces all of which were obtained at high activation rates. The micro-electrode recordings of TMPs from swine, reported by Huang et al., 2007 (in their Figure 2) during fast pacing, also show rounded APs with a marked change in their shape. Similar changes have also been observed by others (Omichi et al., 2000, 2002; Banville et al., 2004; Huang et al., 2004). Therefore, the shapes of APs that we observed at short activation intervals are a consequence of fast activation rates. Further confirmation that the change in shape of APs was a result of fast pacing rate was provided by our observation that the shapes of APs recorded at a slower rate of 500 ms CL displayed sharp upstrokes, a notch and higher values of |dv/dt|max similar to those also reported at slower rates by Huang et al. (2007).
Huang et al. (2007) observed that during VF, |dv/dt|max was a dominant predictor of APD, but the regression coefficients between them were low. In the context of our results, the low coefficients observed by them suggest that the phase relationship between |dv/dt|max and APD may also be variable during VF. These results illustrate the role of depolarization phase in electrical instability along with the repolarization phase. More directly, Gordon et al. (2010) showed that depolarization alternans along with repolarization alternans were important in predicting VF in an ischemic canine heart model.
Our rationale for investigating the phase relationships was twofold: (i) as shown by previous studies related to the initial rise of an AP upstroke (Fast et al., 1996; Spach et al., 1998; Kleber, 2005), the morphology of the early part of an AP, which is locally dictated by the recovery of sodium channels from inactivation (i.e., closed but available to open), contributes to the availability of depolarization charge in a connected tissue, and thus importantly affects conduction of an impulse and wavelength as also seen in our simulations. (ii) If the relationship between these alternans was invariant, then it is possible that a same mechanism underlies all facets of AP alternans, however, if the relationship was variable, that would suggest that different mechanisms may contribute to alternans of different phases of an AP. Although alternans of |dv/dt|max was mostly in phase with alternans of APD, the incidence of out of phase was not negligible. The percent incidence was low, however, considering the clinical observation of very low probability of any one activation degenerating into re-entry (compared to the total number of activations), the incidence of out of phase behavior is substantial. The critical impact of |dv/dt|max on CV, and CV being key in the transition from concordant to discordant alternans (Qu et al., 2000), provided rationale for investigating effects of the phase between |dv/dt|max and APD on dynamics of conduction. Results of simulations, in Figures 5 and 6 and in Tables 1 and 2, show that an out of phase relationship between these alternans minimizes the oscillations in wavelength and thus prevents discordant alternans. Assuming a cell length of about 200 μm, the length of the strand that we simulated is about 20 cm. Therefore, we consider that these results provide a global view of the effects of phase on the fate of a conducted impulse. We also note that the amplitudes of |dv/dt|max alternans that we simulated ranged from 2 to 14% and 3 to 10% (Table 1), similar to the amplitudes of experimentally observed alternans of |dv/dt|max, which, when averaged over all occurrences of |dv/dt|max alternans in all animals, were 13 and 10% (swine and canines).
Mechanisms for discordant alternans have been linked to restitution of APD and of CV by several investigations (Qu et al., 2000; Weiss et al., 2000; de Diego et al., 2008; Mironov et al., 2008; de Lange and Kucera, 2010) and have been theoretically explained by Echebarria and Karma(2002, 2007) using amplitude equation approach. Alternating APD causes alternating INa amplitude and therefore (in phase) alternans of |dv/dt|max. In case of in phase relationship, observed majority of the time, but not always, large |dv/dt|max associated with long APD results in faster conduction. The resulting decrease in preceding DI, in turn shortens the long APD, and slows propagation. Opposite process happens for the short APD, resulting in a spatial oscillation in wavelength and thus increase in the dispersion of refractoriness. On the other hand, for out of phase relationship, the long APD has a smaller leading |dv/dt|max, therefore, the decrease in preceding DI does not occur due to slower (compared to the in phase situation) conduction, which suppresses oscillation of wavelength as shown in Figure 5 and Table 2. These observations are very similar to the results reported by Echebarria et al. (2011) in a recent study focused on SNC, where they observed that the transition to discordant alternans only happened in the case of normal conduction while during SNC, APD alternans always remains concordant. Their findings are consistent with our simulation results, whereby the in phase relationship between APD and |dv/dt|max alternans promoted discord while the out of phase relationship prevented it, suggesting a potential similarity between the effects of out of phase behavior and of SNC. Since |dv/dt|max is a primary cellular level variable that determines CV (in the absence of changes in gap junctional coupling) we consider that the out of phase behavior probably is the underlying mechanism of SNC in situations where SNC is observed to eliminate discord because of the following: during alternans, the out of phase behavior is caused due to an unexpected increase in sodium recovery (from inactivation) before the short AP, which leads to a higher rate of depolarization and thus faster conduction for the short AP as compared to the long AP. Faster conduction for the shorter AP (at faster rates, the AP resulting from S2 is shorter than the preceding AP from the last S1) then manifests into a negative slope for the CV restitution. If the mechanism discussed above about suppression of discordant alternans holds, then slow conduction for a longer APD can lead to a continued increase in duration for the already long APD thus continued shortening of the short APD. However, all things being equal, as shown in Figure 5, for a length of simulated tissue that is of a size longer than a fiber that would span the ventricle, out of phase relationship minimizes wavelength oscillations. In a study by de Lange and Kucera (2010), SNC was shown to amplify the amplitude of APD alternans distal to the pacing site during alternant CL pacing, which is comparable to our results of the out of phase simulation (Table 1). As discussed in their paper, it is possible that the amplification of APD alternans could lead to a conduction block at a distal site. We also observed a similar increase, however, as discussed above, if a block were to happen, it would be at a site distal to the fiber length of 20 cm that we simulated. This length is longer than the dimension of the entire ventricle, therefore, we hypothesize that the absence of discord resulting from out of phase behavior may be a stabilizing factor.
Table 1 shows that during out of phase simulations, the phase relationship that resulted between |dv/dt|max and APD was in phase for cell 200 and distal cells. Although seemingly in contrast to the imposed out of phase behavior, the reason for this switch was that even though we did increase the INa for the short AP, the decrease in preceding DI for the shorter AP resulted in a decreased availability of recovered INa and thus the decrease in INa was actually larger than the imposed increase of 80%. An opposite situation resulted in a spatially rapid increase in preceding DI (and thus of subsequent APD) for the longer APs during out of phase simulation because of decreased CV (the rapid change in APD from cell 1 to cell 200 followed by a much slower continued increase in APD). Once the DIs shortened sufficiently for the short AP, |dv/dt|max decreased (due to reduced INa for the short AP despite of the imposed 80% increase) which slowed conduction and thus slowed the decrease in DI and APD. However, it was interesting to observe that even though the out of phase behavior “switched” to in phase behavior for cells 200 and beyond, once the initial spatial oscillation was prevented in the first 200 cells, then the rest of the wavelength changes were monotonic. The simulations show that it may not be necessary for the phase to change in entire tissue mass, a change in even smaller areas may alter spatial dynamics of repolarization.
The incidence of alternans (and out of phase) observed in the current study was much higher in canines compared to that in swines. Although several known (and unknown) differences in ionic currents could be the cause of the different incidence between these two species, we consider that differences in Ito is a likely candidate. Previous studies (Li et al., 2003) have shown that both Ito1 and Ito2 are present in CVM (Tseng and Hoffman, 1989) while only Ito2 is present in swines. As Ito current plays an important role in phase 1 repolarization and generation of APD alternans, less expression of Ito current in swines provides a possible explanation of the less frequent alternans observed in this species.
In conclusion, our study shows that in two species widely used to study alternans and related phenomenon, swines and canines, APD alternans are frequently accompanied by alternans of |dv/dt|max, and although mostly in phase with each other, they can spontaneously become out of phase in both species. Out of phase relationship can amplify amplitude of APD alternans, however, it also stabilizes concordant alternans and prevents the transition from concord to discord. We consider that absence of spatial discord is suggestive of a less arrhythmic substrate and therefore out of phase relationship may have a stabilizing effect on conduction of impulses.
Limitations
Ventricular myocytes are known to have different ion channel expression in different regions of the heart. Our observations are limited to the alternans in the endocardial region of the right ventricles. The phase change that we imposed in our simulation was phenomenological, because our primary aim was to determine the potential effects of phase change on conduction and not what causes the phase change per se. Although anomalous recovery of INa is the likely cause of out of phase behavior, the mechanisms behind what causes this anamoly, and importantly, what causes the spontaneous phase change remain unclear.
Conflict of Interest Statement
The authors declare that the research was conducted in the absence of any commercial or financial relationships that could be construed as a potential conflict of interest.
Acknowledgments
Supported by American Heart Association (Great Rivers Affiliate) and National Science Foundation (CBET 0730450)
References
Banville, I., Chattipakorn, N., and Gray, R. A. (2004). Restitution dynamics during pacing and arrhythmias in isolated pig hearts. J. Cardiovasc. Electrophysiol. 15, 455–463.
de Diego, C., Pai, R. K., Dave, A. S., Lynch, A., Thu, M., Chen, F., Xie, L. H., Weiss, J. N., and Valderrabano, M. (2008). Spatially discordant alternans in cardiomyocyte monolayers. Am. J. Physiol. Heart Circ. Physiol. 294, H1417–H1425.
de Lange, E., and Kucera, J. P. (2010). Alternans resonance and propagation block during supernormal conduction in cardiac tissue with decreased [K(+)](o). Biophys. J. 98, 1129–1138.
Echebarria, B., and Karma, A. (2002). Instability and spatiotemporal dynamics of alternans in paced cardiac tissue. Phys. Rev. Lett. 88, 208101.
Echebarria, B., and Karma, A. (2007). Amplitude equation approach to spatiotemporal dynamics of cardiac alternans. Phys. Rev. E Stat. Nonlin. Soft Matter Phys. 76, 051911.
Echebarria, B., Roder, G., Engel, H., Davidsen, J., and Bar, M. (2011). Supernormal conduction in cardiac tissue promotes concordant alternans and action potential bunching. Phys. Rev. E Stat. Nonlin. Soft Matter Phys. 83, 040902.
Fast, V. G., Darrow, B. J., Saffitz, J. E., and Kleber, A. G. (1996). Anisotropic activation spread in heart cell monolayers assessed by high-resolution optical mapping. Role of tissue discontinuities. Circ. Res. 79, 115–127.
Fox, J. J., McHarg, J. L., and Gilmour, R. F. Jr. (2002). Ionic mechanism of electrical alternans. Am. J. Physiol. Heart Circ. Physiol. 282, H516–H530.
Gordon, D., Kadish, A. H., Koolish, D., Taneja, T., Ulphani, J., Goldberger, J. J., and Ng, J. (2010). High-resolution electrical mapping of depolarization and repolarization alternans in an ischemic dog model. Am. J. Physiol. Heart Circ. Physiol. 298, H352–H359.
Hua, F., and Gilmour, R. F. Jr. (2004). Contribution of IKr to rate-dependent action potential dynamics in canine endocardium. Circ. Res. 94, 810–819.
Huang, J., Cheng, K. A., Dosdall, D. J., Smith, W. M., and Ideker, R. E. (2007). Role of maximum rate of depolarization in predicting action potential duration during ventricular fibrillation. Am. J. Physiol. Heart Circ. Physiol. 293, H2530–H2536.
Huang, J., Zhou, X., Smith, W. M., and Ideker, R. E. (2004). Restitution properties during ventricular fibrillation in the in situ swine heart. Circulation 110, 3161–3167.
Jing, L., Chourasia, S., and Patwardhan, A. (2010). Heterogeneous memory in restitution of action potential duration in pig ventricles. J. Electrocardiol. 43, 425–432.
Karagueuzian, H. S., Khan, S. S., Hong, K., Kobayashi, Y., Denton, T., Mandel, W. J., and Diamond, G. A. (1993). Action-potential alternans and irregular dynamics in quinidine-intoxicated ventricular muscle-cells – implications for ventricular proarrhythmia. Circulation 87, 1661–1672.
Kleber, A. G. (2005). The shape of the electrical action-potential upstroke: a new aspect from optical measurements on the surface of the heart. Circ. Res. 97, 204–206.
Koller, M. L., Riccio, M. L., and Gilmour, R. F. Jr. (1998). Dynamic restitution of action potential duration during electrical alternans and ventricular fibrillation. Am. J. Physiol. 275, H1635–H1642.
Lalani, G. G., Bayer, J., Trayanova, N. A., and Narayan, S. M. (2008). Action potential dynamics explain arrhythmic susceptibility in systolic heart failure. J. Card. Fail. 14, S8.
Li, G. R., Du, X. L., Siow, Y. L., O, K., Tse, H. F., and Lau, C. P. (2003). Calcium-activated transient outward chloride current and phase 1 repolarization of swine ventricular action potential. Cardiovasc. Res. 58, 89–98.
Mironov, S., Jalife, J., and Tolkacheva, E. G. (2008). Role of conduction velocity restitution and short-term memory in the development of action potential duration alternans in isolated rabbit hearts. Circulation 118, 17–25.
Omichi, C., Lee, M. H., Ohara, T., Naik, A. M., Wang, N. C., Karagueuzian, H. S., and Chen, P. S. (2000). Comparing cardiac action potentials recorded with metal and glass microelectrodes. Am. J. Physiol. Heart Circ. Physiol. 279, H3113–H3117.
Omichi, C., Zhou, S., Lee, M. H., Naik, A., Chang, C. M., Garfinkel, A., Weiss, J. N., Lin, S. F., Karagueuzian, H. S., and Chen, P. S. (2002). Effects of amiodarone on wave front dynamics during ventricular fibrillation in isolated swine right ventricle. Am. J. Physiol. Heart Circ. Physiol. 282, H1063–H1070.
Pruvot, E. J., Katra, R. P., Rosenbaum, D. S., and Laurita, K. R. (2004). Role of calcium cycling versus restitution in the mechanism of repolarization alternans. Circ. Res. 94, 1083–1090.
Qu, Z., Garfinkel, A., Chen, P. S., and Weiss, J. N. (2000). Mechanisms of discordant alternans and induction of reentry in simulated cardiac tissue. Circulation 102, 1664–1670.
Rubart, M., Lopshire, J. C., Fineberg, N. S., and Zipes, D. P. (2000). Changes in left ventricular repolarization and ion channel currents following a transient rate increase superimposed on bradycardia in anesthetized dogs. J. Cardiovasc. Electrophysiol. 11, 652–664.
Spach, M. S., Heidlage, J. F., Dolber, P. C., and Barr, R. C. (1998). Extracellular discontinuities in cardiac muscle: evidence for capillary effects on the action potential foot. Circ. Res. 83, 1144–1164.
Tseng, G. N., and Hoffman, B. F. (1989). Two components of transient outward current in canine ventricular myocytes. Circ. Res. 64, 633–647.
Weiss, J. N., Chen, P. S., Qu, Z., Karagueuzian, H. S., and Garfinkel, A. (2000). Ventricular fibrillation: how do we stop the waves from breaking? Circ. Res. 87, 1103–1107.
Wu, R. Z., and Patwardhan, A. (2006). Mechanism of repolarization alternans has restitution of action potential duration dependent and independent components. J. Cardiovasc. Electrophysiol. 17, 87–93.
Appendix
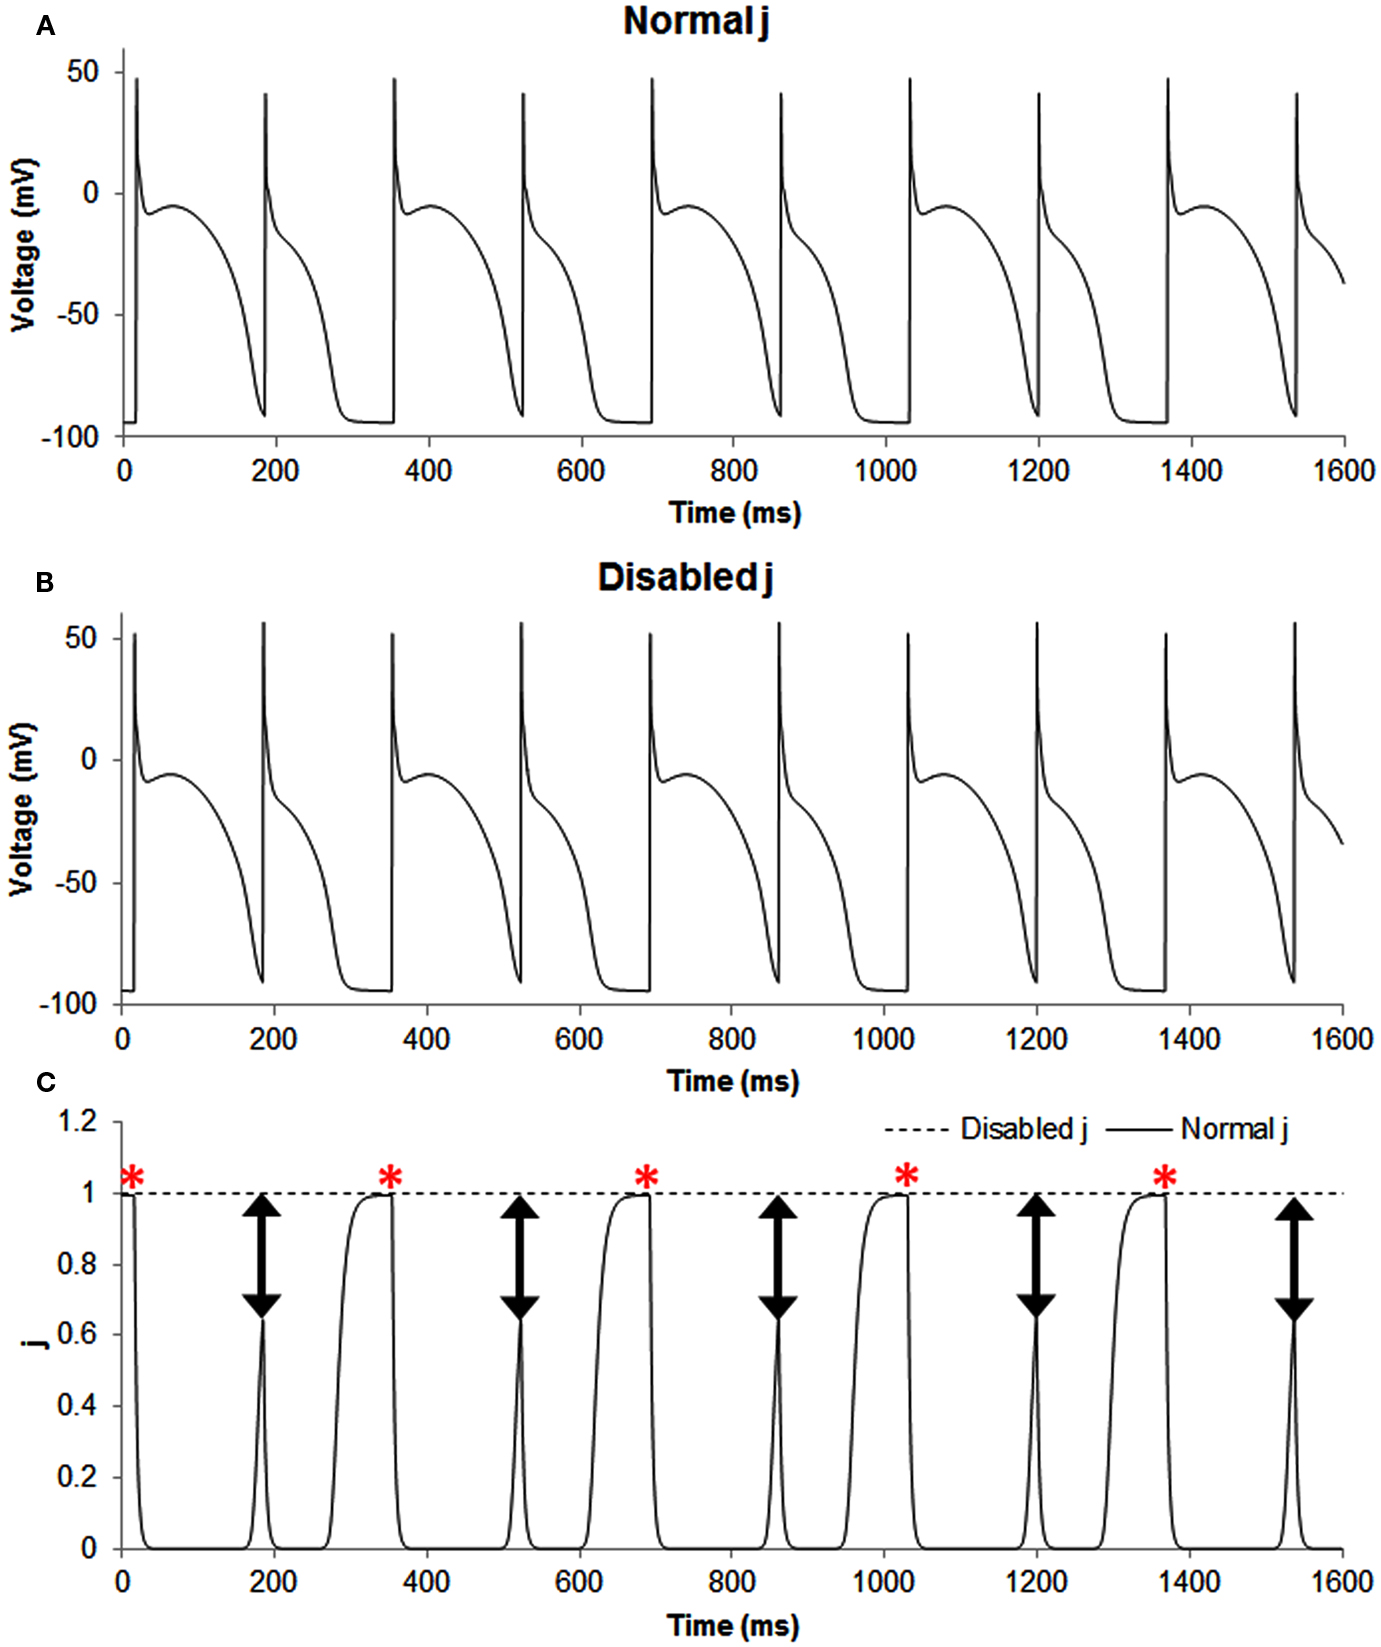
Figure A1. The figure shows transmembrane potential traces (A,B) and the slow inactivation gate j of sodium current (C) during normal, i.e., the in phase simulation (solid line) and when this gate was disabled, i.e., set as a constant equal to 1 (dashed line). Disabling j produced out of phase, and the predominant effect of this change was for the smaller AP because for the long AP the gate had already recovered to a value of one, but not so for the short AP. The double headed arrows show that the difference between the two situations (normal and altered sodium current availability) was most pronounced for short APs and the red asterisks show that the difference between the two situations (normal and altered sodium current availability) was minimal for long APs.
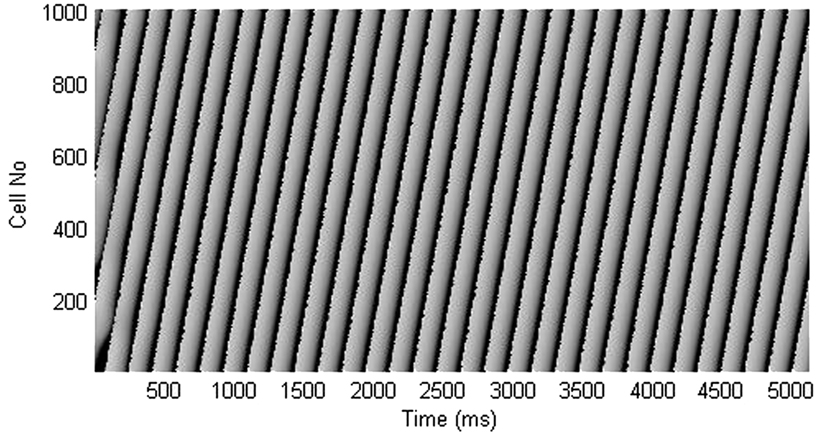
Figure A2. Time-space plot shows that block of Ito current lengthens the short APD and shortens the long APD, resulting in termination of APD alternans.
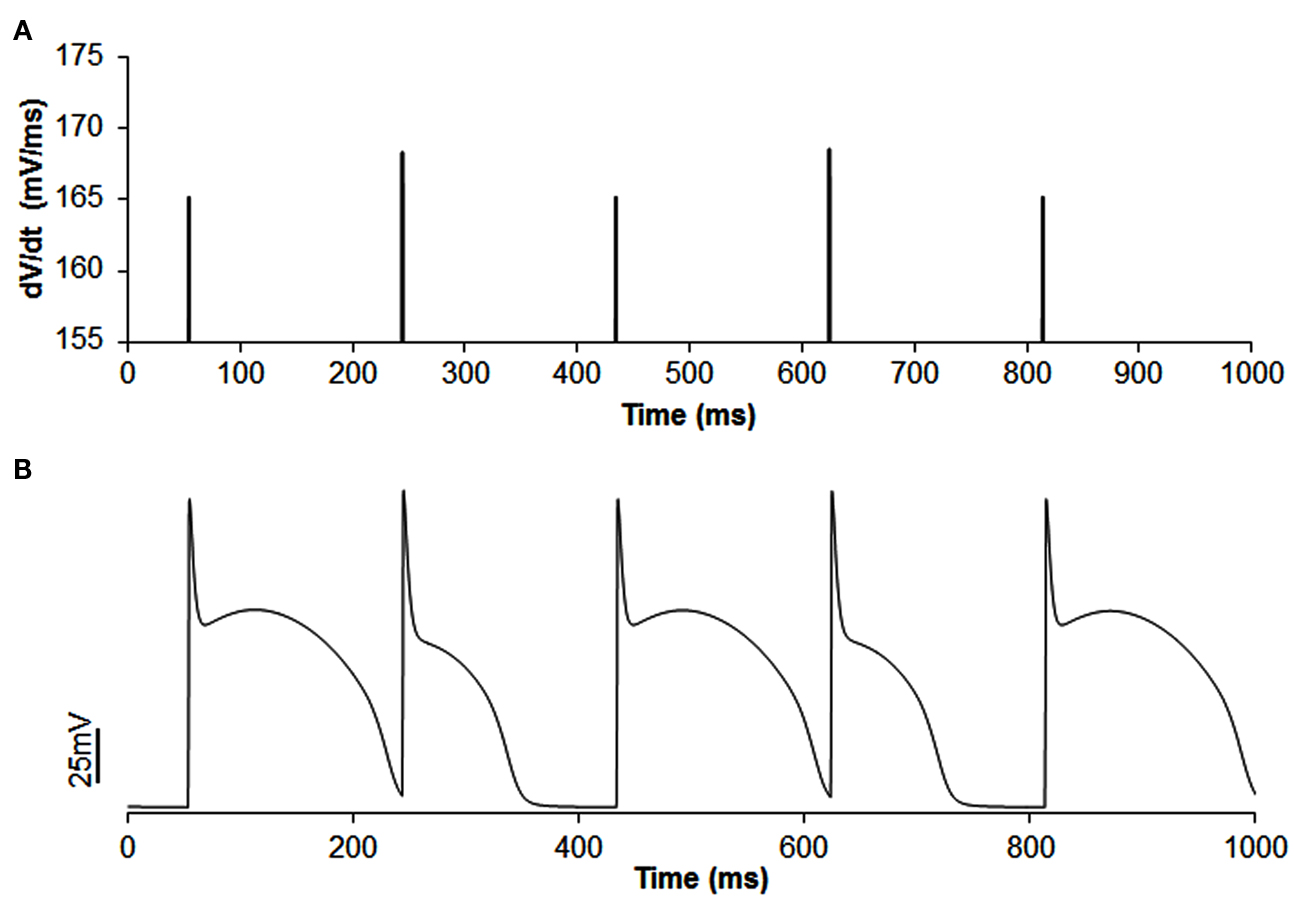
Figure A3. Example of out of phase |dv/dt|max alternans (A) with APD alternans (B) in single cell simulation. In this simulation, the slow inactivation gate j of sodium current was set to 1 and concentration of extracellular potassium ([K+]o) was reduced to 3.55 (normal value is 4.0). CL was increased to 190 ms instead of 169 ms as decreasing [K+]o increased APD and blocked the short beat at CL of 169 ms. The amplitude of |dv/dt|max alternans is 1.75%.
Keywords: alternans of depolarization, alternans of repolarization, maximum rate of depolarization, arrhythmia, wavelength oscillation
Citation: Jing L, Agarwal A, Chourasia S and Patwardhan A (2012) Phase relationship between alternans of early and late phases of ventricular action potentials. Front. Physio. 3:190. doi: 10.3389/fphys.2012.00190
Received: 23 February 2012; Accepted: 21 May 2012;
Published online: 08 June 2012.
Edited by:
Hester M. Den Ruijter, University of Amsterdam, NetherlandsReviewed by:
Krzysztof R. Grzeda, Boston College, USARuben Coronel, Academic Medical Center, Netherlands
Copyright: © 2012 Jing, Agarwal, Chourasia and Patwardhan. This is an open-access article distributed under the terms of the Creative Commons Attribution Non Commercial License, which permits non-commercial use, distribution, and reproduction in other forums, provided the original authors and source are credited.
*Correspondence: Abhijit Patwardhan, Wenner-Gren Research Laboratory, Center for Biomedical Engineering, University of Kentucky, Lexington, KY 40506-0070, USA. e-mail: abhijit@uky.edu
† Linyuan Jing and Anuj Agarwal have contributed equally to this work.