
- Department of Biology, Theoretical Biophysics, Humboldt-Universität zu Berlin, Berlin, Germany
Somatic cell reprogramming has dramatically changed stem cell research in recent years. The high pace of new findings in the field and an ever increasing amount of data from new high throughput techniques make it challenging to isolate core principles of the process. In order to analyze such mechanisms, we developed an abstract mechanistic model of a subset of the known regulatory processes during cell differentiation and production of induced pluripotent stem cells. This probabilistic Boolean network describes the interplay between gene expression, chromatin modifications, and DNA methylation. The model incorporates recent findings in epigenetics and partially reproduces experimentally observed reprogramming efficiencies and changes in methylation and chromatin remodeling. It enables us to investigate, how the temporal progression of the process is regulated. It also explicitly includes the transduction of factors using viral vectors and their silencing in reprogrammed cells, since this is still a standard procedure in somatic cell reprogramming. Based on the model we calculate an epigenetic landscape for probabilities of cell states. Simulation results show good reproduction of experimental observations during reprogramming, despite the simple structure of the model. An extensive analysis and introduced variations hint toward possible optimizations of the process that could push the technique closer to clinical applications. Faster changes in DNA methylation increase the speed of reprogramming at the expense of efficiency, while accelerated chromatin modifications moderately improve efficiency.
1 Introduction
Starting with the successful reprogramming of mouse and human fibroblasts to induced pluripotent stem cells (iPS; Takahashi, 2006; Takahashi et al., 2007), modifications of cell types have become extremely important in recent years. Manipulating the developmental state of cells transitioning from a differentiated to a pluripotent state or – as recently achieved (Vierbuchen et al., 2010) – to distinct differentiated cell types, opens the door for various clinical applications. Major roadblocks on the way to the clinic are the general inefficiency and slow pace of the process (Hanna et al., 2009).
While most of the reprogramming experiments today are still based on the viral transduction of the same four Yamanaka transcription factors SOX2, OCT4, KLF4, and cMYC (Takahashi, 2006), alternative techniques have been developed that improve the concept in various ways (Okita et al., 2008; Zhou et al., 2009).
Although direct reprogramming has made it possible to study the interplay of the networks regulating pluripotency in a defined environment, it is still not understood how the transition happens in detail. However, it has become clear that the reprogramming potential is not limited to specific cells in a culture, but rather that essentially every cell can be reprogrammed given enough time and the appropriate method (Hanna et al., 2009). A high proliferation rate seems to be beneficial to the process of overcoming the barriers in reprogramming (Hong et al., 2009; Kawamura et al., 2009; Marión et al., 2009). Moreover, efficiency could be improved by the addition of small molecules (Wang and Adjaye, 2010), some of which are also capable of replacing KLF4 and cMYC or even SOX2 (Ichida et al., 2009) in the process. Most of these discovered molecules act on the epigenetic modifications in the cells that fix them in their current developmental state. One of the most prominent drugs improving reprogramming is the histone deacetylase 1 (HDAC1) inhibitor valproic acid (VPA; Huangfu et al., 2008). The inhibition of HDAC1 seems to lower the epigenetic barrier between the cell states and facilitates the transition from one state to the other.
Pluripotency in general is regulated by an interplay of different mechanisms, the most important of which we will outline in detail in the following. First, transcriptional regulation, i.e., activation or inhibition of target gene activity by specific transcription factors, controls the expression of master regulators of pluripotency or differentiation. A second layer of control consists in DNA methylation of promoters of genes. Finally, the organization of chromatin in active or repressive structures represents the third mechanism.
The core transcriptional regulatory circuitry of pluripotency in human embryonic stem cells (hESCs) was first established by Boyer et al. (2005) and contained the master regulators of pluripotency OCT4, SOX2, and NANOG. These three transcription factors were found to interact in a mutually- and auto-activating fashion thereby promoting and maintaining pluripotency (Boyer et al., 2005; Loh et al., 2006). This regulatory circuitry has been extended in further studies to yield different larger networks regulating pluripotency (Ivanova et al., 2006; Zhou et al., 2007; Chavez et al., 2009).
DNA methylation of regulatory sequences, which silences gene promoters, is one of the known mechanisms in epigenetic regulation. This methylation is a major hindrance in reprogramming, because methylation marks cannot easily be removed, although there is evidence for active demethylation in reprogramming cells (Bhutani et al., 2011) which we will further discuss below.
With the advent of next generation sequencing techniques there is a wealth of data accumulating on DNA methylations (“methylomes”) in different cell types (Lister et al., 2009, 2011; Laurent et al., 2010). These studies reported large differences between ES/iPS and differentiated cells in the methylation states of promoters of key pluripotency and developmental genes. Moreover, they identified a very slow reprogramming of methylation states with aberrant methylation persisting in reprogramming cells, which can thus be distinguished from fully reprogrammed or ES cells.
These remaining DNA methylation differences also limit the differentiation potential of the iPS cells and restrict their applications. A recent study also reported the occurrence of newly methylated aberrant sites that did neither occur in the source nor in the target (ES) cells (Nishino et al., 2011).
Comparative studies were not limited to DNA methylation. Histone modifications were also studied extensively, suggesting a close connection between DNA methylation and chromatin structure (Hawkins et al., 2010).
It has been found that there is a strong correlation between gene silencing histone modifications and DNA methylations in promoters of pluripotency regulators (Cedar and Bergman, 2009). However, the relationship between the two is still not fully understood. The connection is probably established by histone binding proteins such as G9a, which have histone methylation activity (HMT) and therefore facilitate the formation of heterochromatin. G9a can also recruit the de novo methyl transferases DNMT3A and DNMT3B to the nucleosome which in turn can methylate the gene promoters on the DNA. DNA methylation is thought to stabilize chromatin structure during mitosis through differential binding of proteins for closed or open chromatin (Cedar and Bergman, 2009) and it can also inhibit methylation of H3K4, an activating histone mark. Inheritance of histone modifications is coupled to the methylation pattern as it guides binding of certain HDACs (Fuks et al., 2000).
DNA methylation itself is sustained throughout DNA replication and mitosis by virtue of DNMT1 and other associated proteins like NP95 by copying the methylation pattern of the template strand to the copied strand. Though this process is quite efficient, methylations can be lost in rapidly dividing cells and cells lacking DNMT1 (Monk et al., 1991).
The consequences of the complex interplay of the three mentioned regulatory mechanisms, i.e., transcriptional regulation, histone modifications leading to changes in chromatin structure, and DNA methylation, are not easy to understand. Mathematical modeling can help to unravel these complex interactions and explain how cell behavior is linked to the molecular mechanisms. Since we are dealing with an enormously complex system, we need to reduce it in order to discern the basic underlying features of the network. There have been various attempts to model certain parts of regulatory networks in great detail, which gave valuable insights into the dynamics of these subsystems (e.g., MacArthur and Please, 2008). However, since the whole process cannot be explained by breaking up the system into parts, we want to take a more holistic approach in this work and combine gene expression and epigenetic principles in one abstract model.
All the above mentioned regulatory processes only work correctly in an orchestrated manner. Regulatory structures in stem cells have been described by various models using different modeling approaches. There is a number of detailed models describing the interplay of regulatory genes in pluripotency and reprogramming, which help to understand the gene networks in detail and have elucidated the bistability of decisions taken in development and the influence of expression noise (Chickarmane et al., 2006; Chickarmane and Peterson, 2008; MacArthur et al., 2008; Kalmar et al., 2009). These models use ordinary differential equations to show the dynamics inside a small part of the whole machinery. There are also many studies describing regulation of differentiation into different lineages and the bifurcation dynamics preventing reprogramming (Roeder and Glauche, 2006; Huang et al., 2007; Duff et al., 2012). Moreover, there have been efforts to define the potential of cell states in theoretical models and use it to identify optimal routes of cell differentiation and reprogramming (Wang et al., 2010; Bhattacharya et al., 2011). Larger networks were just recently modeled using dynamic Bayesian networks and were used to predict improved reprogramming factor combinations (Chang et al., 2011).
A second class of more coarse grained models deals with transitions between cell states and how the system is shaped by self-organizing systems in the cells (Qu and Ortoleva, 2008; Halley et al., 2009). These models are very conceptual and refrain from describing single gene interactions. There have also been efforts to characterize the processes in chromatin remodeling in a theoretical model, which showed that there must be a positive feedback in the formation of heterochromatin structure to explain its observed behavior (Dodd et al., 2007).
Looking at the experimental evidence in the literature it seems that the progression of reprogramming is governed by stochastic processes that prohibit or permit activation of pluripotency genes. For that reason, there have also been attempts to model it with noisy ordinary differential equations (MacArthur et al., 2008) or even as a stochastic process of state transitions (Hanna et al., 2009). In a more general approach (Artyomov et al., 2010) the authors explicitly modeled the space of cellular states as a binary tree with nodes for each cell state and the pluripotent state as the root of the tree. This study was the first to include gene regulation and epigenetic changes in one model and it could, among other things, explain the low efficiency of reprogramming.
We are going in a different direction by building an abstract model of the combined networks that govern pluripotency and reprogramming using well established modeling frameworks in a novel way (Figure 1). Our model is based on a standard Boolean networks approach, meaning that it can easily be modified and combined with other results. Boolean models have the convenient property, that a cell state is defined as a binary vector of the states of all variables, making it easy to compare states without further complicated definitions. Since the processes we are modeling are clearly non-deterministic, we have chosen to use probabilistic Boolean models. The exact model structure will be derived in Section 3.1.
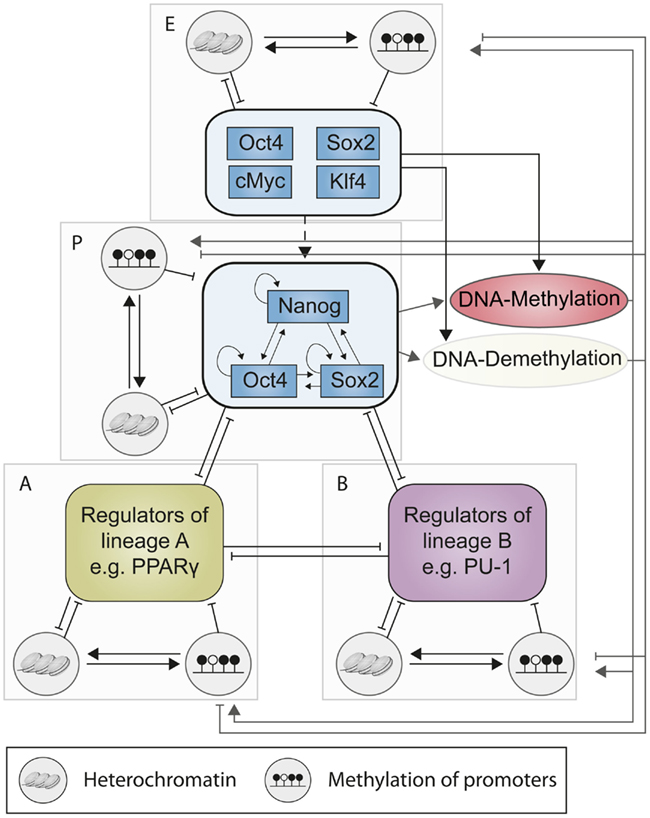
Figure 1. General model structure. Transcriptional regulators that account for the activation of a certain cell state are combined into a module. We have four modules in the complete model: Two different differentiation modules A and B, the Pluripotency Module P for the main pluripotency network, and the exogenous reprogramming genes E. Each module is governed by the activity of the other modules as well as its epigenetic states.
2 Materials and Methods
2.1 Modeling Framework
Boolean models are a drastic simplification of biological reality, but they have produced valuable results in the past and are especially suited for developmental gene regulatory networks (e.g., Macía et al., 2009). Using them it is possible to model large networks and study their dynamic behavior while leaving out details such as kinetic constants that are usually unknown in real world examples (Kauffman, 2004). Boolean networks limit the state of a gene to either ON or OFF and describe connections between the genes by using logical operators, e.g., AND, OR, NOT (generally written as ∧, ∨, and (¬ in mathematical formulas). For example if two transcription factors A and B are needed to activate gene C this would translate to the logical function C(t + 1) = A(t)∧B(t).
In formal terms, a Boolean network can be represented as a graph G = (V, E) consisting of a set of n nodes V = {v1, …, vn} and a set of k edges E = {e1, …, ek} between the nodes. For every time point t, each node vi has a state vi(t) ∈ {0, 1} denoting either no expression or expression of a gene or absence or presence of activity of a regulatory property, respectively. In a non-probabilistic Boolean network, the state vector, or simply the state S(t) of the network at time t corresponds to the vector of the node states at time t, i.e., S(t) = (v1(t), …, vn(t)). Thus, since every vi(t) can take only 2 possible values 0 or 1, the number of all possible states is 2n. In probabilistic Boolean networks (PBNs), as we will outline below, we are dealing with a probability distribution over several states at each time point. This is why, in order to extend the definition of states to probabilistic Boolean Networks, we will refer to a specific state as Si from now on where i ∈ {0, …, 2n}, independent of the time of its appearance. Every node is updated at every time point by application of a set of update functions F = {F1, …, Fn} that integrate the input information of edges on one node. In other words, the function Fi assigns a new state value to the node vi at time t + 1, i.e., vi(t + 1). They depend on the state of k input nodes with k ∈ {0, …, n} at time t.
There have been different approaches to address uncertainty and stochasticity in the Boolean framework (Shmulevich, 2002; Garg et al., 2009; Twardziok et al., 2010). We will follow the probabilistic Boolean network (PBN) approach proposed by (Shmulevich, 2002), but apply it in a slightly different way. Originally, probabilistic Boolean networks were designed to represent the uncertainty in knowledge about regulatory functions. If there is experimental data showing that both transcription factors A and B activate gene C, but it is unclear whether they can act separately or only in combination, there is not only one determined logical function that can describe their interaction. In probabilistic Boolean networks this uncertainty is taken into account by relaxing the constraint of fixed update rules Fi and by permitting instead one or more functions per node. Thus, function Fi is replaced by a set of functions with j∈{1, …, l(i)}, where is a Boolean logic function and l(i) the total number of functions for node vi. In each update step the functions are chosen randomly according to their probability which we assign.
Our model uses this feature of probabilistic Boolean networks to represent two kinds of stochasticity. The first is the aforementioned uncertainty about the correct function to apply. By employing different possible functions and varying their probability we can see which of them fits the known data better. The second way how we use the probabilistic functions is to model dynamic features of the system. The single processes that influence a variable are split into different functions and we assign each of them a probability. That way we can adjust the probability of the activation of a variable under certain conditions instead of assigning it one fixed value. We can also easily split activation and inactivation into different functions. Depending on the influencing variables the probabilities of the state of the variable change.
2.2 Simulation
The implemented model is based on the probabilistic Boolean networks approach (Shmulevich, 2002). The complete model consists of n different variables, which are updated by Boolean rules in each time step. The rules all consist of AND, OR, and NOT connections between the different variables. In each time step one of the functions is chosen with its assigned probability to determine the next state of the variable. Probabilistic Boolean models can be simulated in different ways. Either one can simulate single trajectories of the model and analyze the results like the outcome of a stochastic experiment, or one can analyze the resulting Markov chain. All simulations were carried out using the R-Package BoolNet (Müssel et al., 2010).
The PBN can be viewed as an ensemble of N standard Boolean networks, where In each simulation step, we choose one of the networks to update the state. The probability of each network being chosen is the product of the probabilities of the chosen functions. The vector now comprises the probabilities of all r = 2n states at time t, i.e., the probability of the network to be in this state. We can define a (2n × 2n) matrix A, that contains the probability to transition from state i to state j given all possible networks. If there is no network allowing the transition i → j, Aij = 0 otherwise Aij is the sum of the probabilities of all the networks allowing this transition. Matrix A is a state transition matrix of a homogeneous Markov process. Thus, given a (1 × 2n) vector D0 with a start probability for each state we can recursively simulate the system from t to t + 1 [equation (1)] or as well directly deduce the value at t + 1 of this geometric progression [equation (2)]:
This kind of simulation enables us to follow transitions from a single state to all its successors, but also makes it possible to start in a distribution of states. The distribution approach is much closer to biological reality than one sharp state since we are simulating on a cell population level. We used the Markov simulations to find the stationary states or attractors of the system and to find states with transient high probabilities.
To visualize the probability distributions in our model we plotted the probability for each state at each time point t in a three-dimensional plot. To sort the states in a meaningful ordering, we defined a distance measure for states as explained below. This measure ensures that states that are biologically different, are further apart in the plot and those that differ only slightly are closer together. The outcome is similar to the so-called epigenetic landscape of the cell (Figure 2). In the next two sections we will describe the generation of the start state distributions and the aforementioned sorting of the states for plotting.
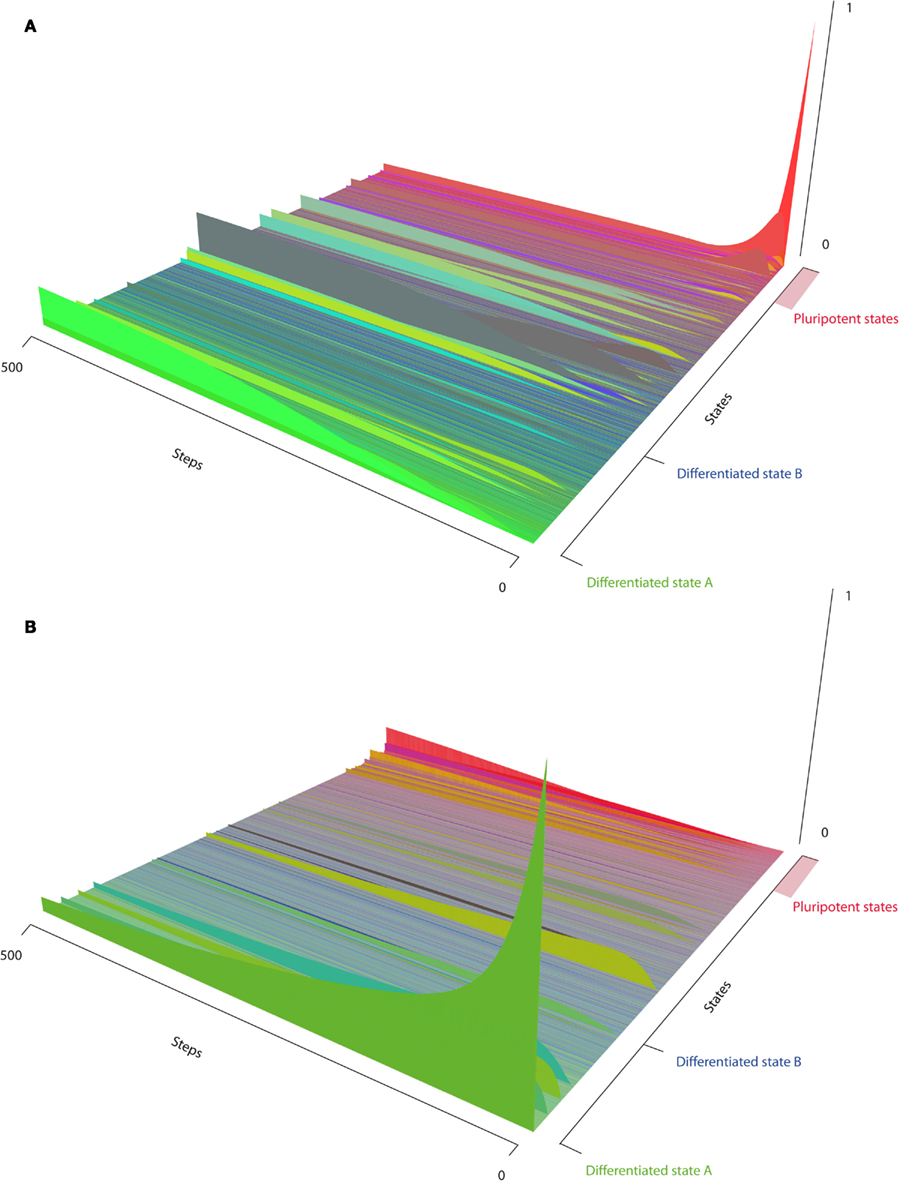
Figure 2. The epigenetic landscape. The x-axis shows all possible states of the model, sorted by similarity (Section 2.4) to the distinguished states, i.e., differentiated state A, differentiated state B, or pluripotent state P. The y-axis corresponds to simulation time steps, and the z-axis to state probabilities. (A) Reprogramming starting from one clearly defined state where A is active and the reprogramming factors are present. (B) Differentiation by the activation of module A through a weak signal.
2.3 Start States and Start Distributions
Our main model contains 14 variables thus we are looking at a total of 16,384 (214) possible states. An appropriate start state for the simulation must take into account that a cell population is very unlikely to consist of one specific Boolean state only, even if we are looking at a pure population of one cell lineage. There is always noise in biological systems: Genes that are not necessarily needed can be transcriptionally inactivated in one cell, but can randomly be expressed in the other, by chance packed into heterochromatin structures or their promoter even be methylated while the state is still viable. Nonetheless, there seems to be an optimal configuration of gene expression patterns and epigenetic structures for every cell type in which the majority of the cells lie. To account for the biological noise, we attribute probabilities in the vector D0 to states depending on their similarity to the optimal state yielding a normal distribution around the latter. In the next section we will define the similarity term and how we implemented it for our problem set.
2.4 Sorting the States by a Specific Similarity Matching
A time course simulation of every state in the state space can be represented as a three-dimensional landscape where the states lie on the x-axis, the simulation time on the y-axis, and the probabilities for the states at a given time on the z-axis for instance. A state can be represented as a vector of length n for models with n variables. The entries of every state vector Si (where i ∈ {1…2n}) are either 0 or 1. In order to sort the states in this three-dimensional landscape of gene expression and epigenetic mechanisms, we designed a specific two-step matching algorithm for every state in the state space. First of all, we defined the configuration of all variables for the three states corresponding to the fully reprogrammed state and two differentiated cell lineages respectively. These template states S1, S2, and S3 are represented by vectors of bits of 0 or 1 each corresponding to the state of the according variable. For each of these three state vectors and every variable therein we define a weight depending on the variables’ contribution for the integrity of the state which leads us to the three weight vectors W1, W2, and W3 (Table 1).
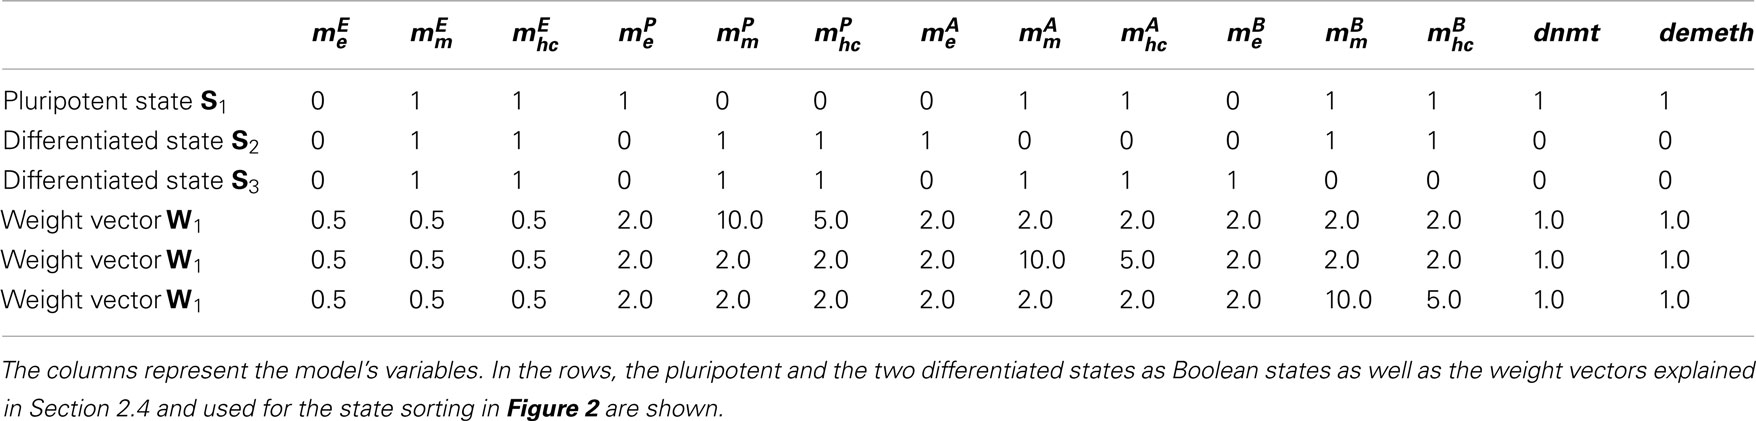
Table 1. Variables and states of our model.
We now define a sorting algorithm which can serve to characterize every state in the state space. We call matching vector of two state vectors Si and Sj the vector Mij which contains 1 for every variable that is identical in Si and Sj and 0 for the ones that are different in the two vectors:
where Sik is the k-th element of vector Si and δlm is the Kronecker delta with l and m ∈ {0, 1}. Thus, we define the specific similarity σij of a state Si to one of the three template states Sj (j ∈ {1, 2, 3}), as the scalar product of the weight vector Wj with the matching vector Mij
Hence, we obtain the three sets σi1, σi2, and σi3 of specific similarities for every state. However, these three sets have largely overlapping distributions of values, i.e., they contain very similar numbers which cannot be distinguished if we plot them on an axis. To visually separate them in the landscape representation, these specific similarities are now combined in the following way to obtain the overall sorting score for every state:
where a, b, and c are tunable parameters to attribute different orders of magnitude for the three sets of states. Moreover, we introduce correction terms for every summand by introducing σj,max, the maximal specific similarity which is attributed to the template states themselves and which simply corresponds to the absolute value of the weight vector. This correction term increases the efficiency of separating the states regarding their similarity or non-similarity to one of the three template states. Plotting the simulation landscape according to this sorting of the states on one axis renders the discrimination between the different states possible. In fact, we will get a separation of the three similarity sets in such a way that the states closest to one of the three template states cluster somewhere in its proximity and further away from the other states, respectively. Moreover when moving from one template state to the next the states will decrease in their similarity to the state we started in and increase in their similarity to the state we are moving toward (Figure 2).
2.5 Paths through the State Space
The state space of a probabilistic Boolean network with n nodes is a directed graph in which vertices correspond to possible states the network can reach and edges to the possible transitions between two states. While in classical synchronous Boolean networks there is only one defined state transition from every state to another state or to itself, in probabilistic Boolean networks, there are up to 2n possible state transitions from every state to others, each possessing a certain probability of being taken. This makes the visual representation of the state space for larger networks nearly impossible. In order to circumvent this issue we focused on simulations of the network starting from certain states and only showing the states that are reached with a probability above a certain threshold (Figure 3).
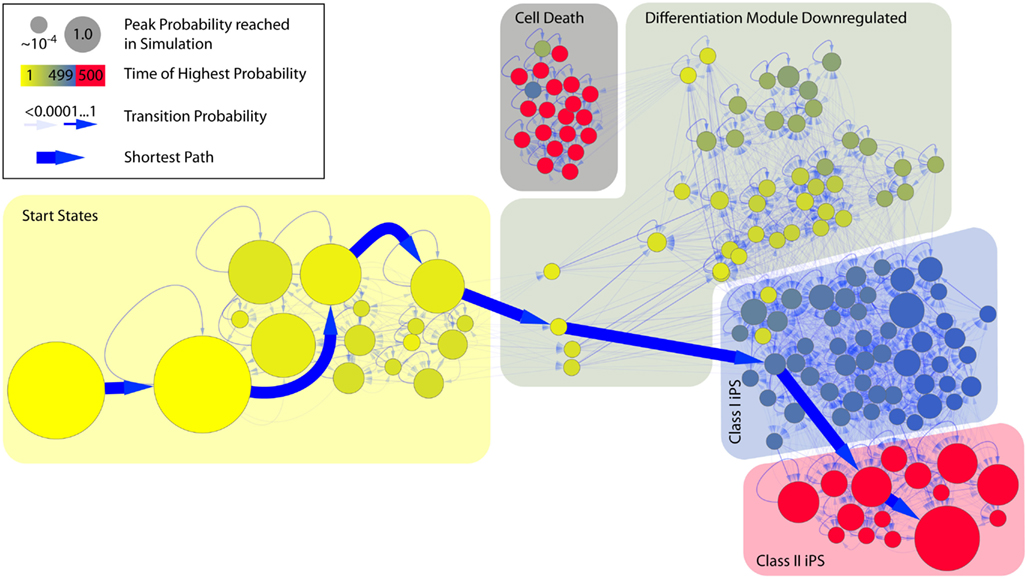
Figure 3. State space of the combined model of reprogramming. Time evolution of the model starting with an active differentiation network and active reprogramming genes. The Figure only shows the states that are reached with a probability of p ≥ 10−4. The model has 2073 possible state transitions between these 149 states. Different phases can clearly be separated in the reprogramming process. In the beginning (yellow area) the epigenetic factors of the different modules are modified, but there is no change in gene expression yet. The second phase (dark yellow) represents the down-regulation of the differentiation module followed by the activation of the pluripotency module (blue area). The last step consists of the silencing of exogenous factors, that produces stable iPS cells (red area). There are some states that can lead to non-viable cells, in which no regulators are expressed at all (gray area). The bold blue arrows represent the shortest path to the main pluripotent state.
3 Results
3.1 Model Structure
We analyze the interplay of three different regulatory layers, as we look at chromatin structure, DNA methylation, and transcription factor interaction. Due to the different properties of these mechanisms we need to keep a fairly high level of abstraction to combine them in one simple model (Figure 1).
For the sake of simplicity and to restrict computational complexity of simulations, we combine the single genes and regulatory factors that are responsible for the activation of a certain cell state into modules. This simplified approach is justified by the strongly correlated behavior that these genes are shown to have. It has also been used in other theoretical models before and shown good results (e.g., Artyomov et al., 2010).
The modules contain many activating interactions between their members. A good example is the network of OCT4, SOX2, and NANOG that is responsible for sustaining pluripotency. These transcription factors bind a large number of shared targets as well as their own promoters. This leads to their mutual and auto-activation (Boyer et al., 2005). Similar interactions have been reported for master regulators of differentiated cell lines like PU-1 for erythrocytes (Nishimura et al., 2000; Okuno et al., 2005) or PPARγ for adipose tissue (Wu et al., 1999).
Interactions between these modules are often mutually repressive, as it was reported for GATA-1 and PU-1 (Rekhtman et al., 1999). The pluripotency module also represses differentiation factors. This mutual antagonism paired with auto-activation of the single modules is the basic structure of the transcription factor regulations in our model.
The basic findings underlying the logical rules in our model are summarized in Table 2. The epigenetic regulations that influence the expression level in general and specifically for each module are described in detail in the following.
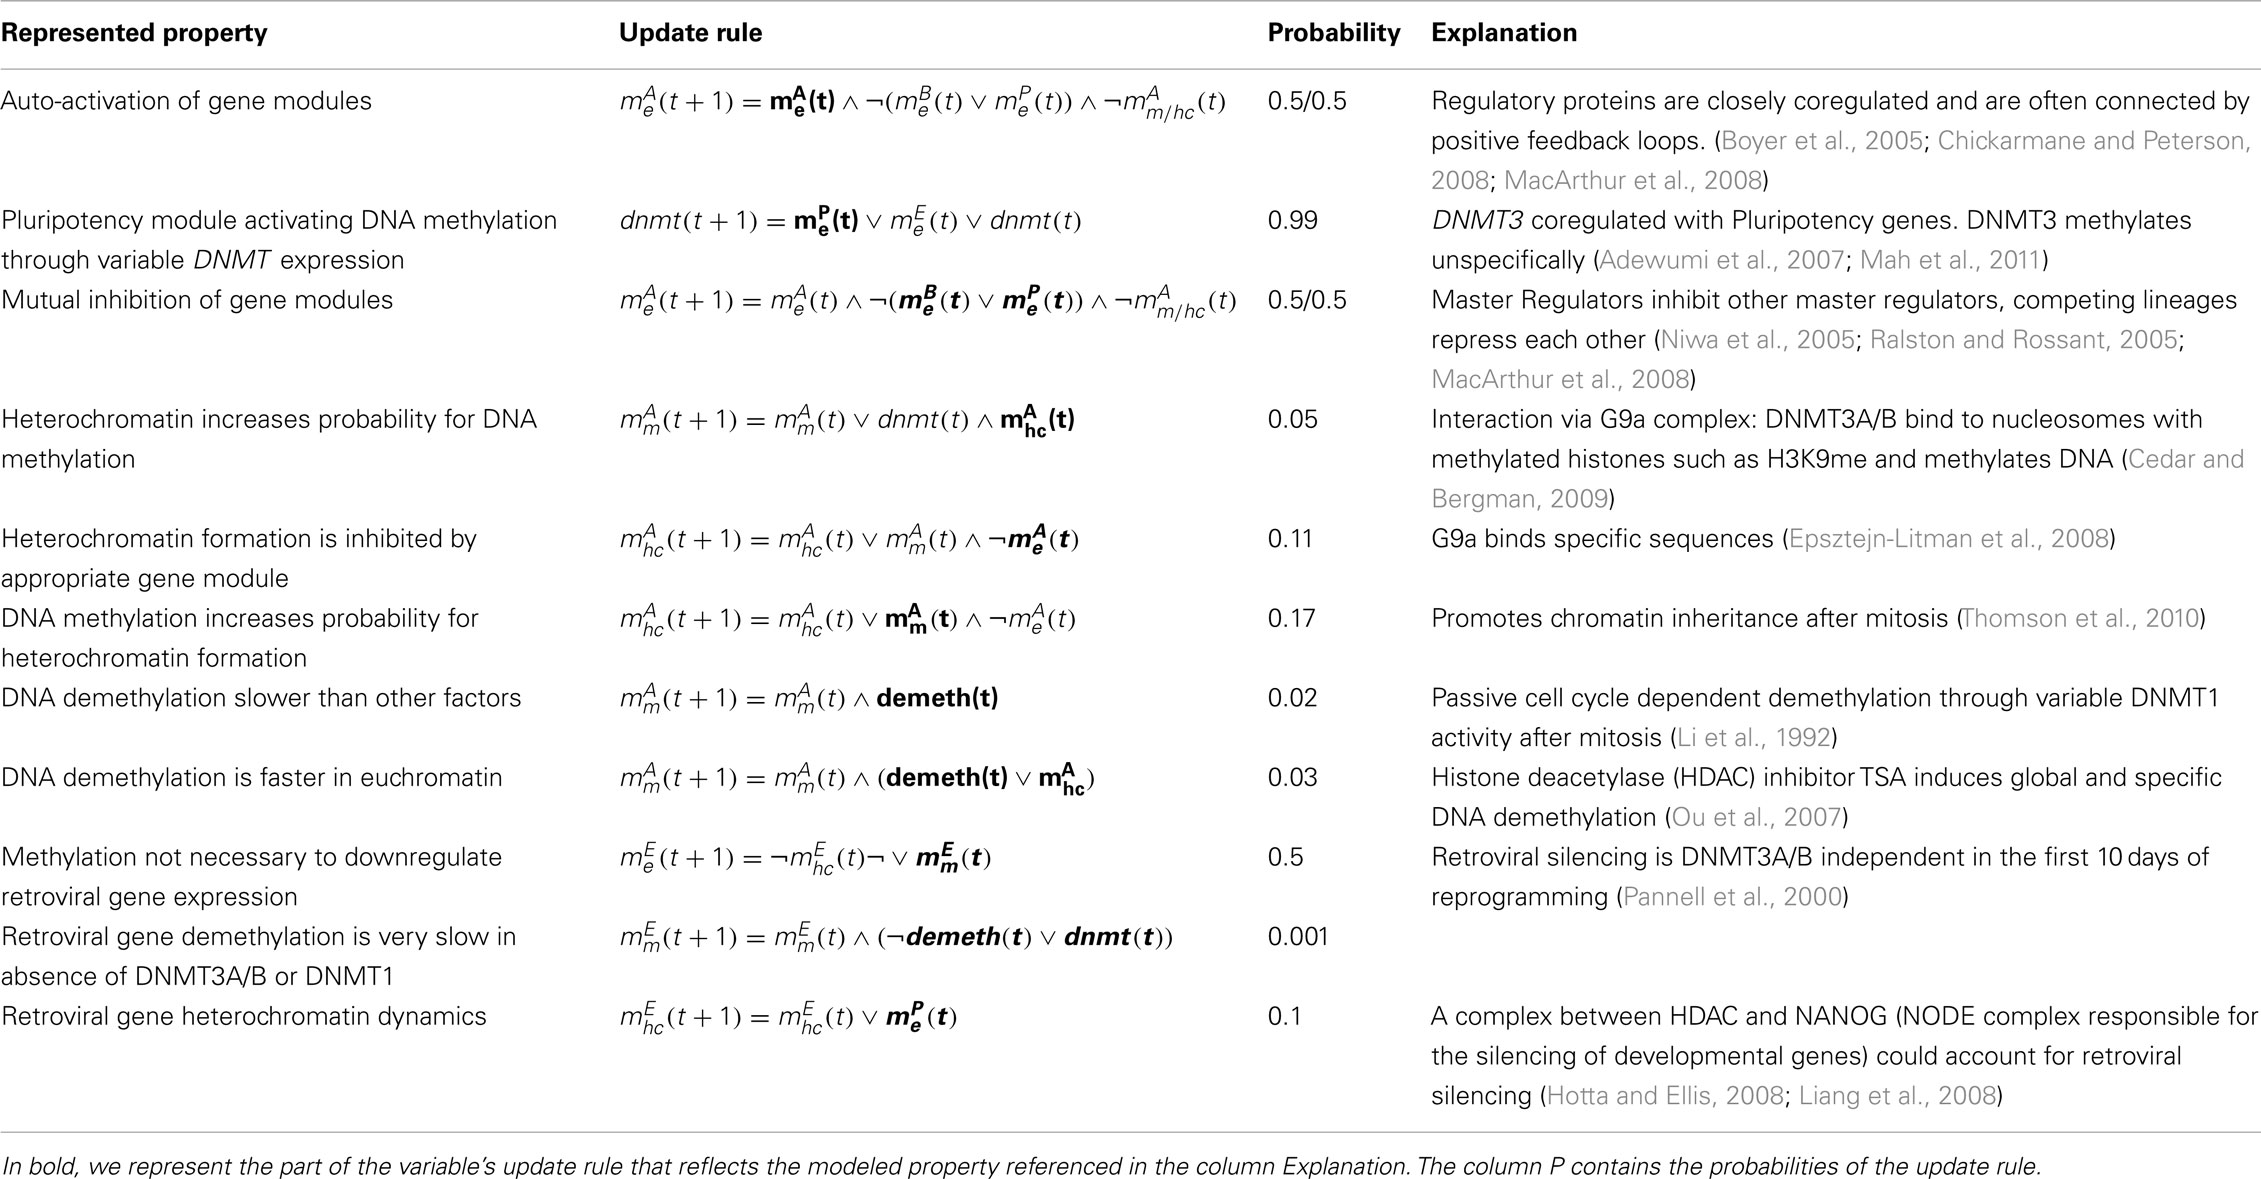
Table 2. General model structure.
Although there has been immense progress in the field of epigenetics in recent years, many of the regulatory mechanisms and their interactions are still enigmatic to researchers (Cedar and Bergman, 2009; Djuric and Ellis, 2010). In our model we explore different motifs of the epigenetic marks governing gene expression in development and reprogramming. The general mechanism implemented in the model follows the approach suggested by (Cedar and Bergman, 2009). Epigenetic dynamics emanate from the more rapidly changing states of the proteome of the cell. The expressed regulatory proteins and RNAs not only govern future expression profiles by direct action on promoters, but also change the more persistent epigenetic marks which then in turn redefine a new set of transcribed genes and, thus, of cellular proteins. In our model, the expression of genes that belong to the same module increases the chances of removing silencing marks on chromatin. Once the chromatin is in an open conformation, we assume there is a possibility to remove DNA methylation if it is also suppressing gene expression in the module. The process of silencing can happen if the genes of a module are not expressed. The module is then prone to methylation and formation of heterochromatin. If one of the silencing marks is set, it increases the chances of keeping it and setting the second mark as well. As described above, histone modifications and DNA methylations are strongly interconnected (Epsztejn-Litman et al., 2008; Thomson et al., 2010). This collaborative aspect of silencing creates a positive feedback loop, which promotes bimodality of the epigenetic states, meaning that there is a low probability to stay in a state where only one of the marks is set when the gene state is constant.
We assume that the DNA methylation of the promoter regions of the genes in one module are coregulated to a large degree, and are thus also characterized by one entity only. This variable follows rules which we derived from literature (Table 2; Figure 4). Activation of this variable means that the promoters are methylated which will inhibit gene expression. The activation of the DNA methylation status is governed by the presence of de novo methyl transferases DNMT3A/B which are summarized in the variable dnmt. However, dnmt is not the only variable influencing the methylation state of a module. As described above, there are also other chromatin binding proteins influencing the likeliness of DNA methylation. We assume that all of these proteins combined are responsible for the current local chromatin structure and set the chromatin structure of the module as a modifying factor of the DNA methylation. This defines the activating update function, that – if chosen – can only activate the variable. If the DNA is already methylated, it can be demethylated by different mechanisms. For example, inefficiency of DNMT1 copying of methylation patterns is considered as passive demethylation (Monk et al., 1991). This process can only happen when cells are dividing, as it depends on DNA replication. However, there might as well be active demethylation processes influencing the DNA methylation state as discovered recently (Table 2). In our model, we summarize these processes leading to demethylation of DNA in the variable demeth. All of the mentioned processes happen very slowly compared to transcription factor mediated changes in the regulation of expression, which is why we also introduced a function that does not alter the variable when it is chosen. This function gets a high probability compared to the rest. A combination of the above yields the following update functions for methylation of pluripotency genes:
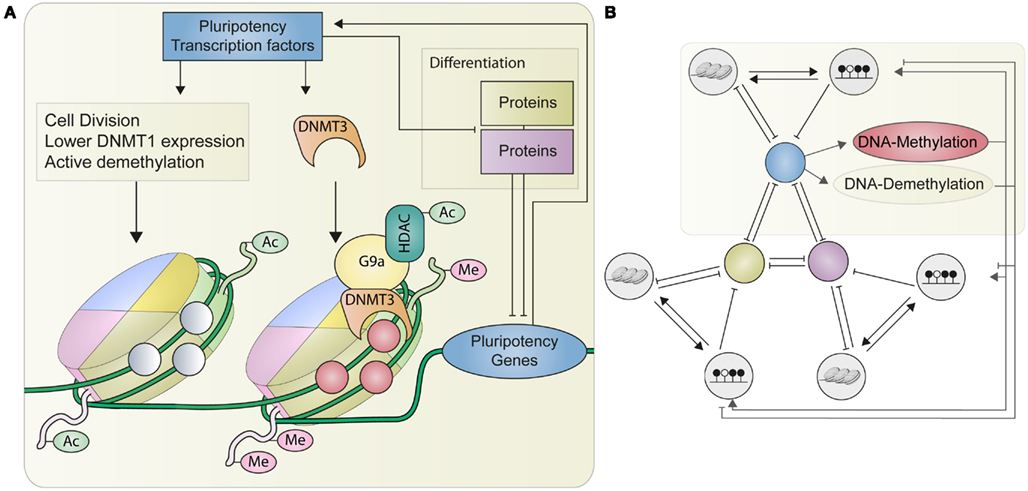
Figure 4. A schematic representation of the processes described by our model. (A) Shows the connection between DNA methylation, histone modifications and the pluripotency master regulators. Pluripotency transcription factors activate their own expression and can be suppressed by factors regulating differentiation. The pluripotency factors themselves increase the expression of DNMT3 which enables de novo methylation of DNA preferably in combination with repressive histone modifications such as methylation or deacetylation (right nucleosome). On the other hand activation of pluripotency genes also leads to a higher cell division rate, a suppression of methylation maintenance and probably active demethylation, which also increases the chances of euchromatin formation. (B) Without external influences (e.g., retroviral genes or signaling molecules), the structure of our model consists of three gene modules (P, A, B) inhibiting each other and each governed by their specific epigenetic states. The pluripotency (P) module regulates the activation of methylation and demethylation.
where and are the methylation and chromatin states of module A, respectively. Similar rules hold for modules B and P (modules as shown in Figure 1). Note that probabilities of the formulas sum up to 1.
The dnmt and demeth variables are governed by the following rules:
where and are the expression of the pluripotency and the exogenous modules, respectively. Switching off these factors is very slow, because we assume that the influences implemented here are not the only influence on these variables and that they are active in many cell states.
Histone modifications are strongly simplified in our model. We consider neither single modifications on different sites nor different numbers of methyl groups on the residues. Chromatin changes are dependent on the expression of the module’s genes. If these genes are expressed, it is impossible to remodel the chromatin to a closed form. If they are not present, there is a chance of negative histone modification which is increased by present DNA methylation marks. In Boolean formulas these processes are described as
where is the expression of module A, the chromatin state, and is the DNA methylation of the module respectively. Following these rules the DNA methylation in a module increases the chance of forming and keeping heterochromatin, independent of the chosen parameters. The same is true for the chances of methylation, which are dependent on the chromatin state of the module as well. Thus, the epigenetic states are mutually dependent on each other, and are also reigned by the states of their expressed genes.
In turn, the expression of a module is governed by its epigenetic states. If the gene is located in heterochromatin and methylated it is marked inactive and cannot be activated by any composition of transcription factors. If both epigenetic sub-modules are inactive, the expression of the genes in the next time step only depends on the transcription factors. If the gene is in heterochromatin and not methylated or vice versa, there is still a chance that it is expressed, given the right transcription factors. We implemented these rules for all modules by the following Boolean formulas:
The activation of the pluripotency network by the transduced gene cocktail is also modeled explicitly. The pluripotency network has a small chance of being activated by the artificially introduced genes. These exogenic factors are deactivated when the cell has reached a pluripotent state with the pluripotency module turned on and all differentiated modules turned off. The probability of activation is rather small compared to the probability of the pluripotency module activating itself. Since only a small subset of pluripotency regulators is transduced in reprogramming experiments (usually 4 transcription factors) we assume that the activation is happening rarely. The probability is directly connected to the number of reprogramming factors transcribed, it can be increased to model the influence of additional NANOG transduction, which has been shown to be beneficial to the efficiency of reprogramming (Hanna et al., 2009).
The deactivation of the transduced genes is achieved by silencing of their promoters through methylation and chromatin remodeling by histone deacetylation (For a review, see Hotta and Ellis, 2008). In our model this process is triggered when the cell reaches the iPS expression profile.
Since the transduced genes differ from the endogenous pluripotency genes in their promoter region, some changes regarding their transcriptional repression and interactions of methylation and chromatin remodeling need to be done in comparison to the other modules.
Due to the viral promoters the expression of the retroviral genes only depends on their chromatin and methylation state and not on any transcriptional inhibitors or activators.
The rules for methylation of the promoter of the exogenous genes are very similar to the ones of the other modules except for the probabilities which we chose to be smaller for dnmt and heterochromatin dependent DNA methylation. This is due to the finding that after reprogramming, the retroviral genes can still be active (class I iPSCs) or be silenced and thus fully reprogrammed (class II iPSCs; Niwa, 2007; Mikkelsen et al., 2008) which suggests that methylation of the viral promoters might not be fast and complete which would lead to quick silencing. Moreover, methylation does not seem to be needed to downregulate the activity of the retroviral genes according to Pannell et al. (2000) which accounts for these low probabilities as well.
Similar to the other modules, we also introduced slow, cell cycle dependent DNA demethylation induced by variable expression of DNMT1 after mitosis (Li et al., 1992; Table 2).
Since the remaining update rules for DNA methylation stay the same with the sole difference of lower probability in comparison to the other modules, this is the only structural difference:
The chromatin modification rules of the retroviral genes mainly depend on their own methylation state (just like the other modules) and on the expression of the endogenous pluripotency genes. We hypothesize this interaction to be mediated by a complex similar to the so-called NANOG and OCT4 associated deacetylase (NODE) complex or by this complex itself. It consists of a histone deacetylase (HDAC) and NANOG or OCT4 (Liang et al., 2008) and was found to catalyze histone deacetylation on developmental target genes thereby leading to heterochromatin formation. The hypothesis that this complex or at least one with very similar properties and behavior is responsible for retroviral gene silencing is based on the fact that de novo DNA methylation is not necessary for retroviral silencing as mentioned above (Pannell et al., 2000) and that there seems to be a complex of NANOG and the HDAC which is responsible for this process (Hotta and Ellis, 2008). Thus, the only update rule differing from the other modules regarding the heterochromatin structure depends on the expression of the pluripotency module P:
which completes our set of update rules.
3.2 Simulations of a Single Module
The basic building blocks of our model are modules of genes and their epigenetic modifications. To analyze the general behavior of these sub-networks, we start with simulations of the separate blocks before describing different combinations of these.
A module consists of three nodes – the expression node, the DNA methylation node, and the chromatin structure node – with the DNA methylation node being connected to the main epigenetic modifier variables namely dnmt and demeth (represented by their actions, i.e., DNA methylation or DNA demethylation respectively in Figure 1). We distinguish two different cases to describe the complete set of different modules. First, there are the entities A and B that only regulate their own expression and do not regulate the expression of dnmt and demeth, which are the components responsible for differentiation. The second class of modules are the pluripotency regulators P, which regulate their own activation, but also influence the activity of epigenetic modifiers.
Unsurprisingly, we found the differences in behavior between the two classes to be substantial. We analyzed the modules under different conditions, different parameter settings, and applied disturbances like knockout or overexpression experiments and quantified the effects in regard to the outcome distributions. For each one of them, we built a model containing only the respective module and external signals influencing it.
The pluripotency module P is the central point, as it has the strongest connections to the main regulators of epigenetics demeth and dnmt. Its dynamic behavior and steady states reflect various experimental results. The state in which the pluripotency module is active is stable. Even if the chromatin state is set to heterochromatin, the model has a high chance to return to the pluripotent state. This changes if DNA methylation is activated, which silences the genes and also locks the states of chromatin in the silencing state. If one of the other genes is constantly expressed, the module is suppressed by this gene and silenced by its epigenetic factors. A relatively large fraction of cells is transferred to the respective state. This shift happens rather fast, because during the activation of the pluripotency genes the entities that enable changes in the methylation states are active and are disabled in the resulting states (Figure 5).
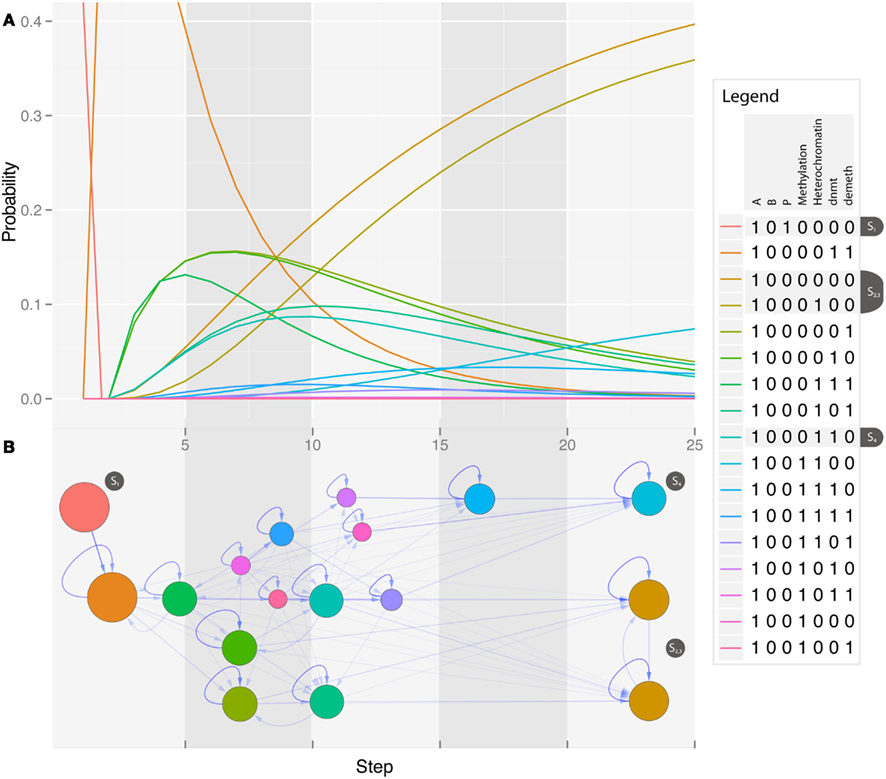
Figure 5. Dynamics (A) and state space (B) of the pluripotency module during overexpression of differentiation factors. The network quickly leaves the pluripotent state and passes across a number of transient states into two different attractors. The node in blue (lower right) is a point attractor in the completely differentiated state and the nodes in brown are part of a cyclic attractor consisting of the unmethylated state in either a euchromatin or heterochromatin structure.
All modules are stable if their respective genes are the only ones expressed and there are no further disturbances. The behavior of the modules A and B in the unperturbed state is very similar to the pluripotency module P, but they are also more stable when perturbed. If one of the other non-pluripotency modules is switched on – or over-expressed – the genes of the module are repressed, but not irreversibly silenced. The gene is silenced quickly, and the chromatin state changes to heterochromatin. But this state cannot be stabilized by the formation of methylated DNA and is therefore dynamically changing and after a few steps it reaches an equilibrium (Figure 6B).
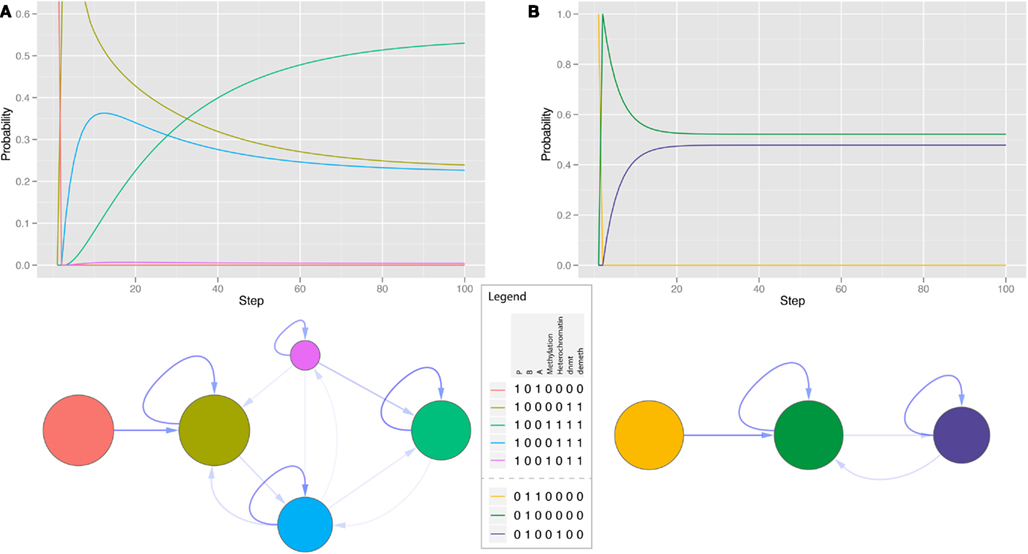
Figure 6. Dynamics and state space of single modules of differentiation regulators. (A) Time course of a differentiation module with the constant activation of the pluripotency genes included. Methylation and demethylation are activated, the module’s genes are silenced and the model reaches an equilibrium in a hyperdynamic state switching between open and closed chromatin and varying DNA methylation. (B) Overexpression of another differentiation module leads to silencing of the gene, but does not enable methylation changes.
The response of the differentiation modules A and B is different for overexpression of pluripotency genes. If in a module of differentiation the pluripotency genes are over-expressed – a situation comparable to simplified reprogramming – the module’s epigenetic factors enter a hyperdynamic state while its gene expression is repressed (Figure 6A). This state has been observed in differentiation genes in pluripotent cells (Niwa, 2007). The active methylation factors enable changes in DNA methylation states and in the equilibrium state there is a relatively high probability to be in a methylated state for the module A. If the signal is switched off after some time the system will not return to the start state completely, but will be locked in non-physiological undesired states where no genes are expressed anymore.
Overexpression of reprogramming factors has a strong effect on other modules, that can already be witnessed in this small sub-model. The question remains why the efficiency of reprogramming is so low when it seems to work so quickly and effectively in single modules. To tackle that question, we need to combine the single modules A, B, and P to a model of the different competing networks in the cell and we also need to introduce the reprogramming factors module E and its very own regulation to the system.
Changing key parameters of the system we will clarify which alterations have the strongest effects on the systems behavior. For example changing the probabilities of either changes in DNA methylation or chromatin remodeling has very different effects on the outcome of simulations.
3.3 Stable Cell States and Differentiation of Combined Modules
When combining the single modules to a more complex model of two differentiated states and the pluripotency network (A, B, P model; Figure 1 without the exogenous factors), we see more complex dynamics of state transitions. Gene expression in each module is mutually exclusive with all other modules and a module that is shut off once can only be activated by an external signal combined with epigenetic activation. The steady state of the pluripotency module consists of a number of different states, that represent the hyperdynamic characteristics in epigenetic factors of the pluripotent cells (Meshorer et al., 2006). These states have different probabilities to differentiate, depending on the current epigenetic configuration. Similar kinds of population differences have been shown for pluripotent cells and the expression of NANOG (Kalmar et al., 2009).
Since we already include three different levels of regulation in our model, we refrain from adding detailed signaling pathways to the system to regulate differentiation. We simulate differentiation by simply activating the gene expression of gene module A with a certain probability. This causes the system to leave the pluripotent state very fast. After about 300 time steps it reaches its steady state with the differentiated state being the main attractor (Figure 2A). The system also reaches a state, in which all proteins are unexpressed. This state is reached because the differentiation signal is strongly simplified and does not guarantee the correct timing of events. If the pluripotency genes are switched off before the correct methylation pattern is in place, differentiation related genes may not yet be properly expressed while pluripotency genes and thus de novo DNA methylation and pluripotency related DNA demethylation mechanisms are already silenced. This behavior could be prevented by a proper regulation of gene expression by signaling molecules.
Nonetheless, de-regulation occurs in biological systems as well, caused by, i.e., transcriptional noise, epigenetic variability, or external factors. The undefined cell state could be identified with cell death or other fatal events caused by the introduction of the stimulus. Despite the simplicity of the mechanism we use, the model differentiates very quickly and produces stable differentiated cell lines.
3.4 Integrating Reprogramming Factors
To analyze reprogramming, we combined the four single modules, i.e., the retroviral transcription factors E, the endogenous pluripotency genes P, and the two model cell lineages A and B into one model (Figure 1). We simulated the model in a Markov simulation for various starting distributions and systematically analyzed the temporal dynamics of the model for typical start scenarios.
First, we analyzed the situation in which the system is initialized with only one defined state that corresponds to either one of the two cell lineages A and B, i.e., the state, where the set of master regulator genes associated with lineage A is expressed, unmethylated, and in an open chromatin configuration, while the module for lineage B and for exogenous (E) and endogenous (P) pluripotency genes has the opposite configuration, meaning the genes are downregulated, methylated, and in a closed chromatin formation. For this specific start state, the network remains in its differentiated cell lineage over the complete time of simulation, i.e., the defined cell lineage is stable without any outer perturbation (data not shown).
Second, when the simulation starts from a state that corresponds to the fully reprogrammed cells, i.e., where module P has the active configuration, while the other modules are silenced, we observe a shift of states into states which are closely related (visualized by their proximity to the pluripotency state in the epigenetic landscape) to the pluripotency state. This behavior can be observed in iPSCs and ESCs as well and is often referred to as a hyperdynamic plasticity. The cells have a fast changing chromatin structure in general and different methylation states on several loci (Meshorer et al., 2006). This plasticity leads to a distribution across different states in our model as there is no single point attractor. This effect may also be responsible for the priming of iPSCs to quickly differentiate into various different cell types upon external signals (Ang et al., 2011), as we also observe states that can more easily differentiate than the defined pluripotent state.
The third focus of our simulation was the model starting in the sharp states of the differentiated cell lineages when the retroviral transcription factors are expressed, unmethylated, and in open chromatin. These simulations can be related to classical direct reprogramming. As shown in Figure 2B, the starting state will be left quickly for transient states that lie along the path to pluripotent cells. When analyzing the landscape it becomes clear that cells will transit into states that resemble pluripotent cells more and more until they eventually reach the fully reprogrammed state with a certain probability. This probability can be considered as the reprogramming efficiency that increases with time (or cell cycles) as demonstrated before by Hanna et al. (2009). The state space of the simulation (Figure 3) reveals further details about the timing and order of the states that are passed on the way to reprogrammed cells. Since we are dealing with a model of 14 variables, the whole state space has 214 states and since we use a probabilistic approach it could in theory be fully connected, i.e., every node of the state space could possibly have 214 outgoing and incoming edges. Therefore we only show those states that can be reached from our starting state, and reach a probability larger than 0.0001 in the course of the simulation. These most relevant states are the ones that some cells will probably pass during the process of becoming iPS cells. Surprisingly these states clearly show different events that are crucial in the reprogramming process and resemble the order of events described in the literature (Papp and Plath, 2011). We simulated the model over 500 time steps, until it came close to a steady state of probabilities. The states that have the highest probability to be reached in the beginning (time steps ∼1 − 100) show a slow unpacking of the pluripotency genes, but about 10% also show modifications to the genes in the other lineage. After this stage all cells can enter the next phase which lasts for about 150 time steps. Nearly all states in this phase share the property that the differentiation genes are already shut down, but endogenous pluripotency genes are still silenced. From this stage there is a non-negligible possibility that the cells enter a non-functional state where nothing is expressed anymore, and which cannot be left. This state creates a small attractor that prevents the cells from successful reprogramming. The phase that follows with a much higher probability is the first stage of reprogrammed states. Cells in this state have been characterized as class I iPS cells (Niwa, 2007; Mikkelsen et al., 2008), as they express the endogenous pluripotency genes, but also still express the exogenous reprogramming cocktail that is not epigenetically silenced yet. From these states there is a slow transition to the states with a stable silencing of the exogenous factors expression of pluripotency genes, and a hyperdynamic state in the differentiation modules. Cells reaching one of these states can have taken any existing path through the state space. In the visualized subspace, which makes up about half of the states reachable from the start state, there are 146 states and 2473 edges with only one connected component. As there are so many possibilities, the probability for each path is infinitesimally small. The most probable single path from the start state to the iPS state only has a probability of 9.3 × 10⁻¹² and consists of 7 state transitions. When looking at the state space structure it becomes obvious that the phases described above cluster together in the graph and that some states are much more central to the transition than others. Most states are not essential to the reprogramming, since there are nearly always paths that can avoid them. But there is one transition that is absolutely essential for reprogramming. This is the transient activation of the pluripotency module relatively early in the process after removal of their methylation marks. This enables the suppression of the differentiation genes and enables further reprogramming.
At the end of the process there is a large probability that cells are in the reprogrammed state. This corresponds to the findings by (Hanna et al., 2009), who showed that in a drug inducible reprogramming system all cells are able to reprogram given enough time.
As illustrated by the most probable path, not all of the described phases will be passed by all cells. There is often the probability of shortcuts like the one shown. In cells with a demethylation of all modules in an early phase, the pluripotency genes can be activated much faster compared to the rest.
As described in the materials and methods section, when looking at cell populations even of defined cell lineages, we are always dealing with a distribution of slightly different cells which can or cannot express certain factors and whose chromatin and methylation structure might be slightly different. Due to this fact, it might be more appropriate to characterize start distributions rather than sharp start states. We already described above how these distributions are generated. Interestingly, when starting in these distributions for differentiated cell lineages, in the absence of the retroviral genes we can observe a maintenance of a distribution around the differentiated state which accounts for stable cell lineages. When simulated from a distribution of states around the pluripotent state P the system also reaches the hyperdynamic state distribution mentioned above. However, we have to make sure that the retroviral genes are silenced because their expression ultimately results in reprogramming (Figure 7).
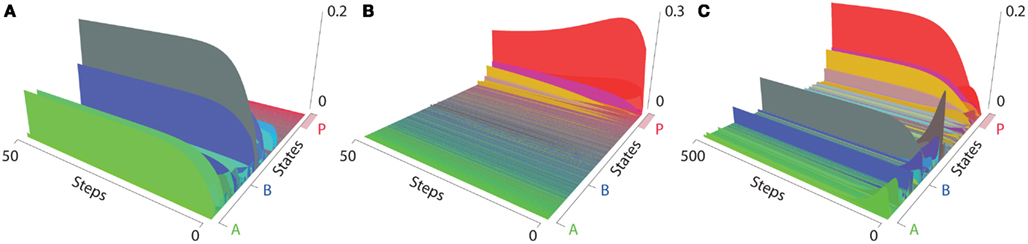
Figure 7. Epigenetic landscapes of start distributions (64 states). (A) Distribution around the differentiated state B without reprogramming factors. The start states converge into just a few remaining states. The differentiated states and the non-expressing states being the highest. (B) A distribution around the pluripotent state. (C) A simulation starting from a distribution around the differentiated state B with active reprogramming factors.
3.5 Parameter Variations of the Model
In order to analyze the stability of our model and its behavior upon parameter variation, we varied the strength of the epigenetic modifications, i.e., DNA methylation and chromatin changes. We defined a parameter range including the parameters of our main model, a decreased and an increased probability of changes in methylation and heterochromatin formation and analyzed the effect on the reprogramming efficiency (Figure 8). Interestingly, we can observe that in the time range of 2000 time steps our main model nearly seems to have a maximal saturation for its reprogramming efficiency which is only very slightly surpassed by increasing the probability for euchromatin formation. This increase could experimentally be reached through a heterochromatin formation inhibiting agent such as VPA (Section 1; Table 3).
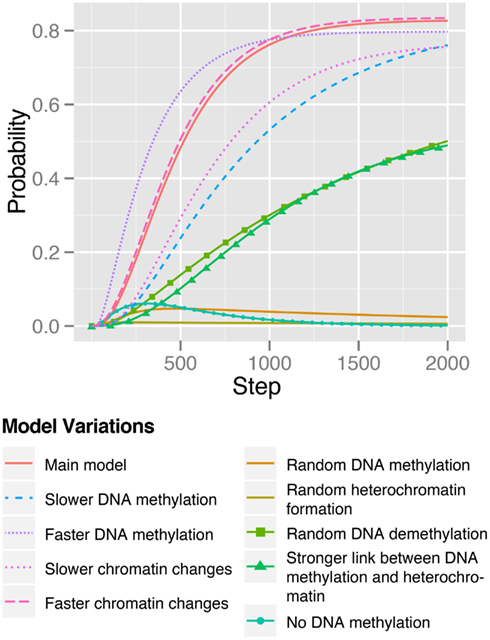
Figure 8. Reprogramming efficiencies of the model variants. Efficiency is plotted as the sum of probabilities of all states that are closely connected to pluripotency.
However, the reprogramming timing can obviously be influenced by parameter variations. While an increase in methylation dynamics, i.e., faster demethylation, speeds up the reprogramming process with a reprogramming efficiency peaking at approximately 0.8 after 2000 time steps, we observe slower reprogramming for increased probabilities of heterochromatin formation and DNA methylation.
3.6 Structural Modifications of the Model
To check the sensitivity of the model to structural modifications and how its behavior corresponds to responses of reprogramming cells in reality, we searched the literature for various experiments that can be mimicked by slight modifications (Table 3).
In the following sections we describe such modifications and their effects on the reprogramming process with a focus on efficiency.
3.6.1 Spontaneous methylation
Since the exact mechanism of action of DNMTs in DNA methylation is still not fully understood, we modified the model to include spontaneous methylation. Hence, we introduced an interaction that accounts for methylation of the different modules by dnmt independently of other factors with a certain probability.
We found that in comparison to the original model, there was an overall decrease in the reprogramming efficiency, i.e., the steady state probability is approximately 10 times lower than in the original model after 500 time steps. However, the spontaneous methylation model reaches its steady state distribution slightly faster. Another interesting feature of the spontaneous methylation model is the fact, that it reaches a new specific state with a high probability. In this state, which we will call the undefined state, all modules are silenced except for the retroviral ones. We will discuss this state below.
3.6.2 Spontaneous heterochromatin formation
Similar to DNA methylation, the exact mechanisms of chromatin modifications are still a matter of debate. In our model, introducing spontaneous formation of heterochromatin as an independent term is a general de-regulation of these mechanisms, that could happen during reprogramming due to factor induction.
Even more pronounced than in the spontaneous methylation model, the steady state reprogramming efficiency is more than 40 times lower than in the main model. However, interestingly, in the first 50 time steps the probability to be in a reprogrammed state is higher than in the original or the methylation model and it is only at later time points that this changes. This may be due to the fact that the differentiation related state is downregulated much faster (results not shown). As in the methylation model, the undefined state mentioned above is also attained with a high probability.
3.6.3 Spontaneous demethylation
In contrast to DNA methylation and chromatin modifications, which have been in the focus of research for many years already, active DNA demethylation has long remained in the dark until recent discoveries have unraveled a new perspective. Thus, DNA demethylation seems possible via the intermediate 5-hydroxymethylcytosine and different enzyme driven modifications which transform it back to unmethylated cytosine (Bhutani et al., 2011). To account for uncertainty in spontaneous demethylation, we transformed the modules of the model in order to be able to randomly lose their methylation with a certain probability.
Of all our model variants, spontaneous demethylation reaches the highest reprogramming efficiency after 500 time steps although it is still 3–4 times lower than in the original model. Interestingly, this model variant shows a slightly different behavior than the two previous ones. Although its reprogramming efficiency stands back behind the original model in every time point, its differentiated state shows a fast decrease at the beginning, followed by a much longer second phase of slow decay very similar, in fact, to the reprogramming experiment of the original model (Figure 8).
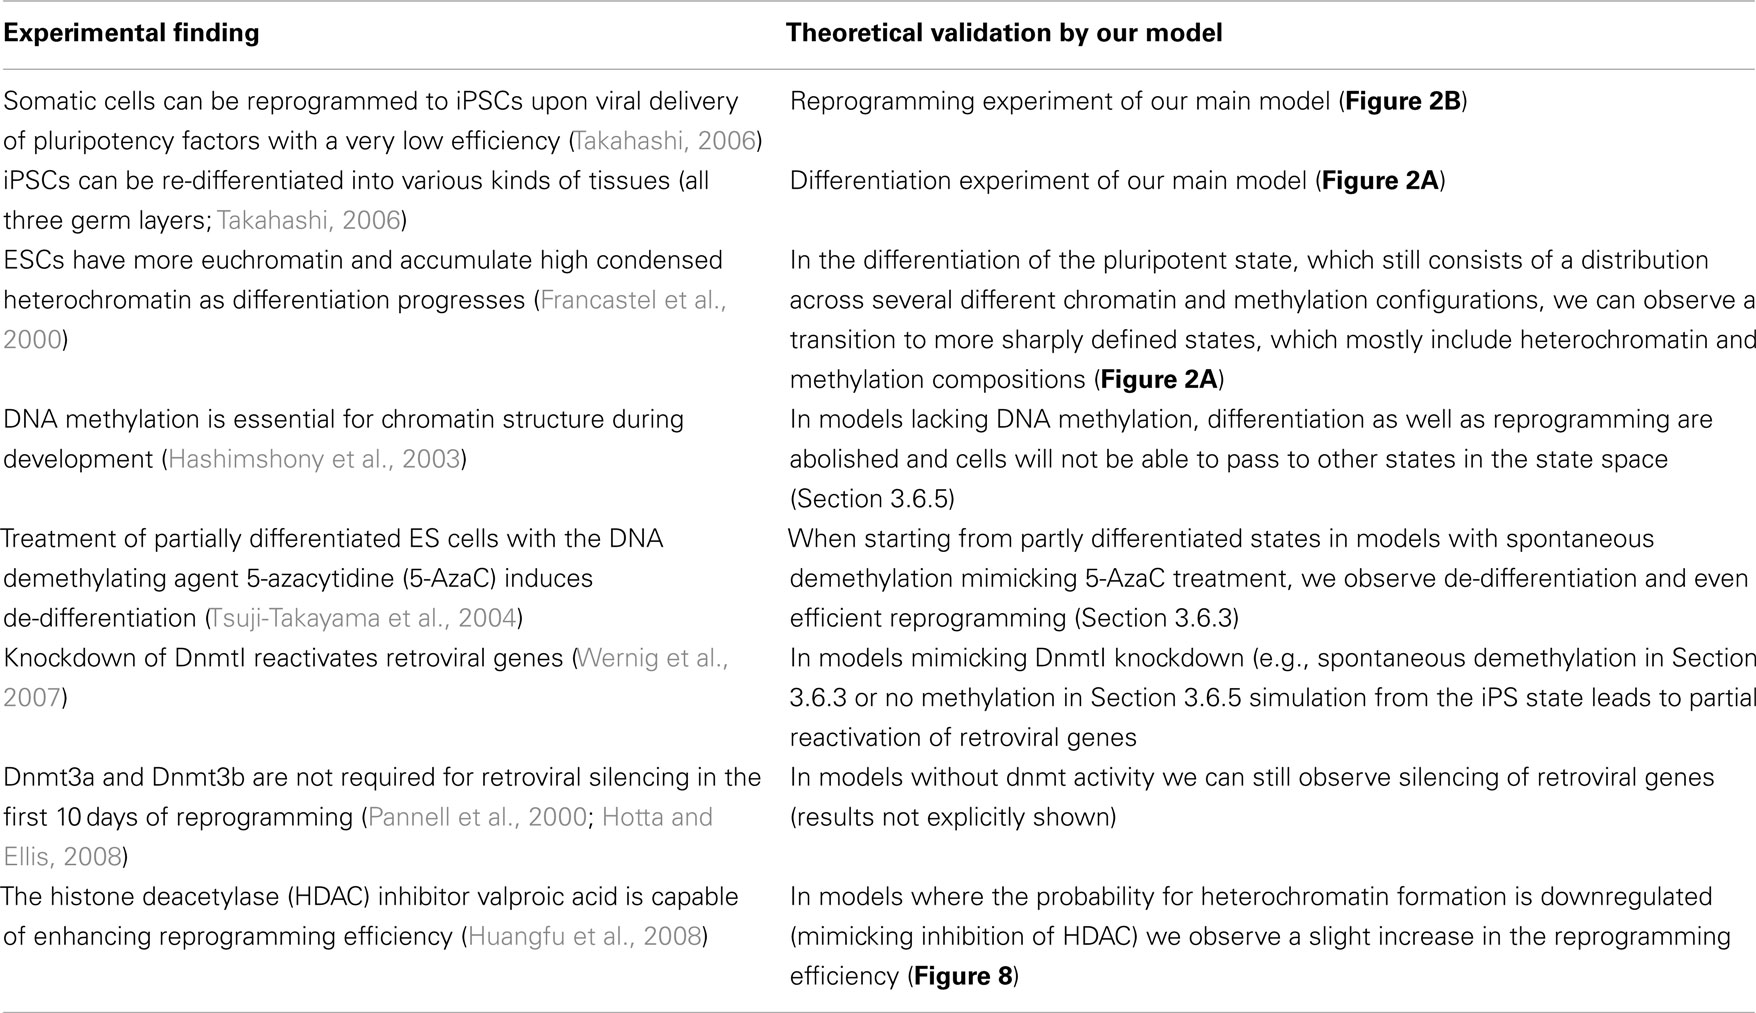
Table 3. Experimental findings from literature compared to simulation results.
3.6.4 Stronger interaction between methylation and heterochromatin
We analyzed the effects of the debated interaction between methylation and chromatin formation which we described above and in Table 2. The overall reprogramming efficiency after 500 time steps was approximately reduced by the factor 5. The dynamics of the differentiated state are very similar to the ones of the original model although it decreases even slower and remains with a higher probability at the end. Interestingly, another state is reached with a high probability, which is very similar to the differentiated state of the other cell lineage, except that the pluripotency module is already demethylated and in an open chromatin formation but still not expressed. This state is transiently present with a high probability which slightly decreases though over time. This phenomenon could be interpreted as trans-differentiation during reprogramming without passing the pluripotency state (Vierbuchen et al., 2010).
3.6.5 No methylation
In a model variant, where methylation has no influence on gene expression or heterochromatin formation we observe a very different behavior than in all the models before. In fact, without methylation effects, the model is neither able to reprogram anymore nor to differentiate. What we can observe instead is a re-distribution of the different start states, i.e., the pluripotency related or the differentiation related states, into very close similar states but no transition to any states that are further away in the state space. This is most likely due to the fact that methylation is needed in the long run to determine the heterochromatin structure after cell division and to fully silence gene expression. Without these features active modules cannot be silenced and thus inactive modules stay transcriptionally inhibited although they might be demethylated and in an open chromatin structure.
3.6.6 Polycomb repressor complexes (PRCs)
In an attempt to model the mechanisms of Polycomb repressor complexes (PRCs) described in Table 3 we introduced a positive interaction into the equation for heterochromatin formation depending on the pluripotency genes. In other words, the pluripotency genes directly promote heterochromatin formation of differentiation related genes, i.e., our lineage master regulators. Simulation and analysis of that particular model yielded a very similar result to the main model, which is probably due to the fact that the mutual transcriptional repression between our modules describes a very similar effect. Since this mechanism does not seem to significantly improve our model we decided to leave that interaction out.
3.6.7 Summary
The effects of the analyzed model variants on the reprogramming efficiency are summarized in Figure 8. For every model variant the reprogramming efficiency increases over time except for the model without methylation. What becomes apparent at first sight is that obviously all model variants seem to have a strongly decreased reprogramming efficiency after 2000 timesteps.
Overall, we find, that all variants resulted in de-regulating modifications of the original model, i.e., modifications that reduced the level of tight regulation of the epigenetic processes involved, which in turn have a direct effect on the expression of important genes. In the landscape of these model variants (which are not shown here), we could observe a general transition from a few defined states, that could be reached in the original model, to a strongly increased number of states. In the original model, we can reach a total of 2592 states after 500 time steps in a reprogramming simulation, while the spontaneous methylation model variant could reach 10,240 states in the same time. However, the efficiency of reprogramming was approximately 10 times lower (Figure 8) in the spontaneous methylation model. The 366 reached pluripotency related states in both models are the same except for their probability to be reached after 500 timesteps.
Discussion
In this study we developed, to our knowledge, the first model of processes in somatic cell reprogramming that explicitly includes the virally transduced factors and their regulatory interactions. The model is also unique in its representation of the different epigenetic factors that regulate cell states and their interactions. Our modeling approach qualitatively reproduces experimental results from reprogramming as well as differentiation experiments. The probabilistic Boolean state space in combination with the epigenetic landscape plots of the simulations gives insights into different possible ways which reprogramming cells take in this scenario. Combined these visualizations can be related to the potential landscapes that have been developed for continuous modeling approaches. They show the direction the system is moving toward as well as the probability for each state to be reached under specific conditions. The stategraph also makes it possible to identify different phases during reprogramming that are important milestones. These simulation phases are coherent with the sequence of events reported in many experiments.
The reprogramming efficiency of the system seems high (p = 0.8 after 2000 time steps) compared to experimental results from transduction experiments, but one has to keep in mind that the model leaves out major experimental hurdles and regulatory mechanisms. We neither include immune response of cells nor varying transduction rates. The general efficiency shows a similar behavior to experiments done in inducible stem cell systems, which also showed sigmoidal efficiency curves with saturation at high levels. After a long simulation time we reach a high steady state of reprogrammed cells in a relatively broad distribution of states. Nevertheless, this high reprogramming rate indicates that there are mechanisms not included in our model that are suppressing reprogramming in differentiated cell.
Differentiation in our model is also possible and happens a lot faster than reprogramming, although it is impaired by the lack of regulatory factors. In order to improve the representation of the course of differentiating cells the model would need to be extended by signaling pathways. This would enable a more precise modulation of the activity of the important model components and would moreover enable the system to sense the influence of external factors. Another interesting extension of the model would consist in the integration of further branches of differentiation for other cell lineages to depict the path from stem cells over progenitors to fully differentiated cells. These extensions are simplified by the modular structure of our model.
The model is very much centered on the mutual inhibition of master transcription factors and their connection to epigenetic factors, which is an important mechanism, but other regulatory processes, not captured by this approach, certainly play crucial roles during phenotype transitions. Cell types are generally viewed as different steady states of gene regulatory networks. This is reflected in the model by various attractors that represent different cell types. Nevertheless it does not account for cell types that express a mixture of regulatory genes, as for example progenitor cells would. These states can occur as cyclic attractors, but are unstable to stochastic perturbations and are therefore left quickly.
Because the model is very abstract, predictions cannot aim to completely reflect biological reality, but they can show trends and general effects that hold true for the modeled entities. The modifications we introduced show how the system reacts to perturbations in the epigenetic regulations. Most of the structural changes showed a devastating effect on the reprogramming efficiency, demonstrating the need of tight regulation of the process. The only two modifications, in which efficiency can be sustained at an adequate level, are those that increase the influence of the gene regulatory networks on the epigenetic factors.
Improvements of the reprogramming efficiency can only be achieved by two modifications. First, higher probabilities for changes in DNA methylation status lead to a faster increase of the reprogrammed cells, but also to a lower probability in the steady state. Therefore a de-regulation can have beneficial effects on the process, but also has drawbacks. Higher probabilities for changes in chromatin state lead to a mild increase in efficiency, resembling the effects of small molecules like VPA.
A better understanding of the underlying processes of somatic cell reprogramming is the key to a clinical application of iPS cells in the future. The proposed model, although very abstract and limited, goes a step into this direction. It outlines the possible epigenetic regulations that play a role in reprogramming, elucidates their connections, and partly explains experimental observations in reprogramming although it ignores large parts of the complex gene regulatory network of developmental genes.
Conflict of Interest Statement
The authors declare that the research was conducted in the absence of any commercial or financial relationships that could be construed as a potential conflict of interest.
References
Adewumi, O., Aflatoonian, B., and Ahrlund-Richter, L. (2007). Characterization of human embryonic stem cell lines by the International Stem Cell Initiative. Nature 25, 803–816.
Ang, Y.-S., Gaspar-Maia, A., Lemischka, I. R., and Bernstein, E. (2011). Stem cells and reprogramming: breaking the epigenetic barrier? Trends Pharmacol. Sci. 32, 394–401.
Artyomov, M., Meissner, A., and Chakraborty, A. (2010). A model for genetic and epigenetic regulatory networks identifies rare pathways for transcription factor induced pluripotency. PLoS Comput. Biol. 6, e1000785. doi:10.1371/journal.pcbi.1000785
Bhattacharya, S., Zhang, Q., and Andersen, M. E. (2011). A deterministic map of Waddington’s epigenetic landscape for cell fate specification. BMC Syst. Biol. 5, 85. doi:10.1186/1752-0509-5-85
Boyer, L. A., Lee, T. I., Cole, M. F., Johnstone, S. E., Levine, S. S., Zucker, J. P., Guenther, M. G., Kumar, R. M., Murray, H. L., Jenner, R. G., Gifford, D. K., Melton, D. A., Jaenisch, R., and Young, R. A. (2005). Core transcriptional regulatory circuitry in human embryonic stem cells. Cell 122, 947–956.
Cedar, H., and Bergman, Y. (2009). Linking DNA methylation and histone modification: patterns and paradigms. Nat. Rev. Genet. 10, 295–304.
Chang, R., Shoemaker, R., and Wang, W. (2011). Systematic search for recipes to generate induced pluripotent stem cells. PLoS Comput. Biol. 7, e1002300. doi:10.1371/journal.pcbi.1002300
Chavez, L., Bais, A., Vingron, M., Lehrach, H., Adjaye, J., and Herwig, R. (2009). In silico identification of a core regulatory network of OCT4 in human embryonic stem cells using an integrated approach. BMC Genomics 10, 314. doi:10.1186/1471-2164-10-314
Chickarmane, V., and Peterson, C. (2008). A computational model for understanding stem cell, trophectoderm and endoderm lineage determination. PLoS ONE 3, e3478. doi:10.1371/journal.pone.0003478
Chickarmane, V., Troein, C., and Nuber, U. (2006). Transcriptional dynamics of the embryonic stem cell switch. PLoS Comput. Biol. 2, e123. doi:10.1371/journal.pcbi.0020123
Djuric, U., and Ellis, J. (2010). Epigenetics of induced pluripotency, the seven-headed dragon. Stem Cell Res. Ther. 1, 3.
Dodd, I. B., Micheelsen, M. A., Sneppen, K., and Thon, G. (2007). Theoretical analysis of epigenetic cell memory by nucleosome modification. Cell 129, 813–822.
Duff, C., Smith-Miles, K., Lopes, L., and Tian, T. (2012). Mathematical modelling of stem cell differentiation: the PU.1-GATA-1 interaction. J. Math. Biol. 64, 449–468.
Epsztejn-Litman, S., Feldman, N., Abu-Remaileh, M., Shufaro, Y., Gerson, A., Ueda, J., Deplus, R., Fuks, F., Shinkai, Y., Cedar, H., and Bergman, Y. (2008). De novo DNA methylation promoted by G9a prevents reprogramming of embryonically silenced genes. Nat. Struct. Mol. Biol. 15, 1176–1183.
Francastel, C., Schuebeler, D., Martin, D. I., and Groudine, M. (2000). Nuclear compartmentalization and gene activity. Nat. Rev. Mol. Cell Biol. 1, 137–143.
Fuks, F., Burgers, W. A., Brehm, A., Hughes-Davies, L., and Kouzarides, T. (2000). DNA methyltransferase Dnmt1 associates with histone deacetylase activity. Nat. Genet. 24, 88–91.
Garg, A., Mohanram, K., Di Cara, A., De Micheli, G., and Xenarios, I. (2009). Modeling stochasticity and robustness in gene regulatory networks. Bioinformatics 25, i101–i109.
Halley, J. D., Burden, F. R., and Winkler, D. A. (2009). Stem cell decision making and critical-like exploratory networks. Stem Cell Res. 2, 165–177.
Hanna, J., Saha, K., Pando, B., van Zon, J., Lengner, C. J., Creyghton, M. P., van Oudenaarden, A., and Jaenisch, R. (2009). Direct cell reprogramming is a stochastic process amenable to acceleration. Nature 462, 595–601.
Hashimshony, T., Zhang, J., Keshet, I., Bustin, M., and Cedar, H. (2003). The role of DNA methylation in setting up chromatin structure during development. Nat. Genet. 34, 187–192.
Hawkins, R. D., Hon, G. C., Lee, L. K., Ngo, Q., Lister, R., Pelizzola, M., Edsall, L. E., Kuan, S., Luu, Y., and Klugman, S. (2010). Distinct epigenomic landscapes of pluripotent and lineage-committed human cells. Cell Stem Cell 6, 479–491.
Hong, H., Takahashi, K., Ichisaka, T., Aoi, T., Kanagawa, O., Nakagawa, M., Okita, K., and Yamanaka, S. (2009). Suppression of induced pluripotent stem cell generation by the p53-p21 pathway. Nature 460, 1132–1135.
Hotta, A., and Ellis, J. (2008). Retroviral vector silencing during iPS cell induction: an epigenetic beacon that signals distinct pluripotent states. J. Cell. Biochem. 105, 940–948.
Huang, S., Guo, Y.-P., May, G., and Enver, T. (2007). Bifurcation dynamics in lineage-commitment in bipotent progenitor cells. Dev. Biol. 305, 695–713.
Huangfu, D., Maehr, R., Guo, W., Eijkelenboom, A., Snitow, M., Chen, A. E., and Melton, D. A. (2008). Induction of pluripotent stem cells by defined factors is greatly improved by small-molecule compounds. Nat. Biotechnol. 26, 795–797.
Ichida, J. K., Blanchard, J., Lam, K., Son, E. Y., Chung, J. E., Egli, D., Loh, K. M., Carter, A. C., Di Giorgio, F. P., Koszka, K., Huangfu, D., Akutsu, H., Liu, D. R., Rubin, L. L., and Eggan, K. (2009). A small-molecule inhibitor of Tgf-[beta] signaling replaces Sox2 in reprogramming by inducing NANOG. Cell Stem Cell 5, 491–503.
Ivanova, N., Dobrin, R., Lu, R., Kotenko, I., Levorse, J., DeCoste, C., Schafer, X., Lun, Y., and Lemischka, I. R. (2006). Dissecting self-renewal in stem cells with RNA interference. Nature 442, 533–538.
Kalmar, T., Lim, C., Hayward, P., Muñoz-Descalzo, S., Nichols, J., Garcia-Ojalvo, J., and Arias, A. M. (2009). Regulated fluctuations in NANOG expression mediate cell fate decisions in embryonic stem cells. PLoS Biol. 7, e1000149. doi:10.1371/journal.pbio.1000149
Kauffman, S. (2004). A proposal for using the ensemble approach to understand genetic regulatory networks. J. Theor. Biol. 230, 581–590.
Kawamura, T., Suzuki, J., Wang, Y. V., Menendez, S., Morera, L. B., Raya, A., Wahl, G. M., and Belmonte, J. C. I. (2009). Linking the p53 tumour suppressor pathway to somatic cell reprogramming. Nature 460, 1140–1144.
Laurent, L., Wong, E., Li, G., Huynh, T., Tsirigos, A., Ong, C. T., Low, H. M., Kin Sung, K. W., Rigoutsos, I., Loring, J., and Wei, C.-L. (2010). Dynamic changes in the human methylome during differentiation. Genome Res. 20, 320–331.
Li, E., Bestor, T. H., and Jaenisch, R. (1992). Targeted mutation of the DNA methyltransferase gene results in embryonic lethality. Cell 69, 915–926.
Liang, J., Wan, M., Zhang, Y., Gu, P., Xin, H., Jung, S. Y., Qin, J., Wong, J., Cooney, A. J., Liu, D., and Songyang, Z. (2008). NANOG and oct4 associate with unique transcriptional repression complexes in embryonic stem cells. Nat. Cell Biol. 10, 731–739.
Lister, R., Pelizzola, M., Dowen, R. H., Hawkins, R. D., Hon, G., Tonti-Filippini, J., Nery, J. R., Lee, L., Ye, Z., Ngo, Q.-M., Edsall, L., Antosiewicz-Bourget, J., Stewart, R., Ruotti, V., Millar, A. H., Thomson, J. A., Ren, B., and Ecker, J. R. (2009). Human DNA methylomes at base resolution show widespread epigenomic differences. Nature 462, 315–322.
Lister, R., Pelizzola, M., Kida, Y. S., Hawkins, R. D., Nery, J. R., Hon, G., Antosiewicz-Bourget, J., O’Malley, R., Castanon, R., Klugman, S., Downes, M., Yu, R., Stewart, R., Ren, B., Thomson, J. A., Evans, R. M., and Ecker, J. R. (2011). Hotspots of aberrant epigenomic reprogramming in human induced pluripotent stem cells. Nature 471, 68–73.
Loh, Y.-H., Wu, Q., Chew, J.-L., Vega, V. B., Zhang, W., Chen, X., Bourque, G., George, J., Leong, B., Liu, J., Wong, K.-Y., Sung, K. W., Lee, C. W. H., Zhao, X.-D., Chiu, K.-P., Lipovich, L., Kuznetsov, V. A., Robson, P., Stanton, L. W., Wei, C.-L., Ruan, Y., Lim, B., and Ng, H.-H. (2006). The Oct4 and NANOG transcription network regulates pluripotency in mouse embryonic stem cells. Nat. Genet. 38, 431–440.
MacArthur, B., and Please, C. (2008). Stochasticity and the molecular mechanisms of induced pluripotency. PLoS ONE 3, e3086. doi:10.1371/journal.pone.0003086
MacArthur, B. D., Please, C. P., and Oreffo, R. O. C. (2008). Stochasticity and the molecular mechanisms of induced pluripotency. PLoS ONE 3, e3086. doi:10.1371/journal.pone.0003086
Macía, J., Widder, S., and Solé, R. (2009). Why are cellular switches Boolean? General conditions for multistable genetic circuits. J. Theor. Biol. 261, 126–135.
Mah, N., Wang, Y., Liao, M.-C., Prigione, A., Jozefczuk, J., Lichtner, B., Wolfrum, K., Haltmeier, M., Flöttmann, M., Schaefer, M., Hahn, A., Mrowka, R., Klipp, E., Andrade-Navarro, M. A., and Adjaye, J. (2011). Molecular insights into reprogramming-initiation events mediated by the OSKM gene regulatory network. PLoS ONE 6, e24351. doi:10.1371/journal.pone.0024351
Marión, R. M., Strati, K., Li, H., Murga, M., Blanco, R., Ortega, S., Fernandez-Capetillo, O., Serrano, M., and Blasco, M. A. (2009). A p53-mediated DNA damage response limits reprogramming to ensure iPS cell genomic integrity. Nature 460, 1149–1153.
Meshorer, E., Yellajoshula, D., George, E., Scambler, P. J., Brown, D. T., and Misteli, T. (2006). Hyperdynamic plasticity of chromatin proteins in pluripotent embryonic stem cells. Dev. Cell 10, 105–116.
Mikkelsen, T. S., Hanna, J., Zhang, X., Ku, M., Wernig, M., Schorderet, P., Bernstein, B. E., Jaenisch, R., Lander, E. S., and Meissner, A. (2008). Dissecting direct reprogramming through integrative genomic analysis. Nature 454, 49–55.
Monk, M., Adams, R. L., and Rinaldi, A. (1991). Decrease in DNA methylase activity during preimplantation development in the mouse. Development 112, 189–192.
Müssel, C., Hopfensitz, M., and Kestler, H. A. (2010). BoolNet – an R package for generation, reconstruction, and analysis of Boolean networks. Bioinformatics 26, 1378–1380.
Nishimura, S., Takahashi, S., Kuroha, T., Suwabe, N., Nagasawa, T., and Trainor, C. (2000). A GATA box in the GATA-1 gene hematopoietic enhancer is a critical element in the network of GATA factors and sites that regulate this gene. Mol. Cell. Biol. 20, 713–723.
Nishino, K., Toyoda, M., Yamazaki-Inoue, M., Fukawatase, Y., Chikazawa, E., Sakaguchi, H., Akutsu, H., and Umezawa, A. (2011). DNA Methylation Dynamics in Human Induced Pluripotent Stem Cells over Time. PLoS Genet. 7, e1002085. doi:10.1371/journal.pgen.1002085
Niwa, H., Toyooka, Y., Shimosato, D., Strumpf, D., Takahashi, K., Yagi, R., and Rossant, J. (2005). Interaction between Oct3/4 and Cdx2 determines trophectoderm differentiation. Cell 123, 917–929.
Okita, K., Nakagawa, M., Hyenjong, H., Ichisaka, T., and Yamanaka, S. (2008). Generation of mouse induced pluripotent stem cells without viral vectors. Science 322, 949–953.
Okuno, Y., Huang, G., Rosenbauer, F., Erica, K., Radomska, H. S., Iwasaki, H., Akashi, K., Moreau-Gachelin, F., Li, Y., Zhang, P., Tenen, D. G., Okuno, Y., Huang, G., Rosenbauer, F., Evans, E. K., Radomska, H. S., Iwasaki, H., Akashi, K., Moreau-Gachelin, F., and Li, Y. (2005). Potential autoregulation of transcription factor PU. 1 by an upstream regulatory element. Mol. Cell. Biol. 25, 2832–2845.
Ou, J.-N., Torrisani, J., Unterberger, A., Provençal, N., Shikimi, K., Karimi, M., Ekström, T. J., and Szyf, M. (2007). Histone deacetylase inhibitor trichostatin a induces global and gene-specific DNA demethylation in human cancer cell lines. Biochem. Pharmacol. 73, 1297–1307.
Pannell, D., Osborne, C. S., Yao, S., Sukonnik, T., Pasceri, P., Karaiskakis, A., Okano, M., Li, E., Lipshitz, H. D., and Ellis, J. (2000). Retrovirus vector silencing is de novo methylase independent and marked by a repressive histone code. EMBO J. 19, 5884–5894.
Papp, B., and Plath, K. (2011). Reprogramming to pluripotency: stepwise resetting of the epigenetic landscape. Cell Res. 21, 486–501.
Qu, K., and Ortoleva, P. (2008). Understanding stem cell differentiation through self-organization theory. J. Theor. Biol. 250, 606–620.
Ralston, A., and Rossant, J. (2005). Genetic regulation of stem cell origins in the mouse embryo. Clin. Genet. 68, 106–112.
Rekhtman, N., Radparvar, F., Evans, T., Rekhtman, N., Radparvar, F., Evans, T., and Skoultchi, A. I. (1999). Direct interaction of hematopoietic transcription factors PU. 1 and GATA-1: functional antagonism in erythroid cells. Genes Dev. 13, 1398–1411.
Roeder, I., and Glauche, I. (2006). Towards an understanding of lineage specification in hematopoietic stem cells: a mathematical model for the interaction of transcription factors GATA-1 and PU.1. J. Theor. Biol. 241, 852–865.
Shmulevich, I. (2002). Probabilistic Boolean networks: a rule-based uncertainty model for gene regulatory networks. Bioinformatics 18, 261–274.
Takahashi, K. (2006). Induction of pluripotent stem cells from mouse embryonic and adult fibroblast cultures by defined factors. Cell 126, 663–676.
Takahashi, K., Tanabe, K., Ohnuki, M., and Narita, M. (2007). Induction of pluripotent stem cells from adult human fibroblasts by defined factors. Cell 131, 861–872.
Thomson, J. P., Skene, P. J., Selfridge, J., Clouaire, T., Guy, J., Webb, S., Kerr, A. R. W., Deaton, A., Andrews, R., James, K. D., Turner, D. J., Illingworth, R., and Bird, A. (2010). CpG islands influence chromatin structure via the CpG-binding protein Cfp1. Nature 464, 1082–1086.
Tsuji-Takayama, K., Inoue, T., Ijiri, Y., Otani, T., Motoda, R., Nakamura, S., and Orita, K. (2004). Demethylating agent, 5-azacytidine, reverses differentiation of embryonic stem cells. Biochem. Biophys. Res. Commun. 323, 86–90.
Twardziok, S., Siebert, H., and Heyl, A. (2010). “Stochasticity in reactions: a probabilistic boolean modeling approach,” in Computational Methods in Systems Biology (Trento: ACM), 76–85.
Vierbuchen, T., Ostermeier, A., Pang, Z. P., Kokubu, Y., Südhof, T. C., and Wernig, M. (2010). Direct conversion of fibroblasts to functional neurons by defined factors. Nature 463, 1035–1041.
Wang, J., Xu, L., Wang, E., and Huang, S. (2010). The potential landscape of genetic circuits imposes the arrow of time in stem cell differentiation. Biophys. J. 99, 29–39.
Wang, Y., and Adjaye, J. (2010). A cyclic AMP analog, 8-Br-cAMP, enhances the induction of pluripotency in human fibroblast cells. Stem Cell Rev. 7, 331–341.
Wernig, M., Meissner, A., Foreman, R., Brambrink, T., Ku, M., Hochedlinger, K., Bernstein, B. E., and Jaenisch, R. (2007). In vitro reprogramming of fibroblasts into a pluripotent es-cell-like state. Nature 448, 318–324.
Wu, Z., Rosen, E. D., Brun, R., Hauser, S., Adelmant, G., Troy, A. E., McKeon, C., Darlington, G. J., and Spiegelman, B. M. (1999). Cross-regulation of C/EBP alpha and PPAR gamma controls the transcriptional pathway of adipogenesis and insulin sensitivity. Mol. Cell 3, 151–158.
Zhou, H., Wu, S., Joo, J. Y., Zhu, S., Han, D. W., Lin, T., Trauger, S., Bien, G., Yao, S., Zhu, Y., Siuzdak, G., Schöler, H. R., Duan, L., and Ding, S. (2009). Generation of induced pluripotent stem cells using recombinant proteins. Cell Stem Cell 4, 381–384.
Keywords: differentiation and reprogramming, epigenetic landscape, induced pluripotent stem cells, mathematical modeling, probabilistic Boolean network
Citation: Flöttmann M, Scharp T and Klipp E (2012) A stochastic model of epigenetic dynamics in somatic cell reprogramming. Front. Physio. 3:216. doi: 10.3389/fphys.2012.00216
Received: 16 February 2012; Paper pending published: 01 April 2012;
Accepted: 30 May 2012; Published online: 27 June 2012.
Edited by:
Matthew Oberhardt, Tel Aviv University, IsraelReviewed by:
Zhiliang Xu, University of Notre Dame, USAJoseph Xu Xu Zhou, Institute of Systems Biology, USA
Copyright: © 2012 Flöttmann, Scharp and Klipp. This is an open-access article distributed under the terms of the Creative Commons Attribution Non Commercial License, which permits non-commercial use, distribution, and reproduction in other forums, provided the original authors and source are credited.
*Correspondence: Edda Klipp, Department of Biology, Theoretical Biophysics, Humboldt-Universität zu Berlin, Invalidenstraße 42, Berlin D-10115, Germany. e-mail: edda.klipp@rz.hu-berlin.de