
- School of Medical Sciences, Bosch Institute and Sydney School of Medicine, University of Sydney, Sydney, NSW, Australia
Muscle fatigue is the decline in performance of muscles observed during periods of intense activity. ATP consumption exceeds production during intense activity and there are multiple changes in intracellular metabolites which may contribute to the changes in crossbridge activity. It is also well-established that a reduction in activation, either through action potential changes or reduction in Ca2+ release from the sarcoplasmic reticulum (SR), makes an additional contribution to fatigue. In this review we focus on the role of intracellular inorganic phosphate (Pi) whose concentration can increase rapidly from around 5–30 mM during intense fatigue. Studies from skinned muscle fibers show that these changes substantially impair myofibrillar performance although the effects are strongly temperature dependent. Increased Pi can also cause reduced Ca2+ release from the SR and may therefore contribute to the reduced activation. In a recent study, we have measured both Pi and Ca2+ release in a blood-perfused mammalian preparation and the results from this preparation allows us to test the extent to which the combined effects of Pi and Ca2+ changes may contribute to fatigue.
Introduction
Muscle fatigue can be defined as the decline of muscle performance associated with intense muscle activity. Many mechanisms contribute to this decline, from psychological factors within the cortex down to the state of individual proteins inside the muscle. To study mechanisms in detail it is usually necessary to use a simplified preparation and a well-defined pattern of stimulation. One approach has been to use isolated small preparations of muscle and stimulate with intermittent, maximal, isometric tetani; obviously central (cortical) mechanisms do not occur in this preparation and the effects of changes in blood flow are also absent. Another approach is to use human subjects and induce fatigue by maximal or near-maximal contractions repeated regularly. In suitable muscles both force and metabolite changes can be measured simultaneously and repeatedly. Two limitations to this approach are that both the force and the metabolites are usually averaged across a muscle which consists of various fiber types with different properties. In addition the degree of central vs. peripheral fatigue is often uncertain in human subjects. Given the interpretative difficulties of these two approaches, a third approach is of great importance; application of known metabolite changes to skinned muscle preparations. In this preparation, the metabolites are defined and can be changed at will and the fiber type can be determined. Extensive data is available documenting how the performance of the contractile proteins is affected by individual metabolite changes.
In this short review we will (1) discuss the evidence that inorganic phosphate (Pi) contributes to the changes in crossbridge behavior, (2) consider the evidence that phosphate contributes to the reduced Ca2+ release, (3) examine the correlation between force and Pi in fatiguing muscles, and (4) describe a new model of fatigue in which both Pi and intracellular tetanic Ca2+ concentration ([Ca2+]i) can be measured and analyse how these two factors in combination contribute to the force decline. This type of analysis involves many assumptions and can only give a general indication of the magnitude of the contribution that might arise from these sources. It is accepted that many other factors, with both positive and negative effects, contributed to the overall effect.
Many metabolites change in fatigue and a number of them have been shown in skinned fibers to affect the performance of the contractile proteins or Ca2+ release. Historically pH change has been widely considered a major cause of fatigue acting through a reduction in Ca2+ sensitivity (Fabiato and Fabiato, 1978). However, over the last two decades its contribution has been reassessed mainly because the effects of pH on isometric force are much reduced at mammalian body temperatures (Pate et al., 1995). In contrast it seems that acidosis reduces shortening velocity and muscle power at body temperature (Fitts, 2008) so that acidosis may still be of importance in many kinds of fatigue. This reassessment has been documented extensively elsewhere (for review see Westerblad et al., 2002; Cairns, 2006; Cooke, 2007). Other metabolites with probable roles in fatigue include ATP, ADP, PCr, Mg, and reactive oxygen and nitrogen species (Allen et al., 2008b). In addition many proteins display post-translational changes which affect their function, for instance phosphorylation, nitrosylation, and oxidation and the importance of these are starting to emerge (Bellinger et al., 2008; Mollica et al., 2012).
Muscles use ATP as the immediate source of energy but the ADP and Pi produced are regenerated by a series of metabolic pathways which utilize stores of PCr, glycogen, and lipid within the cell. Glycogen within the cell can be utilized by anaerobic glycolysis whose net products are lactate and protons. The metabolic pathways that regenerate ATP are turned on rapidly and tightly regulated so that the net effect is that ATP concentration is only marginally reduced by moderate exercise but there are major increases in Pi, ADP, creatine, and protons while PCr and glycogen decrease. The changes in concentration of ATP, PCr, Pi, and ADP occur in a relatively stereotyped fashion which has been documented in numerous studies (Dawson et al., 1978; Cady et al., 1989; Lanza et al., 2006). Conversely the degree of acidosis observed is more variable because the rate and extent to which anaerobic glycolysis is turned on is dependent on the fiber type and the nature of the activity. Furthermore, skeletal muscle fibers contain variable amounts of the lactate transporter which reduce any intracellular accumulation of lactate and protons.
Phosphate Contributes to the Decline in Crossbridge Performance
Ruegg et al. (1971), working with skinned insect flight muscle, were the first to note that increased Pi inhibited contractile force. This observation was later repeated and extended by many groups working on skinned skeletal muscle (Cooke and Pate, 1985; Millar and Homsher, 1990). These groups demonstrated that, in skinned skeletal muscle at low temperatures (10–20°C), an increase in Pi produced a substantial reduction in both maximum Ca2+-activated force and in Ca2+ sensitivity e.g., Figure 1A from Millar and Homsher (1990). It is generally accepted that this reduction occurs because Pi is released from crossbridges at a stage closely associated with force production so that elevation of phosphate accelerates the backward rate of this step and thus reduces force (Takagi et al., 2004; Cooke, 2007; Fitts, 2008). Cooke and Pate and Millar and Homsher showed that both the reduction of force and the shift of Ca2+ sensitivity were logarithmic functions of Pi. Thus, a 10-fold increase in Pi produced a reduction in maximum Ca2+-activated force to 63% and a reduction of Ca2+ sensitivity of 0.2 pCa units (Millar and Homsher, 1990). In order to compare data from skinned fibers with data from intact muscles, we have converted the data in Figure 1A to the relationship between force and Pi (Figure 1B). In mammalian muscles the resting myoplasmic [Pi] is around 5 mM (Kemp et al., 2007; Fitts, 2008) so we have normalized the force to 100% at this [Pi] and compared the relationship at three different pCa (5.8, 5.9, and 6.0) to represent the levels that may occur in near-maximally activated tetani. Even at high Ca2+, the relation between force and Pi declines because of the effect of Pi on maximum Ca2+-activated force and this effect is largest at low Pi and decreases as Pi increases. At lower Ca2+ levels the relationship falls more steeply as the effect of changes in pCa50 (pCa required to give half maximal force) add to the reduced maximum Ca2+-activated force.
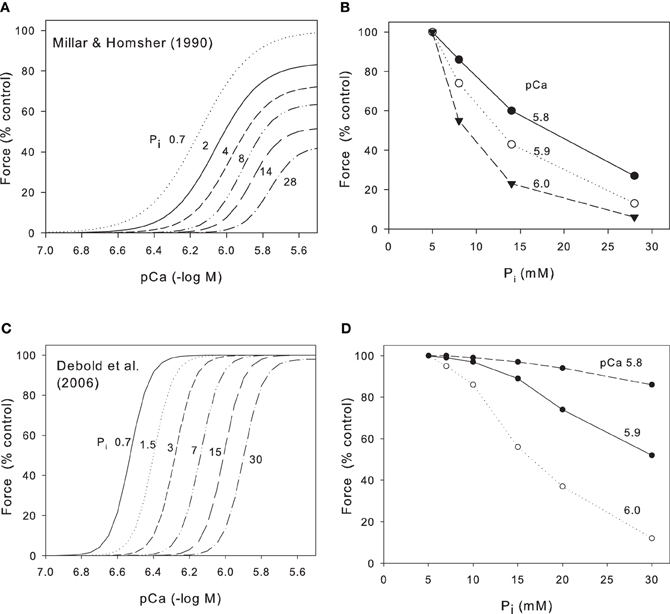
Figure 1. Effect of Pi on relation between pCa and force for skinned skeletal muscle. (A) Data from rabbit psoas muscle at 10°C (Millar and Homsher, 1990). Ca2+ concentrations have been adjusted for the excessively high Ca2+ EGTA binding constant used in this study. Pi concentrations (mM) as indicated on Panel. Note large fall in maximum Ca2+-activated force under these conditions. (B) Data from Millar and Homsher replotted to show how force falls as a function of Pi at various pCa levels. (C) Data from fast gastrocnemius muscle at 30°C (Debold et al., 2006). Published data were at 0.7 mM (no added Pi) and 30 mM Pi; we have interpolated curves on the basis that pCa50 is a logarithmic function of Pi. Note the absence of significant effect of Pi on maximum Ca2+-activated force under these conditions and that the Debold et al. data is much steeper; Hill coefficients ~8 whereas for Millar and Homsher (1990) Hill coefficients were 2–6. (D) Data from Debold et al. (2006) redraw to show force as a function of Pi at various pCa levels.
The early work on skinned muscle cited above was performed at 10–20°C and a major recent development was the discovery that the effects of both pH and Pi on skinned fibers are quantitatively and qualitatively different when repeated at near physiological temperatures (Pate et al., 1995; Coupland et al., 2001; Debold et al., 2006). Data from Debold et al. (2006) are shown in Figure 1C who studied fast and slow fibers at both 15°C and 30°C. Over the range of 0.7–30 mM Pi, maximum Ca2+-activated force was reduced by 46% at 15°C but by only 2% at 30°C. In contrast, over the same range of Pi, the pCa50 was reduced by 0.28 log units at 15°C but was reduced by 0.63 log units at 30°C. Assuming the relation between Pi and Ca2+ sensitivity is logarithmic (Millar and Homsher, 1990), we have interpolated the data of Debold et al. (2006) at 30°C into a series of force/pCa curves at various Pi (Figure 1C). We have then converted this data into the relationship between force and Pi for various pCa levels (Figure 1D). Note that in contrast to the data at low temperatures (Figures 1A,B), there is little effect of Pi on maximum Ca2+-activated force and consequently, at the highest Ca2+ (pCa 5.8) Pi has relatively little effect on force (Figure 1D). Only when the Ca2+ is lower (pCa 5.9 and 6.0) does the force fall substantially and the effect is least at low Pi and greater as Pi increases.
At low temperatures, increases in both Pi and H+ depress muscle force and when applied simultaneously the effect is larger and generally assumed to be multiplicative. Nosek et al. (1987) factored out the effect of pH and noted that, after this procedure, the effect on force of a fixed concentration of Pi was very variable. However, when the total Pi was converted to the H2PO−4 and HPO2−4 forms, there was a good correlation with the diprotonated form and a poor correlation with the monoprotonated form. On this basis they suggested that it was the diprotonated form of Pi which inhibited force and that pH exerted two effects on force; a direct effect of protons and an indirect effect by converting more of the total Pi to the diprotonated form. However, some other studies have been unable to reproduce this effect (e.g., Chase and Kushmerick, 1988) and it is generally agreed that this effect is only seen in fast skeletal muscle but not in slow or cardiac muscle. It is also worth noting that the experiments on this topic were at 22°C and it is not known whether the effect persists at mammalian temperatures. Thus, the issue remains unresolved and some experimenters chose to display force data against total Pi while others compare force with H2PO−4.
The Effect of Pi on Ca2+ Release
Fatigue is known to involve both reduced crossbridge performance and reduced activation. There are many possible mechanisms by which activation might decline during fatigue (for review see Allen et al., 2008a) but in the present article we focus on the possibility that Pi may have some direct effect on activation. This idea was first raised by Fryer et al. (1995) in a study on skinned fibers with intact sarcoplasmic reticulum (SR). Ca2+ release was triggered by caffeine and was found to decrease substantially after the preparation had been bathed in a high Pi solution. They suggested that during fatigue Pi entered the SR reaching concentrations at which it was capable of precipitating with the high levels of Ca2+ found in the SR. This Ca2+Pi precipitate would thus reduce the free Ca2+ available in the SR for release (for review see Allen and Westerblad, 2001). This theory was supported by a study in which Pi was microinjected into single muscle fibers (Westerblad and Allen, 1996). There was a small reduction in Ca2+ sensitivity but a substantial reduction in tetanic Ca2+ present after 4 min. These data suggest that much of the Pi entered the SR where it precipitated and subsequently reduced Ca2+ release. Further support was provided by Laver et al. (2001) who discovered a phosphate permeable channel in the SR which could provide the route of entry for Pi. This mechanism was strengthened by the observation that the decline in tetanic [Ca2+]i which normally occurs during fatigue is reduced or delayed in creatine kinase knockout mice, in which the normal fatigue-induced rise in Pi is reduced (Dahlstedt and Westerblad, 2001).
More recently Dutka et al. (2005) have extended earlier work on skinned fibers by showing that the Pi-induced reduction in Ca release initially observed with caffeine triggered release is also present when Ca release is triggered by T-tubular action potentials. They also showed that the total SR Ca2+ was unaffected by Pi, supporting the idea that Ca2+ had precipitated as opposed to leaking out of the SR. In their experiments a 2 min exposure to 30 mM Pi was sufficient to reduce Ca2+ release to a steady level suggesting that this mechanism would have time to operate during a fatigue protocol of this or greater length. This mechanism appears to be substantially smaller in slow fibers compared to fast, which may contribute to the fatigue-resistance of slow fibers (Posterino and Dunn, 2008).
In summary, a substantial body of evidence points to the possibility that elevated Pi contributes to reduced Ca2+ release during fatigue. Definitive evidence probably would require measurements of Ca2+Pi precipitates in the SR and the timecourse of their change during fatigue and recovery. However, the small size of the SR makes this a challenging procedure.
The Correlation Between Fatigue and [Pi]
Many studies have correlated the changes in myoplasmic [Pi] with the changes in force during fatiguing activities. While the measurements of metabolites from isolated muscles and from biopsies of human muscles have been possible for many years, these methods are not easily scaled up to obtaining multiple samples. Thus, a rapid expansion in knowledge occurred with the development of nuclear magnetic resonance which allows non-invasive sampling of metabolites to be repeated frequently. Dawson et al. (1978) pioneered this technique in muscle and were able to plot PCr, Cr, Pi, ADP, ATP, and H+ as functions of the declining force in tetanically stimulated ischaemic frog muscle. H+ showed a strong linear correlation with declining force and was therefore a good candidate. Pi also correlated well with force decline though at high Pi there was some deviation from linearity. This work was performed on frog muscles at 4°C; given the importance of temperature we focus in this section on subsequent studies in humans or mammals at or near body temperature.
Lanza et al. (2006) examined force and metabolite change in the human tibialis anterior in response to six maximal 12 s contractions separated by 12 s rest periods. In this protocol force declined to 74% control and over this period H2PO−4 increased from 3.5 to 15 mM and showed a near linear relation with force (Figure 2A). We have calculated total Pi from their data and this also correlates well with force (Figure 2A). These authors repeated the protocol under ischaemic conditions with similar results. Jones et al. (2009) also studied the human tibialis anterior under ischaemic conditions but using electrical stimulation of the muscle and their data show a comparable relationship between Pi and force decline (Figure 2B). ATP consumption was calculated and, after correction for the decline of force, the economy of contraction appeared unchanged during the period of fatigue. A different approach was used by Burnley et al. (2010) who studied the quadriceps group during repeated maximal voluntary contractions, 3 s on 2 s off, continued until the force was stable. Pi and H2PO−4 were measured at 5 s intervals throughout, so that the timecourse of Pi and force could be followed throughout the procedure. The results show that Pi initially changed more quickly than force (Figure 2C) so that the plot has a region where force and Pi change reasonably linearly but, because force continued to fall while Pi was constant, this gives a near vertical line on the plot. Because pH continued to decline slowly throughout fatigue, the plot of H2PO−4 is more nearly linear over the whole range. Thus, this data supports the idea that pH is making some contribution to fatigue, either directly or through the changing proportions of H2PO−4/total Pi; alternatively the authors suggest that a central component to fatigue may become more prominent during the later part of the protocol. Another possibility is that Ca2+ release is reduced with a delay in this model as observed in many isolated muscle fatigue protocols (Westerblad and Allen, 1991) and in the exteriorized mouse muscle (Figure 3B). The final example is from Allen et al. (2011) who studied the exteriorized tibialis anterior of mouse (Figure 2D). Blood flow was intact and the muscle temperature was 30°C. The protocol involved direct muscle stimulation with 400 ms tetani repeated every 4 s (duty cycle = 0.1). Force reached a plateau at ~50% after 6–10 min and Pi was determined in whole muscle extracts at the beginning and end of the protocol and after recovery (a typical fatigue protocol for this preparation is shown in Figure 3C). The three upper most points are control, recovery and the standard fatigue protocol. The two lowest points are a more intense stimulation protocol (duty cycle 0.2) and a protocol in which the muscle was ischaemic. There is a reasonable correlation over the whole range between force decline and Pi in this preparation.
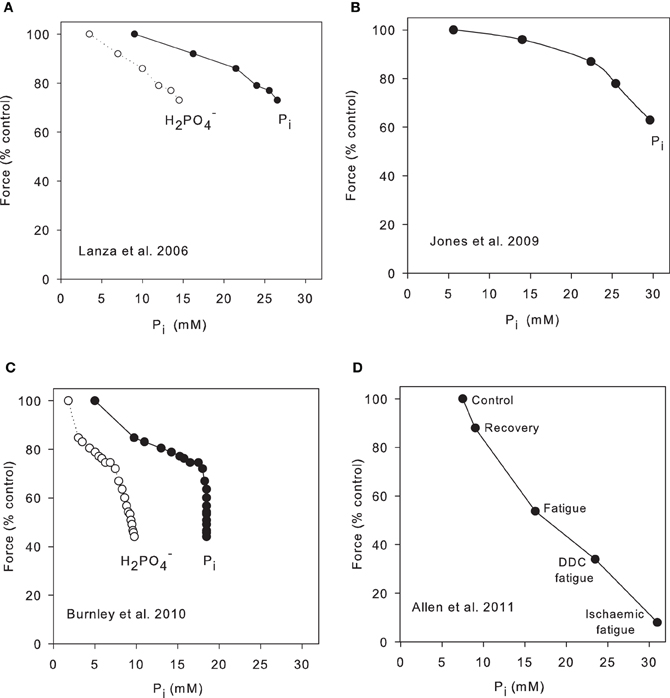
Figure 2. Correlation between Pi and force in intact, fatiguing muscle. (A) Human subjects performed six 12 s maximal contractions involving dorsiflexion of the ankle and NMR spectra were collected from the tibialis anterior muscle in 12 s periods between contractions (Lanza et al., 2006). In the original publication only H2PO−4 was plotted; we have calculated Pi on the basis Pi = H2PO−4 (1 + 10pH−6.75). (B) Stimulated maximal tetani of the human tibialis anterior muscle under ischaemic conditions. 1.6 s tetani with 1.6 s intervals between tetani continued for 32 s (Jones et al., 2009). (C) Human subjects performed 60 maximal voluntary contractions of the quadriceps group, each contraction 3 s in duration with 2 s rest between (Burnley et al., 2010). Pi and H2PO−4 were recorded between each contraction. Resting Pi assumed to be 5 mM. (D) Exteriorized mouse tibialis anterior stimulated with maximal tetani of 0.4 s duration repeated every 4 s. Muscles were sampled under control conditions and when fatigue had reached a steady state (12 min). A second protocol involved 0.4 s tetani repeated every 2 s (double duty cycle or DDC fatigue). Some fatigue protocols were recorded after death when circulation had ceased (ischaemic fatigue). Data from Allen et al. (2011).
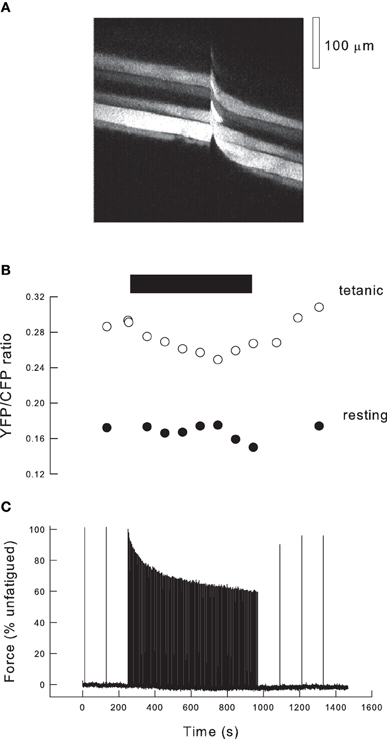
Figure 3. Fatigue in the exteriorized mouse tibialis anterior muscle. (A) Fluorescence image of tibialis anterior muscle 10 days after transfection with cameleon (YC2). Image was scanned from L to R over 750 ms, and the muscle stimulated after 400 ms (indicated by movement artifact). Thus, in the L part of the image the fibers are resting whereas in the R part of the image the fibers are tetanized. (B) Records of the ratio of fluorescence of YFP/CFP obtained from images such as (A) during a fatigue protocol. Black bar indicates period of high duty cycle stimulation. Empty circles indicate ratios determined during tetani (R hand images in Panel A), filled circles show ratios from the resting muscle just prior to tetani (L hand images in Panel A). (C) Record of force during the stimulation protocol. Initially the muscle is stimulated every 2 min and force is stable. When duty cycle is increased to one tetanus every 4 s, force declines exponentially and approaches a steady state. Stimuli are then given every 2 min and force recovers to ~90% of the initial level.
All the results cited demonstrate a negative correlation between Pi and force during fatiguing stimulation. Typically the effect of Pi appears smaller early in fatigue and the effect appears to be enhanced in the steady state. A simple explanation of this would be if Pi also decreases Ca2+ release but after a delay.
Measurements of Pi and Ca2+ in Mouse Muscle During Fatigue
The data in Figure 1 make it clear that the expected reduction in force as a function of Pi is very dependent on the tetanic [Ca2+]i. Thus, to analyse the consequences of Pi during fatigue it is necessary to have measurements of force, tetanic [Ca2+]i and Pi. We have recently developed a new model of fatigue in which, potentially, all these data can be determined (Allen et al., 2011). The approach uses the tibialis anterior muscle of the anaesthetized mouse. The distal tendon of the muscle is detached and tied to a force transducer while the proximal end is undisturbed so that normal blood supply occurs. Ca2+ is measured using genetically-encoded cameleons (Miyawaki et al., 1997) transfected into the muscle 5–10 days before the experiment. The indicator is expressed in a subset of fibers and those within one or two fibers diameters of the outer surface of the muscle can be examined. Figure 3A shows a fluorescent XY image of the muscle surface obtained with a 2-photon microscope. In this image the scanning occurred from left to right so that at the left of the image a group of five fibers showing variable degrees of expression are visible. Approximately half way through the image acquisition (total time 730 ms) the muscle was stimulated tetanically, indicated by the movement artifact, and the right hand part of the image shows the same group of fibers during a tetanus. Cameleons have two fluorophores (YFP and CFP) attached to the ends of a calmodulin molecule plus a linker segment. When Ca2+ binds to calmodulin, it undergoes a shape change and the CFP and YFP become sufficiently close that fluorescence resonance energy transfer (FRET) occurs between them. The molecule is illuminated with a wavelength that excites CFP which then emits at its characteristic wavelength. In the presence of Ca2+, FRET occurs between CFP and YFP so that some fraction of the emitted light is now at the YFP emission wavelength. Thus, the ratio of YFP/CFP emitted fluorescence is Ca2+ sensitive.
Figure 3C illustrates our standard fatigue protocol. In the control period the muscle is stimulated with maximal tetani at 2 min intervals leading to stable tetanic force. During the fatiguing protocol the muscle is stimulated every 4 s (duty cycle = 0.1) for 12 min and force approaches a steady state by the end of this period. Subsequently the tetanic frequency is reduced so that at 2 min intervals tetani recover to around 90% of the initial force. Figure 3B shows the YFP/CFP ratios at rest and during selected tetani during the protocol. Resting [Ca2+]i typically shows no significant change during this fatigue protocol. Tetanic [Ca2+]i falls during fatigue and recovers afterwards. If the difference between tetanic and resting [Ca2+]i is defined as 100%, then the average tetanic ratio during fatigue declined to 67%. The ratio then recovers with a timecourse similar to that of force. We have not calibrated our YFP/CFP ratios but data from Miyawaki et al. (1999) suggest that the relationship between YFP/CFP ratio and Ca2+ should be linear for our indicator (YC2) over the lower part of its range.
Metabolic measurements were made by rapidly freezing the muscle in liquid N2 and extraction with perchloric acid. Pi was measured in the supernatant using 31P-NMR spectroscopy. The relation between force and Pi in control (upper leftmost point) and various types of fatigue is depicted in Figure 2D and shows a robust linear relationship between Pi and force over the whole range of force outputs. In order to decide to what extent changes in Pi can explain the reduction in force one needs to compare data in Figure 2D with the data in Figure 1D. There are several problems involved in such a comparison. (1) One needs to know the appropriate level of Ca2+ in order to make the comparison. (2) Both the force and the metabolic measurements are averaged from the whole muscle which will consist of a mixture of fiber types. Percival et al. (2010) have determined the fiber type composition of mouse tibialis anterior and the main fiber types are Type IIB (54%) and Type IIA (34%) with smaller amounts of various intermediate fiber types. The Type IIB fibers predominate on the superficial half of the muscle while the Type IIA fibers are mainly located in the deeper portion. As a consequence, our Ca2+ measurements, which are made from superficial fibers, are likely to be from Type IIB fibers. Larsson et al. (1991) have determined the fatiguability of these fiber types in rat tibialis anterior using the single motor unit stimulation protocol. Using a duty cycle of 0.4, compared to our 0.1, Type IIB fibers fatigued to 2% control in 4 min whereas Type IIA fibers fatigued to 93% over 4 min. Assuming rat and mouse fibers are similar in fatiguability, then it would seem that Type IIA fibers should show very little fatigue at our duty cycle and, conversely, most of the observed fatigue in our preparation is likely to be in the Type IIB fibers.
To understand how Pi and Ca2+ interact during fatigue, in Figure 4 we plot skinned fiber data at 30°C (Debold et al., 2006) showing pCa/force curves at the resting Pi (7 mM) and the fatigued Pi (15 mM). Our Ca2+ measurements are not calibrated but, since we stimulate at a frequency that gives maximal force, we can assume that Ca2+ is at least supramaximal on the appropriate Pi curve (for recent review of calcium measurements in skeletal muscle see Baylor and Hollingworth, 2011). Thus, for the unfatigued muscle (Pi = 7 mM) reading from Figure 4, we can see that the tetanic [Ca2+]i should be ~pCa = 5.9 giving a tetanic [Ca2+]i = 1.26 μM. This point is marked on Figure 4 as a black circle. From our Ca2+ measurements we found that tetanic [Ca2+]i reduced to 67% in the fatigued muscle giving a tetanic [Ca2+]i of 0.83 μM (pCa 6.08). Simultaneously during fatigue Pi rises to 15 mM so the expected force for these conditions is given by the empty circle (22% control force). Thus, under these assumptions, the combination of Pi and [Ca2+]i predict a force of 22% in our fatigue protocol whereas the measured fatigue force was 49%. This analysis assumes that both the fast and slow fibers had similar changes in Ca2+ and Pi and that the properties of the slow and fast fibers are similar with respect to Pi. On the first point, Karatzaferi et al. (2001) measured metabolic changes in both Type IIA fibers and the human equivalent of Type IIB (Type IIXa). Although they did not measure Pi, the decline in PCr was substantially greater in the IIXa fibers (103 mmol/kg dry weight) compared to the Type IIA fibers (71 mmol/kg dry weight). This suggests that Pi would be higher than the average in Type IIB fibers and correspondingly lower in the Type IIA fibers. On the second point Debold et al. (2006) state that Type IIB and IIA fibers had similar properties with respect to Ca2+ and Pi sensitivity. To further investigate this point we have recalculated the expected force assuming the muscle consists of 60% Type IIB and 40% Type IIA. We further assume that Pi is 20% greater in the Type IIB fibers (18 mM) and 20% less in the Type IIA fibers (12 mM). The half shaded circles (Figure 4) show that on these assumptions, the Type IIB fibers would generate 15% force while the Type IIA fibers would generate 34%. The whole muscle would then generate 23% (0.4 × 0.34 + 0.6 × 0.15). These new assumptions only change our estimated force from 22 to 23%. Thus, these two areas of uncertainty probably would not make a very substantial change in the estimated force under the fatigue conditions. On the other hand the estimated tetanic [Ca2+]i makes a large contribution. For instance if we assume the tetanic [Ca2+]i is 25% higher than required to saturate (black square in Figure 4), then the estimated force during fatigue after the appropriate reduction in tetanic [Ca2+]i (open square) becomes 64%. Thus, a 25% change in our estimated Ca2+ leads to large (64 vs. 21%) estimate in the fatigued force. Furthermore, we have no information on the tetanic Ca2+ in Type IIA fibers or how it might change during fatigue. Our conclusion as present is that the combination of declining Ca2+ and rising Pi during fatigue are probably capable of explaining much of the observed force reduction. To make this estimate more precise we would need calibrated Ca2+ measurements in both fiber types and more details on the metabolite changes in different fiber types.
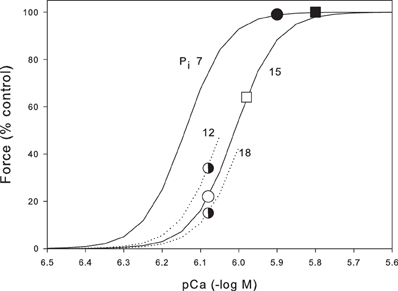
Figure 4. Prediction of the force during fatigue based on the Pi and Ca2+ data from the mouse tibialis anterior. Skinned fiber data (continuous lines) is from Debold et al. (2006) and shows pCa force data at 7 mM, the resting Pi in mouse tibialis anterior, and 15 mM, the Pi reached after the standard fatigue protocol shown in Figure 3. Black circle indicates the resting unfatigued muscle with Pi 7 mM and Ca2+ assumed just sufficient to fully saturate the contractile machinery (pCa 5.9). Open circle shows the predicted force when Ca2+ falls by 33%, as measured during fatigue, and Pi rises to that observed in fatigue. The skinned fiber data predict a force of 22% under these conditions. The closed and open square show another estimated with the Ca2+ higher by 25%. Also shown are parts of the pCa force curves for Pi 12 and 18 mM (see text for details).
An unresolved difficulty with these calculations is to explain the observation of Larsson et al. (1991) showing that Type IIB fibers would be expected to fatigue to near 0 whereas Type IIA fibers show very little fatigue. In contrast our modeling suggests Type IIB fatigue to 15% while Type IIA fatigue to 34%. There are many possible causes of this discrepancy; one is that factors other than Pi and Ca2+ are important in fatigue. A second possibility is that the difference in Pi is greater between the two fiber types. A further possibility is that the Ca2+ changes occurring during fatigue are smaller in the Type IIA fibers and larger in the Type IIB fibers which would be expected if the Ca2+ changes are a function of the Pi changes as discussed earlier.
Conclusions
Current data on the changes in Pi in muscle during fatigue suggest that the combination of the increase in Pi and the decrease in tetanic Ca2+ are capable of explaining much of the observed decline in force. This analysis is highly dependent on skinned fiber data obtained at 30°C and more data at 37°C would be desirable. Another area of uncertainty is the level of tetanic Ca2+ in the various fibers types and the extent to which this changes during fatigue protocols. While the mechanism of change in tetanic Ca2+ remains uncertain, a strong possibility is that the change in Pi is instrumental in the reduction of tetanic Ca2+ suggesting that evolution has utilized one metabolite to reduce both the myofibrillar performance and the Ca2+ release. The many other factors that modulate fatigue would appear to do so by fine-tuning the substantial reduction in force caused by the interactions between Pi and myofibrillar proteins and the Ca2+ release mechanism.
Conflict of Interest Statement
The authors declare that the research was conducted in the absence of any commercial or financial relationships that could be construed as a potential conflict of interest.
Acknowledgments
This work has been supported by a Discovery Grant from the Australian Research Council.
References
Allen, D. G., Clugston, E., Petersen, Y., Roder, I. V., Chapman, B., and Rudolf, R. (2011). Interactions between intracellular calcium and phosphate in intact mouse muscle during fatigue. J. Appl. Physiol. 111, 358–366.
Allen, D. G., Lamb, G. D., and Westerblad, H. (2008a). Impaired calcium release during fatigue. J. Appl. Physiol. 104, 296–305.
Allen, D. G., Lamb, G. D., and Westerblad, H. (2008b). Skeletal muscle fatigue: cellular mechanisms. Physiol. Rev. 88, 287–332.
Allen, D. G., and Westerblad, H. (2001). Role of phosphate and calcium stores in muscle fatigue. J. Physiol. 536, 657–665.
Baylor, S. M., and Hollingworth, S. (2011). Calcium indicators and calcium signalling in skeletal muscle fibres during excitation-contraction coupling. Prog. Biophys. Mol. Biol. 105, 162–179.
Bellinger, A. M., Reiken, S., Dura, M., Murphy, P. W., Deng, S. X., Landry, D. W., et al. (2008). Remodeling of ryanodine receptor complex causes “leaky” channels: a molecular mechanism for decreased exercise capacity. Proc. Natl. Acad. Sci. U.S.A. 105, 2198–2202.
Burnley, M., Vanhatalo, A., Fulford, J., and Jones, A. M. (2010). Similar metabolic perturbations during all-out and constant force exhaustive exercise in humans: a (31)P magnetic resonance spectroscopy study. Exp. Physiol. 95, 798–807.
Cady, E. B., Jones, D. A., Lynn, J., and Newham, D. J. (1989). Changes in force and intracellular metabolites during fatigue of human skeletal muscle. J. Physiol. 418, 311–325.
Cairns, S. P. (2006). Lactic acid and exercise performance: culprit or friend? Sports Med. 36, 279–291.
Chase, P. B., and Kushmerick, M. J. (1988). Effects of pH on contraction of rabbit fast and slow skeletal muscle fibers. Biophys. J. 53, 935–946.
Cooke, R. (2007). Modulation of the actomyosin interaction during fatigue of skeletal muscle. Muscle Nerve 36, 756–777.
Cooke, R., and Pate, E. (1985). The effects of ADP and phosphate on the contraction of muscle fibers. Biophys. J. 48, 789–798.
Coupland, M. E., Puchert, E., and Ranatunga, K. W. (2001). Temperature dependence of active tension in mammalian (rabbit psoas) muscle fibres: effect of inorganic phosphate. J. Physiol. 536, 879–891.
Dahlstedt, A. J., and Westerblad, H. (2001). Inhibition of creatine kinase reduces the fatigue-induced decrease of tetanic [Ca2+]i in mouse skeletal muscle. J. Physiol. 533, 639–649.
Dawson, M. J., Gadian, D. G., and Wilkie, D. R. (1978). Muscle fatigue investigated by phopshorus nuclear magnetic resonance. Nature 274, 861–866.
Debold, E. P., Romatowski, J., and Fitts, R. H. (2006). The depressive effect of Pi on the force-pCa relationship in skinned single muscle fibers is temperature dependent. Am. J. Physiol. Cell Physiol. 290, C1041–C1050.
Dutka, T. L., Cole, L., and Lamb, G. D. (2005). Calcium phosphate precipitation in the sarcoplasmic reticulum reduces action potential-mediated Ca2+ release in mammalian skeletal muscle. Am. J. Physiol. Cell Physiol. 289, C1502–C1512.
Fabiato, A., and Fabiato, F. (1978). Effects of pH on the myofilaments and the sarcoplasmic reticulum of skinned cells from cardiac and skeletal muscles. J. Physiol. 276, 233–255.
Fitts, R. H. (2008). The cross-bridge cycle and skeletal muscle fatigue. J. Appl. Physiol. 104, 551–558.
Fryer, M. W., Owen, V. J., Lamb, G. D., and Stephenson, D. G. (1995). Effects of creatine phosphate and Pi on Ca2+ movements and tension development in rat skinned skeletal muscle fibres. J. Physiol. 482, 123–140.
Jones, D. A., Turner, D. L., McIntyre, D. B., and Newham, D. J. (2009). Energy turnover in relation to slowing of contractile properties during fatiguing contractions of the human anterior tibialis muscle. J. Physiol. 587, 4329–4338.
Karatzaferi, C., de Haan, A., Ferguson, R. A., van Mechelen, W., and Sargeant, A. J. (2001). Phosphocreatine and ATP content in human single muscle fibres before and after maximum dynamic exercise. Pflügers Arch. 442, 467–474.
Kemp, G. J., Meyerspeer, M., and Moser, E. (2007). Absolute quantification of phosphorus metabolite concentrations in human muscle in vivo by 31P MRS: a quantitative review. NMR Biomed. 20, 555–565.
Lanza, I. R., Wigmore, D. M., Befroy, D. E., and Kent-Braun, J. A. (2006). In vivo ATP production during free-flow and ischaemic muscle contractions in humans. J. Physiol. 577, 353–367.
Larsson, L., Edstrom, L., Lindegren, B., Gorza, L., and Schiaffino, S. (1991). MHC composition and enzyme-histochemical and physiological properties of a novel fast-twitch motor unit type. Am. J. Physiol. 261, C93–C101.
Laver, D. R., Lenz, G. K. E., and Dulhunty, A. F. (2001). Phosphate ion channels in the sarcoplasmic reticulum of rabbit skeletal muscle. J. Physiol. 537, 763–778.
Millar, N. C., and Homsher, E. (1990). The effect of phosphate and calcium on force generation in glycerinated rabbit skeletal muscle fibers; a steady-state and transient kinetic study. J. Biol. Chem. 265, 20234–20240.
Miyawaki, A., Griesbeck, O., Heim, R., and Tsien, R. Y. (1999). Dynamic and quantitative Ca2+ measurements using improved cameleons. Proc. Natl. Acad. Sci. U.S.A. 96, 2135–2140.
Miyawaki, A., Llopis, J., Heim, R., McCaffery, J. M., Adams, J. A., Ikura, M., et al. (1997). Fluorescent indicators for Ca2+ based on green fluorescent proteins and calmodulin. Nature 388, 882–887.
Mollica, J. P., Dutka, T. L., Merry, T. L., Lamboley, C. R., McConell, G. K., McKenna, M. J., et al. (2012). S-glutathionylation of troponin I (fast) increases contractile apparatus Ca2+ sensitivity in fast-twitch muscle fibres of rats and humans. J. Physiol. 590, 1443–1463.
Nosek, T. M., Fender, K. Y., and Godt, R. E. (1987). It is diprotonated inorganic phosphate that depresses force in skinned skeletal muscle fibers. Science 236, 191–193.
Pate, E., Bhimani, M., Franks-Skiba, K., and Cooke, R. (1995). Reduced effect of pH on skinned rabbit psoas muscle mechanics at high temperatures: implications for fatigue. J. Physiol. 486, 689–694.
Percival, J. M., Anderson, K. N., Huang, P., Adams, M. E., and Froehner, S. C. (2010). Golgi and sarcolemmal neuronal NOS differentially regulate contraction-induced fatigue and vasoconstriction in exercising mouse skeletal muscle. J. Clin. Invest. 120, 816–826.
Posterino, G. S., and Dunn, S. L. (2008). Comparison of the effects of inorganic phosphate on caffeine-induced Ca2+ release in fast- and slow-twitch mammalian skeletal muscle. Am. J. Physiol. Cell Physiol. 294, C97–C105.
Ruegg, J. C., Schadler, M., Steiger, G. J., and Muller, G. (1971). Effects of inorganic phosphate on the contractile mechanism. Pflugers Arch. 325, 359–364.
Takagi, Y., Shuman, H., and Goldman, Y. E. (2004). Coupling between phosphate release and force generation in muscle actomyosin. Philos. Trans. R. Soc. Lond. B Biol. Sci. 359, 1913–1920.
Westerblad, H., and Allen, D. G. (1991). Changes of myoplasmic calcium concentration during fatigue in single mouse muscle fibers. J. Gen. Physiol. 98, 615–635.
Westerblad, H., and Allen, D. G. (1996). The effects of intracellular injections of phosphate on intracellular calcium and force in single fibres of mouse skeletal muscle. Pflügers Arch. 431, 964–970.
Keywords: skeletal muscle, fatigue, intracellular calcium, inorganic phosphate, myofibrillar performance
Citation: Allen DG and Trajanovska S (2012) The multiple roles of phosphate in muscle fatigue. Front. Physio. 3:463. doi: 10.3389/fphys.2012.00463
Received: 21 September 2012; Accepted: 22 November 2012;
Published online: 11 December 2012.
Edited by:
Christina Karatzaferi, University of Thessaly, GreeceCopyright © 2012 Allen and Trajanovska. This is an open-access article distributed under the terms of the Creative Commons Attribution License, which permits use, distribution and reproduction in other forums, provided the original authors and source are credited and subject to any copyright notices concerning any third-party graphics etc.
*Correspondence: David G. Allen, School of Medical Sciences, Bosch Institute and Sydney School of Medicine, University of Sydney, Sydney, NSW 2006, Australia. e-mail: davida@physiol.usyd.edu.au