
- 1INRA - UMR Pegase, Saint-Gilles, France
- 2Agrocampus Ouest - UMR Pegase, Rennes, France
In growing pigs, the feed cost accounts for more than 60% of total production costs. The determination of efficiency of energy utilization through calorimetry measurements is of importance to sustain suitable feeding practice. The objective of this paper is to describe a methodology to correct daily heat production (HP) obtained from measurements in respiration chamber for the difference in energy expenditure related to physical activity between animals. The calculation is based on a preliminary published approach for partitioning HP between HP due to physical activity (AHP), thermic effect of feeding (TEF) and basal metabolic rate (fasting HP; FHP). Measurements with male growing pigs [mean body weight (BW): 115 kg] which were surgically castrated (SC), castrated through immunization against GnRH (IC), or kept as entire male (EM) were used as an example. Animals were fed the same diet ad-libitum and were housed individually in two 12-m3 open-circuit respiration chambers during 6 days when fed ad-libitum and one supplementary day when fasted. Physical activity was recorded through interruption of an infrared beam to detect standing and lying positions and with force transducers that recorded the mechanical force the animal exerted on the floor of the cage. Corrected AHP (AHPc), TEF (TEFc), and HP (HPc) were calculated to standardize the level of AHP between animals, assuming that the ratio between AHPc and ME intake should be constant. Inefficiency of energy utilization (sum of AHPc and TEFc) was lower than the inefficiency estimated from the slope of the classical relationship between HPc and ME intake but was associated with higher requirements for maintenance. Results indicate that EM pigs had higher FHP but lower TEFc than IC and SC pigs. These results agree with the higher contents in viscera of EM pigs that stimulate their basal metabolic rate and with the reduced utilization of dietary protein to provide energy for maintenance energy requirements and fat deposition (FD).
Introduction
In growing pigs, feeding accounts for more than 60% of total production costs. The increased use of crop resources for human consumption or fuel production in a context of constrained land resources promotes feedstuff diversification in pig diets, including the use of increasing amounts of by-products (Martin, 2010). Nevertheless, these new feedstuffs are often poorly documented for their energy values, whereas the technological treatments they undergo, often associated with high contents in dietary fiber, may strongly affect metabolic utilization of energy by the growing pigs. Different feeding systems (from digestible energy to net energy, NE) that take into account different energy losses by the animal can be used to describe dietary energy value (Baldwin, 1995a). Among them, the NE system requires measuring energy expenditure associated with the utilization of these feedstuffs for growth (or heat increment HI). The direct measurement in growing animals of heat production (HP) in respiration chamber offers the opportunity to evaluate variation among animals in line with their genotype, phenotype or environmental conditions. Nevertheless, animals produce heat because of different metabolic processes involved in their maintenance and growth functions. The calculation of HI in growing animals needs the partitioning of total HP between a component due to maintenance and a component due to growth. Differences in energy expenditure due to different levels of physical activity between animals have also to be accounted for. The objectives of the paper are to present the methodology developed in our laboratory to calculate HI, using a mathematical model previously described (van Milgen et al., 1997). Further calculations to standardize HI for difference in physical acitivty between animals are proposed. An experiment in which the energy expenditure was measured in entire male (EM) and castrated pigs is used as an example.
Materials and Methods
The experiment complied with French laws on animal experimentation and was conducted under the direction of Jean Noblet and Jaap van Milgen, who are both authorized by the French Ministry of Agriculture (n° 4739 and 7704).
Experimental Design
The experiment was designed to determine the effects of castration and castration method on nitrogen and energy metabolism of male growing pigs. The experiment was conducted on six groups of three Pietrain × (Large White × Landrace) male pigs that were either surgically castrated (SC), immunocastrated (IC), or kept as EM. Within each group, pigs originated from the same litter (five groups) or had the same father (one group) to reduce possible bias in their energy metabolism induced by difference in their genotype. Measurements consisted in 6 days when fed for measuring nitrogen and energy balances (difference between intake and losses in feces, urine and as CH4 and HP) and 1 day for quantifying fasting HP (FHP) when pigs received no feed. Measurements for IC occurred 5 weeks after the second vaccination when hormonal status of IC pigs was stabilized (Kubale et al., 2013) and measurements for SC and EM pigs occurred simultaneously or 1 week before because only two respiration chambers were available. During measurements, pigs were placed in a metabolic cage allowing quantitative and separate collection of feces and urine and housed individually in a 12-m3 open-circuit respiration chamber, similar as those described by Vermorel et al. (1973). The temperature and relative humidity in the respiration chambers were kept constant at 24°C and 70%, respectively. The pigs were offered a cereal-based diet ad-libitum into a trough with a trap door (Table 1). A feed hopper placed above the trough ensured that feed was available during the whole day.
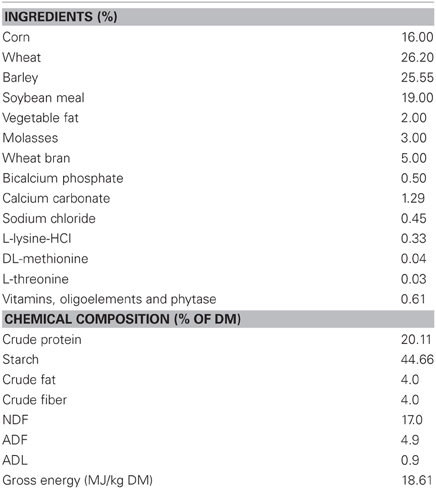
Table 1. Composition of diet.
Measurements and Samplings
Pigs were weighed on the morning of the first day of measurements, on the morning of the fasting day and on the morning after the fasting day. The amount of feed offered was recorded daily and feed refusals and spillages were collected at the end of the 6 fed days. Offered feed was sampled daily for each week of measurements. At the end of each week, feces from each pig were weighed, mixed, and sampled. Urine was weighed daily and a daily aliquot was cumulated over the 6 days of the fed period for each pig. Ammonia losses that resulted from the degradation of urinary nitrogen were recovered from the condensed water from the air conditioning system while ammonia losses in outgoing air were determined as described by Noblet et al. (1987).
According to the open-circuit respiration chamber technique, volumes of O2 consumption and CO2 and CH4 production were calculated from ventilation rate of the respiration chamber and from the difference in gas concentrations between outgoing and ingoing air. The O2, CO2, and CH4 concentrations in outgoing air were measured using a paramagnetic differential analyzer (Oxymat 6, Siemens) and two infrared analyzers (Ultramat 6, Siemens), respectively. The ventilation rate was measured with a mass gas meter (Teledyne Brown Engineering). Gas concentrations, ventilation rate and physical characteristics of the gas in the respiration chamber (pressure, temperature, and relative humidity) were measured 60 times per second, averaged over 10-s intervals and recorded for further calculations. Each day, access to the feeder was blocked at 6.00 am and measurements were stopped at 8.00 am for ~15 min to provide care to the animals, refill the feeders, collect feces and urine and calibrate the analyzers with ingoing air as baseline and a gas tube with known gas concentrations as standard. Measurements then restarted and access to feeder was allowed at 9.00 am.
Feeding behavior was recorded continuously using a weighing scale that was placed under the trough. Standing duration was recorded through interruption of an infra-red beam that was placed across the cage at the height of the pig's hip. The mechanical force the pig exerted because of physical activity was recorded using four force sensors (9104A, Kistler) on which the cage was placed. The sensors are transducers that produce an electrical signal proportional to the vertical force the animal exerts on the cage (Quiniou et al., 2001).
Laboratory Analyses
Feed samples and feed refusals were analyzed weekly for dry matter (DM) content. Feed samples were then pooled and analyzed for DM, nitrogen (Dumas method) and energy contents (AOAC, 1990; AFNOR, 1998). One sample of feces per pig was analyzed for DM content and one sample was freeze-dried. Freeze-dried feces samples were ground through a 1 mm grid and analyzed for DM, nitrogen (Dumas method) and energy contents. Nitrogen content of urine was measured on fresh material according to the Dumas method and energy content was measured after freeze-drying approximately 30 mL of urine in polyethylene bags (AFNOR, 1998).
Calculations
Gas analyzers were calibrated at the beginning and at the end of each day and the drift was considered to be linear. The time lag between respiration chamber and gas analyzers equaled 70 s. Taking into account the effect of respiratory quotient (RQ, CO2/O2) on difference between inflow and outflow (Ortigues et al., 1994), volumes of O2 consumption and CO2 and CH4 production were calculated for 10-s intervals that were cumulated over the day. To account for the interruption of the measurements in the morning (calibration of analyzers …), these volumes were standardized for 24-h period, assuming proportionality.
Nitrogen balance was calculated as the difference between intake (calculated as the difference between offered feed and feed refusals and spillages) and losses in feces and urine and as ammonia. Protein deposition (PD) was then calculated, assuming that PD equaled 6.25 times nitrogen retention. Retained energy (RE) was calculated as the difference between feed gross energy intake and energy losses in feces and urine and as CH4 (39.5 kJ/L of CH4) and HP. According to the Brouwer (1965) equation, HP was calculated from volumes of O2 consumption, CO2 production, and CH4 production and nitrogen excreted in urine (including ammonia losses). Fat deposition (FD) was calculated from the energy balance, assuming that energy was retained only as protein (23.6 kJ/g PD) and as fat (39.7 kJ/g FD).
Mathematical Modeling of HP Partition
Total HP was partitioned between components due to basal metabolism FHP, physical activity (AHP) and thermic effect of feeding (TEF, Figure 1) through analysis of the dynamic patterns of O2 and CO2 concentrations in the air of the respiration chamber (van Milgen et al., 1997). The model assumes that the instantaneous variations in O2 and CO2 concentrations are related to O2 consumption and CO2 production by the pig (sub-model “animal”; Figure 2), in addition to variation induced by ventilation of the respiration chamber and variation of physical characteristics of the gas within the respiration chamber (sub-model “chamber”). A complete description of the mathematical model is given by van Milgen et al. (1997).
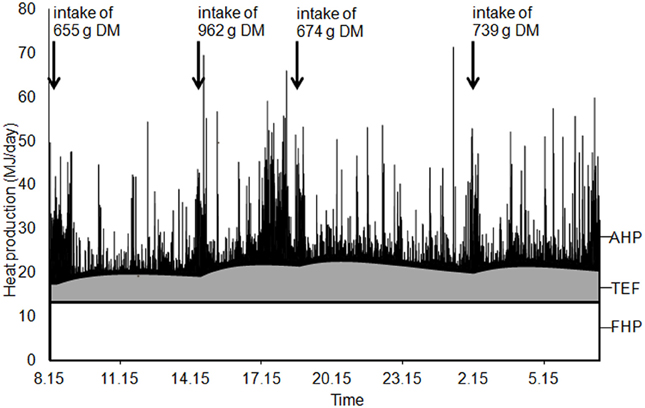
Figure 1. Example of heat production partitioning between components due to basal metabolic rate (fasting heat production, FHP), physical activity (AHP) and thermic effect of feeding (TEF); IC pig from group 3.
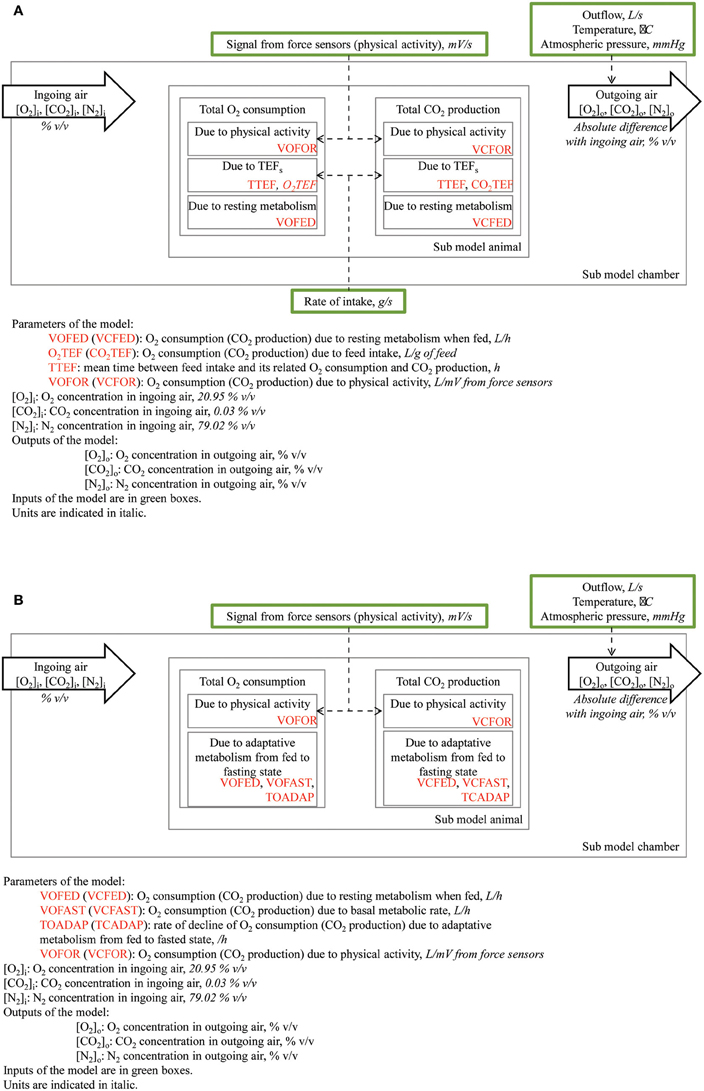
Figure 2. Description of the mathematical model used to partition total heat production from kinetics of O2 consumption and CO2 production; (A) components when animals are in a fed state; (B) components when animals are in a fasted state.
Mathematical modeling of gas exchanges
The conception of the model was similar for O2 consumption and CO2 production. During the fed days, the sub-model “animal” considered that instantaneous O2 consumption or CO2 production (in standard conditions of temperature and pressure: 0°C and 1 atm) equaled the sum of O2 consumption or CO2 production due to physical activity and short-term TEF (TEFs), in addition to constant O2 consumption or CO2 production associated with resting metabolism (VOFED and VCFED, respectively; Figure 2). It was hypothesized that O2 consumption or CO2 production due to physical activity was proportional to the electrical signal from force sensors with different parameters for O2 and CO2 (VOFOR and VCFOR, respectively). The O2 consumption or CO2 production due to TEFs followed a gamma distribution. The latter was modeled as the output of a two-compartment system, which was filled in the first compartment by feed intake (recorded by the weighing scale placed under the trough) and parameterized by the volume of O2 consumed or CO2 produced per g of feed intake (O2TEF and CO2TEF, respectively) and by mean time between feed intake and its related O2 consumption or CO2 production (TTEF). Mathematically, the content of each compartment was modeled from its first-order derivative with respect to time and fractional emptying rates were assumed to be identical for both compartments (2/TTEF; van Milgen et al., 1997). In addition to these well-identified contributors to O2 consumption and CO2 production, early experiments indicated that modest and time-limited variations in O2 and CO2 concentrations in the respiration chamber can occur irrespective of feed intake or physical activity (van Milgen and Noblet, 2000). Although the contribution of these phenomena to the total volumes of O2 consumption or CO2 production is small (<0.5%), they can affect the estimates of parameters of the model when not accounted for. These events were manually included in the model to ensure proper parameter estimation as instantaneous O2 consumption and CO2 production. During the fasting day, there is no feed intake. However, O2 consumption or CO2 production during resting (when the contribution of physical activity was removed) are lower during fasting than when fed. The decline in O2 consumption or CO2 production was described as a first-order decline between O2 consumption or CO2 production at a fed state (VOFED and VCFED, respectively) and O2 consumption or CO2 production during fasting (VOFAST and VCFAST, respectively). It was hypothesized that the rate of decline (TOADAP and TCADAP, respectively) may be different for O2 and CO2. Finally, the sub-model “animal” allowed calculating O2 consumption and CO2 production using feed intake and signals from the force sensors as inputs and seven parameters for the fed days and eight parameters for the fasting day.
The sub-model “chamber” described the variation in physical characteristics of the gas and considered that the air in the respiration chamber was composed of O2, CO2, and N2. Because only the flow of outgoing air was measured, the inflow was calculated as the flow of air required to fill the physical volume of the respiration chamber when O2 consumption, CO2 production and outflow were considered; the physical volume of the respiration chamber was calculated in standard conditions of temperature and pressure (0°C, 1 atm). The concentration of each gas in the respiration chamber was then calculated from its volume divided by the sum of volumes of O2, CO2, and N2.
Equations of the model were written in Fortran and compiled in a dynamic linked library that was loaded in R (R Development Core Team, 2010). Package deSolve (Soetaert et al., 2010) was used to solve the ordinary differential equations with an integration step-size of 10 s, after smoothing the data from force sensors, temperature, pressure and outflow to ensure their continuity. Parameters of the model were estimated for each day according to a three-step procedure: parameters directly related to O2 consumption or CO2 production were first estimated separately and then together to minimize the sum of squared differences between predicted O2 or CO2 concentration and measured O2 or CO2 concentrations (Nelder and Mead, 1965).
Calculation of HP components
Energy expenditure due to fasting metabolism, physical activity and TEFs were calculated from the respective volumes of O2 consumption and CO2 production according to the Brouwer (1965) equation. The difference between resting HP when fed (i.e., total HP minus AHP and TEFs) and FHP was attributed to long-term TEF (TEFl) and total TEF was calculated as the sum of short- and long-term components.
Standardization of HP for differences in physical activity
Preliminary analysis on data indicated that correlation between AHP and ME intake was significant (r = 0.56, P < 0.05; Table 2). To standardize HP between animals for difference in their physical activity, it was assumed that a fixed amount of metabolizable energy (ME) intake should be dissipated as corrected AHP (AHPc). The proportion of ME intake that was dissipated as HP due to physical activity equaled the mean value of AHP/ME (8.6%; see results). When AHP was higher than AHPc, the difference between AHP and AHPc resulted in a positive variation of ME available for other metabolic pathways, which was dissipated as TEF or retained as fat. The amount which was dissipated as supplementary TEF was calculated as: (AHP—AHPc) × TEF / (ME—FHP—AHP) and was added to TEF to calculate a corrected TEF (TEFc). The difference between AHP and AHPc which was not dissipated as supplementary TEF was added to RE to calculate corrected RE (REc) and FD (FDc). When AHP was lower than AHPc, the standardization followed the same calculation routine but resulted in lower TEFc, REc and FDc than TEF, RE, and FD, respectively. Assuming that FHP is representative of the basal metabolic rate of ad-libitum fed animals (Baker et al., 1991), HI was calculated as the sum of AHPc and TEFc. The efficiency of utilizing ME for maintenance and growth (kmg, %) was calculated as (1-HI/ME) × 100. Maintenance ME requirements (MEm) were calculated as FHP × 100/kmg (Labussière et al., 2011). All energy traits were expressed relative to metabolic body size, which was calculated as body weight (BW) raised to the power 0.60 (Noblet et al., 1999).
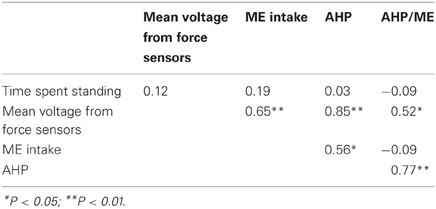
Table 2. Pearson correlation coefficients between time spent standing (h/d), mean voltage measured from force sensors (mV/d), ME intake (kJ/kg BW0.60 per day) and physical activity heat production (AHP; kJ/kg BW0.60 per day) and their ratio (AHP/ME; %).
The NE intake was calculated as the difference between ME intake and HI. The energy values of the diet (ME and NE contents) were calculated as the ratio between ME or NE intake (MJ/day) and feed intake.
Statistical Analyses
One FHP value was missing for a SC pig in group 2 and it was calculated (kJ/kg BW0.60 per day) as the average of the values obtained for the SC in the five other groups. The data (n = 18) were analyzed for the effects of sex (EM, SC, IC) and group using the PROC GLM of SAS (SAS, 2004). Only the P-values for the effect of sex will be described in details. Pearson correlation coefficients between time spent standing, mean voltage measured from force sensors, ME intake, AHP and AHP/ME ratio were calculated (PROC CORR; SAS, 2004). The linear relationship between AHP (% of ME intake) and the mean voltage from force sensors (mV/day) was tested and the difference of the slope from zero was tested through a T-test (PROC GLM; SAS, 2004). The linear relationship between corrected HPc (HPc) (kJ/kg BW0.60 per day) and ME intake (kJ/kg BW0.60 per day) was tested for the effect of sex on intercept and slope of the relationship (PROC GLM; SAS, 2004).
Results
Methodological Aspects
The BW of the pigs did not differ between sexes and averaged 115 kg during measurements (Table 3). Voluntary ME intake varied significantly between 2396 kJ/kg BW0.60 per day for EM pigs to 2864 kJ/kg BW0.60 per day for IC pigs. There was no effect of sex on time spent standing that averaged 1.4 h/day but individual values varied from 0.9 to 2.0 h/day (Figure 3). The force the animals exerted on the floor (mean voltage measured from force sensors) varied from 1.6 to 4.0 mV/day (Figure 4) and it was significantly correlated with ME intake, AHP and AHP/ME intake (Table 2). The AHP did not differ significantly between sexes (Table 3) but it was significantly correlated with ME intake (Table 2). When expressed as a percentage of ME intake, AHP was not affected by sex and averaged 8.6% (Table 3). Additionally, it was significantly correlated with mean voltage from force sensors (Table 2).
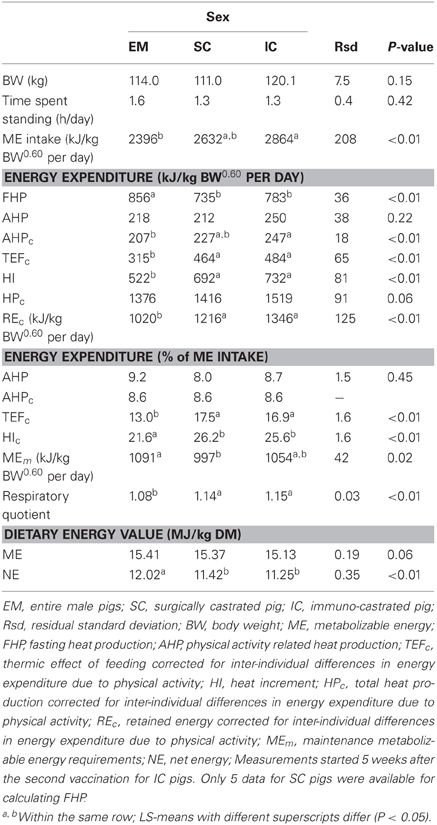
Table 3. Effect of castration and castration method on energy balance, efficiency of utilizing ME for maintenance and growth and maintenance energy requirements in male growing pigs (results are LS-means; n = 18).
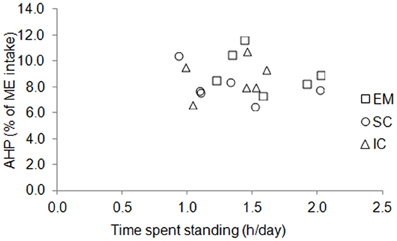
Figure 3. Individual variations of time spent standing and energy expenditure due to physical activity (AHP, % of ME intake) in entire male (EM), surgically castrated (SC), and immune-castrated (IC) pigs.
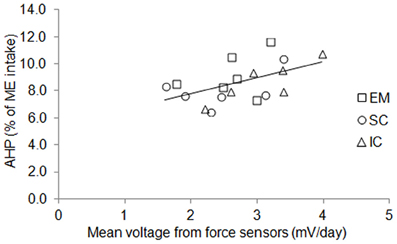
Figure 4. Individual variations of mean voltage measured from force sensors and energy expenditure due to physical activity (AHP, % of ME intake) in entire male (EM), surgically castrated (SC) and immune-castrated (IC) pigs. Solid line: linear relationship between AHP (% of ME intake) and cumulative voltage from force sensors (mV/day); the slope equaled 1.2% of ME per mV and differed significantly from zero (P = 0.03).
Energy Balance
Total HPc tended to vary according to the same pattern as ME intake from 1376 to 1519 kJ/kg BW0.60 per day (P = 0.06; Table 3). The relationship between HPc and ME intake did not differ significantly between sexes; the intercept equaled 554 kJ/kg BW0.60 per day and the slope equaled 34%. Among HPc components, FHP was significantly higher for EM pigs (856 vs. 761 kJ/kg BW0.60 per day on average for castrated pigs) whereas TEFc was significantly lower for EM pigs (315 vs. 474 kJ/kg BW0.60 per day or 13.0 vs. 17.2% of ME intake on average for castrated pigs). When HP due to physical activity was corrected for the differences between animals, HI was significantly lower in EM pigs than in castrated pigs (522 vs. 712 kJ/kg BW0.60 per day, on average). Variations in ME intake and energy expenditure resulted in lower REc in EM than in castrated pigs (1020 vs. 2562 kJ/kg BW0.60 per day, on average). Additionally, inefficiency of utilizing ME for maintenance and growth (i.e., HIc expressed as % of ME intake) was significantly lower in EM than in castrated pigs (21.6 vs. 25.9%, on average for castrated pigs). Maintenance ME requirements varied among pigs and ranged from 997 for SC pigs to 1091 kJ/kg BW0.60 per day for EM pigs. The RQ was significantly lower in EM pigs than in castrated pigs, irrespective of castration method (1.08 vs. 1.15). Dietary ME content tended to vary between 15.13 in IC pigs to 15.41 MJ/kg DM in EM pigs. The NE content of the diet was significantly higher for EM pigs (12.02 vs. 11.34 MJ/kg DM on average for castrated pigs).
Nutrient Deposition
The BW gain was calculated from BW measured at the beginning and at the end of the 6 days of balance measurement; it did not differ between sexes and averaged 1273 g/day (Table 4). From balance measurements, PD was significantly lower for SC pigs (196 vs. 254 g/day on average for EM and IC pigs) whereas FDc was significantly lower for EM pigs (288 vs. 429 g/day on average for SC and IC pigs). Accordingly, the FDc content of BW gain was lower for EM pigs whereas the PD content of BW gain did not differ significantly between sexes and averaged 234 g/day.
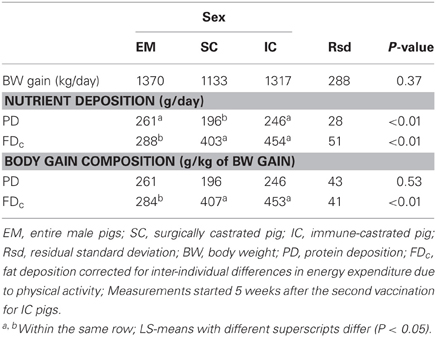
Table 4. Effect of castration and castration method on BW gain and its composition in male growing pigs (results are LS-means; n = 18).
Discussion
Methodological Aspects for Measuring Net Energy Value of a Diet
The evaluation of the energy value of feedstuffs and feeds requires estimating the efficiency of energy utilization of nutrient utilization by animals. In growing animals, theoretical calculations involve the artificial distinction between energy use for maintenance and for growth and require several assumptions regarding metabolic pathways and composition of BW gain (protein and lipid deposition, protein and lipid turnover, fatty acid composition of de novo lipid synthesis). Additionally, these calculations do not account for the energy costs associated with ingestion and digestion of feed. Alternatively, calorimetry measurements in living animals allow estimating an overall efficiency of utilizing dietary energy for maintenance and growth and they include the associated energy costs. In this paper, efficiency was calculated from the inefficiency due to TEF and AHP. Nevertheless, it could be biased by differences in physical activity among animals (i.e., social confinement, reduced physical activity because of contention).
Several methods have been used in the past to quantify physical activity and to link physical activity to energy expenditure. In pigs, these methods have been based on regression analyses between HP and time budget that was determined using infrared barriers (e.g., Noblet et al., 1993) or video recordings (e.g., Rijnen et al., 2003) but these methods do not allow quantifying the level of physical activity (i.e., the mechanical force and the associated efficiency the animal develops because of its physical activity). In this way, results from our experiment indicate that the time the animals spent standing has little effect on AHP (Figure 3). Indeed, the time the pig was standing was measured through an infra-red barrier, which was placed across the cage at the height of the pig's hip. Consequently, standing also included other activities like sitting, rubbing, walking (only to small extent because of the cage), or digging. The quantification of physical activity requires measuring traits which are thought to be proportional to the mechanical force which is exerted by the animal. Indeed, ultrasonic burglars were used in pigs (e.g., Schrama et al., 1998) and more recently, accelerometers have been proposed to measure physical activity in rodents and humans. Nevertheless, these measurements may be subject to errors in estimating accurately physical activity of large animals because measured values can be specific to a given physical activity. The consequence is that measured values can be less representative of the physical activity of the whole body, depending on the position of the ultrasonographic burglar devices relative to the body of the animal, or the position of the accelerometer on the body of the animal. In our experiments and in others (e.g., Even et al., 1991), the cage where the animals were housed was located on force transducers that are sensors that produce an electrical signal proportional to the force the animal exerts on the floor. The partitioning of total HP to determine what is due to physical activity then requires estimating the amount of energy expenditure per unit of electrical signal from force sensors and involves parameter optimization through mathematical modeling. Using the signals from force transducers, the latter has been performed through Kalman filtering (Kalman, 1960; Even et al., 1991) or Nelder–Mead minimization (Nelder and Mead, 1965; van Milgen et al., 1997). In our approach, parameter optimization includes also the determination of energy cost associated with TEF and resting metabolism. In this paper, the determination coefficient of the variations in gas concentrations by the mathematical model averaged 92% over the 126 days that were modeled (18 pigs with 7 days each). Nevertheless, the model considers that each unit of electrical signal from force transducers corresponds to a fixed volume of consumed O2 and produced CO2 and does not account for the metabolic difference in muscles involved in physical activity between standing and lying.
Efficiency of Utilizing Energy in Growing Pigs
Growing animals produce heat because of their maintenance and growing metabolism. Classically, the slope of the relationship between HPc and ME intake (34% in our experiment) was considered as an estimate of the inefficiency of utilizing dietary energy but this approach has been questioned because of the adaptation of animal to feeding level (de Lange et al., 2006; Labussière et al., 2011). In the modelling approach for partitioning HP, AHP and TEF are indicative for the inefficiency in utilizing dietary energy whereas FHP is indicative of the basal metabolic rate of animals (Labussière et al., 2011). This inefficiency varied from 22% in EMs to 26% in castrated pigs which agrees with previous results (Labussière et al., 2011). These values were also lower than those estimated from the classical regression between HPc and ME intake but they were associated with higher values of maintenance energy requirements (Labussière et al., 2011).
Irrespective of castration method, AHP accounted for 8.6% of ME intake, which agrees with previous observations in growing pigs fed close to ad-libitum (from 7.6 to 11.6% of ME intake; Schrama et al., 1998; Le Bellego et al., 2001; Quiniou et al., 2001; van den Borne et al., 2007; Labussière et al., 2011; Renaudeau et al., 2013) but values were highly variable between animals (Figure 3). To account for the possible bias induced by the variation in AHP between animals, a calculation routine was used to standardize AHP between animals, which resulted in variations in TEFc and REc. In our experiment, TEFc was higher in SC and IC pigs than in EM (Table 3). Values for SC or IC pigs agree with previous results in SC pigs which received a similar diet (16.8% of ME intake; Barea et al., 2010). Data for TEFc in EM pigs are scarce but the differences in TEFc between EMs and castrated pigs agree with the differences in metabolism of nutrients due to lower feed intake, higher PD and lower lipid deposition that result in a lower RQ in EM pigs. Indeed, theoretical calculations for energy efficiencies for lipid deposition are always lower when the energy is provided by proteins rather than by carbohydrates or lipids (Armstrong, 1969). Calculations using diet composition and the difference between digested N and N deposited in PD (Table 4) indicate that dietary protein contributed to 13% in EM and 18% in SC of the energy used for maintenance and lipid deposition, which agrees with the lower TEFc in EM pigs. Consequently, dietary NE content, which is thought to be representative of the true energy value of the diet, depended on the sexual type of the animal and it was higher in EM pigs (Table 3).
Maintenance Energy Metabolism in Growing Pigs
During the fasting day, the mathematical modeling of HP was considered to occur according a first-order decrease in energy metabolism between fed and fasted states. The FHP was calculated as the asymptotic value of resting HP (van Milgen et al., 1997). These values of FHP exclude the energy expenditure due to physical activity and the values for SC pigs agree with values previously estimated using a similar methodology (711 to 846 kJ/kg BW0.60 per day; Le Bellego et al., 2001; Le Goff et al., 2002; Lovatto et al., 2006; Barea et al., 2010; Labussière et al., 2011). According to previous results with growing pigs (van Milgen et al., 1998), FHP of EM pigs was higher than that of castrated pigs (Table 3). This result agrees with the greater mass of viscera in EM than in SC (Quiniou and Noblet, 1995), which influences FHP (Koong et al., 1982, 1985; Pekas and Wray, 1991) because of the greater energy requirements of the portal-drained viscera (Johnson et al., 1990; Ortigues et al., 1995). Estimating FHP allows determining MEm in growing animals as the ratio between FHP and kmg (Labussière et al., 2009) without involving the classical regression analyses between RE and ME intake (Kielanowski, 1965; Baldwin, 1995b). The classical regression analysis has been criticized because of the adaptation of the animal to feeding level (de Lange et al., 2006; Labussière et al., 2011). In our experiment, MEm was higher in EM than in SC pigs, which disagrees with previous results (Noblet et al., 1999). Nevertheless, the latter values were calculated from the classical regression methods and were obtained with pigs at lower BW (i.e., younger) than those in the present study. The difference in energy metabolism between entire and castrated males may be less pronounced because of less advanced sexual maturity.
In conclusion, mathematical modeling of daily dynamics of HP and accounting for the variation in physical activity among animals allows calculating the energy expenditure due to physical activity and TEF, in addition to the HP due to basal metabolic rate. In growing animals, the energy utilization of the diet depends on metabolic pathways involved in maintenance and lipid deposition, according to the nutrients that are used. Consequently, the dietary NE content depends on the sexual type of growing animals.
Conflict of Interest Statement
The authors declare that the research was conducted in the absence of any commercial or financial relationships that could be construed as a potential conflict of interest.
Acknowledgments
The authors would like to thank E. Gonzalo, R. Janvier, Y. Jaguelin-Peyaud, A. Pasquier and V. Piedvache for animal care and laboratory analyses.
References
AFNOR. (1998). Norme ISO 9831:1998. Détermination de la Valeur Calorifique Brute. Méthode à la Bombe Calorimétrique. Genève: Organisation Internationale de Normalisation.
AOAC. (1990). Official Methods of Analysis. Arlington, TX: Association of Official Analytical Chemists.
Armstrong, D. G. (1969). “Cell bioenergetics and energy metabolism,” in Handbuch der Tierernährung, eds W. Lenkeit, K. Breirem, and E. Crasemann (Hamburg: Verlag P. Parey), 385–414.
Baker, J. F., Buckley, B. A., Dickerson, G. E., and Nienaber, J. A. (1991). Body composition and fasting heat production from birth to 14 months of age for three biological types of beef heifers. J. Anim. Sci. 69, 4406–4418.
Baldwin, R. L. (1995a). “Animal energetic models,” in Modeling Ruminant Digestion and Metabolism, ed R. L. Baldwin (London: Chapman and Hall), 118–147.
Baldwin, R. L. (1995b). “Energy requirements for maintenance and production,” in Modeling Ruminant Digestion and Metabolism, ed R. L. Baldwin (London: Chapman and Hall), 148–188.
Barea, R., Dubois, S., Gilbert, H., Sellier, P., van Milgen, J., and Noblet, J. (2010). Energy utilization in pigs selected for high and low residual feed intake. J. Anim. Sci. 88, 2062–2072. doi: 10.2527/jas.2009-2395
Brouwer, E. (1965). “Report of sub-comittee on constants and factors,” in Energy Metabolism, ed K. L Blaxter (London: Academic Press), 441–443.
de Lange, K., van Milgen, J., Noblet, J., Dubois, S., and Birkett, S. (2006). Previous feeding level influences plateau heat production following a 24 h fast in growing pigs. Br. J. Nutr. 95, 1082–1087. doi: 10.1079/BJN20061748
Even, P. C., Perrier, E., Aucouturier, J. L., and Nicolaïdis, S. (1991). Utilisation of the method of Kalman filtering for performing the on-line computation of background metabolism in the free-moving, free-feeding rat. Physiol. Behav. 49, 177–187. doi: 10.1016/0031-9384(91)90252-J
Johnson, D. E., Johnson, K. A., and Baldwin, R. L. (1990). Changes in liver and gastrointestinal tract energy demands in response to physiological workload in ruminants J. Nutr. 120, 649–655.
Kalman, R. E. (1960). A new approach to linear filtering and predictions problems. J. Basic Eng. 82, 35–45. doi: 10.1115/1.3662552
Kielanowski, J. (1965). “Estimates of the energy cost of protein depostion in growing animals,” in Energy Metabolism, ed K. L Blaxter (London: Academic Press), 13–20.
Koong, L. J., Ferrell, C. L., and Nienaber, J. A. (1985). Assessment of interrelationships among levels of intake and production, organ size and fasting heat production in growing animals. J. Nutr. 115, 1383–1390.
Koong, L. J., Nienaber, J. A., Pekas, J. C., and Yen, J. T. (1982). Effects of plane of nutrition on organ size and fasting heat production in pigs. J. Nutr. 112, 1638–1642.
Kubale, V., Batorek, N., Škrlep, M., Prunier, A., Bonneau, M., Fazarinc, G., et al. (2013). Steroid hormones, boar taint compounds, and reproductive organs in pigs according to the delay between immunocastration and slaughter. Theriogenology 79, 69–80. doi: 10.1016/j.theriogenology.2012.09.010
Labussière, E., Maxin, G., Dubois, S., van Milgen, J., Bertrand, G., and Noblet, J. (2009). Effect of feed intake on heat production and protein and fat deposition in milk-fed veal calves. Animal 3, 557–567. doi: 10.1017/S1751731108003777
Labussière, E., van Milgen, J., de Lange, C. F. M., and Noblet, J. (2011). Maintenance energy requirements of growing pigs and calves are influenced by feeding level. J. Nutr. 141, 1855–1861. doi: 10.3945/jn.111.141291
Le Bellego, L., van Milgen, J., Dubois, S., and Noblet, J. (2001). Energy utilization of low-protein diets in growing pigs. J. Anim. Sci. 79, 1259–1271.
Le Goff, G., Dubois, S., van Milgen, J., and Noblet, J. (2002). Influence of dietary fiber level on digestive and metabolic utilization of energy in growing and finishing pigs. Anim. Res. 51, 245–259. doi: 10.1051/animres:2002019
Lovatto, P. A., Sauvant, D., Noblet, J., Dubois, S., and van Milgen, J. (2006). Effects of feed restriction and subsequent refeeding on energy utilization in growing pigs. J. Anim. Sci. 84, 3329–3336. doi: 10.2527/jas.2006-048
Martin, M. A. (2010). First generation biofuels compete. N. Biotechnol. 27, 596–608. doi: 10.1016/j.nbt.2010.06.010
Nelder, J. A., and Mead, R. (1965). A simplex method for function minimization. Comput. J. 7, 308–313. doi: 10.1093/comjnl/7.4.308
Noblet, J., Henry, Y., and Dubois, S. (1987). Effect of protein and lysine levels in the diet on body gain composition and energy utilization in growing pigs J. Anim. Sci. 65, 717–726.
Noblet, J., Karege, C., Dubois, S., and van Milgen, J. (1999). Metabolic utilization of energy and maintenance requirements in growing pigs: effects of sex and genotype. J. Anim. Sci. 77, 1208–1216.
Noblet, J., Shi, X. S., and Dubois, S. (1993). Energy cost of standing activity in sows. Livest. Prod. Sci. 34, 127–136. doi: 10.1016/0301-6226(93)90041-F
Ortigues, I., Martin, C., Durand, D., and Vermorel, M. (1995). Circadian changes in energy expenditure in the preruminant calf: whole animal and tissue level. J. Anim. Sci. 73, 552–564.
Ortigues, I., Vermorel, M., and Vernet, J. (1994). Calorimétrie indirecte. 1. Calcul des échanges respiratoires des animaux et des humains en vue de la détermination de leurs dépenses énergétiques à l'aide de chambres respiratoires. Cahier des Techniques de l'INRA 34, 15–32.
Pekas, J. C., and Wray, J. E. (1991). Principal gastrointestinal variables associated with metabolic heat production in pigs: statistical cluster analyses. J. Nutr. 121, 231–239.
Quiniou, N., and Noblet, J. (1995). Prediction of tissular body composition from protein and lipid deposition in growing pigs. J. Anim. Sci. 73, 1567–1575.
Quiniou, N., Noblet, J., van Milgen, J., and Dubois, S. (2001). Modelling heat production and energy balance in group-housed growing pigs exposed to low or high ambient temperatures. Br. J. Nutr. 85, 97–106. doi: 10.1079/BJN2000217
R Development Core Team. (2010). R: A Language and Environment for Statistical Computing. Vienna: R Foundation for Statistical Computing.
Renaudeau, D., Frances, G., Dubois, S., Gilbert, H., and Noblet, J. (2013). Effect of thermal heat stress on energy utilization in two lines of pigs divergently selected for residual feed intake. J. Anim. Sci. 91, 1162–1175. doi: 10.2527/jas.2012-5689
Rijnen, M. M. J. A., Verstegen, M. W. A., Heetkamp, M. J. W., and Schrama, J. W. (2003). Effects of two different dietary fermentable carbohydrates on activity and heat production in group-housed growing pigs. J. Anim. Sci. 81, 1210–1219.
Schrama, J. W., Bosch, M. W., Verstegen, M. W., Vorselaars, A. H., Haaksma, J., and Heetkamp, M. J. (1998). The energetic value of nonstarch polysaccharides in relation to physical activity in group-housed, growing pigs. J. Anim. Sci. 76, 3016–3023.
Soetaert, K., Petzoldt, T., and Setzer, R. W. (2010). Solving differential equations in R: package deSolve. J. Stat. Softw. 33, 1–25.
van den Borne, J. J. G. C., Schrama, J. W., Heetkamp, M. J. W., Verstegen, M. W. A., and Gerrits, W. J. J. (2007). Synchronising the availability of amino acids and glucose increases protein retention in pigs. Animal 1, 666–674. doi: 10.1017/S1751731107736741
van Milgen, J., Bernier, J. F., Lecozler, Y., Dubois, S., and Noblet, J. (1998). Major determinants of fasting heat production and energetic cost of activity in growing pigs of different body weight and breed/castration combination. Br. J. Nutr. 79, 509–517. doi: 10.1079/BJN19980089
van Milgen, J., and Noblet, J. (2000). “Modelling energy expenditure in pigs,” in Modelling Nutrient Utilization in Farm Animals, eds J. P. McNamara, J. France, and D. E. Beever (Oxon: CAB International), 103–114. doi: 10.1079/9780851994499.0103
van Milgen, J., Noblet, J., Dubois, S., and Bernier, J. F. (1997). Dynamic aspects of oxygen consumption and carbon dioxide production in swine. Br. J. Nutr. 78, 397–410. doi: 10.1079/BJN19970159
Keywords: male pig, castrated pig, energy expenditure, physical activity, energy requirements
Citation: Labussière E, Dubois S, van Milgen J and Noblet J (2013) Partitioning of heat production in growing pigs as a tool to improve the determination of efficiency of energy utilization. Front. Physiol. 4:146. doi: 10.3389/fphys.2013.00146
Received: 14 February 2013; Accepted: 31 May 2013;
Published online: 19 June 2013.
Edited by:
Patrick C. Even, AgroParisTech, FranceReviewed by:
Cornelia C. Metges, Leibniz Institute for Farm Animal Biology, GermanyIsabelle Ortigues-Marty, Institut National de la Recherche Agronomique, France
Copyright © 2013 Labussière, Dubois, van Milgen and Noblet. This is an open-access article distributed under the terms of the Creative Commons Attribution License, which permits use, distribution and reproduction in other forums, provided the original authors and source are credited and subject to any copyright notices concerning any third-party graphics etc.
*Correspondence: Etienne Labussière, INRA - UMR Pegase, F-35590 Saint-Gilles, France e-mail: etienne.labussiere@rennes.inra.fr