
- 1Whiting School of Engineering, Department of Biomedical Engineering, The Johns Hopkins University, Baltimore, MD, USA
- 2Department of Biology, The Johns Hopkins University, Baltimore, MD, USA
- 3Division of Cardiology, Department of Medicine, Johns Hopkins Hospital, Baltimore, MD, USA
- 4Cardiovascular Division, Department of Medicine, Washington University School of Medicine, St. Louis, MO, USA
Background: While it is known that elevated baseline intracardiac repolarization lability is associated with the risk of fast ventricular tachycardia (FVT)/ventricular fibrillation (VF), the effect of its longitudinal changes on the risk of FVT/VF is unknown.
Methods and Results: Near-field (NF) right ventricular (RV) intracardiac electrograms (EGMs) were recorded every 3–6 months at rest in 248 patients with structural heart disease [mean age 61.2 ± 13.3; 185(75%) male; 162(65.3%) ischemic cardiomyopathy] and implanted cardioverter-defibrillator (ICD) or cardiac resynchronization therapy defibrillator (CRT-D) [201 (81%) primary prevention]. Intracardiac beat-to-beat QT variability index (QTVINF) was measured on NF RV EGM. During the first study phase (median 18 months), participants made on average 2.4 visits. Then remote follow-up was continued for an additional median period of 3 years. Average QTVINF did not change during the first year after ICD implantation (−0.342 ± 0.603 at baseline vs. −0.262 ± 0.552 at 6 months vs. −0.334 ± 0.603 at 12 months); however, it decreased thereafter (−0.510 ± 0.603 at 18 months; P = 0.042). Adjusted population-averaged GEE model showed that the odds of developing FVT/VF increased by 75% for each 1 unit increase in QTVINF. (OR 1.75 [95%CI 1.05–2.92]; P = 0.031). However, individual patient–specific QTVINF trends (increasing, decreasing, flat) varied from patient to patient. For a given patient, the odds of developing FVT/VF were not associated with increasing or decreasing QTVINF over time [OR 1.27; (95%CI 0.05–30.10); P = 0.881].
Conclusion: While on average the odds of FVT/VF increased with an increase in QTVINF, patient-specific longitudinal trends in QTVINF did not affect the odds of FVT/VF.
Augmented intracardiac repolarization lability predicts ventricular arrhythmia (Haigney et al., 2004; Couderc et al., 2007; Tereshchenko et al., 2009), sudden cardiac death (SCD) (Piccirillo et al., 2007) and cardiovascular mortality (Tereshchenko et al., 2012) in patients with structural heart disease and long QT syndrome (Hinterseer et al., 2008). Underlying mechanisms of increased repolarization lability are associated with arrhythmogenic substrate [scar, fibrosis, local heterogeneities in action potential duration and morphology, cell-to-cell uncoupling, stochastic gating of ion channels (Pueyo et al., 2011), and increased sympathetic tone in the ventricles of the heart (Baumert et al., 2011)]. It is known that arrhythmogenic substrate does change over time. However, little is known about neither the rate of changes in repolarization lability over 6–12–18 month period nor the predictive value of these changes.
Dynamic time-dependent association between alternating repolarization variability and cardiac death has been previously reported. The Alternans Before Cardioverter Defibrillator (ABCD) Trial showed that baseline microvolt T-wave alternans (TWA) was significantly associated with sustained ventricular tachycardia (VT)/ ventricular fibrillation (VF) or SCD at 6 months, but lost association at 12 months of follow-up (Costantini et al., 2009). ABCD trial results brought up discussion regarding the necessity for establishing the “expiration date” for TWA results, and raised the question about possible utility of repetitive TWA assessment. While elevated repolarization lability, TWA and other non-invasive risk markers (including decreased heart rate variability) have been found to be associated with life-threatening VT/VF and SCD, none of them are routinely used for risk stratification of primary prevention implantable cardioverter defibrillator (ICD) (Tereshchenko and Berger, 2012). Repeated measurement of risk markers might strengthen their predictive value. However, studies of longitudinal changes in repolarization lability are limited.
Earlier we showed that repolarization lability is present throughout the myocardium (Tereshchenko et al., 2009). We demonstrated that the single baseline measurement of intracardiac QT variability index (QTVINF), was associated with fast ventricular tachycardia (FVT)/VF during the subsequent 16 months of follow-up. However, the effect of longitudinal changes in intracardiac repolarization lability on the risk of FVT/VF is unknown. The goal of the present study was to determine if patients with increasing intracardiac QTVINF over time experience a greater probability of having FVT/VF than those with decreasing or stable intracardiac QTVINF.
Methods
The ICD-EGMs study (Tereshchenko et al., 2009) protocol was approved by the Johns Hopkins University and the Washington University Human Studies Committees and all participants gave written informed consent before entering the study.
Study Population
The ICD-EGMs study design (NCT00916435) was previously described (Tereshchenko et al., 2009). Briefly, patients with structural heart disease of either sex older than 18 years were enrolled in the study if they had a transvenous ICD or a cardiac resynchronization therapy defibrillator (CRT-D) device implanted for primary or secondary prevention of SCD. In this study we included only participants who (1) had ICD or CRT-D implanted 1 week before enrollment, (2) made at least 2 consecutive office follow-up visits during the first study phase (2005–2007), (3) had at least 2 analyzable digital recordings of intracardiac EGMs at rest that were at least 30 days apart, (4) had EGMs recorded in sinus rhythm, with (5) identical type of ventricular activation [either ventricular-sensed (VS), or ventricular-paced (VP)] at baseline and at all follow-up visits.
Recording of Intracardiac EGMs and Follow-Up of Study Participants
Recording of intracardiac EGMs was performed at every office follow-up visit (every 3–6 months) during the first 2 years of the study (2005–2007). Patients were then followed remotely via Carelink® and Latitude® during next 4 years (2007–2011). Near-field (NF) and far-field (FF) RV intracardiac EGMs were recorded at rest for 5–15 min simultaneously with surface electrocardiogram (ECG) via ICD programmer as previously described (Tereshchenko et al., 2009).
Duration of time periods between follow-up visits varied from patient to patient, due to the observational nature of the study. In order to standardize assessment of longitudinal changes in EGM parameters, we categorized follow-up periods as the following. All follow-up visits that occurred in a period of 1–6 months after the baseline (Visit 1) were considered as Visit 2. Visit 3 EGM recording was performed at any time in a period of 181–365 days after baseline EGM recording. Visit 4 was performed during the 1st half of the 2nd year of follow-up.
Intracardiac Repolarization Lability Analysis
Intracardiac repolarization lability was measured on NF RV EGM as previously described (Tereshchenko et al., 2009) by Berger's method (Berger et al., 1997), using customized MATLAB (MathWorks, Inc., Natick, MA) software. The R-wave peak was automatically detected on NF EGM channel. Two investigators (AG, JL) defined an intracardiac intervals template by selecting the beginning and the end of major NF EGM deflection, and the end of the T wave. The algorithm then determined how much the repolarization segment of each beat had to be stretched or compressed to match the template. Appropriate selection of fiducial points was verified by the third investigator (LGT). Premature ventricular and atrial beats with one post-ectopic sinus beat were excluded from the analysis. Recordings with more than 15% of ectopic, or noise-distorted beats were excluded.
Endpoints
Appropriate ICD shocks for FVT/VF served as the endpoints in this study. Programming of the ICD device was based on clinical evaluation of the attending electrophysiologist. ICD interrogation data was adjudicated by an endpoint committee composed of 3 members. ICD therapy occurring for VT or VF was classified as appropriate (Tereshchenko et al., 2009). FVT/VF was defined as VT/VF with an average cycle length (CL) ≤ 240 ms. After the 1st FVT/VF event follow-up was continued, and all subsequent sustained FVT/VF events with appropriate ICD shocks were included in the analysis as the study endpoints.
Statistical Analysis
The association of baseline clinical characteristics and ECG parameters with the type of presenting rhythm was measured by the χ2-tests and ANOVA or t-test, respectively, for categorical and continuous variables with normal distribution. A test of equality of medians or Wilcoxon rank-sum test was used in case the distribution of parameter was not normal. A P-value of <0.05 was considered significant. Data analysis was performed using STATA 12.1 (StataCorp LP, College Station, TX).
As office visits were unequally spaced in time, QTVI variogram was explored, and follow-up time periods were equalized with incremental 6 months-intervals. Possible effects of VP on longitudinal QTVINF changes were explored in patients with different devices types (single-chamber ICD, dual-chamber ICD, CRT-D), as well as in patients who predominantly (at least 99% of follow-up time and 100% of recorded EGM) had VS, in comparison to VP rhythm. “Spaghetti” plots were examined to study variations of QTVINF across time for each individual. Smoothed plots were used to explore group response of QTVINF as a function of time, to study variations of QTVINF across different individuals. Average changes in QTVINF per 6 months of follow-up were determined. Patterns of QTVINF changes over time in patients with and without FVT/VF were compared. Since repeated measures made on the same subject are correlated, within-person correlations matrix of QTVINF across multiple visits was estimated, and the correlation structure was described. The correlation structure for the residuals was explored after removing the mean trend effect. To standardize QTVINF at each visit, we subtracted observations in each category (each visit) by the mean for that visit and then divided them by the standard deviation for that visit. Further longitudinal regression analyses took into account the visit-to-visit QTVINF correlation structure to obtain valid inferences.
We compared the association of FVT/VF events with preceding longitudinal QTVINF changes in an average study participant (in the population-averaged model), and in specific study subject (in the subject-specific model). Population-averaged marginal model accounting for correlation structure [Generalized Estimating Equations (GEE) model] was developed. Multivariate GEE model was used to determine an association between a population-averaged longitudinal QTVINF changes, and a subsequent outcome. FVT/VF events with appropriate ICD shocks that occurred after respective QTVINF measurements served as an outcome. GEE model was adjusted by age, sex, race, left ventricular ejection fraction (LVEF), New York Heart Association (NYHA) heart failure class (dichotomized as NYHA = II), indication for ICD (primary or secondary prevention of SCD), type of cardiomyopathy (ischemic or non-ischemic), history of revascularization procedure (either PCI or CABG), type of implanted device(single-chamber ICD, dual-chamber ICD, CRT-D), type of analyzed rhythm (VS or VP), and use of class III anti-arrhythmic medications.
In order to determine the patient-specific association of longitudinal QTVINF changes with subsequent FVT/VF, we ran a random intercept model for FVT/VF. We accounted for correlation of the repeated QTVINF observations by including a random intercept for each patient and control for patient's QTVINF (centered). Adequate fitting of the model was checked to ensure that the specified quadrature has adequately approximated the likelihood.
Results
Study Population
We analyzed the data of 248 study participants: 185 (74.6%) men, 201 Whites (81%), mean age 61.2 ± 13.3 y. Clinical characteristics of study participants are shown in Table 1. We categorized study participants based on their presenting rhythm during follow-up office visits. VS participants were paced <1% during the study duration (Table 1) and were not paced from ventricle(s) during study EGM recordings. Patients who presented with a sinus rhythm, and were 100% VP during the study EGM recordings, comprised VP group. Figure 1 shows representative examples of longitudinal changes in RR' and QT variability in patients with and without ventricular arrhythmia.
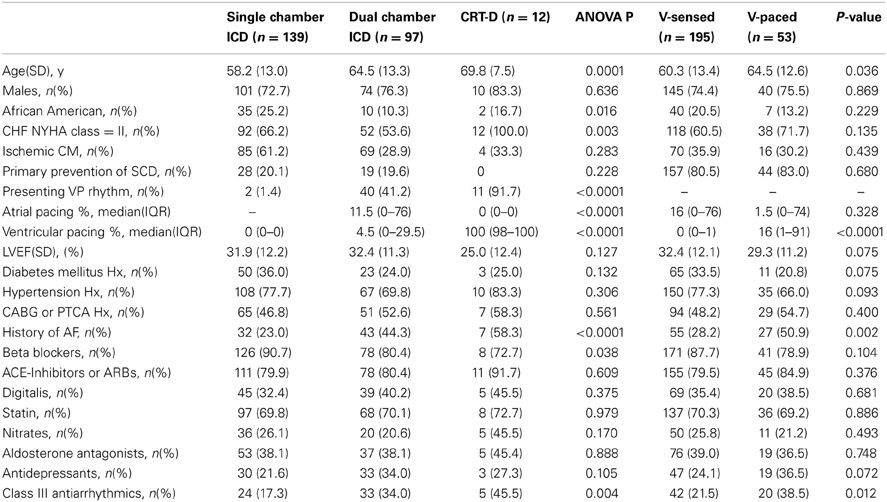
Table 1. Comparison of demographic and clinical characteristics of patients with single-, dual-chamber ICD, and CRT-D, and in patients with sinus ventricular-sensed and ventricular-paced rhythm.
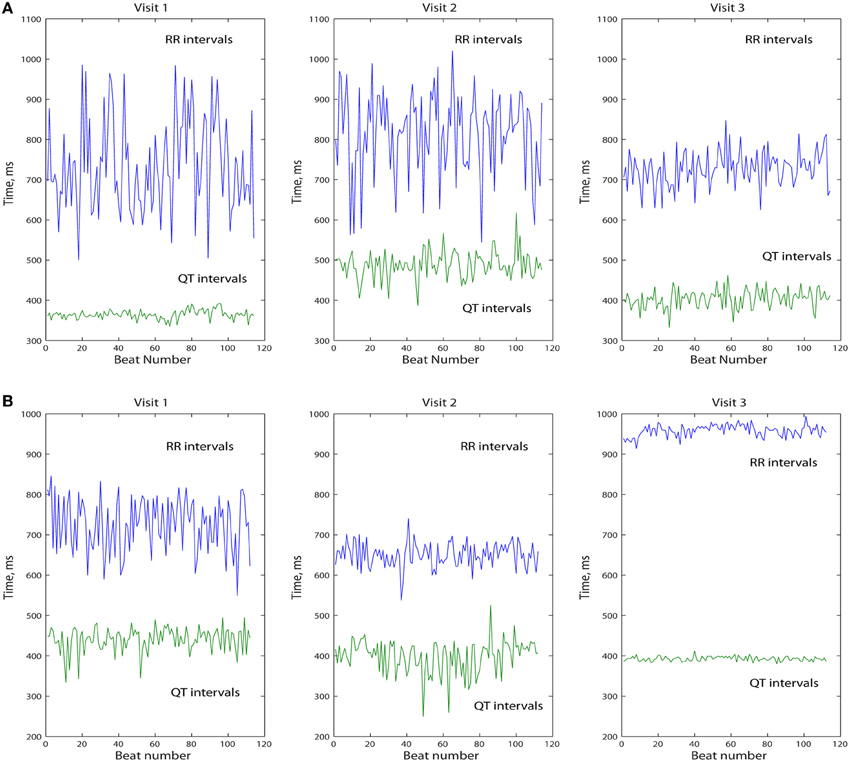
Figure 1. Representative example of longitudinal changes in beat-to-beat intracardiac QT and RR' variability in patient with (A) and without (B) sustained FVT/VF and appropriate ICD shocks.
As expected, due to the differences in HF severity, CRT-D patients had significantly higher mean heart rate as compared to single-and dual-chamber ICD patients (Table 2). However, QT interval on NF RV EGM (QTNF) was longer in patients with dual-chamber ICDs as compared to those with single chamber ICDs and CRT-Ds. There were no significant differences in heart rate variance, QTNF variance, and QTVINF amongst patients with different device types, nor in patients with presenting VS vs. those with VP sinus rhythm (Table 2).
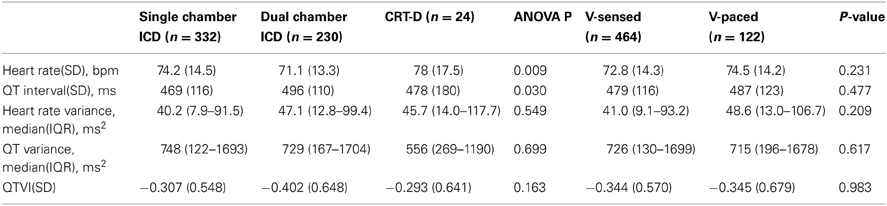
Table 2. Comparison of all-visits averaged ECG parameters in patients with single-, dual-chamber ICD, and CRT-D, and in patients with sinus ventricular-sensed and ventricular-paced rhythm.
Ventricular Tachyarrhythmia During Follow-Up
During the first study phase participants made on average 2.4 visits. FVT/VF events with appropriate ICD shocks were diagnosed in 26 (10.5%) patients. Multiple FVT/VF during follow-up were observed in 20 (77%) out of 26 patients, frequently in clusters. Baseline clinical characteristics in patients with or without FVT/VF during follow-up did not differ (Table 3). Importantly, QTVINF was the only ECG parameter that differentiated patients with and without arrhythmia. QTVINF was significantly higher in patients with FVT/VF than in patients without FVT/VF (Table 4).
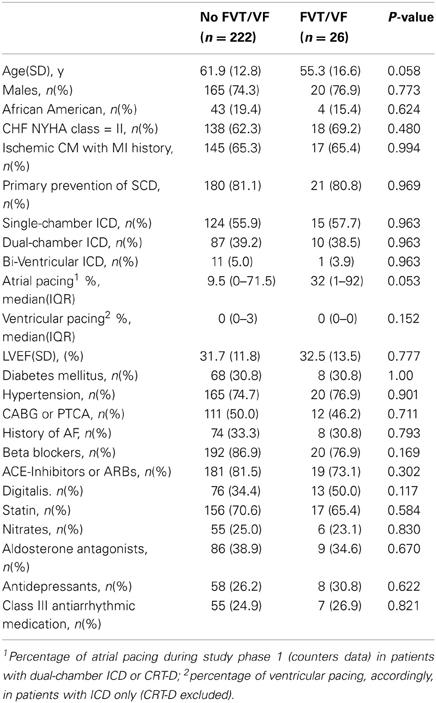
Table 3. Comparison of baseline clinical and demographic characteristics in patients with and without FVT/VF during follow-up.
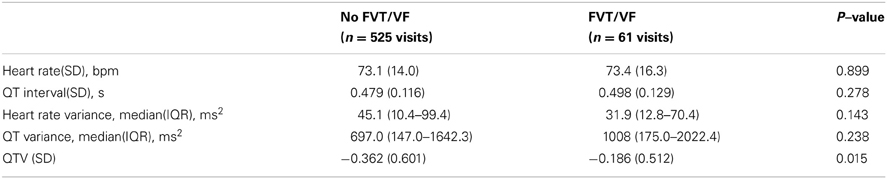
Table 4. Comparison of all-visits averaged ECG parameters in patients with and without FVT/VF during follow-up.
The Mean Trend in Longitudinal Changes of Intracardiac Repolarization Lability
Average QTVINF in study participants with single-chamber ICD did not change during the study period. However, average QTVINF in patients with dual-chamber ICDs increased during the first year after ICD implantation, but slightly decreased thereafter (Figure 2). At the same time, no statistically significant differences were observed in all VS, as compared to all VP patients (Figure 3). Averaged trend in QTVINF was different in patients with FVT/VF, as compared to patients without FVT/VF (Figure 4).
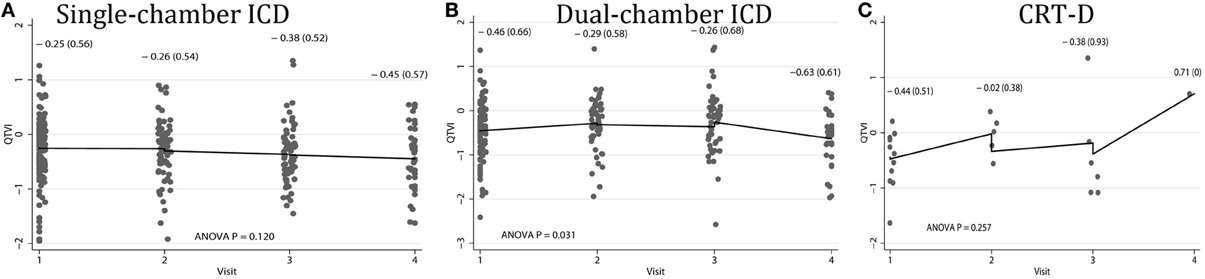
Figure 2. Comparison of population-averaged longitudinal trends in QTVINF in patients with (A) single-chamber ICD, (B) dual-chamber ICD, (C) CRT-D. Scatterplot of QTVINF at each standardized study visit is shown. Lowess smoother curve shows mean trend in QTVINF over time.
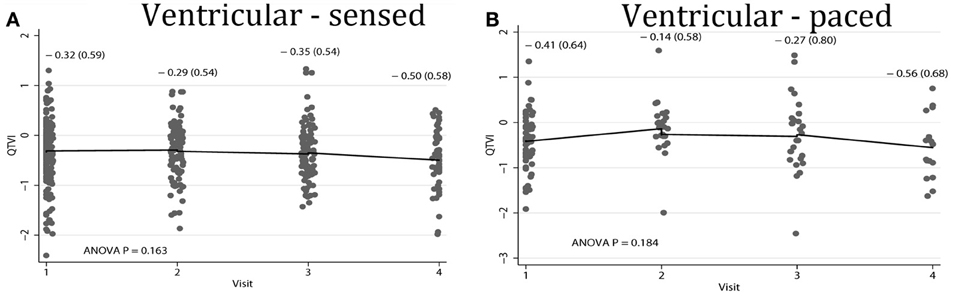
Figure 3. Comparison of population-averaged longitudinal trends in QTVINF in patients with (A) presenting ventricular-sensed (VS), and (B) presenting ventricular-paced (VP) sinus rhythm. Scatterplot of QTVINF at each standardized study visit is shown. Lowess smoother curve shows mean trend in QTVINF over time.
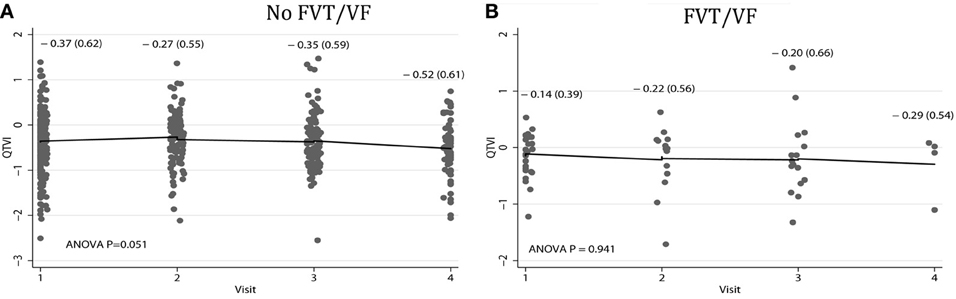
Figure 4. Comparison of population-averaged longitudinal trends in QTVINF in patients (A) without FVT/VF, and (B) with sustained FVT/VF and appropriate ICD shocks. Scatterplot of QTVINF at each standardized study visit is shown. Lowess smoother curve shows mean trend in QTVINF over time.
Subject-Specific Changes in Repolarization Lability Over Time
Individual patients demonstrated drastically different trends: in some patients intracardiac QTVINF increased while in others QTVINF decreased, stayed flat, or fluctuated over time. There were no differences in the behavior of the subject-specific longitudinal relationships in patients with different device type (Figure 5), or any between groups of VS and VP patients (Figure 6). Moreover, no differences in subject-specific QTVINF longitudinal trends were observed in patients with FVT/VF, as compared to patients without FVT/VF (Figure 7). Multiple cross-overs of the lines indicated that the relative order of patients, ordered by their baseline QTVINF, changed over time. The study population-averaged QTVINF longitudinal relationship (Figures 2–4) was not consistent with the subject-specific longitudinal relationship (Figures 5–7).
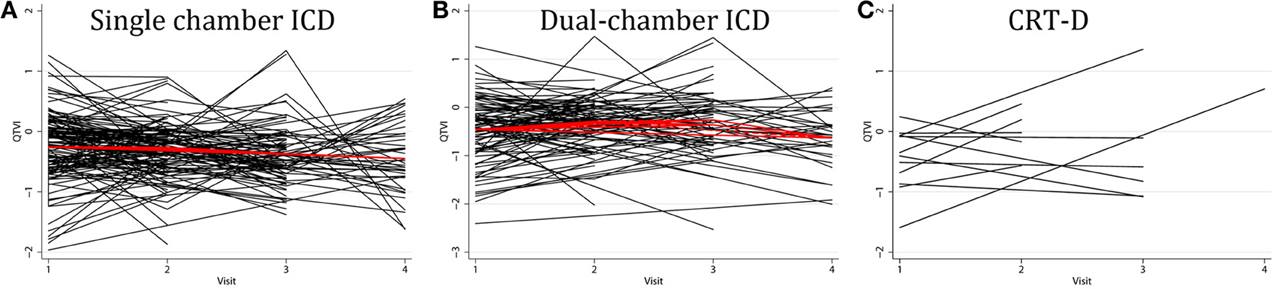
Figure 5. “Spaghetti” plots of individual patient-specific longitudinal relationships between QTVINF and time for each subject with (A) single-chamber ICD, (B) dual-chamber ICD, (C) CRT-D.
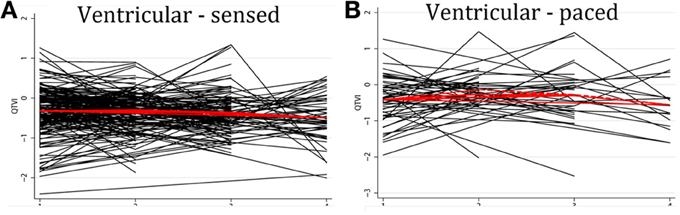
Figure 6. “Spaghetti” plots of individual patient-specific longitudinal relationships between QTVINF and time for each subject with (A) presenting ventricular-sensed (VS), and (B) presenting ventricular-paced (VP) sinus rhythm.
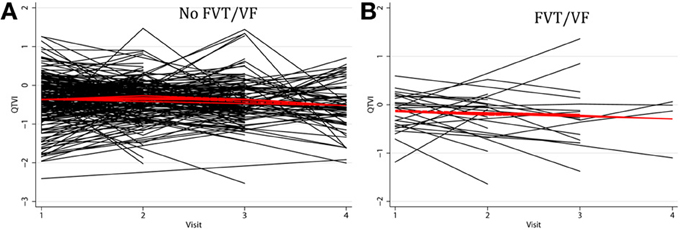
Figure 7. “Spaghetti” plots of individual patient-specific longitudinal relationships between QTVINF and time for each subject (A) without FVT/VF, and (B) with sustained FVT/VF and appropriate ICD shocks.
We observed weak positive correlation between QTVINF at the 1st and the 4th visits, and at the 1st and the 2nd visits in patients with single-chamber ICD (r = 0.312; P = 0.047 and r = 0.269; P = 0.024, respectively) and VS patients (r = 0.297; P = 0.026 and r = 0.384; P < 0.0001, respectively), and weak negative correlation in QTVINF at the 3rd and 4th visit (r = −0.604; P = 0.003 in single-chamber ICD group; r = −0.426; P = 0.021 in VS patients). Thus, in a given patient with single-chamber ICD who did not experience ventricular pacing, QTVINF 1 week after ICD implantation more likely positively correlated with QTVINF 1.5 years after ICD implantation. If such a patient experienced elevation of QTVINF during the 1st year post-ICD implantation, then during the next 6 months QTVINF was more likely decreasing (negative correlation in QTVINF between the 3rd and the 4th visits). No significant correlations between QTVINF observations at different visits in VP patients, both with dual-chamber ICDs and CRT-D devices were found.
Association Between Longitudinal Changes in Repolarization Lability and Subsequent FVT/VF
The mean QTVINF trend in patients without FVT/VF demonstrated slight, but significant decrease 1.5 years after device implantation (Figure 4A), whereas no changes in mean QTVINF were observed in patients with FVT/VF (Figure 4B). Patterns of the subject-specific relationships between QTVINF and time looked alike in patients with and without FVT/VF (Figures 7A,B). QTVINF correlations structure in patients without FVT/VF revealed weak positive correlation between the 1st and the 2nd visit (r = 0.257; P = 0.004) and negative correlation of approximately the same strength between the 3th and the 4th visit (r = −0.339; P = 0.040). However, QTVINF measured at different visits in a given patient who experienced FVT/VF during follow-up, did not correlate.
In order to study patient-specific dynamic changes in intracardiac RL before FVT/VF, we plotted QTVINF before each FVT/VF event. We used the actual time from then EGM recording to the FVT/VF event as a continuous variable (Figure 8). Noticeably, QTVINF distribution in patients without FVT/VF (Figure 8A) looked similar to that in patients before FVT/VF (Figure 8B). Trends of increasing, decreasing, and flat over time QTVINF were observed before FVT/VF events (Figure 8C). Of note, consistent pattern of increasing over time QTVINF before all FVT/VF events was observed in some (but not all) individual patients with multiple FVT/VF events. In contrast, patients with a single FVT/VF event tended to demonstrate rather decreasing over time QTVINF. However, small subgroups size did not allow us to quantify observed differences.
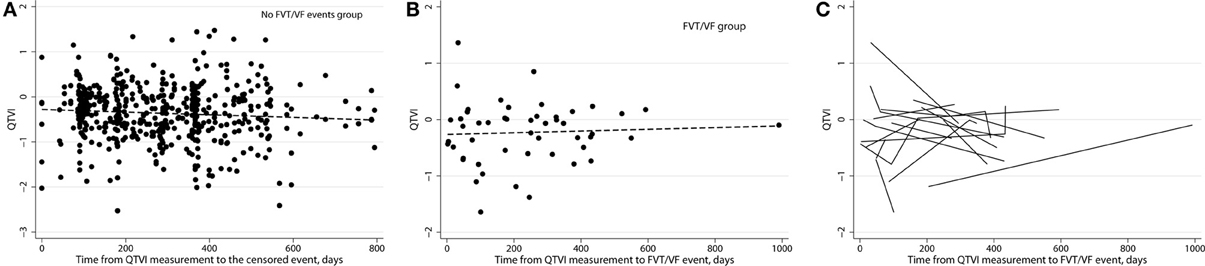
Figure 8. (A) Variogram of QTVINF in patients without FVT/VF shows actual time since EGM recording till censored. (B) Variogram of QTVINF in patients with FVT/VF shows actual time since EGM recording till sustained FVT/VF with ICD shock. (C) Line “spaghetti” plots of the longitudinal relationships between QTVINF and actual time of FVT/VF for each patient with FVT/VF event.
GEE Population-Averaged Model
In multivariate GEE analysis with independent correlation structure, increasing over a time course of several months QTVINF was significantly associated with FVT/VF event [OR 1.75 (95%CI 1.05–2.92); P = 0.031]. Thus, on average, for patients in our study, the odds of developing FVT/VF increased by 75% for each 1 unit increase in QTVINF.
Subject-Specific Random Intercept Model
Association between patient-specific dynamic changes in QTVINF and FVT/VF was studied in the random-effects logistic regression. In order to determine if a specific patient with increasing QTVINF over time experiences a greater probability of having FVT/VF, as compared to patient with decreasing or stable QTVINF, we ran random-effects logistic regression analysis. For a given patient, the odds of developing FVT/VF were not associated with increasing or decreasing QTVINF [OR 1.27; (95%CI 0.05–30.10); P = 0.881] over time. We used 194 integration points in this model for assurance that the likelihood is appropriately approximated, which was confirmed. In addition, we explored potential interactions and adjusted patient-specific models for the effect of VP in preceding follow-up interval, for percentage of beats, included in QTVI analysis by automated software, and for the differences in follow-up time interval. Subject-specific longitudinal QTVINF trend was associated neither with study outcome (FVT/VF), nor with any other measured in this study clinical, demographic, or ECG parameter.
Discussion
Our study revealed differences in population-averaged and patient-specific intracardiac QTVINF trends over 1.5 years after device implantation. In patients without FVT/VF events population-averaged QTVINF decreased after the 1st year since ICD implantation, whereas in patients with FVT/VF events averaged QTVINF did not change. Group-averaged QTVINF was independently associated with the odds of life-threatening FVT/VF. On average, the odds of FVT/VF increased by 75% for each 1 unit increase in QTVINF.In contrast, individual subject-specific QTVINF trends in many patients differed from the mean trend for the whole study population. Individual subject-specific trends in intracardiac QTVINF were not associated with subsequent FVT/VF.
Longitudinal Studies of Repolarization Lability: Mean Trend vs. Subject-Specific Changes Over Time
Population-averaged trends in repolarization lability and TWA changes immediately before VT/VF have been previously studied. The vast majority of investigators explored short-term (24–48 h) dynamic ECG changes. Shusterman et al. (2006) described an upsurge of alternating and non-alternating RL 10 min before the onset of VT/VF in HF patients. Analysis of 24-h Holter ECG revealed pronounced diurnal variations in QTVI (higher QT variability in the morning and during the day, and lower QT variability during the night) in HF patients (Dobson et al., 2009). At the same time, no significant changes in the mean QTVI trend was detected during 12 h of ECG monitoring before the onset of spontaneous VT/VF in the acute intensive cardiac care unit patients (Sachdev et al., 2010). In this study population-averaged model reflected absolute difference in QTVINF12–18 month after ICD implantation in patients with and without subsequent FVT/VF (Table 4; Figure 4), and re-confirmed our previous finding of association between elevated QTVINF and VT/VF (Tereshchenko et al., 2009).
Very few investigators studied subject-specific trends in repolarization lability. Swerdlow and co-investigators (2011) used subject-specific longitudinal analysis approach and showed increased intracardiac TWA/variability immediately before VT/VF onset in ICD patients. To the best of our knowledge, our study is the first that compared patient-specific and population-averaged longitudinal trends in intracardiac QTVINF. Mechanistically, each individual's longitudinal outcome is governed by subject-specific disease dynamics over time. Hence, each subject's repolarization lability trajectory neither necessarily progresses in accord with a rigid population mean curve nor varies with bounded variation. Evidently, some “latent” factors (not measured in this study) impacted individual subject-specific trends in QTVINF. In patients with structural heart disease and systolic HF multiple parameters might change over time: coronary perfusion, myocardial contractility and compliance, use of medications, affecting repolarization (Tereshchenko et al., 2009), level of physical activity and autonomic balance, kidney function, and many others. Any of these unmeasured in this study factors might play a major role in the observed subject-specific QTVINF changes.
Recently we showed that both high and low repolarization lability is associated with the risk of SCD in general population (Tereshchenko et al., 2012). In our previous analysis of ICD-EGMs study we observed that QTVINF was decreased after premature ventricular contraction. Paradoxically, decreased, but not increased QTVINF was associated with VT/VF (Das et al., 2012). While arrhythmogenesis, associated with elevated repolarization lability is well understood (Tereshchenko and Berger, 2011), observation of association between decreasing QTVINF and subsequent FVT/VF is novel and prompts further investigations. As previously shown, static QT/RR relationships (Batchvarov et al., 2002), as well as the dynamic pattern of QT/RR hysteresis (Malik et al., 2008) is highly patient-specific. It was even suggested that the individual QT-RR relationship has unique “finger-print-like” properties (Malik et al., 2008). This fact might contribute to the high degree inter-subject variability of the dynamic QTVINF patterns, observed in this study. Especially intriguing was observation of consistent increasing QTVINF trend before each FVT/VF event in some (but not all) patients with multiple FTV/VF events. Further mechanistic studies are needed to explore possible mechanisms of arrhythmiogenesis, associated with decreasing QTVINF, in order to explain subject-specific trends fully.
Effect of Ventricular Pacing on Repolarization Lability
In this study we did not find significant differences in intracardiac QTVINF between VS and VP patients in sinus rhythm. This observation is in concordance with our earlier study (Tereshchenko et al., 2011) of intracardiac QTVINF in CRT patients. Of note, we longitudinally studied only patients with consistently identical type of the presenting rhythm across multiple visits.
Since deleterious effect of RV pacing is well known (Wilkoff et al., 2002), we focused our analysis on evaluation of the possible longitudinal effects of amount of RV pacing on QTVINF and study outcomes. We did not find significant differences in percentage of VP in patients with and without FVT/VF. Furthermore, the percentage of VP did not influence QTVINF and was not responsible for fluctuations of QTVINF from visit-to-visit.
Clinical Perspective
In clinical practice and clinical research multiple physiological parameters are measured repetitively and are studied longitudinally. In the vast majority of longitudinal studies population-averaged analysis is the only analysis applied. Very few longitudinal studies in electrophysiology report results of subject-specific longitudinal analysis. However, the physician manages the specific individual patient, rather than the “population-averaged” patient, and understanding of the patient-specific trends is extremely important for clinical decisions in the era of individualized medicine. In this study, population-averaged and subject-specific longitudinal trend in repolarization lability demonstrated different degree of association with subsequent FVT/VF. Further prospective longitudinal studies of repolarization lability should be conducted in order to understand behavior and predictors of subject-specific longitudinal trends in repolarization lability, and to determine its association with clinically-meaningful outcomes.
Limitations
Several limitations have to be acknowledged. First of all, the EGM recordings were obtained not exactly at the same time of the day during all follow-up visits. However, previous circadian study of QT variability did not find significant differences in QT variability during the day (Dobson et al., 2009). All EGMs were recorded during the morning and middle-day hours (8 am–3 pm), which minimized possible circadian effect.
Time intervals between follow up visits varied due to the observational nature of the study. In order to overcome this limitation, we standardized time intervals for longitudinal analysis. In addition, we employed specific analytical approach, which incorporated actual time from EGM recording to outcome.
Funding Sources
This study was supported by Medtronic, Inc., as an Investigator-initiated Research Project.
Conflict of Interest Statement
This study was supported by Medtronic, Inc., as an Investigator-initiated Research Project. Ronald Berger holds a patent on the technology for QT variability analysis. The other authors declare that the research was conducted in the absence of any commercial or financial relationships that could be construed as a potential conflict of interest.
Acknowledgments
The authors would like to acknowledge Mitchell Faddis, Jane Chen, Timothy Smith, Marye Gleva, and Bruce Lindsay for providing medical care for study participants. Publication of this article was funded in part by the Open Access Promotion Fund of the Johns Hopkins University Libraries.
References
Batchvarov, V. N., Ghuran, A., Smetana, P., Hnatkova, K., Harries, M., Dilaveris, P., et al. (2002). QT-RR relationship in healthy subjects exhibits substantial intersubject variability and high intrasubject stability. Am. J. Physiol. Heart Circ. Physiol. 282, H2356–H2363.
Baumert, M., Schlaich, M. P., Nalivaiko, E., Lambert, E., Sari, C. I., Kaye, D. M., et al. (2011). Relation between QT interval variability and cardiac sympathetic activity in hypertension. Am. J. Physiol. Heart Circ. Physiol. 300, H1412–H1417. doi: 10.1152/ajpheart.01184.2010
Berger, R. D., Kasper, E. K., Baughman, K. L., Marban, E., Calkins, H., and Tomaselli, G. F. (1997). Beat-to-beat QT interval variability: novel evidence for repolarization lability in ischemic and nonischemic dilated cardiomyopathy. Circulation 96, 1557–1565. doi: 10.1161/01.CIR.96.5.1557
Costantini, O., Hohnloser, S. H., Kirk, M. M., Lerman, B. B., Baker, J. H., Sethuraman, B., et al. (2009). The ABCD (Alternans Before Cardioverter Defibrillator) trial: strategies using T-wave alternans to improve efficiency of sudden cardiac death prevention. J. Am. Coll. Cardiol. 53, 471–479. doi: 10.1016/j.jacc.2008.08.077
Couderc, J. P., Zareba, W., McNitt, S., Maison-Blanche, P., and Moss, A. J. (2007). Repolarization variability in the risk stratification of MADIT II patients. Europace 9, 717–723. doi: 10.1093/europace/eum131
Das, D., Han, L., Berger, R. D., and Tereshchenko, L. G. (2012). QT variability paradox after premature ventricular contraction in patients with structural heart disease and ventricular arrhythmias. J. Electrocardiol. 45, 652–657. doi: 10.1016/j.jelectrocard.2012.07.016
Dobson, C. P., La Rovere, M. T., Olsen, C., Berardinangeli, M., Veniani, M., Midi, P., et al. (2009). 24-hour QT variability in heart failure. J. Electrocardiol. 42, 500–504. doi: 10.1016/j.jelectrocard.2009.06.021
Haigney, M. C., Zareba, W., Gentlesk, P. J., Goldstein, R. E., Illovsky, M., McNitt, S., et al. (2004). QT interval variability and spontaneous ventricular tachycardia or fibrillation in the Multicenter Automatic Defibrillator Implantation Trial (MADIT) II patients. J. Am. Coll. Cardiol. 44, 1481–1487. doi: 10.1016/j.jacc.2004.06.063
Hinterseer, M., Thomsen, M. B., Beckmann, B. M., Pfeufer, A., Schimpf, R., Wichmann, H. E., et al. (2008). Beat-to-beat variability of QT intervals is increased in patients with drug-induced long-QT syndrome: a case control pilot study. Eur. Heart J. 29, 185–190. doi: 10.1093/eurheartj/ehm586
Malik, M., Hnatkova, K., Novotny, T., and Schmidt, G. (2008). Subject-specific profiles of QT/RR hysteresis. Am. J. Physiol. Heart Circ. Physiol. 295, H2356–H2363. doi: 10.1152/ajpheart.00625.2008
Piccirillo, G., Magri, D., Matera, S., Magnanti, M., Torrini, A., Pasquazzi, E., et al. (2007). QT variability strongly predicts sudden cardiac death in asymptomatic subjects with mild or moderate left ventricular systolic dysfunction: a prospective study. Eur. Heart J. 28, 1344–1350. doi: 10.1093/eurheartj/ehl367
Pueyo, E., Corrias, A., Virag, L., Jost, N., Szel, T., Varro, A., et al. (2011). Multiscale investigation of repolarization variability and its role in cardiac arrhythmogenesis. Biophys. J. 101, 2892–2902. doi: 10.1016/j.bpj.2011.09.060
Sachdev, M., Fetics, B. J., Lai, S., Dalal, D., Insel, J., and Berger, R. D. (2010). Failure in short-term prediction of ventricular tachycardia and ventricular fibrillation from continuous electrocardiogram in intensive care unit patients. J. Electrocardiol. 43, 400–407. doi: 10.1016/j.jelectrocard.2010.02.005
Shusterman, V., Goldberg, A., and London, B. (2006). Upsurge in T-wave alternans and nonalternating repolarization instability precedes spontaneous initiation of ventricular tachyarrhythmias in humans. Circulation 113, 2880–2887. doi: 10.1161/CIRCULATIONAHA.105.607895
Swerdlow, C., Chow, T., Das, M., Gillis, A. M., Zhou, X., Abeyratne, A., et al. (2011). Intracardiac electrogram T-wave alternans/variability increases before spontaneous ventricular tachyarrhythmias in implantable cardioverter-defibrillator patients: a prospective, multi-center study. Circulation 123, 1052–1060. doi: 10.1161/CIRCULATIONAHA.110.986364
Tereshchenko, L. G., and Berger, R. D. (2011). Towards a better understanding of QT interval variability. Ther. Adv. Drug Saf. 2, 245–251. doi: 10.1177/2042098611421209
Tereshchenko, L. G., and Berger, R. D. (2012). A patient presents with longstanding, severe LV dysfunction. Is there a role for additional risk stratification before ICD? Cardiac. Electrophysiol. Clin. 4, 151–160. doi: 10.1016/j.ccep.2012.02.011
Tereshchenko, L. G., Cygankiewicz, I., McNitt, S., Vazquez, R., Bayes-Genis, A., Han, L., et al. (2012). Predictive value of beat-to-beat QT variability index across the continuum of left ventricular dysfunction: competing risks of noncardiac or cardiovascular death and sudden or nonsudden cardiac death. Circ. Arrhythm. Electrophysiol. 5, 719–727. doi: 10.1161/CIRCEP.112.970541
Tereshchenko, L. G., Fetics, B. J., and Berger, R. D. (2009). Intracardiac QT variability in patients with structural heart disease on class III antiarrhythmic drugs. J. Electrocardiol. 42, 505–510. doi: 10.1016/j.jelectrocard.2009.07.011
Tereshchenko, L. G., Fetics, B. J., Domitrovich, P. P., Lindsay, B. D., and Berger, R. D. (2009). Prediction of ventricular tachyarrhythmias by intracardiac repolarization variability analysis. Circ. Arrhythm. Electrophysiol. 2, 276–284. doi: 10.1161/CIRCEP.108.829440
Tereshchenko, L. G., Henrikson, C. A., and Berger, R. D. (2011). Strong coherence between heart rate variability and intracardiac repolarization lability during biventricular pacing is associated with reverse electrical remodeling of the native conduction and improved outcome. J. Electrocardiol. 44, 713–717. doi: 10.1016/j.jelectrocard.2011.07.028
Tereshchenko, L. G., Soliman, E. Z., Sotoodehnia, N., Han, L., Zhang, Y., Berger, R. D., et al. (2012). Abstract 12311: increased repolarization lability predicts sudden cardiac death in asymptomatic adults. Circulation 126:A12311.
Wilkoff, B. L., Cook, J. R., Epstein, A. E., Greene, H. L., Hallstrom, A. P., Hsia, H., et al. (2002). Dual-chamber pacing or ventricular backup pacing in patients with an implantable defibrillator: the Dual Chamber and VVI Implantable Defibrillator (DAVID) trial. JAMA 288, 3115–3123. doi: 10.1001/jama.288.24.3115
Keywords: intracardiac electrograms, repolarization lability, ventricular tachyarrhythmia, longitudinal analysis, QT variability index
Citation: Guduru A, Lansdown J, Chernichenko D, Berger RD and Tereshchenko LG (2013) Longitudinal changes in intracardiac repolarization lability in patients with implantable cardioverter-defibrillator. Front. Physiol. 4:208. doi: 10.3389/fphys.2013.00208
Received: 10 June 2013; Accepted: 22 July 2013;
Published online: 12 August 2013.
Edited by:
Luciana A. Campos, University Camilo Castelo Branco, BrazilReviewed by:
Rohit Ramchandra, Florey Neuroscience Institute, AustraliaAlexander Ovechkin, University of Louisville, USA
Copyright © 2013 Guduru, Lansdown, Chernichenko, Berger and Tereshchenko. This is an open-access article distributed under the terms of the Creative Commons Attribution License (CC BY). The use, distribution or reproduction in other forums is permitted, provided the original author(s) or licensor are credited and that the original publication in this journal is cited, in accordance with accepted academic practice. No use, distribution or reproduction is permitted which does not comply with these terms.
*Correspondence: Larisa G. Tereshchenko, Division of Cardiology, Department of Medicine, Johns Hopkins Hospital, Carnegie 568, 600 N. Wolfe St., Baltimore, MD 21287, USA e-mail: lteresh1@jhmi.edu