 Volker Endeward1
 Samer Al-Samir
 Fabian Itel
 Gerolf Gros
- 1Zentrum Physiologie, Vegetative Physiologie 4220, Medizinische Hochschule Hannover, Hannover, Germany
- 2Departement Chemie, Universität Basel, Basel, Switzerland
We review briefly how the thinking about the permeation of gases, especially CO2, across cell and artificial lipid membranes has evolved during the last 100 years. We then describe how the recent finding of a drastic effect of cholesterol on CO2 permeability of both biological and artificial membranes fundamentally alters the long-standing idea that CO2—as well as other gases—permeates all membranes with great ease. This requires revision of the widely accepted paradigm that membranes never offer a serious diffusion resistance to CO2 or other gases. Earlier observations of “CO2-impermeable membranes” can now be explained by the high cholesterol content of some membranes. Thus, cholesterol is a membrane component that nature can use to adapt membrane CO2 permeability to the functional needs of the cell. Since cholesterol serves many other cellular functions, it cannot be reduced indefinitely. We show, however, that cells that possess a high metabolic rate and/or a high rate of O2 and CO2 exchange, do require very high CO2 permeabilities that may not be achievable merely by reduction of membrane cholesterol. The article then discusses the alternative possibility of raising the CO2 permeability of a membrane by incorporating protein CO2 channels. The highly controversial issue of gas and CO2 channels is systematically and critically reviewed. It is concluded that a majority of the results considered to be reliable, is in favor of the concept of existence and functional relevance of protein gas channels. The effect of intracellular carbonic anhydrase, which has recently been proposed as an alternative mechanism to a membrane CO2 channel, is analysed quantitatively and the idea considered untenable. After a brief review of the knowledge on permeation of O2 and NO through membranes, we present a summary of the 18O method used to measure the CO2 permeability of membranes and discuss quantitatively critical questions that may be addressed to this method.
The Classical Concept: Lipid Bilayers and Cell Membranes are Extremely Permeable to Gases
It has been a long-standing assumption in biology that all cell membranes let gases pass extremely easily by virtue of the high gas solubility of lipophilic gases in the membranes' lipid phase. This view was formulated as a general principle of the permeation of substances across cell membranes as early as between 1895 and 1901 by Ernest Overton (1895, 1896, 1899, 1901; see also review by Kleinzeller, 1997). Twenty years later, this same principle was shown to specifically hold for the gases CO2 and NH3 by Jacobs (1920a,b,1922). The idea seemed to be supported by measurements of the gas permeabilities of artificial phospholipid membranes, which for O2, CO2, and N2 as well as other gases, turned out to be extremely high, i.e., considerably higher than the permeabilities of small uncharged polar molecules such as water, urea, and glycerol, not to speak of larger, uncharged polar molecules such as sugars or even of ions. This view has entered most textbooks as a well-established fact valid also for cell membranes (Alberts et al., 2002). In the case of CO2, which is highly lipophilic, but almost equally hydrophilic at the same time, the experimentally determined CO2 permeability values (PCO2) of lipid bilayers are around 1 cm/s (Gutknecht et al., 1977; Missner et al., 2008). How high this value is, may be appreciated by comparing it with the Cl−—HCO−3 permeability of the red cell membrane, which with a value of 1·10−4–1·10−3 cm/s is 3–4 orders of magnitude lower, although it is exceptionally high in comparison to other ion permeabilities.
The concept of Overton has later been extended to the “solubility-diffusion mechanism” by Finkelstein (1976). With this modification, Finkelstein took into account that membrane permeability may not only depend on the solubility in the membrane of the substance considered, but also on the diffusion resistance the substance encounters within the membrane.
The transport rate of a substance across a membrane, dm/dt, can be expressed by Fick's first diffusion law:
with Dapp representing the apparent membrane diffusion coefficient, A the diffusion area of the membrane, d the thickness of the membrane, P the membrane permeability, and Δcw the difference of concentrations in the water phase immediately adjacent to two sides of the membrane. If the true diffusivity of the substance within the membrane, DM, is to be considered, the concentration difference present within the membrane has to be expressed using the lipid/water partition coefficient KP:
and, from Equations (2) and (3):
Thus, according to Finkelstein's concept, the membrane permeability will vary with the lipid-water partition coefficient, but will in addition depend on intramembrane diffusivity.
While the intramembrane diffusion coefficients of gases have not been determined directly, the lipid-water partition coefficients are fairly well known. This is shown for several gases of biological interest in Table 1. Firstly, it is apparent that the gases O2, NO, N2, and CO behave quite similar in terms of water and lipid solubilities as well as partition coefficients. CO2, on the other hand, differs greatly from all these gases with respect to solubility in water and in lipid. CO2 exhibits a 20–50 times higher solubility in water than the other four gases, and in oil an about 10–20 times higher solubility. This results in partition coefficients that are only moderately smaller for CO2 than for the other gases: at most by a factor of 3–4 for the oil/water as well as for the phospholipid/water system. It is interesting to note that the gas partition coefficients in Table 1 in general appear quite similar for the oil/water and the phospholipid/water system. The last line of the table gives the measured PCO2 in phospholipid membranes as mentioned above, together with the permeabilities predicted from PCO2 by assuming that they vary proportionally to the respective partition coefficients. This implies the assumption that the intramembrane gas diffusion coefficients are identical for all five gases, which of course may not hold true.
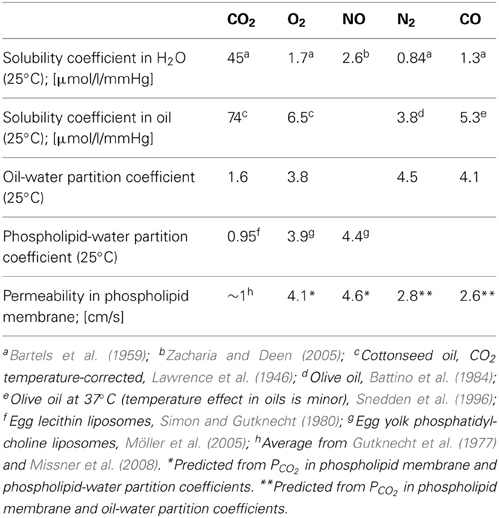
Table 1. Solubility behavior of gases in water and lipids.
Under the condition of a constant DM, the last line of Table 1 suggests that all gas permeabilities should be rather similar, and all of them should be extremely high. It should be borne in mind, nevertheless, that CO2 is unique in Table 1 by possessing absolute solubilities in both water and lipid that are more than an order of magnitude greater than those of the other gases listed.
A note of caution should be added concerning the above value of PCO2 in lipid bilayers. In both determinations cited above, that of Gutknecht et al. (1977), who obtained PCO2 = 0.35 cm/s, as well as that of Missner et al. (2008), who report PCO2 = 3.2 cm/s, it was attempted to eliminate the problem of unstirred layers by special precautions. As points of possible critique it should be mentioned that Gutknecht et al. (1977) showed that apparent bilayer CO2 permeability increased with rising concentrations [HCO−3] + [CO=3] in the bathing solution (the latter causing increasing facilitation of CO2 diffusion in the unstirred layer), and finally reached a plateau value. However, this plateau does not necessarily prove that the diffusion resistance of the unstirred layer has completely vanished as was implied by the authors. Alternatively, the plateau might just indicate that facilitation of CO2 diffusion has reached a maximum, which could not be further augmented due to the increasing concentration of the two ions with their inhibitory effects on ionic mobility as well as on carbonic anhydrase activity. Thus, some doubt may remain how free of unstirred layer effects these measurements are. The technique employed by Missner et al. (2008) takes care of the unstirred layer problem by measuring pH gradients (and, derived from them, pCO2 gradients) within the unstirred layer in front of the bilayer. However, the extensive theory describing the process observed by these authors required fitting five parameters, one of them PCO2, to a single exponential curve of the type shown below (Figure 6A). Moreover, the fitting procedure did not seem to exhibit a clearly defined minimum of the sum of squared deviations, which prompted the authors to introduce a “penalty term” that prevented higher values of PCO2 to emerge from the fitting procedure. Thus, both measurements leave some uncertainty about the correct value of PCO2 in lipid bilayers. A further problem that is common to both approaches, results from the fact that in both studies planar lipid bilayers were employed, which were made from solutions of the lipids in n-decane. Bunce and Hider (1974) have shown that this may result in membranes whose final composition contains 30% decane. This is expected to lead to elevated PCO2 values (a) because decane possesses a two times higher CO2 solubility (and partition coefficient) than phospholipid (Simon and Gutknecht, 1980), and (b) because decane may significantly increase membrane fluidity and thus DM for CO2 (Gutknecht et al., 1977). On the other hand, Gutknecht et al. (1977) used a 1:1 ratio of phospholipid:cholesterol, which is expected to reduce PCO2 (see the following chapter). Missner et al. (2008), in contrast, used planar lipid bilayers with and without cholesterol, and observing no differences, they combined all results to calculate only an overall mean and SD. Nevertheless, in view of the results from other approaches to measure PCO2 in phospholipid membranes, as discussed below, a value of ~1 cm/s as a crude estimate of PCO2 in lipid bilayers appears reasonable.
In contrast to the high CO2 permeabilities obtained by Gutknecht et al. (1977) and Missner et al. (2008), two other groups have obtained extremely low PCO2 values from rapid reaction stopped-flow experiments with liposomes. Yang et al. (2000) measured by this technique the CO2 permeability of lipid vesicles without and with ~40% cholesterol, obtaining in both cases PCO2 ≈ 0.001 cm/s. Prasad et al. (1998) with the same technique also obtained a PCO2 of around 0.001 cm/s, no matter whether cholesterol was present or not. Yang et al. (2000) argued that the CO2 uptake process of vesicles in the stopped-flow apparatus is probably limited by unstirred layers. We may add that in some commercial stopped-flow apparatuses the mixing is less than perfect, which would further increase the apparent unstirred layer. However, when cells or vesicles rather than just solutions are studied in a stopped-flow experiment, an additional complication arises: when the flow has stopped and cells or vesicles begin to take up some substance, then there is only diffusion, and no convection, that can deliver the substance from the extracellular solution to the membrane. In other words, considerable gradients of this substance can develop in the extracellular/-vesicular space, and the standard assumption of a homogeneous concentration of this substance in the outside solution will not hold. This is not critical, when the uptake process by cells or vesicles is slow, but in a case such as the extremely rapid uptake of CO2 into vesicles with a large CO2 binding capacity this can become a serious problem.
Indeed, it can be shown that the process of CO2 uptake by a vesicle 150 nm in diameter with the buffer capacity of 25 mM HEPES takes <0.1 ms to reach 95% completion, when the chemical reaction inside the vesicles is infinitely fast and when there is no membrane diffusion resistance.
This estimate is based on an approximation by Crank (1957) in combination with the use of the “effective solubility” within the vesicles, a concept applied to red cells by Thews (1960). Accordingly, effective solubility α′ is the amount of CO2 plus HCO−3 taken up by the intravesicular volume per increase in CO2 partial pressure. D in Crank's treatment is then replaced by D′ = D· α/α′, where α is the classical solubility of molecular CO2. Crank's expression for 95% completion of the CO2 uptake by a sphere then becomes:
where t is the time required to reach 95% completion, and r is the radius of the sphere. For 25°C, with D = 1.8·10−5 cm2/s, α = 9.8·0−4 cm3/cm3/mmHg, α′ = 53·10−4 cm3/cm3/mmHg (this number being calculated for a pCO2 jump from 1 to 40 mmHg), t from the above equation turns out to be 1·10−5 s = 0.01 ms.
Thus, without a drastic diffusion resistance of the vesicle membrane to CO2, a stopped-flow apparatus with a dead time of a few milliseconds, and perhaps further problems limiting the speed of the process, cannot be expected to capture the kinetics of CO2 uptake, provided that substantial intravesicular carbonic anhydrase activity is present and the CO2 hydration kinetics assumes a half-time of <1 ms, as was the case in both studies. We conclude therefore that the low PCO2 values reported by Prasad et al. (1998) and Yang et al. (2000) are likely to be essentially determined by technical problems of the stopped-flow experiment.
The third approach that has been applied to determine PCO2 of artificial liposomes is the mass spectrometric 18O exchange technique, which measures very fast processes on an extremely slow time scale (Itel et al., 2012, and see last section of this article). Unstirred layers have been shown to play a minor role (Endeward and Gros, 2009). In the absence of cholesterol, this method gives, as described below, a PCO2 > 0.16 cm/s, where this number reflects the upper limit of detectability of the technique for vesicles. Summarizing the discussion of this paragraph, it appears to be the best guess at present that the true PCO2 of cholesterol-free lipid bilayers is certainly >0.16 and probably around 1 cm/s. Figure 1 gives a summary of the PCO2 values obtained for artificial lipid bilayers, by the stopped-flow technique using vesicles, by observing steady state CO2 transfer across planar lipid bilayers (Gutknecht et al., 1977; Missner et al., 2008), or by 18O mass spectrometry applied to vesicles (Itel et al., 2012). The drastic difference between results from stopped-flow experiments and those from the other techniques is obvious.
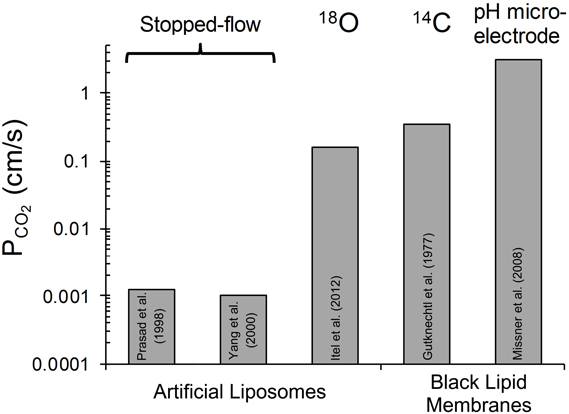
Figure 1. Overview of CO2 permeabilities determined for artificial liposomes or planar lipid bilayers using various techniques. References see text. 18O refers to the 18O exchange technique explained in the last section of this article. 14C-labeled CO2 was used by Gutknecht et al. (1977) to measure steady state transfer of CO2. Missner et al. (2008) have used a pH microelectrode to measure the gradient of pH, dpH/dx, in the unstirred layer in front of the membrane to be studied. From this gradient the flux of CO2 across the diffusion layer was derived as explained in more detail in section V of this article.
Recent work has called into question the classical simple view that cellular gas permeability is extremely high and reflects essentially the lipid/water partition behavior of the gas, a view that has recently, for example, been re-stated by Missner and Pohl (2009). In the case of CO2 several alternative mechanisms are currently being discussed. In the following sections, we will critically discuss the concepts presently proposed.
Effect of Cholesterol on CO2 Permeability of Membranes
Missner et al. (2008) as well as Prasad et al. (1998) and Yang et al. (2000) have observed no effect of cholesterol on PCO2 of artificial lipid membranes. Possible limitations of Missner's experimental approach, e.g., the presence of decane in their planar bilayers and problems with their fitting procedure, have been discussed above. Likewise, it appears probable that an indequate time resolution of the stopped-flow experiments employed by Prasad et al. (1998) and by Yang et al. (2000) slowed down the observed kinetics so drastically that any moderate changes in true membrane permeability could not become apparent. In view of this it is interesting that Itel et al. (2012) have recently reported that cholesterol has a most drastic effect on the CO2 permeability of phospholipid vesicles. This is illustrated in Figure 2, which is reproduced from their paper. It can be seen that between 0 and 30 mol% cholesterol content of the vesicles PCO2 falls from >0.16 cm/s to ~0.02 cm/s, i.e., by at least one order of magnitude. If PCO2 at 0% cholesterol were 1 cm/s as given in Table 1, this fall would even occur over two orders of magnitude. Between 30 and 70 mol% cholesterol then, PCO2 decreases by another order of magnitude to ~0.0024 cm/s. It was concluded that cholesterol between 0 and 70% can reduce vesicle PCO2 by 2–3 orders of magnitude. This drastic effect of cholesterol does not seem to be due to a decrease in CO2 solubility in the lipid phase, as Simon and Gutknecht (1980) report only a 25% reduction of CO2 solubility when 50% cholesterol is added to egg lecithin in liposomes. Thus, cholesterol is likely to cause a significant reduction of intramembrane CO2 diffusivity DM [see Equation (4)].
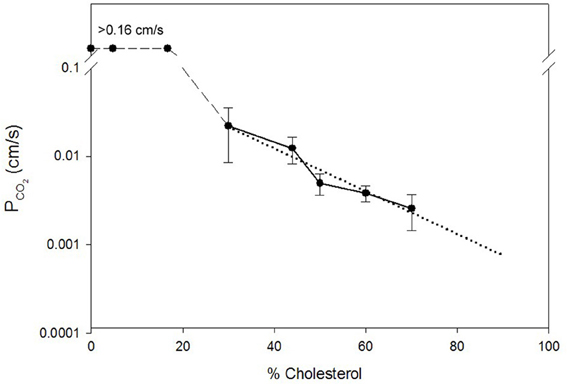
Figure 2. Dependence of the CO2 permeability of phospholipid vesicles on their cholesterol content. The latter is given on the x-axis in mol% per total membrane lipid. Vesicle phospholipid composition was phospatidylcholine:phosphatidylserine = 8:2. PCO2 was determined by the mass spectrometric 18O exchange technique. Dotted line is the linear regression line for all data points between 30 and 70% cholesterol. PCO2 values between 0 and 17% cholesterol were above the upper limit of detectability of the method of 0.16 cm/s. Figure reproduced from Itel et al. (2012), with permission.
It is very important to note that the results of Figure 2 are in excellent agreement with the molecular dynamics simulations of Hub et al. (2010), who also predict that cholesterol can reduce the CO2 permeability of lipid bilayers by several orders of magnitude. Itel et al. (2012) have confirmed the quantitative findings of Figure 2 by a qualitative approach applied to intact cells. Decreasing the cholesterol content of MDCK cells by cholesterol depletion with β-cyclodextrin caused a dramatic ≥40-fold increase in CO2 permeability. Inversely, enrichment of these membranes by cholesterol-preloaded β-cyclodextrin reduced PCO2 to 1/3 of normal MDCK cells.
Does the finding shown in Figure 2 for artificial vesicles also apply to cell membranes? Itel et al. (2012) have shown that the CO2 permeability of cell membranes that are devoid of protein gas channels, as will be discussed below in chapter VI of this article, can be fairly precisely predicted from their cholesterol content, when the dotted regression line of Figure 2 is used. Thus, it was concluded that also in cell membranes, in the absence of gas channels, cholesterol is the decisive determinant of CO2 permeability and therefore is much more important than the exact phospholipid composition and membrane protein content. Since the membranes of many cells possess a cholesterol content of around 40%, a PCO2 of close to 0.01 cm/s is predicted from the regression line of Figure 2. Indeed, Itel et al. (2012) report for all of four cell types, namely two gas channel-free cell lines (MDCK and tsA201 cells), the red cell membrane without functional gas channels, and the presumably gas channel-free basolateral membrane of proximal colon epithelial cells, PCO2 values of around 0.01 cm/s. In conclusion, the permeability of many cell membranes is two orders of magnitude lower than the PCO2 value of cholesterol-free artificial lipid membranes, which has long been believed to be representative for cell membranes too.
“CO2-Impermeable” Membranes
A very early report of a cell membrane poorly permeable to a gas describes the observation of Kikeri et al. (1989) that the apical membranes in the medullary thick ascending limb of Henle in mouse kidney are “impermeable” to NH3. A few years later several instances of membranes impermeable to CO2 were reported, always apical membranes of epithelial cells. Waisbren et al. (1994) observed an apparent impermeability for CO2 of the apical epithelial chief and parietal cell membranes in isolated perfused gastric glands. Hasselblatt et al. (2000) reported the same property for the apical epithelial membranes of in vitro perfused rat colonic crypts. Endeward and Gros (2005) then made an analogous observation on the surface cells of guinea pig colon epithelium, and for the first time they were able to quantitate this “impermeability”; they determined by 18O exchange mass spectrometry the CO2 permeability of the apical proximal as well as distal colonic epithelial membrane to be ~0.001 cm/s. This was 10 times lower than the CO2 permeability of several gas channel-free cell membranes as discussed above. The mechanism of the very low CO2 (and NH3) permeability of several apical epithelial membranes was entirely unclear, and only recently the results of Itel et al. (2012) have elucidated the cause of this property. Quite fortunately, Meyer zu Düttingdorf et al. (1999) have been successful in obtaining a good separation of apical and basolateral membranes of guinea pig colon epithelium and they performed an analysis of their lipid composition. They found a cholesterol content of 42% in the basolateral membrane of the proximal colon, which is what many cells have, but as much as 77% cholesterol in the apical membrane. Using the regression line of Figure 2 one predicts for this cholesterol content a CO2 permeability close to 0.001 cm/s. This means that the very low permeability of this membrane can be satisfactorily explained simply by its cholesterol content. We conclude that cells can regulate their CO2 permeability over a wide range (and likely their NH3 permeability as well) by altering the cholesterol content of their membrane.
The physiological advantage of making cell membranes impermeable to gas is obvious in the case of NH3, where the potentially very high partial pressures in the lumen of the stomach as well as the colon would be toxic to the epithelial cells if the NH3 had access to their interior. Likewise, the potentially very high CO2 partial pressures (up to 0.5 atm) in both lumina would constitute a severe acid load for the cells, if the CO2 were able to enter them (Endeward and Gros, 2005).
Which CO2 Permeability is Necessary for Respiring Cells?
Itel et al. (2012) have reported PCO2 values of 0.01 cm/s for two cell lines. Cells in culture usually exhibit a low oxidative metabolism, as they are not in an active state and often cover part of their energy requirement by anaerobic metabolism. Would a permeability of 0.01 cm/s suffice, for example, for highly active cells such as cardiomyocytes in vivo under conditions of heavy exercise? We present in the following calculations an answer to this question, employing a simplified model of CO2 release from a cardiomyocyte. The cardiomyocyte is considered as a cuboid, which in conjunction with further simplification allows us to model CO2 release on the basis of diffusion across a plane sheet. As the radius of human cardiomyocytes is 7 μm, we approximate the geometry of the cell by a plane sheet of 14 μm thickness, and perform the calculation for the half-thickness of the cuboid of 7 μm (Armstrong et al., 1998; Endeward et al., 2010; Endeward, 2012). In Figure 3, the upper border of the cytoplasmic space then represents the center of the cell, where for simplicity the source of CO2, i.e., the mitochondria, is assumed to be located. From there the CO2 diffuses through the cytoplasm over 7 μm, and then diffuses through the cell membrane before it is taken up by the blood in the capillary. We consider steady state conditions, so the CO2 partial pressures in the center of the cell and in the capillary are constant.
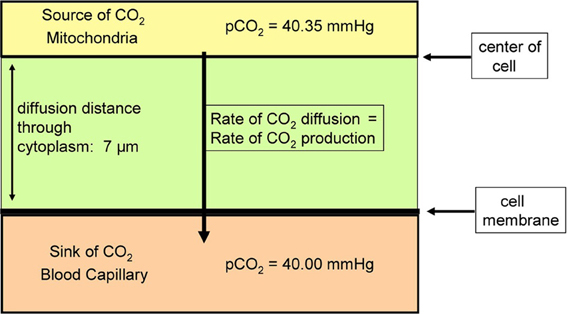
Figure 3. Scheme of the model used to estimate the effect of membrane CO2 permeability on the release of CO2 from a cardiomyocyte. CO2 diffuses from the CO2 source located in the center of the cell first through the cytoplasm, and then through the plasma membrane, into the blood capillary.
What is a realistic pCO2 gradient within the cell? It is generally accepted that pCO2 gradients in tissues—in contrast to pO2 gradients—are extremely small, but no information on their precise value is available. Therefore, we use here the following approach. For the condition of heavy exercise, the heart can assume an O2 consumption, and about identical CO2 production, of 0.4 ml gas/g tissue/min (Endeward et al., 2010). With the known cytoplasmic CO2 diffusion coefficient, 1.3 · 10−5 cm2/s, and the diffusion path given in Figure 3, we calculate the partial pressure difference, ΔpCO2, necessary to produce a flow of CO2 of 0.4 ml CO2/g tissue/min from CO2 source to CO2 sink. In this calculation, the cell membrane is assumed to offer no diffusion resistance to CO2 at all. This yields a necessary ΔpCO2 of 0.35 mmHg as indicated in Figure 3. This is a reasonable number in view of the expected small CO2 gradients in tissues. We then add the diffusion resistance of the membrane to that of the 7 μm thick cytoplasmic layer, where the latter amounts to 54 s/cm. Using Fick's first law of diffusion, the rate of CO2 production, , and of diffusion from the CO2 source to the capillary, is then given by:
where the terms in the first brackets represent the sum of the resistances of diffusion through the cytoplasm and across the membrane. d is the cytoplasmic diffusion path, DCO2 the cytoplasmic CO2 diffusion coefficient, PCO2 membrane CO2 permeability, A the unit diffusion area (1 cm2), αCO2 the solubility of CO2 in tissue (7.2·10−4 mm Hg−1), and the product d·A is the volume of cells in which is produced. This equation leads to the curve shown in Figure 4. At PCO2 = ∞ the value of is, as explained above, the maximal rate of cardiac CO2 elimination of 0.4 ml/min/g. At constant ΔpCO2, the CO2 production rate decreases with decreasing PCO2. While a PCO2 of 1 cm/s has only a small limiting effect on the rate of CO2 release, the PCO2 found in cells in culture, 0.01 cm/s, would reduce CO2 production/release to 1/3 of the value in the absence of a membrane resistance. PCO2 = 0.001 cm/s would even reduce it to 1/20. Figure 4 shows that PCO2 values ≤0.1 cm/s become increasingly critical for cellular CO2 release, an effect that can only be overcome by raising intracellular pCO2, and thus ΔpCO2 [see Equation (5)]. It can also be deduced from Equation (5) that a lower rate of CO2 production, for example that of 0.003 ml/g/min as it occurs in resting skeletal muscle, which is only 1% of the value in maximally working heart, can at identical or lower ΔpCO2 easily be achieved without any limitation with a PCO2 of 0.01 cm/s, even with PCO2 = 0.001 cm/s a ΔpCO2 of 1/5 of 0.35 mmHg would suffice. Thus, it is clear that, while PCO2 = 0.01 cm/s is more than adequate for cells with low oxidative metabolism, a >10 times higher PCO2 would seem important for cells with an extremely high oxygen consumption. It remains to be tested, whether such cells indeed exhibit CO2 permeabilities of that size.
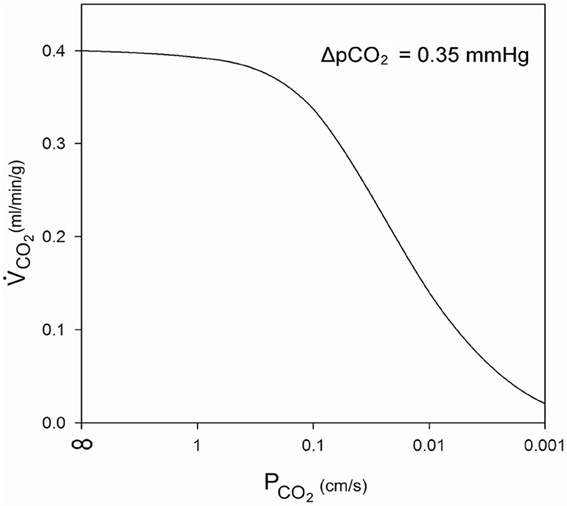
Figure 4. Influence of membrane CO2 permeability on CO2 release from a maximally metabolizing cardiomyocyte at a given partial pressure gradient of 0.35 mmHg over the half-thickness of the cell.
A different approach to the same question has been reported by Endeward et al. (2008), who evaluated the effect of membrane CO2 permeability on the kinetics of gas exchange of red cells. Human red cells normally possess a CO2 permeability of 0.15 cm/s. With this value, the time required for 95% completion of the release of CO2 as it occurs in the lung was calculated to be 110 ms, which may be compared to the capillary transit time in the lung of 700 ms. If red cells without functional gas channels, which have a PCO2 of 0.01 cm/s (Endeward et al., 2008), are considered, the required time rises to 1000 ms, thus exceeding the available transit time in the lung. The limitation of CO2 release is expected to be more pronounced under conditions of exercise, when the transit time can fall to 350 ms. The problem caused by such a low PCO2 can only be overcome by increasing the pCO2 gradient across the alveolar diffusion barrier, and it is clear that the normal high CO2 permeability of red cells will ensure a maximally economical CO2 release in the lung.
We conclude from these two approaches that optimal CO2 release in cells with very high rates of gas exchange, like cardiomyocytes and red cells, requires high CO2 permeabilities >0.1 cm/s.
Is Intracellular Carbonic Anhydrase Responsible for the High CO2 Permeability of Some Cells?
Recently, Zocher et al. (2012) proposed that the low permeability of the urinary bladder with a PCO2 of ~0.00016 cm/s is not due to the uroplakin of the bladder epithelium but to the absence of carbonic anhydrase in that epithelium, a hypothesis constituting a basically new concept of membrane CO2 transfer. Measurements of CO2 transfer across monolayers of MDCK cells, which are known to possess intracellular carbonic anhydrase, seemed to confirm this hypothesis: (1) when Zocher et al. (2012) added the carbonic anhydrase inhibitor acetazolamide to the solutions to inhibit all carbonic anhydrase (intra- as well as extracellular), the CO2 flux across the epithelium was very low, (2) it increased moderately when no acetazolamide was added, and (3) it increased 14-fold in comparison to experiment (1) when they added a very high activity of carbonic anhydrase (as produced by 2 mg CA/ml) to the solutions of the bathing medium of the epithelium. They concluded from this that “carbonic anhydrase expression may uniquely regulate the tightness of biological membranes to CO2” and that their results “rule out that aquaporins significantly contribute to the maintenance of acid base homoeostasis.” Thus, these authors propose a biological mechanism that would raise the CO2 permeability of a membrane not by reducing membrane cholesterol, as discussed above, nor by insertion protein gas channels into the membrane, as we will discuss below.
In order to understand the mechanism underlying the results of Zocher et al. (2012), we modeled the experimental situation used in their experiments with MDCK monolayers. The principle of their measurements was to expose a layer of epithelium to a pCO2 gradient, and then measure the pH gradient that exists after steady-state has been reached in the unstirred layer between the front side of the epithelium (see Figure 5) and the bulk solution in the downstream compartment. They do this by moving a pH microelectrode from the bulk solution towards the surface of the epithelium and recording pH as a function of the distance from the epithelial surface. Figure 6A shows examples in a figure reproduced from their paper (Zocher et al., 2012). Up to this step their procedure is identical to that used by Missner et al. (2008), which has been discussed above. However, they avoid the extensive theory required by Missner's approach by using an elegant approximation in the evaluation of these experiments. Zocher et al. (2012) use the first linear parts of the curves of Figure 6A to calculate the flux of CO2 across the epithelium, roughly approximated by the HCO−3 flux = (buffer-facilitated) H+ flux through the unstirred layer in front of the epithelium:
where DB is the diffusion coefficient of the buffer present in the extracellular solution, BF is the buffer factor provided by this buffer (in mM/ΔpH), and ΔpH/Δx is the linear initial slope of the curves in Figure 6A.
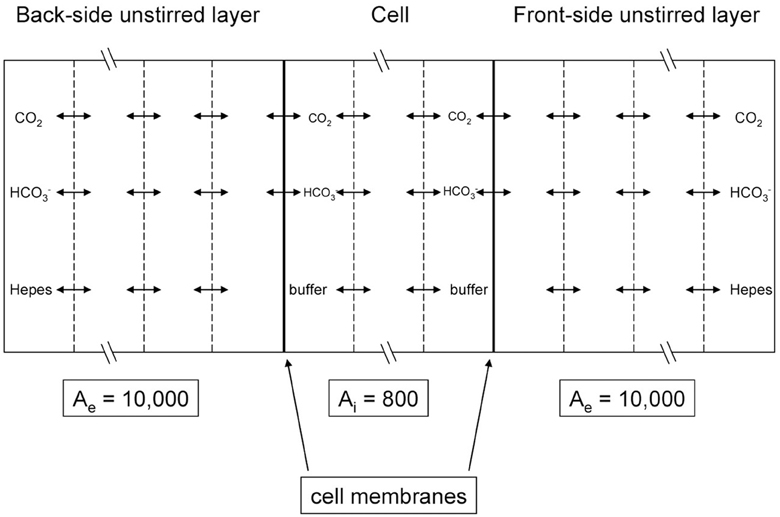
Figure 5. Scheme of the mathematical model used to simulate the CO2 flux measurements of Zocher et al. (2012). MDCK cell monolayers were exposed to an extracellular solution on the apical (back) side as well as on the basal (front) side. The flow is determined by measuring the pH gradient with a pH microelectrode moving across the front-side unstirred layer and by inserting this pH gradient into Equation (6).
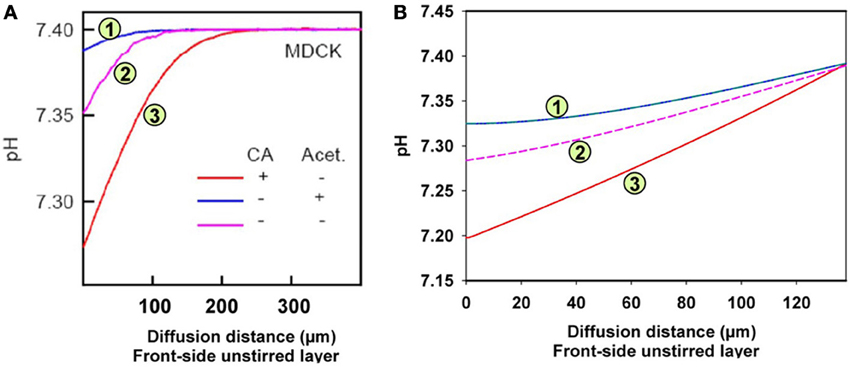
Figure 6. pH gradients in the unstirred layer in front of the epithelial layer of MDCK cells. Acidification relative to the pH in the bulk extracellular solution occurs due to the CO2 influx from the epithelium. (A) Measured pH profiles reproduced with modification from Figure 7A of Zocher et al. (2012), with CC-BY license. Acet. = acetazolamide, (B) calculated pH profiles using the model given in Figure 5.
Figure 5 illustrates the experimental situation employed by Zocher et al. (2012) as well as the principle of the present mathematical model. Our model considers two unstirred layers on either side of the epithelial layer, plus the intracellular compartment. At the left hand side of the back-side unstirred layer and at the right-hand side of the front-side unstirred layer, the conditions of the bulk extracellular solution are fixed: pH = 7.4 in NaCl-HEPES buffer with 25 mM bicarbonate. pCO2 at the back side was then increased abruptly in the model by raising [HCO−3] from 25 to 50 mM in the left-hand side bulk solution, and subsequently pH at the front-side became acidified by the ensuing flux of CO2 across the epithelium. In all three compartments we modeled the transport of CO2, HCO−3, H+, and HEPES (as a H+-carrier) by considering all diffusion and reaction processes involved. The membranes were considered impermeable to HCO−3 and were assigned a CO2 permeability of 0.01 cm/s (Itel et al., 2012). The differential equations were solved by a finite difference method as implemented in MATLAB 2008b. Each of the three compartments of Figure 5 was divided into 50 volume elements for this calculation.
Figure 6A shows the experimental results obtained by Zocher et al. (2012). As described above, these authors used the initial slopes of the curves in Figure 6A to calculate the approximate CO2 fluxes occurring across the monolayer of MDCK cells. From these slopes as read from the curves of Figure 6A, the flux resulting in curve (3; red) is estimated to be 6.3 times greater than the flux leading to curve (1; blue). This was interpreted to mean that in the presence of intra- (as well as extracellular) CA the epithelium possesses a higher CO2 permeability, and when no extracellular CA is added and all the endogenous CA of the MDCK cells is inhibited by acetazolamide, the CO2 permeability is 6.3 times lower. In the absence of the CA inhibitor, the curve (2; purple) assumes an intermediate position due to the endogenous CA activity of the cells. The conclusion was that carbonic anhydrase, intracellular and ostensibly also extracellular, substantially increases CO2 permeability of the cell layer, which was attributed to an increase in cell membrane PCO2 by Zocher et al. (2012).
Figure 6B shows the results of the present model calculations. In contrast to Figure 6A, we consider the unstirred layer only, without the bulk solution, and assume the unstirred layer to extend over 130 μm in front of the MDCK cell layer. At the outer end of this unstirred layer (right hand side in Figure 6B), we hold the conditions of the extracellular bulk solution fixed (pH = 7.4, [HCO−3] = 25 mM). Reassuringly, our model predicts a similar about eight times greater initial slope of curve (3; red) than of curve (1; blue), where in analogy to Figure 6A, curve (3) was calculated for an extracellular CA activity ACA,e of 10,000 and an intracellular activity ACA,i of 800, which is realistic for MDCK cells (Al-Samir et al., 2013). In contrast, curve (1) was calculated for the complete absence of CA in the extra- as well as the intracellular space, which corresponds with the addition of 1 mM acetazolamide in Zocher's experiments. We conclude, that the model of Figure 5 nicely explains curves (1) and (3) of their experiment as it shows a similar difference in pH slopes to that observed by them. What is the mechanism of the intermediate (~4-fold) increase in slope of their curve (2) over that of curve (1)? Curve (2) of Figure 6A was obtained without any additions at all. A four-fold acceleration of the intracellular CO2 flux by facilitated CO2 diffusion due to ACA,i is unlikely in view of the findings that facilitated diffusion inside red cells as well as inside skeletal muscle (Gros and Moll, 1972; Kawashiro and Scheid, 1976) accelerates intracellular CO2 transport by no more than 60–80%. We have speculated therefore, that the slope of curve (2) in Figure 6A may be increased due to the combined action of intracellular and a small amount of membrane-bound extracellular CA, which both occur in MDCK cells (Pfaller et al., 1989). Modeling this with an intracellular CA activity ACA,i of 800 and an assumed membrane-bound surface-associated extracellular activity ACA,s of 100, we obtain curve (2) in Figure 6B, whose slope is indeed intermediate between those of curves (1) and (3). We note that in this model the activity ACA,s = 100 is only applied in the one volume element immediately adjacent to the cell membrane, while CA activity is assumed to be absent from all other volume elements of the unstirred layers. In conclusion, our model satisfactorily explains all experimental results of Zocher et al. (2012) as shown in Figure 6A for MDCK cells.
Nevertheless, the present model does not confirm the conclusion of Zocher et al. (2012) that the flux of CO2 across the cell layer depends strongly on CA activity. This is due to the basal assumption of their method, which is that the CO2 flux leaving the cell layer and entering the right-hand side extracellular unstirred layer compartment (Figure 5), can in all cases be deduced from the surface pH gradient and the proton flux derived from it by Equation (6). Such a calculation is only a reasonable approximation, however, if the extracellular carbonic anhydrase activity is very high and therefore the CO2-HCO−3-H+-system is in near-complete chemical equilibrium. A CAII (the isoform II of CA) concentration of 2 mg/ml in the NaCl-HEPES solution, which was used experimentally, is more than the CAII concentration present in human red cells, and therefore the activity of 10,000 as used in our model is a minimum estimate of the CA activity in that solution (Wistrand, 1981; Endeward et al., 2006a,b; Al-Samir et al., 2013). Thus, the assumption of near-perfect chemical equilibrium is certainly justified for curves (3) in Figures 6A,B. The CO2 fluxes derived from these slopes should be correct (and in Figure 6B indeed come close to the true ones, as derived from the model and given in Table 2, for the case of curve 3). However, in the absence of any CA activity, as in curve (1) of Figure 6A, and also in the presence of only very limited extracellular CA activity as is likely the case in curve (2) of Figure 6A, it is not permissible to derive CO2 fluxes from the pH gradient. When the speed of the CO2 hydration reaction is slow, the CO2 leaving the cell layer will not react fast enough to produce the amount of protons that would be produced in the presence of high CA activity, and the CO2-HCO−3-H+-system will remain far from chemical equilibrium. Thus, deriving CO2 fluxes from the extracellular pH profile using Equation (6) in the manner described, will lead to a substantial underestimation of these fluxes in the cases of curve (2), and even more so of curve (1). This is illustrated in Table 2, which gives the CO2 fluxes calculated from the mathematical model of Figure 5. It is apparent that that these fluxes do not vary by a factor of 8, as the initial pH slopes do, or even 14, which is the average factor of increase in CO2 flux given by Zocher et al. (2012). Instead, while the fluxes do show some minor positive correlation with extracellular CA activity, this effect does not exceed an increase in CO2 flux by more than 25%. This small effect is due to the acceleration of CO2 hydration on the membrane surface, which will remove the CO2 just having crossed the membrane more rapidly from the extracellular surface region of the cell membrane, thus maintaining a somewhat larger gradient of CO2 across the membrane. This of course does not reflect any alteration of the CO2 permeability properties of cellular membranes. We conclude that carbonic anhydrase is not involved in regulating the CO2 permeability of cell membranes per se, and other mechanisms must be responsible for the considerable variations of CO2 permeability found between different membranes (Itel et al., 2012).
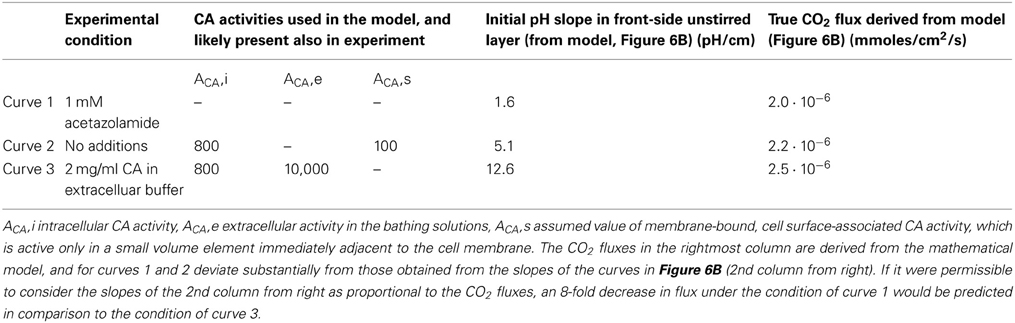
Table 2. Summary of the conditions in the experiments with MDCK monolayers by Zocher et al. (2012) and in the model of Figure 5.
Protein Channels for Molecular CO2 in Membranes of High CO2 Permeability
While “gas-impermeable” membranes have been known for almost 25 years, it is only 15 years ago that the first reports suggesting the existence of protein gas channels have appeared. In the first part of this chapter we will discuss studies that have been in favor of the function of AQP1 and other proteins as channels for CO2:
(1) Nakhoul et al. (1998) reported that expression of aquaporin1 (AQP1) in Xenopus oocytes increases the rate of intracellular acidification seen upon exposure of the oocyte to an increase in extracellular pCO2. They proposed that AQP1 acts as a CO2 channel.
(2) Forster et al. (1998) in the same year reported that the effect of DIDS (4,4′- diisothiocyano-2,2′-stilbenedisulfonic acid) on the C18O16O-exchange kinetics in human red cells as observed by mass spectrometry cannot be explained solely by inhibition of the anion exchanger 1. When applying the mathematical model that describes this process in terms not only of CA activity and HCO−3 permeability, but also of CO2 permeability, as first introduced by Wunder and Gros (1997, 1998) and Wunder et al. (1998), they concluded that DIDS is a powerful inhibitor of red cell membrane CO2 permeability. Since DIDS is an ε-amino group reagent affecting a variety of proteins, they concluded that CO2 permeation in the red cell membrane must be a process mediated by a membrane protein.
(3) Again in the same year, Prasad et al. (1998) reported that reconstitution of AQP1 into liposomes increased their CO2 permeability as determined from stopped-flow experiments. However, as discussed above, the absolute values of the CO2 permeabilities these authors obtained (10−3 cm/s) suggests that technical problems with the stopped-flow technique caused a problem in these measurements. Actually, the same group later on argued very clearly against a role of AQP1 as a channel for CO2 (Missner et al., 2008; Zocher et al., 2012). So these results should actually not be used as an argument in favor of gas channels.
(4) An important argument in favor of aquaporin's role as a CO2 channel came more recently from the work of Uehlein et al. (2003). They showed that the tobacco aquaporin NtAQP1, like AQP1 (Nakhoul et al., 1998), increases CO2 permeation when expressed in Xenopus oocytes. Moreover, NtAQP1 was shown in plants to increase both cellular water and CO2 permeability and promote leaf growth. Thus, the authors showed in plants for the first time a clear physiological function of a protein CO2 channel.
In the years 2006–2008 Endeward et al. (2006a,b, 2008) elucidated the mechanism of CO2 permeation across the human red cell membrane. In these studies, using blood from AQP1- and Rh-deficient persons, they were the first to detect a second CO2 channel in addition to AQP1, namely the Rhesus protein RhAG (Rhesus-associated glycoprotein), which was already known to conduct ammonia (Ripoche et al., 2004). AQP1 and RhAG each contribute one half of the normal CO2 permeability of this membrane, which amounts to PCO2 = 0.15 cm/s, about 10 times greater than the permeability in the functional absence of the two channels. Both channels are efficiently though not quite completely inhibited by DIDS, explaining the strong effect of this inhibitor on red cell PCO2 and thus the earlier finding by Forster et al. (1998). The CO2 conductance through AQP1 was in addition strongly inhibitable by the mercury reagent pCMBS (p-chloromercuribenzene sulfonate) that is known to effectively inhibit the aquaporin water channel (Echevarria et al., 1993). In the Rh protein mediating CO2 transport, Endeward et al. (2008) demonstrated a competition between NH3 and CO2, which was a strong argument for RhAG being the CO2 channel, rather than other members of the Rhesus protein complex in the red cell membrane.
The evidence in favor of CO2 channels listed so far has mostly been obtained on specialized membranes such as those of red cells and oocytes. Therefore, it was of interest to extend this to other membranes. Itel et al. (2012) have recently expanded the range of membranes exhibiting CO2 conductance by aquaporin 1 by (a) incorporating AQP1 into artificial lipid bilayers containing 50% cholesterol and (b) expressing AQP1 in MDCK cells that contain about 40% cholesterol (see discussion below).
The role of AQP1 as a CO2 channel was supported by molecular dynamics simulations by Hub and de Groot (2006) and by Wang et al. (2007), who both predicted that AQP1 lets pass molecular CO2, through the water channel of the AQP1 monomer, and perhaps mainly through the central pore that exists in the AQP1 tetramer between the four monomers. The authors' reservation against a possible physiological significance of the CO2 channel came from their observation that the lipid bilayer surrounding the AQP tetramers was even more permeable to CO2 than AQP. Very recently, Uehlein et al. (2012) have provided an especially convincing piece of experimental evidence for AQP being indeed a channel for CO2. They incorporated the tobacco NtAQP1 into a planar layer of gas-tight triblock-copolymers. While the untreated membrane shows no CO2 permeation whatsoever, incorporation of the NtAQP1 induces a most impressive permeability for CO2. Hub et al. (2010) confirmed by molecular dynamics calculations that the Rhesus protein Rh50, a member of the Amt/MEP/Rh family, indeed can serve as a pathway for CO2 in addition to NH3, thus confirming the experimental results on RhAG by Endeward et al. (2006b, 2008).
Musa-Aziz et al. (2009) and Geyer et al. (2013a) showed, by expression in oocytes, that several members of the aquaporin family 0–9 besides AQP1 are good conductors of CO2. The authors take the amplitudes of the (alkaline) surface pH transients ΔpHS that appear upon exposure of the oocytes to CO2 as a semiquantitative measure of the aquaporin-induced CO2 permeability. Somersalo et al. (2012) presented an extensive theory deriving the PCO2 of the oocyte from the value of the transient ΔpHS peak. Somersalo et al. (2012) point out the limitations of this measure of PCO2 to be due to (a) the the peak value of the pH surface transient not being linearly related to PCO2, (b) the blunt surface pH electrode being pushed up tightly against the vitelline membrane of the oocyte, which creates a limited unstirred space there (of a size not precisely known) and causes the pH transient sensed by the electrode to be likely different from what it is in the remainder of the oocyte surface, and (c) the presence of the vitelline membrane per se being expected to create an additional unstirred space on the oocyte cell membrane, whose influence is hard to assess. Thus, comparisons of these pH transients caused by different aquaporins expressed in oocytes will be possible and provide most valuable insights, but will be semiquantative rather than quantitative. With this approach, the mentioned group finds ΔpHS to be largest for AQP5, and just slightly less for AQP6 and AQP1, such that these three seem to be the best conductors of CO2. Substantial ΔpHS values are also exhibited by AQP0, AQP4-M23 (a variant of AQP4-M1, which forms orthogonal arrays of tetramers in membranes), AQP9, and perhaps AQP8. Little or no CO2 permeability is contributed by AQP2, AQP3, AQP4-M1, and AQP7. Functionally, it is notable that high permeabilities for CO2 seem to be exhibited by the most widespread isoform AQP1, occurring for example in red cells and the kidney, by the AQP4-M23, which is present in high density in the astrocytic endfeet at the blood-brain barrier, by AQP5, which is strongly expressed in alveolar type I pneumocytes and thus may facilitate diffusion of CO2 across the alveolar-capillary barrier, and finally by AQP6, which is present and colocalized with H+-ATPase in the intracellular vesicle membranes in the renal collecting duct epithelia. According to the authors' speculation, AQP6 may serve there to mediate CO2 exit from the vesicle lumen, after the latter has actively taken up H+, followed by its reaction with HCO−3 to form CO2 inside the vesicle. Recently, Geyer et al. (2013b) have shown with their surface pH transient technique that in addition to RhAG the tissue Rh proteins RhBG and RhCG serve as pathways for CO2.
In the following second part of this chapter we will present some work that has come to the conclusion that either CO2 channels do not exist or are functionally insignificant:
Yang et al. (2000) studied the question of the function of AQP1 as a potential CO2 channel in a variety of systems, and reached a negative answer for all of them. They studied liposomes into which AQP1 was reconstituted, examined them by stopped-flow spectrophotometry, obtained the very low PCO2 as already discussed above and observed no effect of aquaporin-1 incorporation. Since the low PCO2 suggests a major unstirred layer or mixing problem, as discussed, it appears possible that an action of AQP1 may have been obscured by the dominating effect of unstirred layers. The same holds for the authors' determination of PCO2 of red cells from normal and AQP1-ko mice, which was also done by stopped-flow. Their values of 0.012 and 0.011 cm/s are more than 10 times lower than the values obtained by 18O mass spectrometry (Endeward et al., 2006a, 2008) and also than earlier rough estimates of red cell PCO2 by Roughton (1959) and Forster (1969), yielding 0.15 and 0.58 cm/s, respectively. Again, it appears quite possible that Yang's low values are due to an unstirred layer or mixing problem in the stopped-flow apparatus, which would render changes in true membrane PCO2 insignificant in comparison to a predominant diffusion resistance in the extracellular solution. A third line of evidence presented by Yang et al. (2000) consists of an experiment with anesthetized artificially ventilated mice. These animals were subjected to a step decrease in inspired pCO2 from 35 to 0 mmHg. The absolute value and kinetics of the ensuing decrease in arterial pCO2 was then followed in normal and AQP1-ko mice, and no differences in either pCO2 amplitude or kinetics were observed. To appreciate the implications of this result, one has to recall the steps that could be crucial for the process of CO2 equilibration between blood and red cells. Firstly, red blood cells are fundamentally involved in this equilibration possess by chemical reactions and transport processes, and they possess AQP1 in their membrane. However, as discussed by Endeward et al. (2008), the mere lack of AQP1 in the red cell membrane (with RhAG still present) reduces PCO2 to about 0.07 cm/s, and these authors showed that this value under resting conditions still allows complete CO2 equilibration of the red cell within the capillary transit time. Thus, red cells of AQP1 null mice are not expected to behave functionally differently from normal mice in a gas exchange experiment under resting conditions. The second potentially crucial step is the transfer of CO2 across the alveolar-capillary barrier. Among the elements of this barrier, only the endothelial membranes are candidates, as they express AQP1, while the alveolar epithelium does not (Verkman, 1998; Matsuzaki et al., 2009). The latter, as mentioned above, exhibits a strong expression of AQP5. We will analyse the chances of observing an effect of the AQP1 deficiency in the alveolar-capillary barrier in the experiment of Yang et al. (2000) by using the classical concept of the lung diffusing capacity that goes back to Roughton and Forster (1957). Accordingly, we separate the resistance to CO2 transfer from lung to red cell into a “diffusion, or membrane” component and a “chemical reaction” component. This is expressed by 1/DL = 1/DL,M + 1/θVc, where DL is the overall diffusing capacity of the lung, the reciprocal of DL, M is the diffusion or “membrane” resistance comprising that of the alveolar-capillary barrier, θ is the chemical reaction rate in the red cell, and Vc the volume of the lung capillary blood. In other words, 1/θVc is the resistance to CO2 transfer provided by the chemical reactions of CO2 and associated erythrocytic transport processes. The comparatively small contribution of the diffusion resistance across the alveolar-capillary barrier becomes manifest in the minimum estimate for DL, M, 1100 ml/mmHg/min, which compares with the overall diffusing capacity of the lung DL of 180 ml/mmHg/min (Schuster, 1987). Thus, DL, M makes up at most 1/6 of the total resistance for CO2 exchange between lung and red cells. In addition, the endothelial membranes make up only a fraction of the diffusion resistance of the alveolar-capillary barrier, 1/DL, M. We conclude from this that, in order to become noticeable in measurements of CO2 exchange between blood and alveolar gas, loss of AQP1 from the endothelial membranes would have to cause a dramatic increase in the diffusion resistance of these membranes. Such an enormous effect of AQP1 seems not very likely. The same conclusion has been reached by Swenson et al. (2002), who attempted to inhibit pulmonary AQP by Zn++ and, seeing no effect on CO2 exchange between diluted blood (10% hematocrit) or red cell-free lung perfusate and alveolar gas, estimated that the alveolar-capillary membrane diffusing capacity DL, M would have to be reduced by >90% to lower CO2 exchange by 10%. These arguments also apply to the observation of Fang et al. (2002), who in mice lacking AQP1 and/or AQP5 saw no difference to normal mice when they studied the exchange of CO2 between fluid-filled alveoli and lung-vessel perfusates. In that experiment, although of great interest because it studies lungs without AQP1 as well as AQP5, it appears likely that the large unstirred fluid zones in the alveoli will drastically decrease apparent DL, M. Therefore, these unstirred fluid zones will probably dominate the process of CO2 exchange rather than the permeability of the membranes of the alveolar-capillary barrier. We conclude that the CO2 exchange experiments conducted in lungs do not seem to be quite conclusive evidence against the function of AQP1 (or AQP5) as CO2 channels, although the quantitative physiological role of these channels in gas exchange in the lung clearly remains debatable and should be studied further.
A short note on the role of AQP1 in the kidney: Fang et al. (2002) have isolated proximal tubular vesicles, which are known to strongly express AQP1, and measured their CO2 permeability by the stopped-flow technique. As for the other vesicles studied by this group and already discussed above, the PCO2 they obtained was very low, 0.0035 cm/s, and it was identical between vesicles prepared from normal and AQP1-deficient mice. So the reservations against the stopped-flow technique explained above also apply to these experiments. On the other hand, Boron (2010) presents a preliminary report by Zhou et al. (2006), describing experimental work on intact proximal tubules. They come to the conclusion that 60% of the CO2 absorbed in the proximal tubule seems to be due to AQP1.
Missner et al. (2008) in a more recent paper presented essentially two arguments against a functional role of CO2 channels in membranes. Firstly, they reported, as mentioned above, a CO2 permeability of 3.2 cm/s in planar lipid bilayers, measured at an extremely alkaline pH of 9.6. At this alkaline pH, in the presence of CO2, HCO−3 and CO−3-, CO2 diffusion within the considerable unstirred layer of >100 μm was accelerated due to a facilitated diffusion mechanism that had also been utilized for such measurements by Gutknecht et al. (1977). This is expected to result, as the authors illustrate theoretically, in an only modest pCO2 gradient in the unstirred layer adjacent to the planar lipid bilayer, but in a significant pCO2 drop across the bilayer. This drop in pCO2 is an expression of the transmembrane resistance for CO2. It also is the basis of the figure of 3.2 cm/s they obtain for PCO2 from pH profile measurements in the front unstirred layer. The experimental procedure per se was similar to the one described above for the experiments of Zocher et al. (2012). We point out, however, the limitations of the fitting procedure used by Missner et al. (2008) to derive PCO2 values, as already voiced in chapter I of this article. Missner et al. (2008) take the PCO2 value of 3.2 cm/s to be representative for cell membranes in general, and go on to argue that with an unstirred layer (USL) of 1 μm as one often has around cells, the resistance of the USL vs. that of the membrane will be:
This shows, according to the authors, that the resistance to CO2 diffusion through a cell membrane will always be dominated by the unstirred layer effect. Therefore, they conclude, a CO2 channel in the cell membrane can never be of functional significance. We note that the basis of this argument rests on the assumption that the PCO2 of the cell is identical to the PCO2 of a lipid bilayer. This is in fundamental contrast to the determinations of red cell PCO2 (Endeward et al., 2006a, 2008), where even in the presence of CO2 channels values of 0.15 cm/s were found, and in their absence an estimate of ~0.01 cm/s was obtained. It is also in contrast to the findings of Itel et al. (2012) who report a dramatic decrease of bilayer PCO2 over 2–3 orders of magnitude with increasing cholesterol content, and it is in contrast to the PCO2 of 0.01 cm/s observed for cells in culture (Itel et al., 2012) as well as to earlier measurements of a PCO2 of 0.001 cm/s for the apical membrane of colon epithelium (Endeward and Gros, 2005). The calculation of Equation (7a), when performed for a PCO2 of 0.01 cm/s, leads to a 25 times greater diffusion resistance of the membrane in comparison to that of the 1 μm thick unstirred layer. Thus, the available experimental PCO2 values of cell membranes suggest that protein CO2 channels can indeed be physiologically significant.
The second argument presented by Missner et al. (2008) against the relevance of CO2 channels in biological membranes comes from measurements of the flux of CO2 across monolayers of MDCK cells. They study native MDCK cell layers in comparison to MDCK cells expressing AQP1 and substantiate the presence of AQP1 by immunocytochemistry and by water flux measurements. In terms of CO2 flux, they find no difference between MDCK cells with and without AQP1. In order to appreciate this latter result, one has to analyse the experimental situation employed by Missner et al. (2008). We do this in the following along the lines already published by Endeward and Gros (2009). The cells are grown on semipermeable supports by Transwell (Corning), whose exact type is not given, but which may have been 50 μm thick. The flux measurement then was done across the sum of the MDCK monolayer, which may have been 10 μm thick, plus the 50 μm support, plus an unstirred layer on the back side, behind the support, of the thickness demonstrated by the authors for the front side to be at least 130 μm. This adds up to a total water phase of at least 190 μm in thickness, across which the flux of CO2 occurred. We ignore the front side unstirred layer, because that was controlled by the microelectrode measurement and gave the authors the precise front-side surface pH value. If we now perform, as above in Equation (7), an analysis of the diffusion resistances of the overall water phase and of the membranes, we can write:
where dw is the overall thickness of the combined layers, DCO2 the CO2 diffusion coefficient in water (taken to approximate diffusion in all three components of the layer), PCO2, b the CO2 permeability of the basal MDCK membrane, and PCO2, a the CO2 permeability of the apical membrane. To insert numbers, let us first use Missner's assumed PCO2 for cells, 3.2 cm/s:
This would imply that the membrane resistance makes up <0.05% of the total resistance, and no change in membrane PCO2 by a factor even of 10 would ever be detectable. Thus, if we accept the logic of the paper by Missner et al. (2008), an aquaporin effect on membrane permeability could never have been measurable. Thus, the conclusion that AQP1 does not increase membrane CO2 permeability is not substantiated by this experiment.
Instead of PCO2 = 3.2 cm/s, we can tentatively insert into Equation (8) the value determined by Itel et al. (2012) for isolated MDCK cells, PCO2 = 0.017 cm/s:
Even with this much lower membrane permeability, the two membranes contribute <10% of the total diffusion resistance. An increase in PCO2 due to AQP1 expression by ~50% as reported by Itel et al. (2012), would necessitate being able to measure the difference between total diffusion resistances of 1390 s/cm and 1350 s/cm, i.e., a difference of less than 3%. In view of the precision of these measurements—and of any other conceivable experimental technique—it seems impossible to detect such an effect of AQP1 on membrane PCO2. No matter which membrane PCO2 we accept, the experiment used by Missner et al. (2008) seems to be unsuitable to observe AQP effects on PCO2. The decisive flaw in this setup is the large overall thickness of the diffusion layer.
Summarizing this chapter with the pros and contras on the existence of CO2 channels, we feel that overwhelming evidence has been accumulated by now that aquaporins and Rhesus protein indeed act as CO2 channels, and several lines of evidence proposed against CO2 channels are subject to some critique. Whether these channels are physiologically important or not, indeed depends crucially on the question what the “intrinsic” CO2 permeability of a cell membrane is. If it is very high, channels do not make sense, if it is low, they do. A small paper by representatives of the opposing views on this topic, Boron, Endeward, Gros, and Pohl, based on their discussion at a meeting in Strobl (Austria), was published (Boron et al., 2011) and summarizes this state of the discussion. After this meeting, the paper by Itel et al. (2012) has been published that shows that many membranes, due to their cholesterol content, have rather low intrinsic CO2 permeabilities and thus channels do make sense. This paper demonstrates this by (a) incorporating AQP1 into artificial phospholipid vesicles containing 50% cholesterol, which increases the vesicles' PCO2 up to 9-fold (Figure 7A), and (b) by showing that expression of AQP1 in MDCK cells, which possess ~40% cholesterol, significantly increases membrane CO2 permeability by ~50% (Figure 7B). Both experiments clearly illustrate that AQP1 acts as a functionally relevant CO2 channel, if the “intrinsic” membrane permeabilities for CO2 are sufficiently low, ~0.003 cm/s in the case of vesicles and 0.017 cm/s in the case of the MDCK cells. As most cells have cholesterol contents of around 40%, most cells are expected to exhibit an intrinsic CO2 permeability in the order of 0.01 cm/s, and thus their CO2 permeability will be significantly enhanced by the incorporation of a protein gas channel. It appears therefore at this stage that nature has two options to achieve a high CO2 permeability of a cell membrane, either by reducing its content of cholesterol, which will be at the expense of a reduced barrier function to other molecules and of a reduced mechanical stability, or by maintaining a high cholesterol content and raising CO2 permeability by incorporating protein gas channels. It will be of interest in the future to find more biological examples of these two options. A third option is of course to combine high cholesterol content with the absence of gas channels, which will give “gas-impermeable” membranes as discussed above.
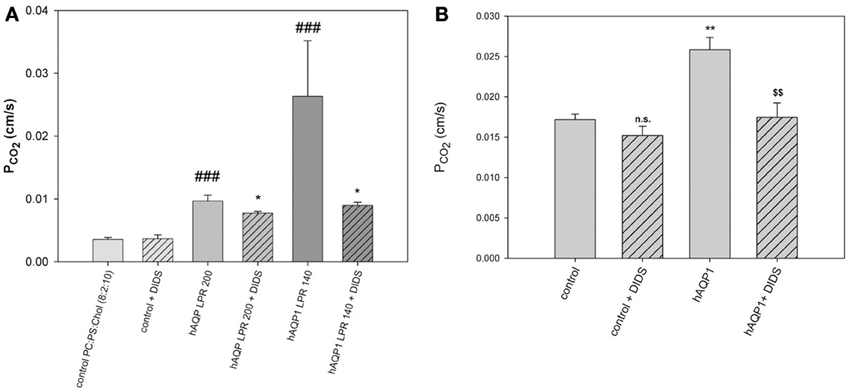
Figure 7. Effects of AQP1 incorporation into lipid vesicles and into MDCK cell membranes. (A) Phospholipid vesicles of phosphatidylcholine:phosphatidylserine 8:2, with 50 mol% cholesterol, with and without incorporation of human AQP1. LPR is lipid-to-protein ratio. At the highest protein incorporation, LPR 140, the PCO2 as measured by 18O exchange mass spectrometry is 9-fold increased over the control (leftmost column). DIDS reduces the AQP1-mediated CO2 conductances, but not the PCO2 of control vesicles. ###Significantly different from AQP1-free control vesicles, P < 0.01; *significant effect of DIDS on vesicles with the same LPR, P < 0.05. (B) Expression of human AQP1 in MDCK cells increases PCO2 significantly (**P < 0.02). DIDS reduces the hAQP1-mediated increase in PCO2 ($$P < 0.02), but does not affect PCO2 of control cells. Reproduced from Itel et al. (2012), with permission.
A Brief View on Other Gases of Physiological Interest
Direct determinations of cellular gas permeabilities for the gases listed in Table 1 other than CO2 are sparse. Kutchai (1975) concluded that the permeabilities of red cell membranes for O2 and CO are high enough in order to constitute no significant diffusion resistance during O2 and CO uptake by these cells, but did not come up with numbers for these permeabilities. Honig et al. (1992) observed by oxymyoglobin microspectrophotometry a shallow pO2 gradient inside skeletal muscle cells and concluded that a steep gradient of pO2 must occur between the surface of the red cell and the sarcolemma. In this phenomenon, however, the authors implied neither the red cell membrane nor the sarcolemma as sites of major diffusion resistance to O2, although this would have been conceivable, but rather attributed this resistance to the interstitial myoglobin-free space. However, in a later paper Voter and Gayeski (1995) found that the spatial resolution in the earlier experiments was considerably poorer than previously thought, so the intracellular pO2 gradients were in fact greater, reducing the role of the space between red cell and muscle cell membrane as a diffusion resistance for O2. In the present context, these data do not give an indication for a significant role of the two membranes as diffusion resistances toward O2. For lipid vesicles, Widomska et al. (2007) used the saturation-recovery EPR technique to determine the oxygen permeability coefficient. They reported extremely high PO2 values of 51, 50, and 157 cm/s for lipid bilayers at 37°C made from lipids extracted from membranes of the lens, from a 1-palmitoyl-2-oleoylphosphatidylcholine/cholesterol mixture, and from pure 1-palmitoyl-2-oleoylphosphatidylcholine, respectively. The same group has reported measurements with this technique in the Chinese hamster ovary plasma membrane, finding a PO2 of 42 cm/s at 37°C (Subczynski et al., 1992). These values, if true for cell membranes in general, would be far beyond constituting a barrier to O2 supply to cells, and they would deviate drastically from the value predicted in Table 1 from the measured PCO2 and the gas partition coefficients. If the very high intramembrane diffusivity of O2 arising from these high PO2 values were true for O2 and perhaps other gases such as NO, CO, and N2 as well, the implication would be that even in a pure phospholipid membrane, DM for CO2 would be exceptionally low among these gases. In sharp contrast to these EPR measurements, Ivanov et al. (2004) reported for surface lipid monolayers oxygen permeabilities between 10−4 and 10−5 cm/s, i.e., 6–7 orders of magnitude lower than the values derived from EPR. As a consequence, they postulated the existence of O2 channels in biological membranes. Indeed, Wang et al. (2007) have shown by molecular dynamics simulations that AQP1 can serve as a conduit for O2. The group of Echevarría et al. (2007) has also postulated the existence of oxygen channels, not from direct O2 flux measurements, but based on several lines of indirect evidence. e.g., they report (a) that overexpression of AQP1 results in an accelerated upregulation of HIF2α after exposure to hypoxia of PC12 cells, (b) that knockdown of AQP1 in endothelial cells induces hypoxia-inducible genes, and finally (c) they observe that rat lungs under systemic hypoxia up-regulate the expression of AQP1. One might ask, though, whether some of these effects could not be related to the function of AQP1 as a water channel.
A somewhat similar situation exists with respect to NO. Sakai et al. (2008) studied the uptake of NO by hemoglobin-loaded artificial vesicles using stopped-flow spectrophotometry. With low intravesicular hemoglobin concentrations and small vesicle sizes, the rate of combination of NO with deoxyhemoglobin was identical to the reaction rate with deoxyhemoglobin in solution. The authors concluded that no resistance of the vesicle membrane was apparent. With increasing vesicle size a retardation of the apparent association rate constant became apparent, which they interpreted as being due to an increasing role of intravesicular gas diffusion. This latter effect was not visible when they measured the uptake of CO by these vesicles, a fact they attributed to the much slower reaction kinetics of the CO-hemoglobin association. Again, in the case of NO, molecular dynamics simulations predict that AQP4 is an especially good conductor of both NO and O2 (Wang and Tajkhorshid, 2010), which would not make sense physiologically if the membrane permeabilities were generally immeasurably high. Along this line, in the case of NO a substantial body of evidence has been compiled from AQP1-transfected cells in culture, from AQP1 reconstituted into lipid vesicles, and from physiological measurements of the AQP1-dependence of the physiological actions of NO, all indicating that AQP1 is essential in getting NO across cell membranes from its site of production to its target (Herrera et al., 2006; Herrera and Garvin, 2007).
In conclusion, the field of O2 and NO permeation across biological membranes is highly controversial and drastically contradictory results have been reported. This area clearly awaits further studies of the mechanisms by which these gases cross membranes.
A Discussion of the Suitability of the 18O Exchange Mass Spectrometric Technique to Measure the Fast Process of CO2 Permeation
We have discussed above that CO2 exchange with lipid vesicles of a diameter of 150 nm may not be measurable by rapid reaction stopped-flow techniques, which have dead-times of a few milliseconds, provided the mixing efficiency of the apparatus is very good. This is so because the process is much faster than the dead time, if intravesicular CO2 hydration velocity is not limiting and if there is no marked diffusion resistance offered by the vesicle membrane. How can under these premises the mass spectrometric 18O technique overcome the problem of the extreme rapidity of the processes of CO2 permeation? In this chapter we will first summarize the principle of the 18O exchange technique, which has already been described before in great detail, then address the above question how a mass spectrometric technique, whose response time is 3 s (Endeward and Gros, 2005) and which records its signal on a time scale of several hundreds of seconds, can be able to describe the extremely fast process of CO2 exchange across cells and vesicles. Next, we will demonstrate the sensitivity of the calculated permeability values for CO2 to other parameters that enter into the calculation, then illustrate quality and reliability of the fitting procedure that needs to be employed, because an analytical solution of the system of differential equations describing the 18O exchange process is not available, and finally discuss experimental data on the effect of unstirred layers in the mass spectrometric PCO2 measurements of red cells.
Principle of the Method
We will briefly summarize the mass spectrometric method to measure PCO2 of cells and vesicles, which has first been described in detail by Wunder and Gros (1997, 1998) and Wunder et al. (1998), and later in its final form by Endeward and Gros (2005). All technical details are described in these papers. The underlying principle is that used by Mills and Urey (1940) to measure the kinetics of the CO2 hydration-dehydration reaction by using 18O-labeled CO2 and HCO−3 and observing the very slow process of the disappearance of the 18O from the CO2/HCO−3 pool into the comparatively huge H2O pool. Much later, Itada and Forster (1977) developed an ingenious gas inlet system for the mass spectrometer and used this method to observe the effect of the addition of red cells to the solution of labeled CO2/HCO−3upon the time course of 18O loss from CO2. They calculated from this the intraerythrocytic carbonic anhydrase activity and the red cells' bicarbonate permeability. Wunder and Gros (1997, 1998) and Wunder et al. (1998) became aware of the fact that this time course also contains information on the CO2 permeability of the red cell membrane and they developed the theory describing this process, which allowed them to derive PCO2 values from the mass spectrometric recordings. Because some refinements of the theory were added later on, we will in the following refer to the theory in the form described by Endeward and Gros (2005). NaHC18O16O2 is dissolved in a solution in the reaction chamber connected to the mass spectrometer via the previously described gas inlet system (Wunder and Gros, 1998). The 18O-labeled bicarbonate rapidly establishes chemical equilibrium with 18O-labeled CO2, and from then on chemical equilibrium exists in the system, and the entire remainder of the experiment occurs under conditions of perfect chemical equilibrium, including constant values of pH and total pCO2. However, the system at this point is far from isotopic equilibrium, which is approached very slowly by the mechanism indicated in the upper half of Figure 8. Each time the labeled bicarbonate reacts to give water and CO2, there is a 1/3 chance that the 18O is lost from the CO2-HCO−3 pool into the water pool. Since the latter is 55.5 M/20 · 10−3M ≈ 3000 times greater than the former, eventually almost all the 18O will be lost into the water. This causes a slow spontaneous decay of C18O16O, the quantity measured by the mass spectrometer via the gas inlet system. This decay is seen in the first part of the recording of Figure 9. The slope of this first part is what Mills and Urey (1940) used to determine the CO2 hydration velocity constant. Both, Figures 8, 9 show that the situation changes dramatically, when red cells (or other carbonic anhydrase-containing cells or vesicles) are added. This is followed by a (rapid) influx of labeled CO2 into the red cells, where it is fed into the same reaction processes as shown for the extracellular space in the upper half of Figure 8. More slowly than C18O16O, labeled bicarbonate then also enters the red cells and is fed into these reactions. These two processes can be assigned—although not exclusively—to the two phases seen in the mass spectrometric recording in Figure 9 after red cell addition: the first rapid phase is dominated by the CO2 influx (besides by the intracellular carbonic anhydrase (CA) activity), and the second slower phase contains most of the information about the influx of HCO−3. The same reaction processes that occur in the extracellular space occur in the intracellular space 20,000 times faster due to the CA, and for this reason almost the entire reaction process now takes place intracellularly. As evident from the scheme of Figure 8, the intracellular reaction process depends on CO2 and HCO−3 moving into the cells, a process which is controlled by the permeabilities of the membrane for CO2, PCO2, and for HCO−3, PHCO−3. All the reaction and diffusion processes of Figure 8 are described by a set of six differential equations (Endeward and Gros, 2005), and their numerical solution is used to determine by a fitting procedure the best-fit values of these two parameters. It should be noted that the intracellular CA activity, which is also very important for the kinetics of the 18O exchange process, is determined independently from cell lysates under intracellular conditions and is not obtained from the fitting procedure. Determining CA activity in this way requires ensuring that two important parameters influencing specific CA activity equal those present inside cells, i.e., pH and [Cl−], and it presupposes that the CA activity measured in diluted cell lysate can safely be extrapolated to the intracellular CA concentration. This latter assumption has previously been validated by the work of Donaldson and Quinn (1974). The perfect superimposition of the original mass spectrometric recording in Figure 9 (solid red curve) and the theoretical curve (dotted yellow) calculated with the best-fit values of PCO2and PHCO−3 is achieved for almost all experiments. It illustrates that the theory provides an excellent description of the process of Figure 8.
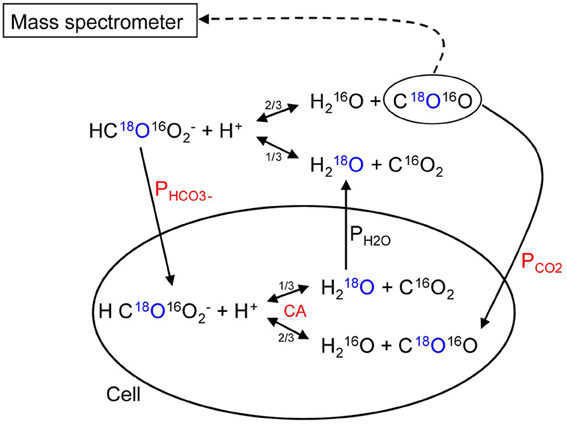
Figure 8. Schematic representation of the processes occurring when carbonic anhydrase-containing cells are added to 18O-labeled CO2-HCO−3 solution. The labeled O is marked in blue, the most critical parameters determining the time course of the process are labeled in red. Single arrows indicate transport processes, double arrows reaction processes.
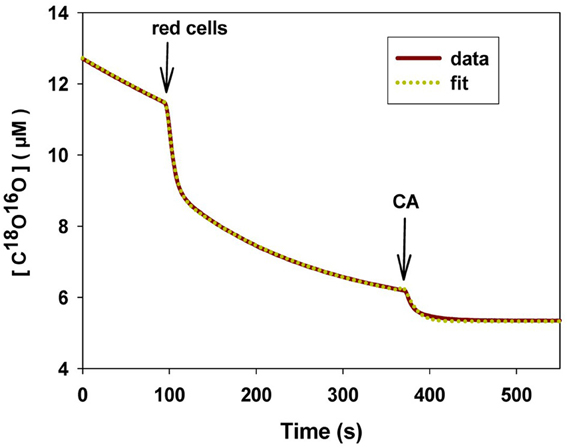
Figure 9. Original mass spectrometric recording of an experiment with human red cells. The concentration of C18O16O is plotted vs. time. First arrow point of addition of red cells, second arrow point of addition of CA in excess to rapidly establish final isotopic equilibrium. Solid curve (red): mass spectrometric recording; dotted curve (yellow): calculated curve using the best-fit values of PCO2 and PHCO−3. 37C.
How Can the 18O Exchange Mass Spectrometric Method Measure Processes that Occur within Some Milliseconds?
The difference between the kinetics of cellular CO2 exchanges and the kinetics of the decay of the 18O-labeled CO2 reflecting these exchanges is huge. For example, let us consider the CO2 uptake process by human red cells. This process is so fast that it is tricky to measure it by the stopped-flow technique, for the reasons already discussed, dead time of a few milliseconds, possible imperfect mixing, and the special problem encountered when mixing cell or vesicle suspensions in this apparatus. For this reason, stopped-flow is not an ideal technique to measure the uptake of gases by cells, and we will not refer to such measurements here. Holland and Forster (1975) measured the uptake of CO2 by human red cells with a rapid reaction continuous flow apparatus, which does not have this problem, because the solutions with the cells continue to flow during observation. The authors determined a half-time of this process of 13 ms, which we consider fairly reliable for the reasons just given. Let us compare this number with the kinetics of the uptake of C18O16O by human red cells, as it is reflected in the extracellular decay of this species and illustrated in Figure 9. Using the point of red cell addition, and the final isotopic equilibrium reached after the addition of excess free CA at the end of the experiment, we can estimate the half-time of the overall process to be ~140 s, which is more than 10,000 times the half-time of net uptake of CO2. What is the mechanism of this enormously slow representation of a very fast process in the C18O16O decay signal? There are two major mechanisms contributing to this, which we shall discuss in the following.
(1) Mills and Urey (1940), who developed the 18O exchange technique to measure the kinetics of the uncatalyzed CO2 hydration reaction, explained that the disappearance of 18O from the labeled CO2/HCO−3 into the water pool will, firstly, be only 1/3 as fast as the net CO2 hydration reaction as it is illustrated in Figure 10A, because under chemical, but not isotopic, equilibrium only 1/3 of the reaction steps producing H2O and CO2 from HCO−3 will lead to as loss of 18O into the water pool (see upper half of Figure 8). Secondly, as most of the 18O label is located in HCO−3 rather than in CO2, but each forward and backward reaction step in Figure 8 has to pass through CO2, the process will be slowed by the ratio [HCO−3]/[CO2], which for the calculation of Figure 10B we have assumed to be 17, corresponding to a pH of 7.3 at 37°C.
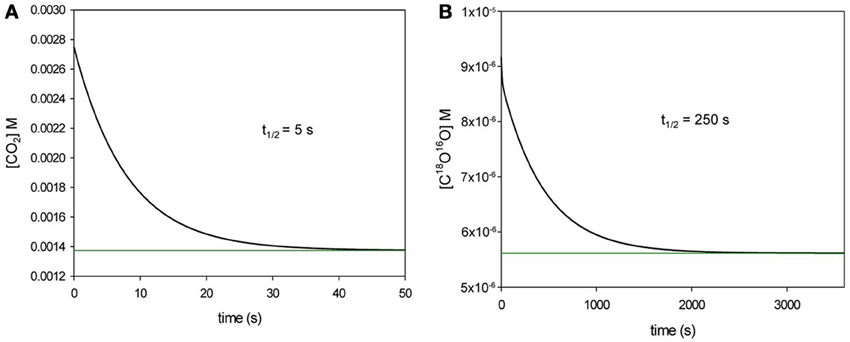
Figure 10. Comparison of the time courses of the net CO2 hydration reaction after a step increase in [CO2] (A), and the spontaneous decay of C18O16O after a step increase in labeled CO2 and HCO−3 being in chemical equilibrium but not in isotopic equilibrium with water (B). Calculated for 37°C. Inserts indicate the half-times of the two reactions.
In Figure 10B we have calculated the half time necessary to reach isotopic equilibrium after a step increase in C18O16O in solution, in the manner in which this is also done for the extracellular space in the equations describing the process of Figure 8. This yields a t1/2 of 250 s. In Figure 10A we have calculated the half-time of the net reaction CO2 + H2O ↔ HCO−3 + H+ at 37°C after a step increase in pCO2, giving a t1/2 of 5 s. In other words, the decay of C18O16O occurs 50 times more slowly than the net CO2 hydration. The factor 50 results from the product 3 × 17, as predicted by Mills and Urey (1940).
Having accounted for a factor of 50 out of a total slow-down factor of 10,000, we are left with a factor of 10,000/50 = 200.
(2) An important point to consider here is that in the mass spectrometric measuring chamber one does not use packed red cells, but highly diluted red cell suspensions. By observing the decay of the extracellular C18O16O concentration, one does not observe what is going on inside the red cell, but its reflection in the outside solution. Obviously, this signal will vary drastically with the hematocrit in the measuring chamber. However, the optimal hematocrit is not just 1/200 = 0.5%, but even >10 times less (Endeward et al., 2008). The extracellular solution in view of this very low hematocrit contains a huge reservoir of 18O, mainly in the form of HC18O16O−2. Due to the high intracellular CA activity, the reactions of Figure 8, however, occur almost exclusively inside the cell. This implies that all the label of the extracellular solution has to pass through the very small volume of the red cells on order to end up eventually in the water of the reaction chamber. This situation will slow down greatly the overall process, and is comparable to an RC element with a capacitor of large capacitance (the large pool of 18O in the CO2/HCO−3 of the extracellular solution) in conjunction with a resistor (the small red cell volume through which the process of 18O decay has to pass) in an electric circuit. Given that the time constant of an RC element is R · C, an increase in R will slow down the process. Inversely, decreasing R by increasing the hematocrit will accelerate the process. This latter case is illustrated in the curves of Figure 11, which were calculated with our mathematical model describing the scheme of Figure 8. The blue curve illustrates the often used condition of a red cell experiment with a hematocrit in the measuring chamber of 0.02% (with the usual intracellular CA activity of human red cells of 20,000, and a surface-to-volume ratio of these cells of 20,000 cm−1). The faster, green curve, which would just be measurable in the mass spectrometer, is calculated for a ten-fold hematocrit of 0.2%. It is apparent that this causes an enormous acceleration of the C18O16O kinetics, although not quite by a factor of ten, but by a factor of about 5.5. This non-proportional behavior is the reason why, in order to achieve a deceleration of a factor of 200, one needs a greater than 200-fold dilution of packed red cells.
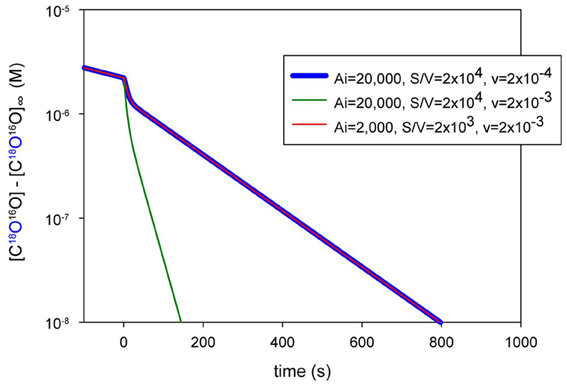
Figure 11. Calculated mass spectrometric recordings for three different conditions of hematocrit and intracellular activity. Blue curve: human red cell hematocrit of 0.02% with intracellular activity Ai of 20,000. Green curve: hematocrit of 0.2% with Ai = 20,000. Red curve (superimposed to the blue curve): hematocrit of 0.2% with Ai = 2000 and 10 times smaller surface-to-volume ratio S/V, similar to what is exhibited by MDCK cells etc. Y-axis: actual concentration of C18O16O at a given time minus its concentration [C18O16O]∞ after isotopic equilibrium has been reached.
In conclusion, the present mass spectrometric technique is able to measure extremely fast CO2 exchanges (i) because it observes the loss of 18O from CO2+ HCO−3 into the water pool, rather than observing directly the CO2 exchange process, and (ii) because an extreme dilution of the cell suspensions drastically slows down this kinetics. An additional and practically highly useful information can be taken from Figure 11 by noting that the red curve coincides with the blue curve: cells with properties approaching those of MDCK cells that are larger than red cells (with a correspondingly smaller surface-to-volume ratio), but possess, for example, a 10 times lower intracellular CA activity, can be measured equally well, if in compensation the cytocrit is raised ten-fold. This implies that the method is suitable to measure PCO2 of cells like MDCK, HEK293 or tsA201 cells with considerably lower intracellular CA activity than red cells (Al-Samir et al., 2013), provided the cytocrit in the measuring chamber is raised correspondingly.
The effect of using the extremely low hematocrits in these experiments is further visualized in Figure 12. With Ai = 20,000, a hematocrit of 0.02% implies an overall CA activity in the measuring chamber of 20,000 × 0.0002 = 4. The green line in Figure 12 shows the effect of adding an amount of free CA in solution into the chamber that yields a four-fold acceleration of the slope of C18O16O decay. The red curves have been calculated for a hematocrit of intact red cells of 0.02% and an Ai of 20,000, using different PCO2 values of 0.15, 0.015, and 0.0015 cm/s. The three curves are distinctly different, especially in terms of the kinetics and amplitude of their first phases, and thus conspicuously reflect the different PCO2 values. The overall CA activity of the red cells studied in the three red curves, however, when averaged over the entire chamber volume, is 4. This activity when present free in solution is indicated by the green line (Ae = 4). It may be seen that the gross overall time course of all three red cell curves is similar to that of the green curve for Ae = 4. We conclude that the extreme dilution of the cells investigated, which this method allows us employ, makes it possible to slow the process of 18O exchange sufficiently down to make it measurable by mass spectrometry.
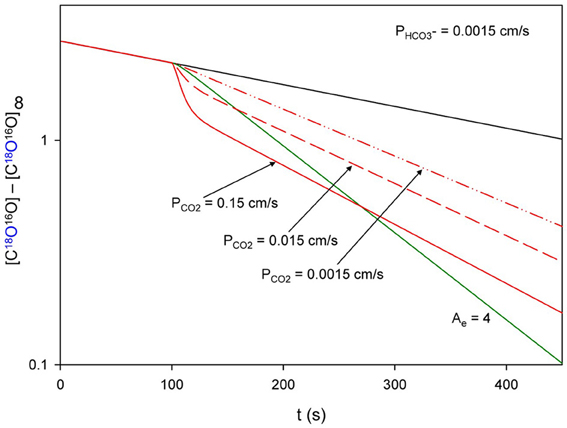
Figure 12. Calculated time courses of mass spectrometric recordings from human red cells at a hematocrit of 0.02%. The red curves are calculated for a PCO2 of 0.15 cm/s ( ), 0.015 cm/s (
 ) and 0.0015 cm/s (
 ). The green line (
 ) indicates an extracellular CA activity Ae of 4, if free CA is added to the solution in the absence of cells. If the red cells studied in the three red curves were lysed, they would also cause an Ae of 4. Denotation of axes identical to Figure 11.
Sensitivity of the PCO2 Values Estimated from the Mass Spectrometric Records for the Parameters Used in the Theoretical Treatment
In addition to the two parameters to be determined, PCO2 and PHCO−3, the parameters given on the x-axis of Figure 13 are used in the set of differential equations (Endeward and Gros, 2005). It is apparent that two very sensitive parameters are the intracellular CA activity, Ai, and the extracellular pH, pHe, as it prevails in the mass spectrometric measuring chamber. As mentioned, Ai is carefully determined independently. pHe is equally carefully controlled by a pH electrode present in the measuring chamber and always kept precisely at pH 7.40 (Endeward and Gros, 2005; Endeward et al., 2006a). K1′, the first apparent dissociation constant of carbonic acid, is a precisely known physico-chemical constant. pHi, the intracellular pH, is usually well defined by the pHe and is entirely uncritical, as is the water permeability of the membrane, PH20. Even variations of PH20 with AQP1 expression or lack thereof do not influence the results, because PH20 is always high enough to warrant a sufficient efflux of labeled water from the cells, a process illustrated Figure 8. An important parameter next to Ai and pHe is the cellular surface-to-volume ratio a, which is determined on each experimental day for all cell types employed. In the case of red cells the volume is derived from hematocrit and cell density, and literature values are used for the surface area. In the case of isolated primary cells or cells isolated from cultures, we determine microscopically cell density and cell diameter and utilize their usually spherical shape to calculate a. In the latter case, the uncertainty is greater than in the case of red cells, but is not expected to exceed 10%, a number which would introduce an error of equal percentage into PCO2.
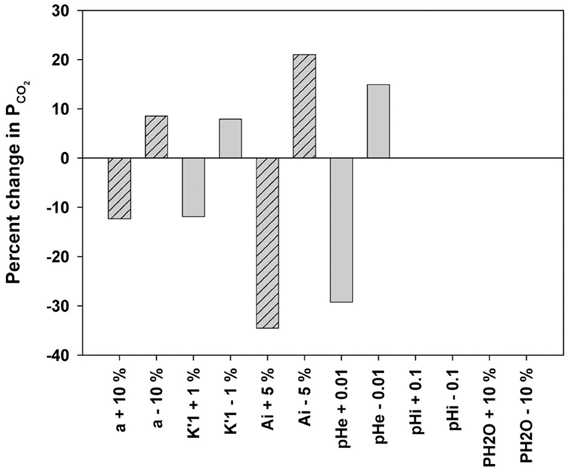
Figure 13. Sensitivity of the estimated PCO2 for variations in the parameters used in the system of equations decribing the processes of Figure 8. a, Surface-to-volume ratio of cells; K1′, first apparent disscociation constant of carbonic acid: K1′ = [H+] [HCO−3]/[CO2]; Ai, intracellular CA activity; pHe, extracellular pH in measuring chamber; pHi, intracellular pH; PH20, water permeability of cell membrane. Reproduced from Endeward et al. (2008), with permission.
In the context of discussing the influence of Ai on the determination of PCO2, it seems appropriate here to add a note on how the 18O method behaves when cells of larger size but with much lower intracellular CA activity than red cells, such as MDCK cells, are to be measured. We consider cells with an intracellular CA activity of 500, i.e., 1/40 of that of red cells, which are employed at a suitable cytocrit and possess a true PCO2 of 0.01 cm/s. We compare two curves of the kind shown in Figure 9, one fitted perfectly by PCO2 = 0.01 cm/s, the other calculated with identical parameters except a value of PCO2 of 0.1 cm/s forced upon the calculation. We determine from these curves the concentrations [C18O16O] shortly after the beginning of the 2nd slower phase, which follows the 1st phase initiated by the addition of cells, and find that these concentrations differ between the two curves by 20%. This is a highly significant difference, which shows that in these cells, similar to the case of red cells (see Figure 1 in Endeward et al., 2008), CO2 permeabilities between 0.01 and 0.1 cm/s can be distinguished with great certainty. If we do the analogous calculations for PCO2 = 0.1 cm/s and PCO2 = 1 cm/s, the difference in [C18O16O] is 3%, i.e., a distinction between these permeabilities is still possible, but with decreasing reliability. This behavior is similar to that exhibited by red cells. Testing the sensitivity of PCO2 (0.01 cm/s) of these MDCK-type cells for changes in Ai, in the manner shown in Figure 13 for red cells, we find that an increase in Ai from 500 to 525 (+5%) causes a decrease in PCO2 by 11%, and a decrease in Ai from 500 to 475 (−5%) causes an increase in PCO2 by 26%. Thus, for cells of low CA activity the sensitivity of PCO2 for errors in Ai is equal to or lower than in the case of red cells as shown in Figure 13. The overall conclusion from these considerations is that the mass spectrometric method works equally well for cells with rather low Ai, e.g., of the type of MDCK cells, as it does for red cells.
Uniqueness and Precision of the Permeabilities Obtained from the Fitting Procedure
It is apparent from Figure 14A that the fitting procedure yields highly reliably the values of PCO2as well as PHCO−3 from a given experimental record. This is due to the above-mentioned fact that the curve of C18O16O decay that evolves after the addition of the cells, exhibits two clearly separated phases. Each of the two permeabilities does not solely determine one of these phases, but PCO2 dominates the first rapid phase (together with Ai), while PHCO−3 plays a minor role, and PHCO−3 is dominant in the second slower phase, where Ai and PCO2 play minor roles. This situation is extremely useful in unambiguously deriving the two permeabilities from the mass spectrometric records, and for the same reason the fitting procedure converges exceptionally well. Figure 14A shows that there is a unique minimum in the sum of squared deviations between experimental and calculated concentrations of labeled CO2 for both PCO2 and PHCO−3, and no local minima are present. Figure 14B illustrates for the examples of normal human red cells (blue curve) and of AQP1-deficient human red cells (red curve) how well this method differentiates between the two cell types. Normal red cells in this example have a PCO2 of about 0.11 cm/s, and AQP1-deficient red cells of 0.07 cm/s, both values being in the range of values reported by Endeward et al. (2006a). The precision of these determinations is visibly better than 0.005 cm/s.
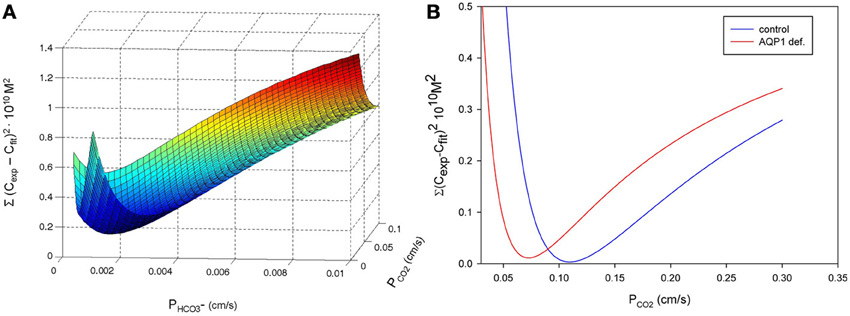
Figure 14. Quality of the fitting procedure, expressed as sum of squared deviations between experimental and calculated concentrations of C18O16O. (A) Two-dimensional representation illustrating that a unique minimum of the sum of squares defines PCO2 as well as PHCO−3 for a given experimental record of C18O16O decay. There are no local minima whatsoever. Reproduced from Al-Samir et al. (2013), with permission. (B) Sum of squares for an experimental curve with normal human red blood cells (blue curve) and with AQP1-deficient human red cells (red curve) as a function of PCO2. It is apparent that the different CO2 permeabilities of the two red cell types are well defined. The precision achieved by the fitting procedure for PCO2 is better than 0.005 cm/s.
Role of Unstirred Layers in Mass Spectrometric Measurements of Red Cell CO2 Permeability
Because the diffusion resistance of cell membranes to CO2 is in many cases—as discussed above—small, e.g., compared to that of ions, an additional resistance due to an unstirred layer of water around the cells studied is of importance. It is has therefore often been postulated that CO2 permeabilities were underestimated due to the presence of extracellular unstirred layers. Endeward and Gros (2009) have therefore developed an approach allowing them to determine the unstirred layer thickness around red cells in mass spectrometric PCO2 determinations.
From the additivity of the diffusion resistances of the membrane and the extracellular unstirred layer it follows that
where PCO2, app is the measured apparent CO2 permeability that includes effects by an unstirred layer, PCO2, true is the true CO2 permeability of the membrane, δ is the thickness of the extracellular unstirred layer, and DCO2 is the CO2 diffusion coefficient in water that describes CO2 diffusion in the unstirred layer.
It is known from theoretical hydrodynamics that at given other conditions δ increases with increasing solution viscosity ν (Landau and Lifschitz, 1991). To utilize this relationship, Endeward and Gros (2009) suspended human red cells in solutions with dextran concentrations (mol.wt. 60,000) between 0 and 10 g%, whose viscosities varied between 0.7 and about 4 · 10−6 m2/s. At various dextran concentrations within this range they determined PCO2, app at 37°C, and plotted PCO2, app vs. the viscosity of the dextran solution. The results are shown in Figure 15, which illustrates that a linear relationship between 1/PCO2, app and ν is obtained experimentally. It follows from hydrodynamics (Landau and Lifschitz, 1991) that the unstirred layer must be zero at zero viscosity. Therefore, the extrapolation of the linear regression line in Figure 15 to ν = 0 gives the true membrane CO2 permeability PCO2, true, which turns out to be 0.16 cm/s. The lowermost experimental data point was obtained in saline (arrow in Figure 15) and had a value of 0.12 cm/s. This means that the unstirred layer reduces PCO2 by 25%, which can be considered a minor effect. Inserting numbers into Equation (9), we can write:
and obtain an unstirred layer thickness δ of 4.2 · 10−5 cm = 0.42 μm in this case. This again is a very moderate unstirred layer thickness, which was obtained by optimized conventional stirring at maximal speed with a magnetic bar stabilized by being fixed in a Teflon ring. In conclusion, the PCO2 values obtained by the mass spectrometric technique are affected by unstirred layers to a minor extent only.
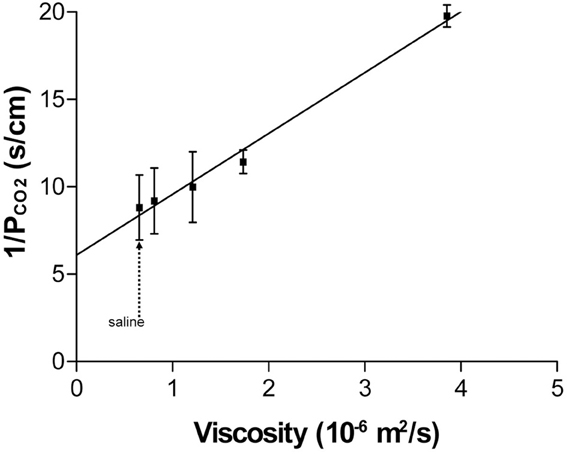
Figure 15. Plot of the reciprocal of the experimentally determined red cell PCO2 (PCO2, app) vs. the kinematic viscosity of the dextran solution in which it was measured. Extrapolation of the linear relation to zero viscosity yields the true membrane PCO2 (PCO2, true). 37°C. “Saline” indicates the PCO2 measured in the absence of dextran. Reproduced from Endeward and Gros (2009), with permission.
The empirical linear relationship of Figure 15 together with Equation (9) leads to the relation
where C is a proportionality constant. This implies that
a prediction derived by Endeward and Gros (2009) from hydrodynamic theory for this experiment, provided the magnetic stirrer exerts a constant force in the cell suspension, independent of viscosity. It should be noted that this latter consideration merely provides a theoretical rationale for the empirical finding of Figure 15.
A topic, although of great interest, has not been discussed here, i.e., the intracellular unstirred layer, which is omnipresent in all cellular transport measurements, but is not accessible experimentally. Endeward and Gros (2009) have used a computer model to estimate the size of this layer. For the case of CO2 diffusion in red cells they came up with a thickness of this layer of about ¼ to 1/3 of the half-thickness of the erythrocytic disc.
In view of the numerous vesicle experiments discussed in this article, it is of interest to finally add another insight from hydrodynamic theory, which has been presented by Endeward and Gros (2009). When other conditions such as convection are held constant, the thickness of the extracellular unstirred layer is proportional to the square root of the diameter (or “characteristic length”) d of the cell or vesicle studied
Using δ = 0.42 μm for red cells with a diameter of 7.5 μm, one predicts a δ of 0.06 μm for a vesicle diameter of 150 nm, i.e., the diffusion resistance of the unstirred layer toward CO2 will be seven times smaller in vesicles than in red cells. Thus, the estimated vesicular CO2 permeability will be corrupted by the unstirred layer to a much lesser extent. Applying an identical consideration on the basis of Equation (12) to MDCK cells (d = 10 μm), one comes up with an estimate of δ for MDCK cells of 0.48 μm, just slightly greater than for red cells.
Conflict of Interest Statement
The authors declare that the research was conducted in the absence of any commercial or financial relationships that could be construed as a potential conflict of interest.
Acknowledgments
We are indebted to Prof. R. E. Forster, Philadelphia, for critical reading of this manuscript and useful suggestions and comments. This work was supported by the Deutsche Forschungsgemeinschaft grant EN 908/1-1.
References
Alberts, B., Johnson, A., Lewis, J., Raff, M., Roberts, K., and Walter, P. (2002). Molecular Biology of the Cell. 4th Edn. New York, NY: Garland Science.
Al-Samir, S., Papadopoulos, S., Scheibe, R. J., Meiβner, J. D., Cartron, J. P., Sly, W. S., et al. (2013). Activity and distribution of intracellular carbonic anhydrase II and their effects on the transport activity of anion exchanger AE1/SLC4A1. J. Physiol. 591, 4963–4982. doi: 10.1113/jphysiol.2013.251181
Armstrong, A. T., Binkley, P. F., Baker, P. B., Myerowitz, P. D., and Leier, C. V. (1998). Quantitative investigation of cardiomyocyte hypertrophy and myocardial fibrosis over 6 years after cardiac transplantation. J. Am. Coll. Cardiol. 32, 704–710. doi: 10.1016/S0735-1097(98)00296-4
Bartels, H., Bücherl, E., Hertz, C. W., Rodewald, G., and Schwab, M. (1959). Lungenfunktionsprüfungen. Berlin-Göttingen-Heidelberg: Springer. doi: 10.1007/978-3-642-52983-2
Battino, R., Rettich, T. R., and Tominaga, T. (1984). The solubility of nitrogen and air in liquids. J. Phys. Chem. Ref. Data 13, 563–600. doi: 10.1063/1.555713
Boron, W. F. (2010). Sharpey-Schafer lecture: gas channels. Exp. Physiol. 95, 1107–1130. doi: 10.1113/expphysiol.2010.055244
Boron, W. F., Endeward, V., Gros, G., Musa-Aziz, R., and Pohl, P. (2011). Intrinsic CO2 permeability of cell membranes and potential biological relevance of CO2 channels. Chemphyschem. 12, 1017–1019. doi: 10.1002/cphc.201100034
Bunce, A. S., and Hider, R. C. (1974). The composition of black lipid membranes formed from egg-yolk lecithin, cholesterol and n-decane. Biochim Biophys. Acta 363, 423–427. doi: 10.1016/0005-2736(74)90081-9
Donaldson, T. L., and Quinn, J. A. (1974). Kinetic constants determined from membrane transport measurements: carbonic anhydrase activity at high concentrations. Proc. Natl. Acad. Sci. U.S.A. 71, 4995–4999. doi: 10.1073/pnas.71.12.4995
Echevarria, M., Frindt, G., Preston, G. M., Milovanovic, S., Agre, P., Fischbarg, J., et al. (1993). Expression of multiple water channel activities in Xenopus oocytes injected with mRNA from rat kidney. J. Gen. Physiol. 101, 827–841. doi: 10.1085/jgp.101.6.827
Echevarría, M., Muñoz-Cabello, A. M., Sánchez-Silva, R., Toledo-Aral, J. J., and López-Barneo, J. (2007). Development of cytosolic hypoxia and hypoxia-inducible factor stabilization are facilitated by aquaporin-1 expression. J. Biol. Chem. 282, 30207–30215. doi: 10.1074/jbc.M702639200
Endeward, V. (2012). The rate of the deoxygenation reaction limits myoglobin- and hemoglobin-facilitated O2 diffusion in cells. J. Appl. Physiol. 112, 1466–1473. doi: 10.1152/japplphysiol.00835.2011
Endeward, V., Cartron, J. P., Ripoche, P., and Gros, G. (2008). RhAG protein of the Rhesus complex is a CO2 channel in the human red cell membrane. FASEB J. 22, 64–73. doi: 10.1096/fj.07-9097com
Endeward, V., and Gros, G. (2005). Low carbon dioxide permeability of the apical epithelial membrane of guinea-pig colon. J. Physiol. 567, 253–265. doi: 10.1113/jphysiol.2005.085761
Endeward, V., and Gros, G. (2009). Extra- and intracellular unstirred layer effects in measurements of CO2 diffusion across membranes—a novel approach applied to the mass spectrometric 18O technique for red blood cells. J. Physiol. 587, 1153–1167. doi: 10.1113/jphysiol.2008.165027
Endeward, V., Gros, G., and Jürgens, K. D. (2010). Significance of myoglobin as an oxygen store and oxygen transporter in the intermittently perfused human heart: a model study. Cardiovasc. Res. 87, 22–29. doi: 10.1093/cvr/cvq036
Endeward, V., Musa-Aziz, R., Cooper, G. J., Chen, L. M., Pelletier, M. F., Virkki, L. V., et al. (2006a). Evidence that aquaporin 1 is a major pathway for CO2 transport across the human erythrocyte membrane. FASEB J. 20, 1974–1981. doi: 10.1096/fj.04-3300com
Endeward, V., Cartron, J. P., Ripoche, P., and Gros, G. (2006b). Red cell membrane CO2 permeability in normal human blood and in blood deficient in various blood groups, and effect of DIDS. Transfus. Clin. Biol. 13, 123–127. doi: 10.1016/j.tracli.2006.02.007
Fang, X., Yang, B., Matthay, M. A., and Verkman, A. S. (2002). Evidence against aquaporin-1-dependent CO2 permeability in lung and kidney. J. Physiol. 542, 63–69. doi: 10.1113/jphysiol.2001.013813
Finkelstein, A. (1976). Water and nonelectrolyte permeability of lipid bilayer membranes. J. Gen. Physiol. 68, 127–135. doi: 10.1085/jgp.68.2.127
Forster, R. E. (1969). “The rate of CO2 equilibration between red cells and plasma,” in CO2: Chemical, Biochemical, and Physiological Aspects, eds R. E. Forster, J. T. Edsall, A. B. Otis, and F. J. W. Roughton (Washington, DC: National Technical Information Service, NASA SP-188), 275–284.
Forster, R. E., Gros, G., Lin, L., Ono, Y., and Wunder, M. (1998). The effect of 4,4′-diisothiocyanato-stilbene-2,2′-disulfonate on CO2 permeability of the red blood cell membrane. Proc. Natl. Acad. Sci. U.S.A. 95, 15815–15820. doi: 10.1073/pnas.95.26.15815
Geyer, R. R., Musa-Aziz, R., Qin, X., and Boron, W. F. (2013a). Relative CO2/NH3 selectivities of mammalian aquaporins 0–9. Am. J. Physiol. Cell Physiol. 304, C985–C994. doi: 10.1152/ajpcell.00033.2013
Geyer, R. R., Parker, M. D., Toye, A. M., Boron, W. F., and Musa-Aziz, R. (2013b). Relative CO2/NH3 permeabilities of human RhAG, RhBG and RhCG. J. Membr. Biol. doi: 10.1007/s00232-013-9593-0. [Epub ahead of print].
Gros, G., and Moll, W. (1972). “The facilitated diffusion of CO2 in hemoglobin solutions and phosphate solutions,” in Oxygen Affinity of Hemoglobin and Red Cell Acid Base Status, eds M. Rorth and P. Astrup (Kopenhagen: Munksgard), 484–492.
Gutknecht, J., Bisson, M. A., and Tosteson, F. C. (1977). Diffusion of carbon dioxide through lipid bilayer membranes: effects of carbonic anhydrase, bicarbonate, and unstirred layers. J. Gen. Physiol. 69, 779–794 doi: 10.1085/jgp.69.6.779
Hasselblatt, P., Warth, R., Schulz-Baldes, A., Greger, R., and Bleich, M. (2000). pH regulation in isolated in vitro perfused rat colonic crypts. Pflügers Arch. 441, 118–124 doi: 10.1007/s004240000377
Herrera, M., and Garvin, J. L. (2007). Novel role of AQP-1 in NO-dependent vasorelaxation. Am. J. Physiol. Renal Physiol. 292, F1443–F1451. doi: 10.1152/ajprenal.00353.2006
Herrera, M., Hong, N. J., and Garvin, J. L. (2006). Aquaporin-1 transports NO across cell membranes. Hypertension 48, 157–164. doi: 10.1161/01.HYP.0000223652.29338.77
Holland, R. A., and Forster, R. E. 2nd. (1975). Effect of temperature on rate of CO2 uptake by human red cell suspensions. Am. J. Physiol. 228, 1589–1596.
Honig, C. R., Connett, R. J., and Gayeski, T. E. (1992). O2 transport and its interaction with metabolism; a systems view of aerobic capacity. Med. Sci. Sports Exerc. 24, 47–53. doi: 10.1249/00005768-199201000-00009
Hub, J. S., and de Groot, B. L. (2006). Does CO2 permeate through aquaporin-1? Biophys. J. 91, 842–848. doi: 10.1529/biophysj.106.081406
Hub, J. S., Winkler, F. K., Merrick, M., and de Groot, B. L. (2010). Potentials of mean force and permeabilities for carbon dioxide, ammonia, and water flux across a Rhesus protein channel and lipid membranes. J. Am. Chem. Soc. 132, 13251–13263. doi: 10.1021/ja102133x
Itada, N., and Forster, R. E. (1977). Carbonic anhydrase activity in intact red blood cells measured with 18O exchange. J. Biol. Chem. 252, 3881–3890.
Itel, F., Al-Samir, S., Öberg, F., Chami, M., Kumar, M., Supuran, C. T., et al. (2012). CO2 permeability of cell membranes is regulated by membrane cholesterol and protein gas channels. FASEB J. 26, 5182–5191. doi: 10.1096/fj.12-209916
Ivanov, I. I., Fedorov, G. E., Gus'kova, R. A., Ivanov, K. I., and Rubin, A. B. (2004). Permeability of lipid membranes to dioxygen. Biochem. Biophys. Res. Commun. 322, 746–750. doi: 10.1016/j.bbrc.2004.07.187
Jacobs, M. H. (1920a). To what extent are the physiological effects of carbon dioxide due to hydrogen ions? Am. J. Physiol. 51, 321–331.
Jacobs, M. H. (1920b). The production of intracellular acidity by neutral and alkaline solutions containing carbon dioxide. Am. J. Physiol. 53, 457–463.
Jacobs, M. H. (1922). The influence of ammonium salts on cell reaction. J. Gen. Physiol. 5, 181–188. doi: 10.1085/jgp.5.2.181
Kawashiro, T., and Scheid, P. (1976). Measurement of Krogh's diffusion constant of CO2 in respiring muscle at various CO2 levels: evidence for facilitated diffusion. Pflügers Arch. 362, 127–133. doi: 10.1007/BF00583638
Kikeri, D., Sun, A., Zeidel, M. L., and Hebert, S. C. (1989). Cell membranes impermeable to NH3. Nature 339, 478–480. doi: 10.1038/339478a0
Kleinzeller, A. (1997). Ernest Overton's contribution to the cell membrane concept: a centennial appreciation. News Physiol. Sci. 12, 49–53.
Kutchai, H. (1975). Role of the red cell membrane in oxygen uptake. Respir. Physiol. 23, 121–132. doi: 10.1016/0034-5687(75)90076-6
Landau, L. D., and Lifschitz, E. M. (1991). Lehrbuch der Theoretischen Physik. Band VI, Hydrodynamik. 5. Auflage. Berlin: Akademie-Verlag.
Lawrence, J. H., Loomis, W. F., Tobias, C. A., and Turpin, F. H. (1946). Preliminary observations on the narcotic effect of xenon with a review of values for solubilities of gases in water and oils. J. Physiol. 105, 197–204.
Matsuzaki, T., Hata, H., Ozawa, H., and Takata, K. (2009). Immunohistochemical localization of the aquaporins AQP1, AQP3, AQP4, and AQP5 in the mouse respiratory system. Acta Histochem. Cytochem. 42, 159–169. doi: 10.1267/ahc.09023
Meyer zu Düttingdorf, H., Sallmann, H., Glockenthör, U., von Engelhardt, W., and Busche, R. (1999). Isolation and lipid composition of apical and basolateral membranes of colonic segments of guinea pig. Anal. Biochem. 269, 45–53. doi: 10.1006/abio.1998.3075
Mills, G. A., and Urey, H. C. (1940). The kinetics of isotopic exchange between carbon dioxide, bicarbonate ion, carbonate ion and water. J. Am. Chem. Soc. 62, 1019–1026. doi: 10.1021/ja01862a010
Missner, A., Kügler, P., Saparov, S. M., Sommer, K., Mathai, J. C., Zeidel, M. L., et al. (2008). Carbon dioxide transport through membranes. J. Biol. Chem. 283, 25340–25347. doi: 10.1074/jbc.M800096200
Missner, A., and Pohl, P. (2009). 110 years of the Meyer-Overton rule: predicting membrane permeability of gases and other small compounds. Chemphyschem 10, 1405–1414. doi: 10.1002/cphc.200900270
Möller, M., Botti, H., Batthyany, C., Rubbo, H., Radi, R., and Denicola, A. (2005). Direct measurement of nitric oxide and oxygen partitioning into liposomes and low density lipoprotein. J. Biol. Chem. 280, 8850–8854. doi: 10.1074/jbc.M413699200
Musa-Aziz, R., Chen, L. M., Pelletier, M. F., and Boron, W. F. (2009). Relative CO2/NH3 selectivities of AQP1, AQP4, AQP5, AmtB, and RhAG. Proc. Natl. Acad. Sci. U.S.A. 106, 5406–5411. doi: 10.1073/pnas.0813231106
Nakhoul, N. L., Davis, B. A., Romero, M. F., and Boron, W. F. (1998). Effect of expressing the water channel aquaporin-1 on the CO2 permeability of Xenopus oocytes. Am. J. Physiol. 274, C543–C548.
Overton, E. (1895). Über die osmotischen Eigenschaften der lebenden Pflanzen- und Tierzelle. Vierteljahrsschr. Naturforsch. Ges. Zürich 40, 159–201.
Overton, E. (1896). Über die osmotischen Eigenschaften der Zelle in ihrer Bedeutung für die Toxikologie und Pharmakologie. Vierteljahrsschr. Naturforsch. Ges. Zürich 41, 383–406.
Overton, E. (1899). Über die allgemeinen osmotischen Eigenschaften der Zelle, ihre vermutlichen Ursachen und ihre Bedeutung für die Physiologie. Vierteljahrssch. Naturforsch. Ges. Zürich 44, 88–114.
Pfaller, W., Gstraunthaler, G., Kersting, U., and Oberleithner, H. (1989). Carbonic anhydrase activity in Madin Darby canine kidney cells. Evidence for intercalated cell properties. Ren. Physiol. Biochem. 12, 328–337.
Prasad, G. V., Coury, L. A., Finn, F., and Zeidel, M. L. (1998). Reconstituted aquaporin 1 water channels transport CO2 across membranes. J. Biol. Chem. 273, 33123–33126. doi: 10.1074/jbc.273.50.33123
Ripoche, P., Bertrand, O., Gane, P., Birkenmeier, C., Colin, Y., and Cartron, J. P. (2004). Human Rhesus-associated glycoprotein mediates facilitated transport of NH3 into red blood cells. Proc. Natl. Acad. Sci. U.S.A. 101, 17222–17227. doi: 10.1073/pnas.0403704101
Roughton, F. J., and Forster, R. E. (1957). Relative importance of diffusion and chemical reaction rates in determining rate of exchange of gases in the human lung, with special reference to true diffusing capacity of pulmonary membrane and volume of blood in the lung capillaries. J. Appl. Physiol. 11, 290–302.
Roughton, F. J. W. (1959). Diffusion and simultaneous reaction velocity in hemoglobin solutions and red cell suspensions. Progr. Biophys. Chem. 9, 55–104.
Sakai, H., Sato, A., Masuda, K., Takeoka, S., and Tsuchida, E. (2008). Encapsulation of concentrated hemoglobin solution in phospholipid vesicles retards the reaction with NO, but not CO, by intracellular diffusion barrier. J. Biol. Chem. 283, 1508–1517. doi: 10.1074/jbc.M707660200
Schuster, K. D. (1987). Diffusion limitation and limitation by chemical reactions during alveolar-capillary transfer of oxygen-labeled CO2. Respir. Physiol. 67, 13–22. doi: 10.1016/0034-5687(87)90003-X
Simon, S. A., and Gutknecht, J. (1980). Solubility of carbon dioxide in lipid bilayer membranes and organic solvents. Biochim. Biophys. Acta 596, 352–358. doi: 10.1016/0005-2736(80)90122-4
Snedden, W., Ledez, K., and Manson, H. J. (1996). A new method for the measurement of gas solubility. J. Appl. Physiol. 80, 1371–1378.
Somersalo, E., Occhipinti, R., Boron, W. F., and Calvetti, D. (2012). A reaction-diffusion model of CO2 influx into an oocyte. J. Theor. Biol. 309, 185–203. doi: 10.1016/j.jtbi.2012.06.016
Subczynski, W. K., Hopwood, L. E., and Hyde, J. S. (1992). Is the mammalian cell plasma membrane a barrier to oxygen transport? J. Gen. Physiol. 100, 69–87. doi: 10.1085/jgp.100.1.69
Swenson, E. R., Deem, S., Kerr, M. E., and Bidani, A. (2002). Inhibition of aquaporin-mediated CO2 diffusion and voltage-gated H+ channels by zinc does not alter rabbit lung CO2 and NO excretion. Clin. Sci. (Lond). 103, 567–575.
Thews, G. (1960). Ein Verfahren zur Bestimmung des O2-Diffusionskoeffizienten, der O2-Leitfähigkeit und des O2-Löslichkeitskoeffizienten im Gehirngewebe. Pflügers Arch. 271, 227–244. doi: 10.1007/BF00363006
Uehlein, N., Lovisolo, C., Siefritz, F., and Kaldenhoff, R. (2003). The tobacco aquaporin NtAQP-1 is a membrane CO2 pore with physiological functions. Nature 425, 734–737. doi: 10.1038/nature02027
Uehlein, N., Otto, B., Eilingsfeld, A., Itel, F., Meier, W., and Kaldenhoff, R. (2012). Gas-tight triblock-copolymer membranes are converted to CO2 permeable by insertion of plant aquaporins. Sci Rep. 2:538. doi: 10.1038/srep00538
Verkman, A. S. (1998). Role of aquaporin water channels in kidney and lung. Am. J. Med. Sci. 316, 310–320. doi: 10.1097/00000441-199811000-00004
Voter, W. A., and Gayeski, T. E. (1995). Determination of myoglobin saturation of frozen specimens using a reflecting cryospectrophotometer. Am. J. Physiol. 269, H1328–H1341.
Waisbren, S. J., Geibel, J. P., Modlin, I. M., and Boron, W. F. (1994). Unusual permeability properties of gastric gland cells. Nature 368, 332–335. doi: 10.1038/368332a0
Wang, Y., Cohen, J., Boron, W. F., Schulten, K., and Tajkhorshid, E. (2007). Exploring gas permeability of cellular membranes and membrane channels with molecular dynamics. J. Struct. Biol. 157, 534–544. doi: 10.1016/j.jsb.2006.11.008
Wang, Y., and Tajkhorshid, E. (2010). Nitric oxide conduction by the brain aquaporin AQP4. Proteins 78, 661–670. doi: 10.1002/prot.22595
Widomska, J., Raguz, M., and Subczynski, W. K. (2007). Oxygen permeability of the lipid bilayer membrane made of calf lens lipids. Biochim. Biophys. Acta 1768, 2635–2645. doi: 10.1016/j.bbamem.2007.06.018
Wistrand, P. J. (1981). The importance of carbonic anhydrase B and C for the unloading of CO2 by the human erythrocyte. Acta Physiol. Scand. 113, 417–426. doi: 10.1111/j.1748-1716.1981.tb06918.x
Wunder, M. A., Böllert, P., and Gros, G. (1998). Mathematical modelling of the role of intra- and extracellular activity of carbonic anhydrase and membrane permeabilities of HCO−3, H2O and CO2 in 18O exchange. Isotopes Environ. Health Stud. 34, 197–205. doi: 10.1080/10256019808036371
Wunder, M. A., and Gros, G. (1998). 18O exchange in suspensions of red blood cells: determination of parameters of mass spectrometer inlet system. Isotopes Environ. Health Stud. 34, 303–310. doi: 10.1080/10256019808234064
Wunder, M., and Gros, G. (1997). Influence of membrane permeabilities for CO2, H2O and HCO−3 on O-18 exchange in suspensions of red cells. Pflügers Arch. Eur. J. Physiol. 433(Suppl.), P556.
Yang, B., Fukuda, N., van Hoek, A., Matthay, M. A., Ma, T., and Verkman, A. S. (2000). Carbon dioxide permeability of aquaporin-1 measured in erythrocytes and lung of aquaporin-1 null mice and in reconstituted proteoliposomes. J. Biol. Chem. 275, 2686–2692. doi: 10.1074/jbc.275.4.2686
Zacharia, I. G., and Deen, W. M. (2005). Diffusivity and solubility of nitric oxide in water and saline. Ann. Biomed. Eng. 33, 214–222. doi: 10.1007/s10439-005-8980-9
Zhou, Y., Bouyer, P., and Boron, W. F. (2006). Evidence that AQP1 is a functional CO2 channel in proximal tubules. FASEB J. 20:A1225. (Abstract).
Keywords: carbon dioxide, membrane permeability, gas channels, membrane cholesterol, gas permeation measurements
Citation: Endeward V, Al-Samir S, Itel F and Gros G (2014) How does carbon dioxide permeate cell membranes? A discussion of concepts, results and methods. Front. Physiol. 4:382. doi: 10.3389/fphys.2013.00382
Received: 21 October 2013; Paper pending published: 11 November 2013;
Accepted: 05 December 2013; Published online: 08 January 2014.
Edited by:
Ebbe Boedtkjer, Aarhus University, DenmarkReviewed by:
Luis M. S. Loura, University of Coimbra, PortugalPawel Swietach, Oxford University, UK
Copyright © 2014 Endeward, Al-Samir, Itel and Gros. This is an open-access article distributed under the terms of the Creative Commons Attribution License (CC BY). The use, distribution or reproduction in other forums is permitted, provided the original author(s) or licensor are credited and that the original publication in this journal is cited, in accordance with accepted academic practice. No use, distribution or reproduction is permitted which does not comply with these terms.
*Correspondence: Gerolf Gros, Zentrum Physiologie, Vegetative Physiologie 4220, Medizinische Hochschule Hannover, Carl-Neuberg-Str., 1, 30625 Hannover, Germany e-mail: gros.gerolf@mh-hannover.de