 Dusik Kim
 Jie Liao
 John W. Hanrahan
- 1Department of Physiology, McGill University, Montréal, QC, Canada
- 2McGill University Health Centre Research Institute, Montréal, QC, Canada
The pH of airway epithelial secretions influences bacterial killing and mucus properties and is reduced by acidic pollutants, gastric reflux, and respiratory diseases such as cystic fibrosis (CF). The effect of acute acid loads depends on buffer capacity, however the buffering of airway secretions has not been well characterized. In this work we develop a method for titrating micro-scale (30 μl) volumes and use it to study fluid secreted by the human airway epithelial cell line Calu-3, a widely used model for submucosal gland serous cells. Microtitration curves revealed that HCO−3 is the major buffer. Peak buffer capacity (β) increased from 17 to 28 mM/pH during forskolin stimulation, and was reduced by >50% in fluid secreted by cystic fibrosis transmembrane conductance regulator (CFTR)-deficient Calu-3 monolayers, confirming an important role of CFTR in HCO−3 secretion. Back-titration with NaOH revealed non-volatile buffer capacity due to proteins synthesized and released by the epithelial cells. Lysozyme and mucin concentrations were too low to buffer Calu-3 fluid significantly, however model titrations of porcine gastric mucins at concentrations near the sol-gel transition suggest that mucins may contribute to the buffer capacity of ASL in vivo. We conclude that CFTR-dependent HCO−3 secretion and epithelially-derived proteins are the predominant buffers in Calu-3 secretions.
Introduction
Healthy airway epithelium is covered by a microscopic layer of airway surface liquid (ASL) that is overlaid with patches of mucus. The ASL warms and humidifies inspired air and enables cilia on the epithelial cells to beat and clear mucus and particulates from the lungs. Acidification of the ASL occurs in cystic fibrosis (CF) and other inflammatory diseases including asthma (Hunt et al., 2000), chronic obstructive pulmonary disease (COPD; Kostikas et al., 2002), and acute respiratory distress syndrome (Gessner et al., 2003). The airways may also receive acid loads during gastroesophageal reflux and from acidic pollutants (e.g., fog, sulfur and nitrogen dioxide, sulfuric and nitric acid, chlorine gas and hypochlorous acid), which can lead to cell swelling and intercellular edema when the luminal pH falls below ~6.5 (Holma, 1985). Acidification also increases mucus viscosity (Holma, 1989), nitric oxide levels (Gaston et al., 2006) and sodium channel activity (Garland et al., 2013), reduces ciliary beat frequency (Clary-Meinesz et al., 1998) and bacterial killing (Pezzulo et al., 2012), and may trigger bronchoconstriction and cough (Kollarik et al., 2007). These derangements emphasize the importance of pH in this microscopic compartment.
The impact of an acute acid load on ASL pH depends on its buffer capacity. While there have been extensive studies of other exocrine secretions such as saliva, the pH of which is a determinant of tooth decay (Izutsu, 1981; Bardow et al., 2000; Lamanda et al., 2007), less is known regarding the buffer properties of ASL. The buffer capacity of expectorated sputum from cigarette smokers varies linearly with protein content and is ~6 mM/pH with a typical protein concentration of 10 mg/ml (Holma and Hegg, 1989). However sputum is thought to contain proteins, DNA and other macromolecules at higher concentrations than in gland secretions and ASL bathing the epithelial surface.
Most ASL originates as submucosal gland secretions (Trout et al., 2001). The pH of fluid produced by normal and CF glands is 7.2 and 6.6, respectively (Song et al., 2006). Secretions have also been studied using Calu-3, a human adenocarcinoma cell line widely used as a model for submucosal gland serous cells. Like native glands they secrete Cl−, HCO−3, and macromolecules, however there are conflicting data concerning the dependence of HCO−3 secretion on CFTR. It has been reported that the pH and bicarbonate concentration of Calu-3 secretions are not affected by shRNA knock down of CFTR expression or the CFTR inhibitor GlyH-101 (Garnett et al., 2011), leading to the conclusion that most HCO−3 secretion is mediated by the anion exchanger pendrin (SLC26A4). Another study of Calu-3 under pH stat conditions found a strong dependence of HCO−3 secretion on CFTR expression (Shan et al., 2011, 2012), consistent with previous evidence for CFTR-dependent HCO−3 secretion by Calu-3 cells (Devor et al., 1999; Tamada et al., 2001), primary bronchial cell cultures (Smith and Welsh, 1992) and isolated submucosal glands (Song et al., 2006). However pH-stat conditions require a large basolateral-to-apical HCO−3 gradient which might exaggerate the contribution of CFTR.
The purpose of this study was to develop a microtitration method suitable for small volumes and use it to study the buffer properties of Calu-3 secretions and the CFTR dependence of HCO−3 secretion under non-pH stat conditions i.e., without imposing a transepithelial HCO−3 gradient. We also determined titration curves for individual constituents in the fluid at physiological concentrations to assess their possible contributions to buffer capacity.
Methods and Materials
Solutions
The following solutions were prepared in distilled water immediately before use: 10, 20, 30, 40, and 50 mM NaHCO3; 1 and 10 mM KH2PO4; 0.5, 1, 500, and 1000 μg/ml porcine gastric mucins; 10 and 50 mg/ml bovine serum albumin. Reagents were from Sigma-Aldrich (St. Louis, MO) and were of the highest grade available.
Cell Culture and Collection of Secretions
The parental Calu-3 cell line (ATCC, HTB-55) and a CFTR knockdown Calu-3 cell line (Palmer et al., 2006) were seeded on Transwells® (24 mm diameter, 0.4 μm pore size, 4.67 cm2 culture surface area, Corning) at ~106 cells/cm2. Parental Calu-3 cells were cultured in Eagle's minimum essential medium (EMEM) containing 15% fetal bovine serum (FBS), 1 mM sodium pyruvate and the non-essential amino acids glycine and L-isomers of alanine, asparagine aspartate, glutamate, proline, and serine at the concentrations normally used in MEM (Gibco, Burlington ON). CFTR KD cells were cultured in EMEM containing 7% FBS and 4 μg/ml puromycin. Any fluid that appeared spontaneously on the apical surface of monolayers after 1–2 days was removed to maintain the air interface. The basolateral medium was replaced with fresh medium every 2–3 days. After 2–3 weeks of culture in a humidified 5% CO2 incubator at 37°C, transepithelial resistance measured using an epithelial voltohmmeter (EVOM, World Precision Instruments, Sarasota FL) was >300 Ω cm2. The monolayer surface was rinsed with PBS and the basolateral medium was replaced with fresh Opti-MEM 1 day before assaying secretion. Monolayers were stimulated by adding forskolin (10 μM) to the basolateral medium. To collect secretions, inserts were tilted and the pipetor carefully pressed against the side of the dish to avoid contact with the cells. This manual method has been used previously to collect fluid repeatedly over several days (Shan et al., 2012). Fluid was secreted at a rate of ~40 μL/day for 2–3 days when sampled every 24 h. The constant secretion rate and development of a transepithelial bicarbonate gradient between secretions and basolateral fluid indicate that the sampling method did not cause significant leakage or contamination. Culture media and supplements were from Wisent (St. Bruno QC) except Opti-MEM, which was from Invitrogen (Burlington ON).
Microtitrations
Samples from the apical surface of monolayers or from test solutions were divided into 2 aliquots. One was titrated with 1N HCl, the other with 1N NaOH, and results were combined to generate a complete titration curve. Aliquots (30 μl) of fluid were placed in a polypropylene chamber and mixed continuously using a stir bar which was fabricated from a stainless steel pin and driven by a magnetic stirrer (Figure 1A). Multiple cultures were sampled and pooled if required to obtain sufficient volume for analysis, however measurements were independent; i.e., fluid collected from a monolayer was not included in more than one sample. Ten μl of FC-77 (Sigma, vapor pressure 42 mmHg) was added onto the surface to minimize evaporation. Microtitrations were completed within ~20 min, before evaporation of the FC-77 (~30 min). pH was measured using a micro pH electrode (Orion) positioned in the sample using a micromanipulator. A calibrated Drummond Nanoject II injector, also positioned with a micromanipulator, was used to deliver titrant in steps of 9.24 nl (Figure 1B). The upper surface area covered by FC-77 was 0.177 cm2. The total area of the sample including surfaces in contact with the chamber was 0.684 cm2.
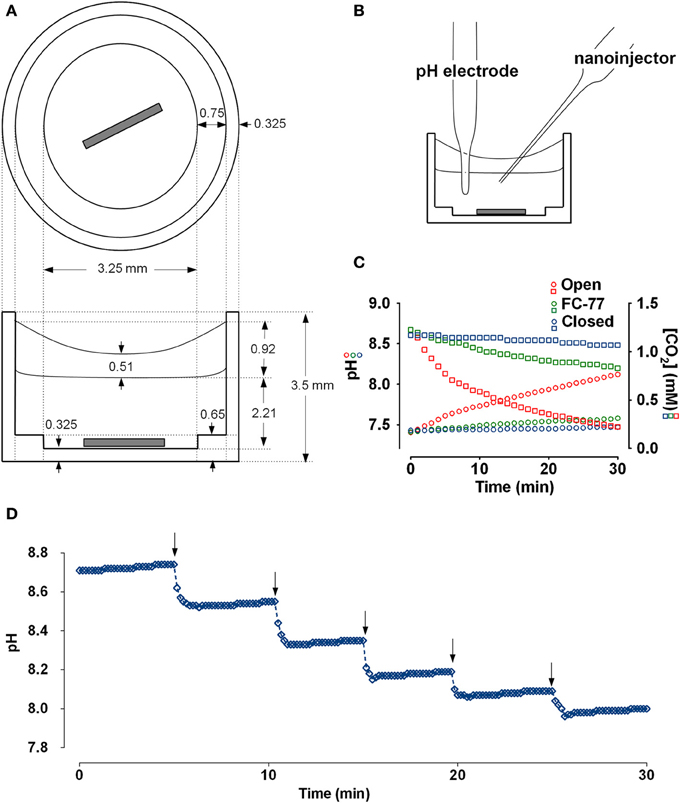
Figure 1. Chamber schematic and characterization of the preparation. (A) Top and side views of the polypropylene chamber. The sample (30 μl) was covered with a layer of FC-77 (10 μl) and stirred continuously. (B) Chamber arranged for microtitration. Micromanipulators holding the pH electrode and nanoinjector are not shown. (C) Measurement of CO2 efflux from the chamber under different conditions. An aliquot of 25 mM NaHCO3 solution (30 μl) that had been equilibrated with 5% CO2 was placed in the chamber and pH was measured at 1 min intervals. The red symbols show the increase in pH (circles) and decline in calculated CO2 concentration (squares) when sample was left open to the air. The green symbols show the pH (circles) and calculated [CO2] when sample was covered with 10 μl perfluorocarbon (FC-77). The blue symbols show the pH (circles) and calculated [CO2] when the chamber was completely immersed in a beaker of paraffin oil. (D) Time course of pH responses during a series of injections of 1N HCl using a Drummond Nanoject II (9.24 nl delivered per injection). pH stabilized within 1 min after adding titrant to the sample of Calu-3 secretions (30μl).
To measure CO2 efflux, 30 μl of 25 mM NaHCO3 solution that had been pre-equilibrated with 5% CO2 was placed in the chamber along with the stirring pin, pH electrode, and nanoinjector syringe. CO2 loss was monitored by measuring the pH at 1 min intervals with continuous stirring. CO2 concentration was calculated using the Henderson-Hasselbalch equation by assuming equilibration and a CO2 solubility coefficient of 0.03 mM/mmHg. The time course of pH and calculated dissolved [CO2] under different conditions are shown in Figure 1C. During the first 5 min, 13.8 nmoles of CO2 were lost from the sample (red squares). The first 6 data points (at t = 0, 1, 2, 3, 4, 5 min) were used to calculate the initial rate of CO2 efflux from the sample. With an initial PCO2 gradient between the sample and atmosphere of 40.75 mmHg and total sample area of 0.6842 cm2, we calculated a CO2 permeability constant for the system of 0.167 × 10⁻⁶ cc at standard temperature and pressure/cm2/s/10 mmHg. Based on the published permeability constant for polypropylene (9.2 × 10⁻⁹ cc @ STP/cm2/mm/s/10 mmHg) this suggests that ~8.4% of the CO2 efflux occurred through the walls of the polypropylene chamber and the other 91.6% escaped from the top surface of the sample. The same procedure was repeated after covering the sample with a layer of 10 μl FC-77. The initial rate of decline of the CO2 was greatly reduced with the perfluorocarbon (PFC) layer and appeared more linear (green squares in Figure 1C), therefore we used the first 12 points to calculate the initial CO2 efflux rate and obtained a permeability constant of 2.78 × 10⁻⁸ cc @ STP/cm2/s/10 mmHg; i.e., 16.6% of the CO2 permeability of the open chamber. Thus the layer of FC-77 reduced the rate of CO2 loss by ~83%. Finally, the chamber, pH electrode, and nanoinjector syringe were all submerged in a beaker of paraffin oil and the rise in pH was again measured at 1 min intervals with stirring. Under these conditions the pH increased by ~0.1 units after 0.5 h and the calculated CO2 concentration declined by 9.36%. All the points were used to calculate the rate, which yielded the permeability constant 0.686 × 10⁻⁸ cc @ STP/cm2/s/10 mmHg, or 24.3-fold lower than when the chamber was open. These measurements of CO2 permeability indicate the microtitration system is ~6-fold closer to a closed than an open system. This was further confirmed by comparing microtitration curves for a pure 20 mM HCO−3 solution with those obtained by macroscopic titration under a layer of paraffin, or when bubbled with air without paraffin oil (i.e., closed vs. open system; see below and Figure 2C).
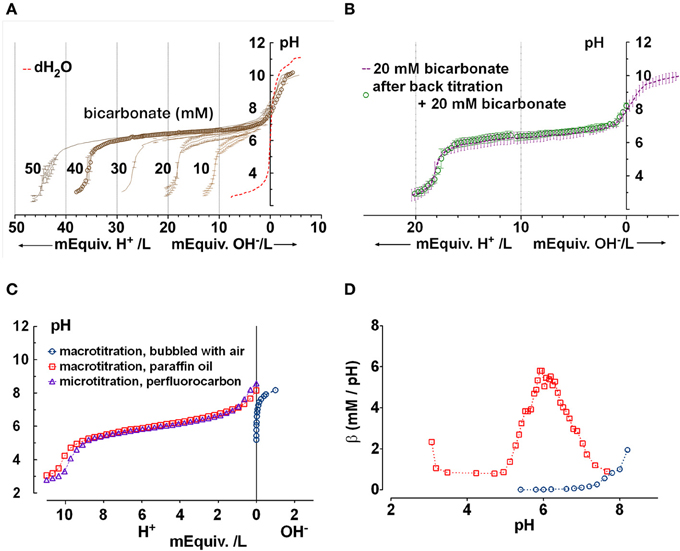
Figure 2. Confirmation that the chamber approximates a closed system for CO2/HCO−3. (A) Microtitration curves obtained for pure solutions having sodium HCO−3 concentrations between 10 and 50 mM. Unbuffered water is shown for comparison (dashed red line). Means ± SD, n = 3–5. (B) Reproducibility of microtitrations. A sample of 20 mM HCO−3 solution was microtitrated with HCl, neutralized using NaOH, supplemented with 20 mM HCO−3 by injection of concentrated HCO−3 solution, and re-titrated. The second titration curve (open circles) was within the standard deviation of the initial curve. Means ± SD, n = 3–5. (C) Comparison of (Δ) microtitration curve for 10 mM NaHCO3 solution when samples are covered by perfluorocarbon and ( ) macrotitration of the same solution performed in a closed under paraffin oil. Also shown is a titration curve for water titrated with NaOH in an open system (
 , i.e., vigorously bubbled with air). The microtitration results resemble those obtained by macrotitration under paraffin oil (i.e., a closed system). (D) equilibrium buffer capacity calculated over a similar pH range from macroscopic titrations under open (, bubbled with air) vs. closed conditions (, under paraffin oil).
CO2 or HCO−3 concentration was calculated using the Henderson-Hasselbalch equation:
where pH and pK have their usual meanings, s is the solubility of CO2, and PCO2 is the partial pressure of CO2 above the sample. Buffer capacity (or buffer value) β was calculated as a function of pH using the slope of the microtitration curve; i.e., the first derivative
where ΔC is the increase in H+ or OH− concentration in the sample and ΔpH is the resulting pH change (Van Slyke, 1922). Buffer capacity in a closed system is
where [TB] is the total buffer concentration and K is the equilibrium constant. When plotted as a function of pH this expression yields a bell shaped curve with a peak buffer capacity of 0.58·[HCO−3]. In an open system, β simplifies to
and is predicted to increase exponentially with pH (Roos and Boron, 1981).
pH was measured ~1 min after the addition of titrant by which time the pH was stable as illustrated in Figure 1D, which shows the titration of Calu-3 fluid using a longer time interval (5 min) between acid injections. Adding the carbonic anhydrase inhibitor acetazolamide (100 μM) to samples did not affect the rate of pH equilibration noticeably (data not shown) and previous proteomics studies have not detected carbonic anhydrase in airway secretions (Candiano et al., 2007). Thus CO2 hydration and dehydration reactions during microtitrations probably occurred at their uncatalyzed rates.
Composition of Secreted Fluid
Secretions from stimulated Calu-3 monolayers and basolateral medium were analyzed for electrolytes using a Beckman Coulter UniCel DxC 800 Synchron Clinical System (see Supplementary Materials for details). Anion gap (AGAP) was calculated as (Na+ + K+ + 2Ca2+ + 2Mg2+) – (Cl− + HCO−3) to check for metabolic acid production. Total protein was measured using the Bradford assay. Lysozyme was quantified using an Enzyme-Linked Immunosorbent Assay (ELISA) kit according to the manufacturer's protocol (Biomedical Technologies Inc., Stoughton, MA).
Immunoblotting
Samples were subjected to SDS-PAGE on 12% gels. Proteins were transferred to nitrocellulose membranes (Luo et al., 2009) and probed with sheep anti-human lysozyme antibody (1:100; Biomedical Technologies, Inc.). Blots were washed, incubated with a secondary antibody that had been conjugated to horseradish peroxidise (1:1000) and visualized by enhanced chemiluminescence (Amersham Biosciences, Baie d'Urfé, QC). Blots were scanned and analyzed using ImageJ (Rasband, 2011).
Statistics
Transepithelial ion concentration gradients and differences in volatile buffer concentration were evaluated using Student's unpaired t-tests, with p < 0.05 considered significant.
Results
Microtitration of Pure HCO−3 Solutions Suggest a Closed System
We began by determining microtitration curves using known HCO−3 concentrations as standards, to confirm that the titration conditions approximate a closed system in which CO2 remains in solution rather than an open system, which allows CO2 equilibration with the air.
Microtitration of pure solutions containing 0, 10, 20, 30, 40, and 50 mM HCO−3 yielded the series of curves shown in Figure 2A. The apparent pKa (6.34 ± 0.14) was higher than the usual value quoted of 6.1, which may be due to finite CO2 leakage and/or low ionic strength (0.01–0.05 M vs. the standard 0.15 M). Nevertheless, the results were reproducible as demonstrated when the forward microtitration was repeated using the same sample after it had been alkalinized with NaOH and 20 mM HCO−3 had been restored by injection of ~600 nl of 1 M NaHCO3 solution. This procedure, which increased the 30 μl volume by 2%, yielded data points within the standard error of the original curve (Figure 2B).
To further confirm that the microtitration preparation approximates a closed system, we compared the microtitration of 10 mM NaHCO3 with macroscopic titrations performed under paraffin oil (i.e., in a closed system), or without oil while vigorously bubbling with air (open system; Figure 2C). The microtitration curve closely resembled the macroscopic curve obtained under paraffin oil (i.e., the closed system). When the slope of the titration curve was calculated at different pHs using a 5 point window, the peak β under paraffin oil was 6.4 mM/pH, in reasonable agreement with the theoretical buffer capacity for a perfectly closed system (5.8 mM/pH) (Figure 2D). When the macroscopic titration was performed by the stepwise addition of NaOH to water with vigorous bubbling, the β calculated after equilibration with prolonged aeration increased exponentially. These results confirm that the microtitration conditions approximate those for a closed system.
Buffer Capacity of Calu-3 Secretions Under Basal and cAMP-Stimulated Conditions
Figure 3A shows mean titration curves obtained for fluid secreted by parental Calu-3 monolayers under basal conditions (DMSO vehicle control) and during stimulation by 10 μM forskolin. Control curves without buffer (distilled water, dashed red line) are also shown for comparison. Secretions initially had high pH (8.9 ± 0.3, n = 4) when placed in the chamber, indicating partial equilibration with the low PCO2 of room air. The initial pH of distilled water was moderately acidic (pH 6) as expected. Inspection of the curves indicates that most buffering of the secreted fluid occurred in the range pH 6–8. When inflection points were determined using Prism 5 software, the fluid from unstimulated Calu-3 cells was most strongly buffered between pH 7.64 and 6.01, the two nearest stationary points in the second derivative curve. Within this range β was 13 ± 7 mM/pH (n = 4).
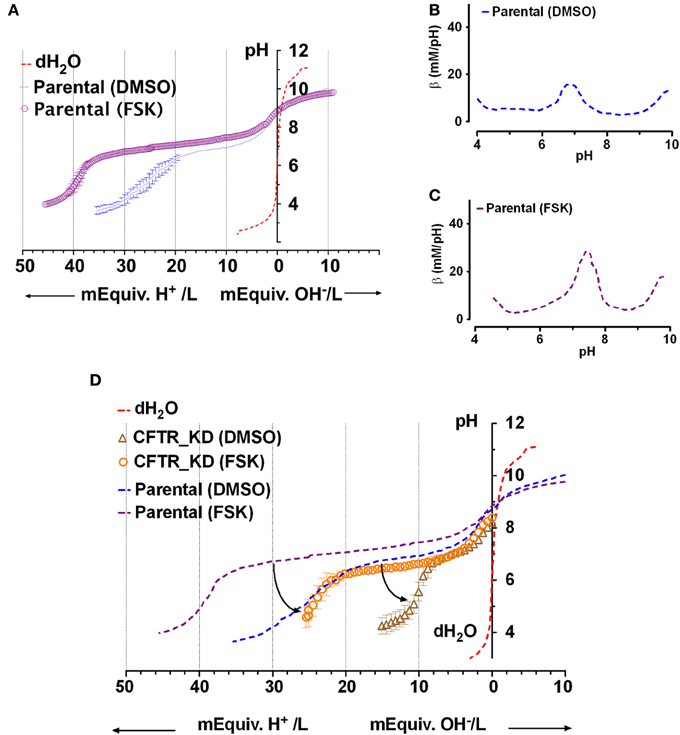
Figure 3. Titration curves for Calu-3 secretions. (A) Microtitration of fluid produced by parental Calu-3 cell monolayers under basal conditions ( , treated with DMSO vehicle) and during stimulation by 10 μM forskolin (
 ). Dotted line shows the control curve obtained with distilled water. HCl and NaOH were the titrants and were added in increments of 0.4 mM final concentration. Means ± SD, n = 4–5. (B,C) Mean buffer capacity β for fluid from unstimulated (DMSO) and forskolin (FSK) stimulated Calu-3 secretions, respectively, calculated from (A). (D) Effect of CFTR knockdown on the titration curves obtained under basal conditions (DMSO) and during forskolin stimulation (FSK). Curved arrows show the impact of CFTR on buffering of Calu-3 secretions.
Forskolin stimulation increased the buffer capacity to 24 ± 5 mM/pH (n = 4). Figures 3B,C compare the mean β as a function of pH for unstimulated vs. forskolin-stimulated monolayers, respectively. β displayed a central peak under both conditions, which was ~0.5 units more alkaline than the pKa for pure HCO−3 solutions. Comparison of Figures 3A and 2A suggests that forskolin stimulation raises the HCO−3 concentration of Calu-3 secretions from ~24 to 44 mM and may cause the release of another buffer.
Effect of CFTR Knockdown on the Buffer Capacity of Secretions
To assess the role of CFTR in HCO−3 secretion, microtitrations were performed using fluid from CFTR knockdown cells ± forskolin (Figure 3D). Secretions from CFTR KD cells (pH 8.2 ± 0.5, n = 3) were less alkaline than from control cells (8.9 ± 0.3), and β between pH 6.4 and 7.6 (the stationary points of the second derivative curve) was reduced to 5 ± 1 mM/pH. Forskolin still increased β more than 2-fold to 11 ± 4 mM/pH in secretions from CFTR KD cells, presumably due to stimulation of residual CFTR that was expressed despite shRNA knockdown (<5% of parental cells). HCO−3 concentration was reduced by more than half compared to the fluid secreted by parental cells, ranging from 10 mM under basal conditions to 25 mM during forskolin stimulation. These results indicate that CFTR plays a major role in HCO−3 secretion by Calu-3 cells under these non-pH stat conditions.
Evidence for Other Buffers
To confirm that most buffering of Calu-3 secretions was due to HCO−3 and test for the presence of non-HCO−3 buffers, Calu-3 fluid was collected, titrated to pH 4 with HCl, equilibrated with room air CO2 for 1 h to release any CO2 generated, then back titrated to the starting pH with NaOH (Figure 4A). Approximately 3-fold more acid than base equivalents were consumed during the forward and back titrations, respectively, and the large peak in β near pH 6 during the forward titration was absent from the back titration curve (Figure 4B, Table 2). The β attributable to non-volatile buffers had a U-shaped dependence on pH and was lowest near the pKa for carbonic acid.
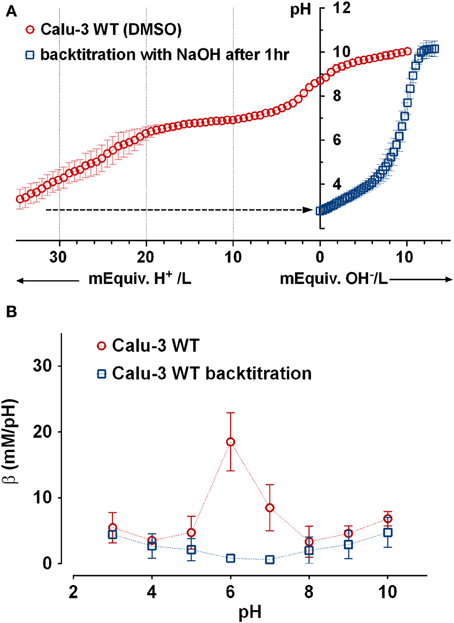
Figure 4. Evidence for a non-bicarbonate buffer in Calu-3 fluid. (A) Forward and back titration curves for Calu-3 secretions. Samples were equilibrated with air for 1 h at pH < 4 after the forward titration to drive off CO2. (B) Buffer capacity as a function of pH calculated from the forward ( ) and back (
 ) titrations. Means ± SD; n = 3–5.
Composition of the Secretions
Secretions were analyzed for electrolytes and metabolic acid production. Sodium, potassium, chloride, HCO−3, albumin, calcium, magnesium, and total protein were measured in Calu-3 secretions and are shown in Table 1 along with the calculated anion gap ([Na+] + [K+] + 2[Ca2+] +2[Mg2+]) − ([Cl−] + [HCO−3]) for comparison with the basolateral medium. Chemical analyses yielded a lower HCO−3 concentration (35.7 mM) than did microtitrations (44.6 mM), nevertheless the [HCO−3] was >2.5-fold higher in secretions than in the basolateral medium, and this elevation was partially offset by lower apical [Cl−]. K+ and Mg2+ were lower in the secretions whereas Ca2+ was slightly higher. Forskolin stimulation for 24 h did not alter the basolateral composition significantly or cause a large increase in the anion gap, therefore a high rate of secretion did not result in the production of large amounts of metabolic acid. To examine their potential contributions to β, microtitrations were also performed using individual components at concentrations relevant to Calu-3 fluid or reported for ASL in vivo.
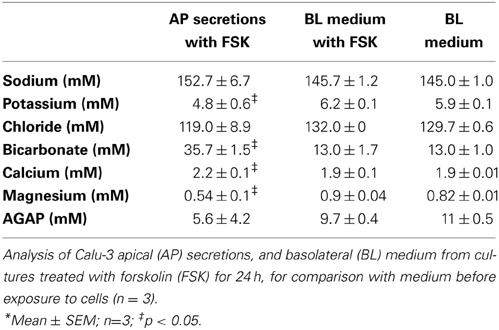
Table 1. Analysis of Calu-3 secretions and basolateral media*.
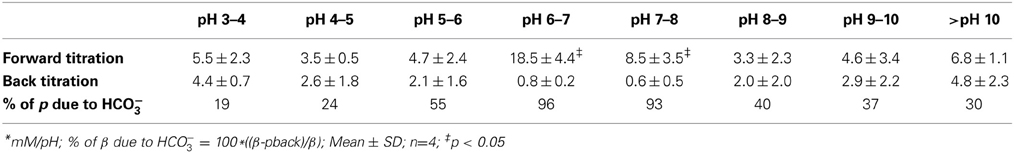
Table 2. pH-dependent buffer capacity (β) of forskolin-stimulated Calu-3 secretions before and after neutralizing bicarbonate*.
Phosphate
Although the PO=4 concentration in Calu-3 secretions was below the detection limit of the Beckman Coulter UniCel DxC 800 Synchron Clinical System, millimolar PO=4 levels have been measured in mouse ASL using capillary electrophoresis (1.9 mM; Govindaraju et al., 1997). Therefore we performed microtitrations to assess the possible impact of 1 and 10 mM KH2PO4 on Calu-3 fluid. The three pKas of phosphoric acid were easily resolved with 10 mM KH2PO4 solution (Figure 5A). The buffer capacity of 10 mM PO=4 between pH 7.56 and 5.53 was 5.1 ± 1.4 mM/pH (n = 4). However β could not be measured accurately with 1 mM KH2PO4 solution. Since the β for 10 mM PO=4 solution was low compared to Calu-3 secretions under closed conditions, its contribution in the ASL would also be small relative to HCO−3.
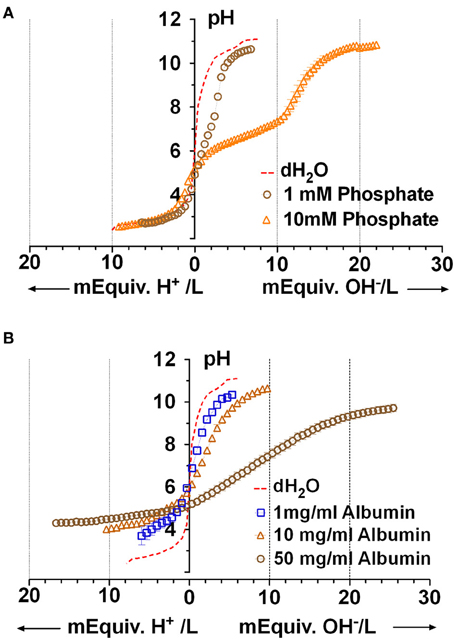
Figure 5. Microtitration curves for phosphate and albumin at relevant concentrations. (A) Curves obtained with 1 and 10 mM phosphate solutions. Dashed red line shows results with distilled water. (B) Microtitration curves obtained with albumin. Means ± SD; n = 4.
Proteins
Protein is released into the airway lumen passively (exudates), by transepithelial transport (Webber and Widdicombe, 1989), and can be synthesized and released by submucosal gland acinar cells (Jacquot et al., 1988). Airway secretions, which were reported to contain “albumin-like protein” (Jacquot et al., 1988), have more recently been found to comprise ~175 proteins. To estimate the buffer capacity that may be mediated by proteins we used albumin as a model protein. Using the Bradford assay we measured 7.4 ± 2.3 mg protein/ml in Calu-3 secretions under basal conditions and 5.8 ± 1.5 mg/ml during forskolin stimulation (means ± S.E., n = 5). Forskolin stimulated the rate of fluid secretion rate by ~8-fold and reduced the protein concentration in secretions by 22%, suggesting a >7-fold stimulation of protein secretion. Microtitration of 1, 10, and 50 mg/ml albumin solutions revealed buffering over a wide range which was strongest at extreme pH; i.e., below pH 5 (β = 10.6 ± 4.4 mM/pH with 50 mg/ml, n = 4) and above pH 9 (β = 3.9 ± 1.1 mM/pH, n = 4 with 50 mg/ml; Figure 5B).
Lysozyme
Lysozyme is produced by submucosal glands and by Calu-3 cells, and it is relatively abundant in ASL (Duszyk, 2001; Dubin et al., 2004; Joo et al., 2004) and has maximal β near pH 4 (Olthuis et al., 1994). Immunoblots confirmed that both parental and CFTR KD Calu-3 cells release lysozyme (Figure 6A). ELISAs revealed a 30% increase in the lysozyme concentration in secretions from parental Calu-3 cells (control 31 ± 1.1 ng/ml, forskolin 43 ± 3.2 ng/ml; p < 0.05, n = 3; Figure 6B). As shown above for total protein, these results imply a 10.4-fold increase in total lysozyme release during stimulation. Although lysozyme concentration is too low to buffer Calu-3 fluid significantly, there are 32 ionizable groups per lysozyme molecule and >2000-fold higher concentrations are expected in vivo, therefore we tested solutions that contained up to 250 μg/ml. Lysozyme did not buffer significantly at the highest concentration after it had been desalted to remove sodium acetate (cutoff Mr = 2 kD, lysozyme Mr = 14.6 kD) to (Figure 6C). These results indicate that lysozyme contributes little to the buffer capacity of Calu-3 secretions or ASL in vivo.
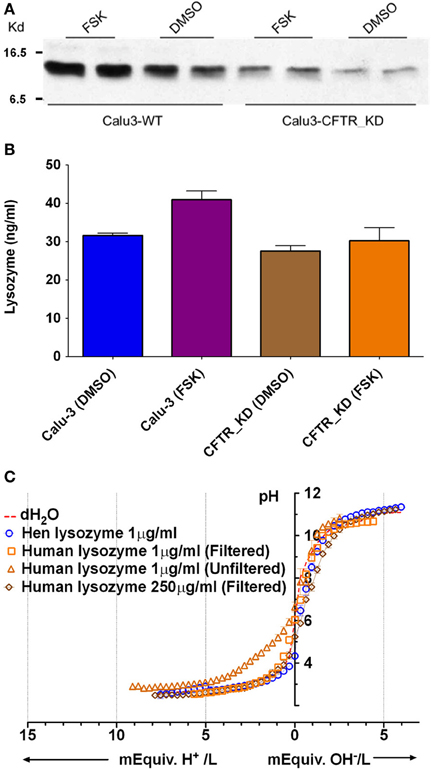
Figure 6. Lysozyme expression and buffer capacity in pure solutions. (A) Immunoblot probed with anti-lysozyme antibody in duplicate samples from control Calu-3 and Calu-3 CFTR KD secretions under basal conditions and during forskolin stimulation. (B) Quantitation of lysozyme by ELISA under each condition shown in (A). Data are means ± SD; n = 3. (C) Titration curves for lysozyme solutions (n = 4). Dotted line also shows the pH of distilled water as a reference (unbuffered). Some aliquots of lysozyme were desalted by filtration to remove sodium acetate.
Mucins
Mucins are produced by submucosal glands and also by Calu-3 cells (Dubin et al., 2004; Kreda et al., 2007; Lesimple et al., 2013). Unstimulated Calu-3 cells secrete these acidic glycoproteins at a rate of ~300 ng/cm2 per day (Dubin et al., 2004) and fluid at the rate of ~7.5 μl/cm2 day, which together predict a final concentration of ~40 μg/ml. We performed microtitrations with porcine gastric mucins, which are similar to those secreted by the airways. MUC5AC is the most abundant isoform pig gastric mucin, followed by MUC2, MUC5B, and MUC6 (Caldara et al., 2012). Porcine gastric mucins did not buffer significantly at concentrations up to 1 mg/ml (Figure 7A), therefore mucins apparently contribute little to the buffer capacity of Calu-3 secretions. However in vivo the airway mucus is typically 2–3% solids (20–30 mg/ml), and dissolved mucins may reach ~12 mg/ml in the periciliary liquid, the concentration at which they undergo a sol-gel transition (McCullagh et al., 1995). When similar high concentrations of pig gastric mucins (e.g., 10 mg/ml) were titrated we obtained a β of ~5 mM/pH. Although mucins contributed little buffer capacity to Calu-3 secretions, these results suggest they may contribute significantly to ASL buffering in vivo.
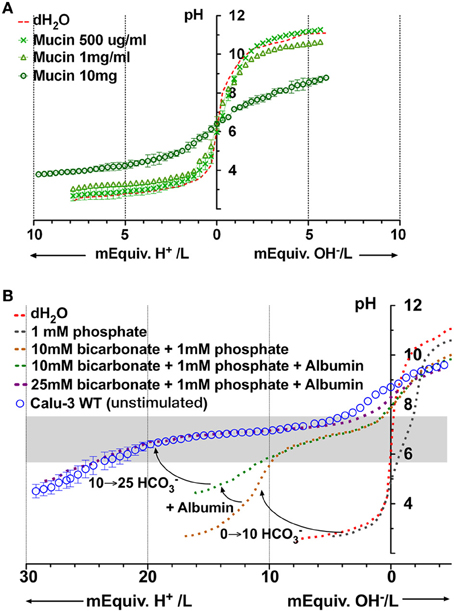
Figure 7. Microtitration curves for porcine gastric mucins and simulation of Calu-3 fluid buffer capacity using individual components. (A) Buffering by different concentrations of mucin. (B) Simulation of Calu-3 by mixtures of PO=4, HCO−3, and albumin. Curved arrows show the effect of adding 10 mM HCO−3, 10 mg/ml albumin, and raising the concentration of HCO−3 to 25 mM. The gray rectangle represents the region between the stationary points of the buffer.
A Model Fluid to Simulate Buffering of Calu-3 Secretions
Based on the preceding results we tried to simulate the titration curve for Calu-3 secretions using defined components. PO=4 contributed minimally to β in Calu-3 secretions but was included to weakly stabilize the pH, facilitating measurement of the control curve. Figure 7B shows the curves obtained for solutions containing PO=4 alone, PO=4 + HCO−3, and PO=4 + HCO−3 + albumin. The combination of 1 mM PO=4 and 10 mM HCO−3 provided insufficient buffering below pH 6 and the shape of the curve was different from that for Calu-3 secretions. However the β at low pH (pH < 6) increased when albumin (10 mg/ml) was added. When [HCO−3] was raised further to 25 mM as estimated in basal Calu-3 secretions, the titration curve for the defined solution closely resembled that for fluid from unstimulated Calu-3 monolayers (Figure 7B). Thus it was possible to mimic the titration curve for Calu-3 fluid with a solution containing HCO−3, albumin, and a low concentration of PO=4. The β between stationary points at pH 7.72 and pH 5.88 for the model solution was 19 ± 2.3 mM/pH (n = 4) and buffering was maximal at pH 7; i.e., near the normal pH of ASL according to most reports (Fischer and Widdicombe, 2006).
Discussion
In this study we developed a method for titrating micro-scale volumes (30 μl) and used it to study fluid secreted by the human airway cell line Calu-3. The assay behaved like a closed system due to a covering layer of PFC, which was necessary to minimize evaporation of the small sample volume. The rate of CO2 diffusion in a related PFC perfluorobutyltetrahydrofurane (FC-80) is ~2500-fold slower than in air (Schoenfisch and Kylstra, 1973). Thus adding a layer of PFC would be expected to slow CO2 efflux from the sample, and this was observed experimentally.
CO2 solubility is 3-fold higher in PFC than in water however its CO2 diffusion coefficient is similar in both solvents. High CO2 solubility in PFC would increase the rate of CO2 diffusion from the PFC layer to the atmosphere but would reduce it from the sample into the PFC layer. The steady state efflux of CO2 from the sample would depend on the gradient between the sample and the atmosphere, therefore partitioning into the PFC should have little effect on CO2 loss. Microtitrating pure NaHCO3 solutions yielded β close to the theoretical value for a closed system (0.58 × [total buffer]). The β values for 10, 20, 30, 40, and 50 mM NaHCO3 were 5.7, 13.1, 18.9, 25.3, and 33.2 mM/pH respectively, and the stationary points were 5.2 and 7.2 for all five concentrations. Buffer capacity calculated from control macroscopic titrations followed predictions under both closed and open systems, however pH equilibration was very slow in the open system, perhaps due to the high pH when titrating air-equilibrated bicarbonate solutions. CO2 produced immediately after the addition of HCl may have been converted back to bicarbonate by the relatively fast hydroxylation reaction CO2 + OH− ↔ HCO−3, which would slow CO2 release from the solution despite vigorous bubbling. Computer simulations would be useful for testing this quantitatively.
Lysozyme and mucins contributed little to the buffer capacity of Calu-3 fluid due to their low concentrations, however buffering by proteins was significant. Interestingly, forskolin stimulated fluid secretion rate by ~8-fold whereas protein concentration only declined from 7.4 to 5.8 mg/ml, indicating that cAMP may also stimulate protein secretion by >7-fold. There is longstanding evidence for a protein secretion defect in CF exocrine glands (McPherson et al., 1986), and CFTR deficient Calu-3 cells might be useful for studying the mechanism. Titrations performed with porcine gastric mucins over a range of concentrations suggest that mucins may also buffer ASL significantly in vivo.
HCO−3 is the main pH buffer in blood and many other fluids. Calu-3 cells secrete HCO−3 (Lee et al., 1998; Devor et al., 1999; Shan et al., 2012), and β increased from 13 to 24 mM/pH during forskolin stimulation, consistent with an ~2-fold increase in [HCO−3]. The basal [HCO−3] estimated by microtitration (22.4 mM) was in reasonable agreement with that reported for parental Calu-3 cells under similar conditions (26 mM; Garnett et al., 2011) but lower than a virtual gland preparation in which secretions exit through a small opening that mimics a duct (36 mM; Irokawa et al., 2004). The virtual gland preparation may allow CO2 and HCO−3 to accumulate to higher levels than open Transwells®. The present study suggests that [HCO−3] was increased >2-fold during forskolin stimulation, although they did not reach the levels reported previously (60–74 mM HCO−3). These discrepancies may reflect differences in sample handling or in CFTR expression. Regardless, there is general consensus that secretions are 0.3–0.4 units more alkaline during forskolin stimulation than under basal conditions.
The role of CFTR in HCO−3 secretion by Calu-3 cells is presently under debate (Devor et al., 1999; Garnett et al., 2011; Shan et al., 2012). The present finding that β is reduced by half in CFTR KD fluid indicates that CFTR plays an important role in HCO−3 secretion, and is consistent with the acidic secretions produced by CF glands compared to control glands (Song et al., 2006). However another group found no difference in the pH of secretions produced by CFTR-KD vs. control Calu-3 cells (Garnett et al., 2011). The reason for the different results is not known, but may reflect the higher level of residual CFTR expression in the knockdown cells used in the latter study. Although the CFTR blocker GlyH101 (10 μM) also did not reduce the pH or [HCO−3] of secretions consistent with the CFTR knockdown result, ~45% of the fluid secretion persisted during GlyH101exposure, suggesting CFTR may not have been fully inhibited during the 24 h assay. It has been shown that CFTR inhibition by another antagonist (CFTRinh-172, 5 μM) declines by 50% within the first 6 h during long-term experiments (Perez et al., 2007). In the present study, microtitration of fluid from CFTR KD monolayers indicated that CFTR is important for both basal and forskolin-stimulated HCO−3 secretion, in agreement with pH-stat studies (Shan et al., 2012).
Approximately 175 proteins have been detected in bronchoalveolar lavage fluid and in secretions from epithelial cultures in vitro (Magi et al., 2002; Candiano et al., 2007; Ali et al., 2011). Proteins are significant pH buffers in plasma and other extracellular fluids, therefore we examined their contribution to β in Calu-3 fluid. Calu-3 secretions contained 5–7 mg/ml protein; i.e., ~10% of the concentration in plasma. Since proteins in ASL are numerous and their concentrations are unknown, we used albumin as a generic polypeptide during microtitrations. While this is clearly an oversimplification, it is compatible with the early studies reporting synthesis and release of “albumin-like” protein from submucosal gland acinar cells (Jacquot et al., 1988). Albumin caused significant buffering at 1–10 mg/ml and would contribute to the buffer capacity of ASL, especially at low pH. Secreted mucins are the most abundant luminal glycoproteins and the main constituent of mucus (Rose et al., 1979), comprising 2–3% of the total mass of the mucus gel (20–30 mg/ml). Tethered mucins in brush-like structures may achieve similar concentrations in the periciliary layer (M. Rubinstein, pers. commun.). Microtitration of porcine gastric mucins at concentrations corresponding to the concentration of mucins in Calu-3 secretions suggest their buffering of Calu-3 fluid is negligible. Lysozyme was examined (Dubin et al., 2004; Joo et al., 2004) however its concentration was also too low little to provide significant buffer capacity, in agreement with a previous study (Kuramitsu and Hamaguchi, 1980). Finally, PO=4 was not detected in Calu-3 secretions using our methods, and microtitrations revealed that it would also contribute little to β at in vivo concentrations (Govindaraju et al., 1997). In summary, the present results suggest that HCO−3 and epithelially-derived proteins are the main buffers in Calu-3 secretions.
Conflict of Interest Statement
The authors declare that the research was conducted in the absence of any commercial or financial relationships that could be construed as a potential conflict of interest.
Acknowledgments
We thank Jean-Yves Lapointe (Université de Montréal) for the use of a Drummond Nanoject II injector for preliminary experiments, Melissa Palmer and Scott O'Grady (University of Minnesota) for providing CFTR knockdown cells, and the reviewers for constructive criticism. Dusik Kim and John W. Hanrahan are members of the McGill CF Translational Research centre (CFTRc) and the Groupe d'étude des protéines membranaires (GEPROM). This work was supported by Cystic Fibrosis Canada.
Supplementary Material
The Supplementary Material for this article can be found online at: http://www.frontiersin.org/journal/10.3389/fphys.2014.00188/abstract
References
Ali, M., Lillehoj, E. P., Park, Y., Kyo, Y., and Kim, K. C. (2011). Analysis of the proteome of human airway epithelial secretions. Proteome Sci. 9:4. doi: 10.1186/1477-5956-9-4
Bardow, A., Moe, D., Nyvad, B., and Nauntofte, B. (2000). The buffer capacity and buffer systems of human whole saliva measured without loss of CO2. Arch. Oral Biol. 45, 1–12. doi: 10.1016/S0003-9969(99)00119-3
Caldara, M., Friedlander, R. S., Kavanaugh, N. L., Aizenberg, J., Foster, K. R., and Ribbeck, K. (2012). Mucin biopolymers prevent bacterial aggregation by retaining cells in the free-swimming state. Curr. Biol. 22, 2325–2330. doi: 10.1016/j.cub.2012.10.028
Candiano, G., Bruschi, M., Pedemonte, N., Musante, L., Ravazzolo, R., Liberatori, S., et al. (2007). Proteomic analysis of the airway surface liquid: modulation by proinflammatory cytokines. Am. J. Physiol. Lung Cell. Mol. Physiol. 292, L185–L198. doi: 10.1152/ajplung.00085.2006
Clary-Meinesz, C., Mouroux, J., Cosson, J., Huitorel, P., and Blaive, B. (1998). Influence of external pH on ciliary beat frequency in human bronchi and bronchioles. Eur. Respir. J. 11, 330–333. doi: 10.1183/09031936.98.11020330
Devor, D. C., Singh, A. K., Lambert, L. C., Deluca, A., Frizzell, R. A., and Bridges, R. J. (1999). Bicarbonate and chloride secretion in Calu-3 human airway epithelial cells. J. Gen. Physiol. 113, 743–760. doi: 10.1085/jgp.113.5.743
Dubin, R. F., Robinson, S. K., and Widdicombe, J. H. (2004). Secretion of lactoferrin and lysozyme by cultures of human airway epithelium. Am. J. Physiol. Lung Cell. Mol. Physiol. 286, L750–L755. doi: 10.1152/ajplung.00326.2003
Duszyk, M. (2001). CFTR and lysozyme secretion in human airway epithelial cells. Pflugers Arch. 443(Suppl. 1), S45–S49. doi: 10.1007/s004240100643
Fischer, H., and Widdicombe, J. H. (2006). Mechanisms of acid and base secretion by the airway epithelium. J. Membr. Biol. 211, 139–150. doi: 10.1007/s00232-006-0861-0
Garland, A. L., Walton, W. G., Coakley, R. D., Tan, C. D., Gilmore, R. C., Hobbs, C. A., et al. (2013). Molecular basis for pH-dependent mucosal dehydration in cystic fibrosis airways. Proc. Natl. Acad. Sci. U.S.A. 110, 15973–15978. doi: 10.1073/pnas.1311999110
Garnett, J. P., Hickman, E., Burrows, R., Hegyi, P., Tiszlavicz, L., Cuthbert, A. W., et al. (2011). Novel role for pendrin in orchestrating bicarbonate secretion in CFTR-expressing airway serous cells. J. Biol. Chem. 286, 41069–41082. doi: 10.1074/jbc.M111.266734
Gaston, B., Kelly, R., Urban, P., Liu, L., Henderson, E. M., Doctor, A., et al. (2006). Buffering airway acid decreases exhaled nitric oxide in asthma. J. Allergy Clin. Immunol. 118, 817–822. doi: 10.1016/j.jaci.2006.06.040
Gessner, C., Hammerschmidt, S., Kuhn, H., Seyfarth, H. J., Sack, U., Engelmann, L., et al. (2003). Exhaled breath condensate acidification in acute lung injury. Respir. Med. 97, 1188–1194. doi: 10.1016/S0954-6111(03)00225-7
Govindaraju, K., Cowley, E. A., Eidelman, D. H., and Lloyd, D. K. (1997). Microanalysis of lung airway surface fluid by capillary electrophoresis with conductivity detection. Anal. Chem. 69, 2793–2797. doi: 10.1021/ac961249v
Holma, B. (1985). Influence of buffer capacity and pH-dependent rheological properties of respiratory mucus on health effects due to acidic pollution. Sci. Total Environ. 41, 101–123. doi: 10.1016/0048-9697(85)90181-0
Holma, B. (1989). Effects of inhaled acids on airway mucus and its consequences for health. Environ. Health Perspect. 79, 109–113. doi: 10.1289/ehp.8979109
Holma, B., and Hegg, P. O. (1989). pH- and protein-dependent buffer capacity and viscosity of respiratory mucus. Their interrelationships and influence on health. Sci. Total Environ. 84, 71–82. doi: 10.1016/0048-9697(89)90371-9
Hunt, J. F., Fang, K., Malik, R., Snyder, A., Malhotra, N., Platts-Mills, T. A., et al. (2000). Endogenous airway acidification. Implications for asthma pathophysiology. Am. J. Respir. Crit. Care Med. 161, 694–699. doi: 10.1164/ajrccm.161.3.9911005
Irokawa, T., Krouse, M. E., Joo, N. S., Wu, J. V., and Wine, J. J. (2004). A “virtual gland” method for quantifying epithelial fluid secretion. Am. J. Physiol. 287, L784–L793. doi: 10.1152/ajplung.00124.2004
Izutsu, K. T. (1981). Theory and measurement of the buffer value of bicarbonate in saliva. J. Theor. Biol. 90, 397–403. doi: 10.1016/0022-5193(81)90320-9
Jacquot, J., Goldstein, G., Sommerhoff, C., Benali, R., Puchelle, E., and Basbaum, C. B. (1988). Synthesis and secretion of an albumin-like protein by cultured bovine tracheal gland serous cells. Biochem. Biophys. Res. Commun. 155, 857–862. doi: 10.1016/S0006-291X(88)80574-6
Joo, N. S., Lee, D. J., Winges, K. M., Rustagi, A., and Wine, J. J. (2004). Regulation of antiprotease and antimicrobial protein secretion by airway submucosal gland serous cells. J. Biol. Chem. 279, 38854–38860. doi: 10.1074/jbc.M407077200
Kollarik, M., Ru, F., and Undem, B. J. (2007). Acid-sensitive vagal sensory pathways and cough. Pulm. Pharmacol. Ther. 20, 402–411. doi: 10.1016/j.pupt.2006.11.010
Kostikas, K., Paptheadorou, G., Ganas, K., Psathakis, K., Panagou, P., and Loukides, S. (2002). pH in expired breath condensate of patients with inflammatory airway diseases. Am. J. Respir. Crit. Care Med. 165, 1364–1370. doi: 10.1164/rccm.200111-068OC
Kreda, S. M., Okada, S. F., van Heusden, C. A., O'Neal, W., Gabriel, S., Abdullah, L., et al. (2007). Coordinated release of nucleotides and mucin from human airway epithelial Calu-3 cells. J. Physiol. 584, 245–259. doi: 10.1113/jphysiol.2007.139840
Kuramitsu, S., and Hamaguchi, K. (1980). Analysis of the acid-base titration curve of hen lysozyme. J. Biochem. 87, 1215–1219.
Lamanda, A., Cheaib, Z., Turgut, M. D., and Lussi, A. (2007). Protein buffering in model systems and in whole human saliva. PLoS ONE 2:e263. doi: 10.1371/journal.pone.0000263
Lee, M. C., Penland, C. M., Widdicombe, J. H., and Wine, J. J. (1998). Evidence that Calu-3 human airway cells secrete bicarbonate. Am. J. Physiol. Lung Cell. Mol. Physiol. 274, L450–L453.
Lesimple, P., Goepp, J., Palmer, M. L., Fahrenkrug, S. C., O'Grady, S. M., Ferraro, P., et al. (2013). CFTR is expressed in mucin granules from Calu-3 and primary human airway epithelial cells. Am. J. Respir. Cell Mol. Biol. 49, 511–516. doi: 10.1165/rcmb.2012-0419RC
Luo, Y., McDonald, K., and Hanrahan, J. W. (2009). Trafficking of immature DeltaF508-CFTR to the plasma membrane and its detection by biotinylation. Biochem. J. 419, 211–219. doi: 10.1042/BJ20081869
Magi, B., Bini, L., Perari, M. G., Fossi, A., Sanchez, J. C., Hochstrasser, D., et al. (2002). Bronchoalveolar lavage fluid protein composition in patients with sarcoidosis and idiopathic pulmonary fibrosis: a two-dimensional electrophoretic study. Electrophoresis 23, 3434–3444. doi: 10.1002/1522-2683(200210)23:19<3434::AID-ELPS3434>3.0.CO;2-R
McCullagh, C. M., Jamieson, A. M., Blackwell, J., and Gupta, R. (1995). Viscoelastic properties of human tracheobronchial mucin in aqueous solution. Biopolymers 35, 149–159. doi: 10.1002/bip.360350203
McPherson, M. A., Bradbury, N. A., Dormer, R. L., Dodge, J. A., and Goodchild, M. C. (1986). Defective b-adrenergic secretory responses in submandibular acinar cells from cystic fibrosis patients. Lancet 2, 1007–1008. doi: 10.1016/S0140-6736(86)92616-4
Olthuis, W., Luo, J., and Bergveld, P. (1994). Characterization of proteins by means of their buffer capacity, measured with an ISFET-based coulometric sensor-actuator system. Biosens. Bioelectron. 9, 743–751. doi: 10.1016/0956-5663(94)80073-1
Palmer, M. L., Lee, S. Y., Carlson, D., Fahrenkrug, S., and O'Grady, S. M. (2006). Stable knockdown of CFTR establishes a role for the channel in P2Y receptor-stimulated anion secretion. J. Cell. Physiol. 206, 759–770. doi: 10.1002/jcp.20519
Perez, A., Issler, A. C., Cotton, C. U., Kelley, T. J., Verkman, A. S., and Davis, P. B. (2007). CFTR inhibition mimics the cystic fibrosis inflammatory profile. Am. J. Physiol. Lung Cell. Mol. Physiol. 292, L383–L395. doi: 10.1152/ajplung.00403.2005
Pezzulo, A. A., Tang, X. X., Hoegger, M. J., Alaiwa, M. H., Ramachandran, S., Moninger, T. O., et al. (2012). Reduced airway surface pH impairs bacterial killing in the porcine cystic fibrosis lung. Nature 487, 109–113. doi: 10.1038/nature11130
Rasband, W. S. (2011). ImageJ. Bethesda, MD: National Institutes of Health. Available online at: http://imagej.nih.gov/ij
Rose, M. C., Lynn, W. S., and Kaufman, B. (1979). Resolution of the major components of human lung mucosal gel and their capabilities for reaggregation and gel formation. Biochemistry 18, 4030–4037. doi: 10.1021/bi00585a029
Schoenfisch, W. H., and Kylstra, J. A. (1973). Maximum expiratory flow and estimated CO2 elimination in liquid-ventilated dogs' lungs. J. Appl. Physiol. 35, 117–121.
Shan, J., Huang, J., Liao, J., Robert, R., and Hanrahan, J. W. (2011). Anion secretion by a model epithelium: more lessons from Calu-3. Acta Physiol. 202, 523–531. doi: 10.1111/j.1748-1716.2011.02253.x
Shan, J., Liao, J., Huang, J., Robert, R., Palmer, M. L., Fahrendrug, S. C., et al. (2012). Bicarbonate-dependent chloride transport drives fluid secretion by the human airway epithelial cell line Calu-3. J. Physiol. 590, 5273–5297. doi: 10.1113/jphysiol.2012.236893
Smith, J. J., and Welsh, M. J. (1992). cAMP stimulates bicarbonate secretion across normal, but not cystic fibrosis airway epithelia. J. Clin. Invest. 89, 1148–1153. doi: 10.1172/JCI115696
Song, Y., Salinas, D., Nielson, D. W., and Verkman, A. S. (2006). Hyperacidity of secreted fluid from submucosal glands in early cystic fibrosis. Am. J. Physiol. Cell Physiol. 290, C741–C749. doi: 10.1152/ajpcell.00379.2005
Tamada, T., Hug, M. J., Frizzell, R. A., and Bridges, R. J. (2001). Microelectrode and impedance analysis of anion secretion in Calu-3 cells. JOP 2, 219–228.
Trout, L., Corboz, M. R., and Ballard, S. T. (2001). Mechanism of substance P-induced liquid secretion across bronchial epithelium. Am. J. Physiol. Lung Cell. Mol. Physiol. 281, L639–L645.
Van Slyke, D. D. (1922). On the measurement of buffer values and on the relationship of buffer value to the dissociation constant of the buffer and the concentration and reaction of the buffer solution. J. Biol. Chem. 52, 525–570.
Keywords: CFTR, bicarbonate secretion, cystic fibrosis, airway submucosal glands
Citation: Kim D, Liao J and Hanrahan JW (2014) The buffer capacity of airway epithelial secretions. Front. Physiol. 5:188. doi: 10.3389/fphys.2014.00188
Received: 01 November 2013; Accepted: 28 April 2014;
Published online: 03 June 2014.
Edited by:
Mark Oliver Bevensee, University of Alabama at Birmingham, USAReviewed by:
Alberto Passi, Università dellÌnsubria, ItalyMartin Diener, University Giessen, Germany
Juha Voipio, University of Helsinki, Finland
Copyright © 2014 Kim, Liao and Hanrahan. This is an open-access article distributed under the terms of the Creative Commons Attribution License (CC BY). The use, distribution or reproduction in other forums is permitted, provided the original author(s) or licensor are credited and that the original publication in this journal is cited, in accordance with accepted academic practice. No use, distribution or reproduction is permitted which does not comply with these terms.
*Correspondence: John W. Hanrahan, Department of Physiology, McGill University, 3655 Promenade Sir William Osler, Montréal, QC H3G 1Y6, Canada e-mail: john.hanrahan@mcgill.ca