 Verónica Casañas-Sánchez1,2
 José A. Pérez
 David Quinto-Alemany
 Mario Díaz
- 1Departamento de Bioquímica, Microbiología, Biología Celular y Genética, Universidad de La Laguna, Tenerife, Spain
- 2Instituto Universitario de Enfermedades Tropicales y Salud Pública de Canarias, Tenerife, Spain
- 3Departamento de Biología Animal, Edafología y Geología, Universidad de La Laguna, Tenerife, Spain
- 4Unidad Asociada de Investigación ULL-CSIC, “Fisiología y Biofísica de la Membrana Celular en Patologías Neurodegenerativas y Tumorales”, Tenerife, Spain
Ethanol is known to cause severe systemic damage often explained as secondary to oxidative stress. Brain is particularly vulnerable to ethanol-induced reactive oxygen species (ROS) because the high amounts of lipids, and because nerve cell membranes contain high amounts of peroxidable fatty acids. Usually these effects of ethanol are associated to high and/or chronic exposure to ethanol. However, as we show in this manuscript, a low and acute dose of ethanol trigger a completely different response in hippocampal cells. Thus, we have observed that 0.1% ethanol exposure to HT22 cells, a murine hippocampal-derived cell line, increases the transcriptional expression of different genes belonging to the classical, glutathione/glutaredoxin and thioredoxin/peroxiredoxin antioxidant systems, these including Sod1, Sod2, Gpx1, Gclc, and Txnrd1. Paralleling these changes, enzyme activities of total superoxide dismutase (tSOD), catalase, total glutathione peroxidase (tGPx), glutathione-S-reductase (GSR), and total thioredoxin reductase (tTXNRD), were all increased, while the generation of thiobarbituric acid reactive substances (TBARS), as indicators of lipid peroxidation, and glutathione levels remained unaltered. Ethanol exposure did not affect cell viability or cell growing as assessed by real-time cell culture monitoring, indicating that low ethanol doses are not deleterious for hippocampal cells, but rather prevented glutamate-induced excitotoxicity. In summary, we conclude that sub-toxic exposure to ethanol may well be neuroprotective against oxidative insults in hippocampal cells.
Introduction
Ethanol is known to induce neurocognitive deficits and to provoke neuronal injuries associated with neuronal degeneration (Givens et al., 2000). Although oxidative stress and mitochondrial damage are implicated in nerve tissue injury (Suh et al., 2004; Das and Vasudevan, 2007) the precise mechanisms underlying ethanol-induced neurological disorders remain unclear. Ethanol-induced oxidative stress is linked to its metabolism in both microsomal and mitochondrial systems, which is directly involved in the generation of reactive oxygen species (ROS) and reactive nitrogen species (Das and Vasudevan, 2007). It is known that high or chronic ethanol exposure results in the depletion of reduced glutathione (GSH) levels, decreases antioxidant activity, and elevates malondialdehyde and hydroxynonenal protein adducts (Das and Vasudevan, 2007). These increased levels of oxidative stress (and secondary membrane lipid peroxidation, in particular) may disrupt neuronal energy metabolism and ion homeostasis by impairing the function of membrane ion-motive ATPases and glucose and glutamate transporters. Such oxidative and metabolic disturbances may thereby render neurons vulnerable to excitotoxicity and apoptosis. Indeed, it is known that acute alcohol exposure inhibits cognitive functions, including learning, and memory in humans (Givens et al., 2000), and that ethanol-induced memory impairments are mainly due to deficits in processing new memories, rather than retrieval of consolidated memories (White et al., 2000). The hippocampus is the main locus for ethanol-induced alterations of cognitive functions. Compelling evidence have demonstrated that acute ethanol exposure inhibits long-term potentiation (LTP) in the CA1 region of the hippocampus both in vivo and in vitro (Givens and McMahon, 1995; White et al., 2000; Ramachandran et al., 2015). Apparently, the primary mechanism by which ethanol inhibits LTP is the increase in GABAergic transmission, which, in turn, inhibits the depolarization phase required for N-methyl-D-aspartate (NMDA) receptor activation (White et al., 2000; Schummers and Browning, 2001).
Apart from these deleterious effects, several lines of evidence have shown that consumption of low doses of alcohol may provide neuroprotective effects against Alzheimers disease (AD). Indeed, Belmadani et al. (2004) observed that acute administration of ethanol was able to prevent the toxic effects of amyloid beta peptides (Aβ), the main protein aggregates in Alzheimers disease, in brain slices. Pre-treatment with physiologically relevant concentrations of ethanol (0.02–0.08%) protected neurons against Aβ-induced synapse damage, and recovered levels of synaptophysin, an indicator of synapse density in cortical and hippocampal neurons (Bate and Williams, 2011). Further, it has been reported that moderate wine consumption reduced neuropathologic traits (decreased amyloid plaques and reduced spatial memory impairment), in Tg2576 transgenic mice which overexpress amyloid pre-cursor protein (Wang et al., 2006). Moreover, epidemiological studies in a large cohort of subjects (>3600) have pointed out that low or moderate alcohol consumption is associated with lower risk of incident dementia among older adults, and these individuals are less likely to develop phenotypic symptoms of Alzheimers disease (Mukamal et al., 2003). Interestingly, ethanol also protected neurons against synapse damage induced by pre-synaptic aggregates of α-synuclein, which are characteristic of Parkinson's disease and dementia with Lewy bodies (Bate and Williams, 2011).
The potential neuroprotective mechanism(s) of action of ethanol remain unknown. However, given that amyloid beta peptides and α-synuclein toxicities have been linked to increased oxidative stress (Simonian and Coyle, 1996; Mattson et al., 1999; Bossy-Wetzel et al., 2004; Mancuso et al., 2006), in the present study we have examined a possible mechanism by which moderate ethanol concentrations might exert a neuroprotective effect on hippocampal cells through modification of cellular antioxidant capabilities. We demonstrate for the first time, that sub-toxic ethanol exposure triggers the activation of cellular antioxidant systems and that its effects may be unraveled both at transcriptional and enzymatic levels. Our results demonstrate that, at low doses, ethanol exerts a role as an “Indirect Antioxidant,” at least in hippocampal cells.
Materials and Methods
Cell Culture Conditions, Ethanol Supplementation and Preparation of Cell Extracts
The immortalized mouse hippocampal cell line, HT22, was cultured in standard Dulbecco's modified Eagle's medium (DMEM) as described in Martín et al. (2006). Culture medium was changed every 2 days and, when reached 90% confluence, cells were subcultured after treatment with 0.25% trypsin-EDTA mixture, at a density of 4 × 10⁵/ml on T25 flasks (for gene expression analyses) and T75 flasks (for enzyme activity studies).
After allowing 24 h for attachment, culture media were replaced with standard medium supplemented with ethanol in a 0.1% final concentration or vehicle phosphate buffered saline (PBS). Every 24 h of incubation the medium was replaced with fresh medium containing ethanol in PBS or PBS. Cell cultures were collected at 6, 24, 30, and 48 h, and immediately processed for either total RNA extraction or preparation of total extracts required for determination of enzyme activities, and glutathione and TBARs levels.
Cell extracts were prepared by homogenization in cold hypotonic buffer (Tris-HCl 20 mM, pH = 7.6) containing 1X protease inhibitors cocktail (Roche Diagnostics, Barcelona, Spain), then centrifuged at 900 g for 10 min, and the supernatants collected and stored at −80°C until analyses. For glutathione measurements, cell extracts were homogenized in cold hypotonic buffer containing 5% TCA and centrifuged at 10,000 g for 10 min at 4°C to isolate the post-mitochondrial supernatant. Supernatants were stored in 150 μl aliquots at −80°C. Protein determination was carried out using the Bradford assay (Bradford, 1976).
RNA Purification, cDNA Synthesis and Relative Quantification of Gene Expression
Total RNA was purified from 3 × 10⁶ HT22 cells using a commercial kit and following the manufacturer's recommendations (RNeasy®Protect Minikit, Qiagen), and on-colum DNase I digestion to remove genomic DNA (gDNA). The integrity of purified RNA was estimated through the 3′:5′ assay (Nolan et al., 2006).
cDNA samples for real-time reverse transcription quantitative PCR (RT-qPCR) experiments were obtained with the Transcriptor First Strand cDNA Synthesis Kit (Roche), using 6 μg total RNA as template and anchored oligo(dT)18 primers. A mixture of the 33 diluted cDNA samples was used for the selection of the optimal concentration of each PCR primer pair (see Table 1), based on the lowest quantification cycle (Cq) values. Resulting amplicons for each primer pair from the cDNA pool were checked by electrophoresis on 3% agarose gels and sequenced. The possibility of gDNA contamination in the RT-qPCR assays was controlled in several ways. First, amplification primers were targeted to different exons, often spanning an exon/exon boundary (see Table 1). Next, each primer pair was tested by real-time qPCR using 1 ng genomic DNA as template. The level of gDNA contamination in each of the 32 RNA samples was assessed, assaying a quantity equivalent to the cDNA used in the amplification reactions (i.e., 40 ng of total RNA) was amplified by real-time qPCR using primers targeted to alpha-tubulin sequences.
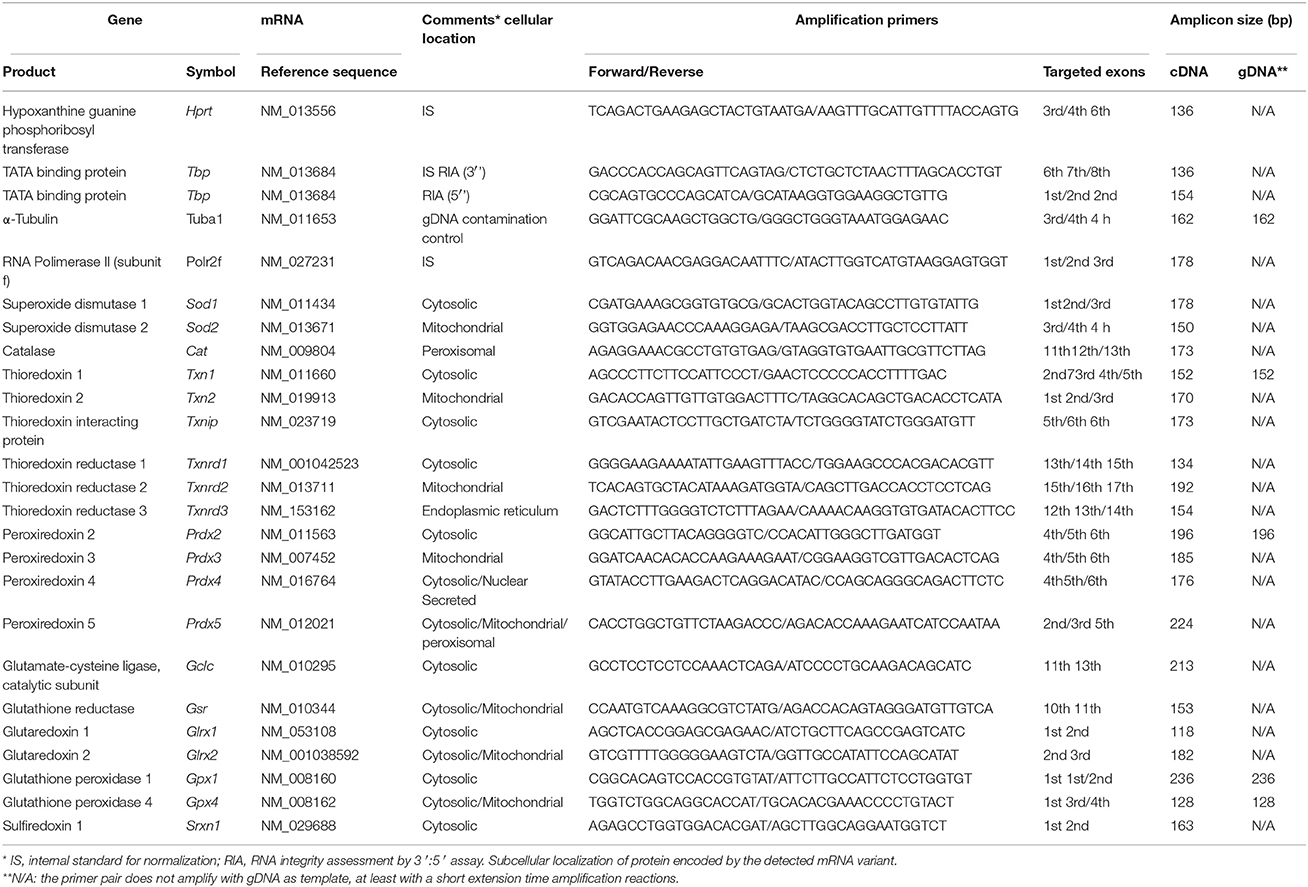
Table 1. Gene names, cellular locations, and oligonucleotides used as primers in amplification reactions.
Real-time amplifications were run in triplicate using SYBR Green detection on a LightCycler 480 platform (Roche). Relative quantities of the targeted mRNAs were calculated from Cq data following an efficiency-correction model implemented in the REST software (Pfaffl, 2001). The normalization factor for each cDNA sample was calculated as the geometric mean of the expression values of reference genes Hprt1, Polr2f, and Tbp genes.
Antioxidant Enzyme Activities and Levels of Glutathione and Thiobarbituric Acid Reacting Substances (TBARS)
Superoxide dismutase (SOD) activity was measured using the pyrogallol method following Marklund and Marklund (1974). One unit was defined as 50% inhibition of the rate of autoxidation of pyrogallol. The activity of SOD is expressed as units/mg protein. Catalase (CAT) activity was determined as described previously (Sani et al., 2006), by following the rate of decomposition of H2O2 in 10 mM potassium phosphate buffer at 240 nm. One CAT unit was defined as the decomposition of 1 mmol H2O2/min, and was expressed as units/mg protein.
Total glutathione peroxidase (GPX) and phospholipid-hydroperoxide glutathione peroxidase (GPX4) activities were measured using the glutathione reductase-NADPH methods described by Lawrence and Burk (1976) and Scheerer et al. (2007), respectively, by monitoring the rate of decrease in the concentration of NADPH as recorded at 340 nm. Glutathione reductase (GSR) was analyzed by determining the reduction of oxidized glutathione (GSSG) at the expenses of NADPH oxidation and monitored at 340 nm, according to the method of Carlberg and Mannervik (1985). GPX, GPX4 and GSR activities were expressed as nmol NADPH oxidized/min.mg protein.
Glutathione-S-transferase (GST) activity was determined following the conjugation of GSH with CDNB (1-chloro-2,4-dinitrobenzene) at 340 nm (Habig et al., 1974) and expressed as nmol GS-DNB/min.mg protein.
Thioredoxin reductase (TXNR) activity was measured using the DTNB-NADPH assay described by Arnér et al. (1999), in which the generation of thionitrobenzoate ion (TNB) catalyzed by TXNR upon oxidation of NADPH is monitored at 412 nm. TXNR activity was expressed as nmol TNB/min.mg protein.
Glutathione levels were determined fluorimetrically using excitation/emission wavelengths of 355 nm/420 nm according to Hissin and Hilf (1976). GSH, GSSG, and total glutathione (GSH+2GSSG) levels were determined against proper calibration curves and expressed as nmol/mg protein. Lipid peroxidation was determined by the thiobarbituric acid reacting substances (TBARs) method (Ohkawa et al., 1979), using TMP (1,1,3,3-tetramethoxypropane) as standard for calibration curves. TBARS were measured fluorimetrically with 485 nm (excitation)/ 535 nm (emission) wavelengths. TBARS contents were expressed as nmol/mg protein.
Real-time Cell Proliferation Assays
Real-time cell proliferation studies were performed using the xCELLigence biosensor technology (Roche), an electrical impedance-based system that allows for the measurement of real-time cell proliferation (Ke et al., 2011). Briefly, HT22 cells were trypsinized, and seeded at a density of 3.5 × 10³ cells/well into 3 independent E16—xCELLigence plates. After an initial stabilization period, the impedance was recorded at 15 min intervals along the experiment, and the values converted to Cell Index (CI), a measure of the degree of cellular adhesion to the multi-electrode array. Generally, cell number directly correlates with output CI reading until confluency is achieved (CImax). 48 h after seeding, 10 μl of vehicle (PBS), or ethanol (final concentration 0.1%) were added to each well, and incubated for additional 24 h before replacing the incubating solutions with either DMEM, DMEM+0.1% EtOH, or DMEM+1% EtOH (see Figure 5A). In some experiments, glutamate (20 mM final concentration) was added during the last medium replacement. The concentration of glutamate chosen for these experiments was calculated as the IC50 obtained in the dose-response analyses performed using this same device (Figure 5B). For this purpose 24 h after initial attachment, cells were exposed to single doses of glutamate, ranging from 3 to 30 mM, while CI was continuously monitored. 24 h after exposure CImax was obtained and used for logistic analyses.
Statistics
Gene expression data were processed following an efficiency-corrected model for relative quantification (Pfaffl, 2001) and normalization with multiple internal controls as implemented in the qBASE software (Hellemans et al., 2007). Four genes showing high expression stability in relative expression analysis were tested as potential reference genes according to qBASE normalization tools, three of which were finally selected. A relative expression software tool (REST 2008, Pfaffl et al., 2002) was used to obtain the corresponding significance levels for each individual change in gene expression. Comparisons of gene expression levels between PBS and ethanol and expressed as fold values. P-values below 0.05 were considered statistically different.
Dose-response curves for glutamate were obtained from real-time cell proliferation assays. Data were fitted to a four-parameter logistic equation to obtain the IC50 value, using the software implemented in XCELLigence device.
Data from enzyme activity assays and glutathione/TBARs levels are expressed as mean ± SEM, and were analyzed by one-way ANOVA followed by Tukey's multiple comparison test. Comparisons between PBS and ethanol treatments at each time were performed using Student's t-test or Mann-Whitney U-test where appropriate.
Results
Effects of Sub-toxic Exposure to Ethanol on the Transcriptional Activity of Genes Encoding for Antioxidant Systems
First, we analyzed the time-course of the effects of sub-toxic ethanol exposure (0.1%) on the expression of different genes encoding for antioxidant enzymes with relevant activity in neuronal cells. We explored key enzymes from the three major antioxidant systems, namely classical, thioredoxin/peroxyredoxin, and glutathione/glutaredoxin systems. Target genes analyzed are detailed in Table 1, together with the information on the primers used for PCR amplification.
Results in Table 2 show that superoxide dismutase encoding genes were up-regulated yet with different time-courses. Thus, while Sod1 expression was stimulated just 6 h after each exposure to ethanol (0 and 24 h), Sod2 was up-regulated after 30 h exposure to ethanol and remained so until the end of the experiment. The other gene relevant in the classical system, Cat, encoding for catalase, remained unaltered, or was down-regulated (at 24 h). Within the thioredoxin-peroxiredoxin system, Txnrd1 gene, encoding for cytosolic thioredoxin reductase was soon up-regulated and its expression kept stimulated throughout the experiment. Paradoxically, Txnrd2, and Txnrd3 genes, encoding for thioredoxin reductases from mitochondrial and endoplasmic reticulum isoforms, respectively, were down-regulated throughout the experiment, although only significantly for Txnrd3. A similar set of changes were observed for genes encoding for peroxyredoxins 2–5, all of which were significantly down-regulated yet with different time patterns. Finally, Txnip gene, encoding for the inhibitory thioredoxin interacting protein, was highly down-regulated, particularly 24 h after each addition of ethanol. No changes in the expression patterns were observed for either thioredoxin-encoding genes.
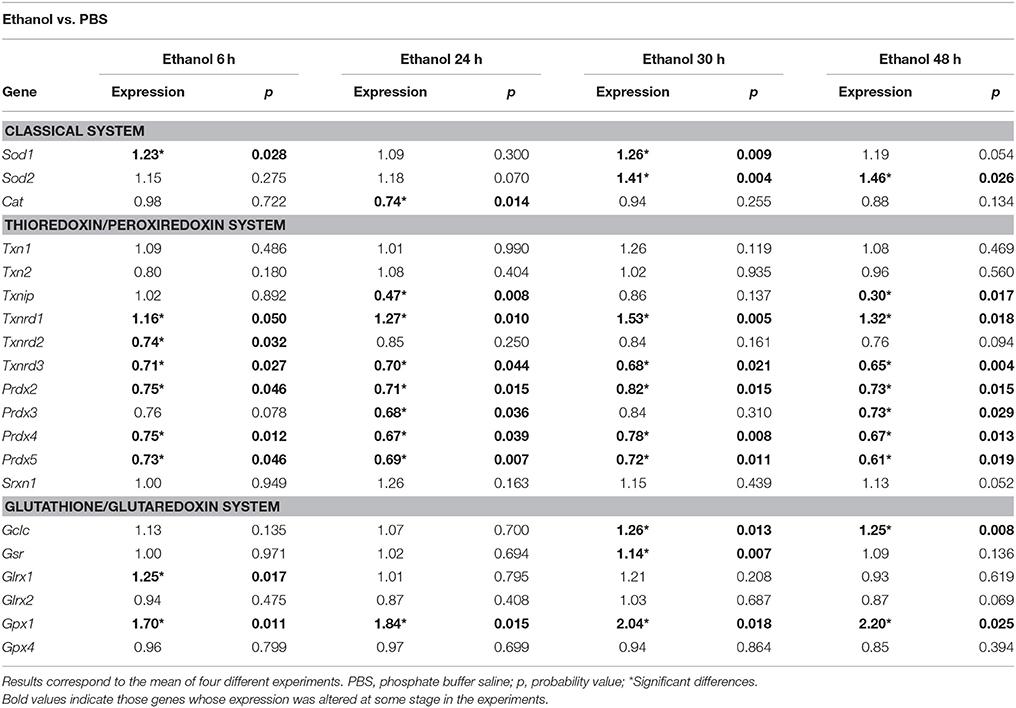
Table 2. Gene expression of antioxidant systems in HT22 cells exposed to ethanol (0.1%) or PBS.
Lastly, within the glutathione/glutaredoxin system, all affected genes were up-regulated. The most important changes were observed for Gpx1, encoding for cytosolic glutathione peroxidase 1, which remained stimulated throughout the experiment, and reached the maximal transcriptional stimulation amongst all genes studied at 48 h. These changes were specific for Gpx1, and were not observed for Gpx4 gene which encodes the membrane-associated isoform. Also, significant changes were detected for Gclc gene, which encodes for the catalytic subunit of glutathione-cysteine ligase.
Effects of Sub-toxic Exposure to Ethanol on Key Antioxidant Enzyme Activities and Antioxidant Metabolites
Next, we assessed the activities of most antioxidant enzymes encoded by genes that were affected by ethanol treatment and following the same time-course used to explore changes in transcriptional activity. Results shown in Figure 1A shows that total superoxide dismutase activity was increased by ethanol treatment from 24 h after exposure, being the maximal activity reached at 48 h. Surprisingly, catalase activity remained similar to vehicle (PBS) until the end of the experiment, where at 48 h a significant increase (40%) was observed (Figure 1B).
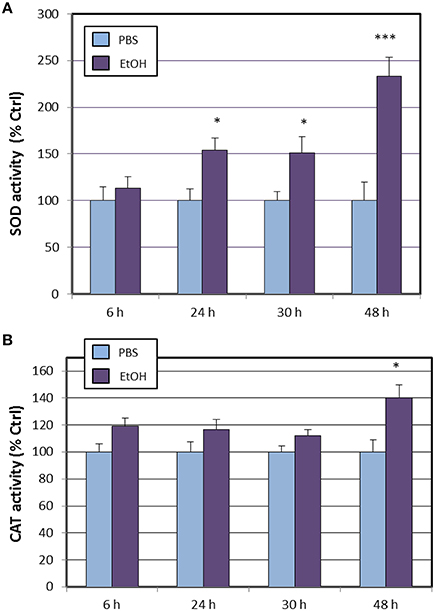
Figure 1. Effects of ethanol (EtOH, 0.1%) on total SOD (A) and catalase (B) activities in HT22 cells at different times after first exposure to ethanol. Results correspond to the mean ± SEM of four different experiments. *, and ***p < 0.05 and p < 0.005 compared to vehicle (PBS), respectively.
Within the thioredoxin system, we explored the time-course of total thioredoxin reductase (tTXNRD) activity (Figure 2). We observed that, in line with the results of Txnrd1 up-regulation, TXNRD activity was stimulated from 6 h, and that maximal activation was observed at 48 h.
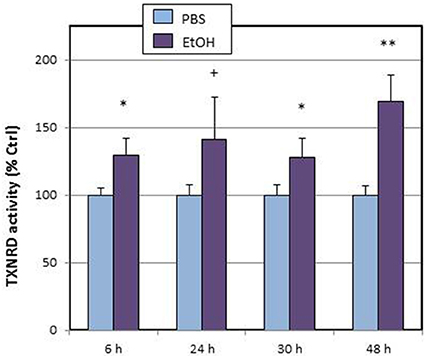
Figure 2. Effects of ethanol (EtOH, 0.1%) on total TXNRD activity in HT22 cells at different times after first exposure to ethanol. Results correspond to the mean ± SEM of four different experiments. +, *, **p < 0.1, p < 0.05, and p < 0.01 compared to vehicle (PBS), respectively.
With regards to the glutathione/glutaredoxin system, we assessed the enzyme activities of total glutathione peroxidase, glutathione peroxidase 4, glutathione-S-reductase, and glutathione-S-transferase (Figure 3). When compared to PBS, total glutathione peroxidase (tGPx) was found to be significantly increased from the begin of the experiment (Figure 3A), reaching nearly a 200% increase at 48 h (similar to what was observed for Gpx1 gene expression). This increase is likely attributable to stimulation of the GPX1 isoform, since GPX4 activity remained unaltered all along the experiment (Figure 3B). Glutahione-S-reductase (Figure 3C) was only affected at 48 h, which is compatible with the significant increase in Gsr gene expression detected at 30 h, and agrees with the expected delay in Gsr mRNA translation. On the other hand, glutathione-S-transferase was completely unaffected by ethanol treatment (Figure 3D).
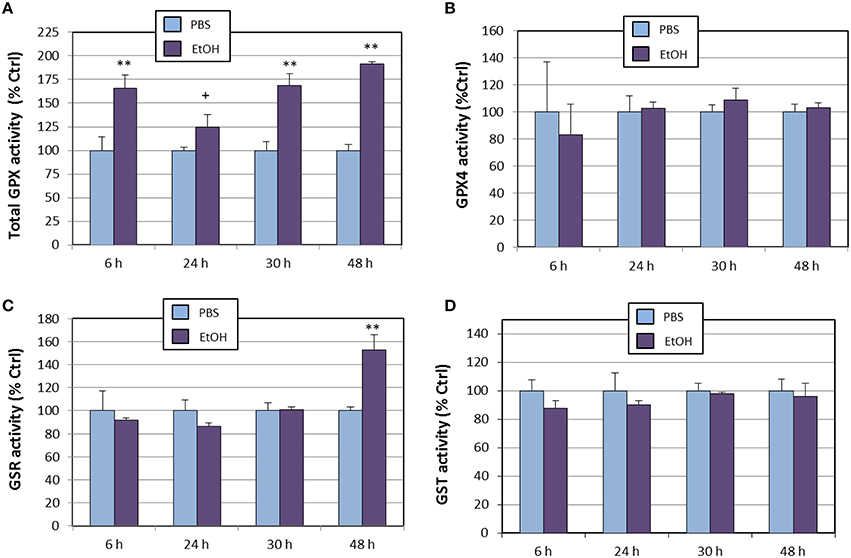
Figure 3. Effects of ethanol (EtOH, 0.1%) on total GPX (A), GPX4 (B), GSR (C), and GST (D) activities in HT22 cells at different times after first exposure to ethanol. Results correspond to the mean ± SEM of four different experiments. +, **p < 0.1 and p < 0.01 compared to vehicle (PBS), respectively.
We also determined cellular levels of total glutathione, reduced glutathione, oxidized glutathione (Figure 4). None of these oligopeptides appeared to be affected by ethanol treatment throughout the experiment, when compared to PBS-treated cells. These observations on glutathione species are in contrast to the expression levels of Gclc gene, which were significantly increased by the end of the experiment (Table 2). Several possible explanations are that even at 48 h, (1) Gclc mRNAs has not been fully translated, (2) that newly-synthetized GCLC protein might not be physiologically active or, (3) that expression of the regulatory subunit (GCLM) might be limiting, as demonstrated for HepG2/C3A cells and murine embryonic fibroblasts cultured in cysteine-deficient medium (Sikalidis et al., 2014). Regarding TBARs, it is noticeable that their levels did not increase at any point of the experiment, indicating that potential lipid peroxidation induced by ethanol is buffered by concerted activation of antioxidant systems. Indeed, although not significantly, there appear to occur a time-dependent reduction of TBARs levels in ethanol-treated cells (Figure 4D).
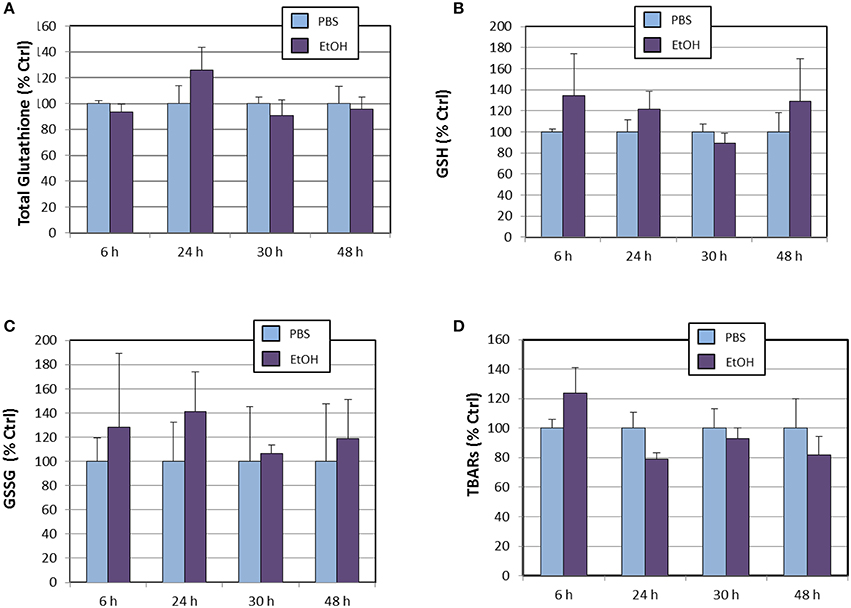
Figure 4. Effects of ethanol (EtOH, 0.1%) on total glutathione (A), reduced glutathione (B), oxidized glutathione (C), and TBARs (D) levels in HT22 cells at different times after first exposure to ethanol. Results correspond to the mean ± SEM of four different experiments.
Effects of Ethanol on the Time-course of HT22 Cell Proliferation and Resistance to Excitotoxicity
We finally analyzed the effects of different doses of ethanol treatment on HT22 cells proliferation. Results summarized in Figure 5 shows that HT22 cells reach the maximal cell index (CImax) after 120–160 h of seeding in the conditions of the present experiments (Figure 5A). In the presence of 0.1% ethanol, maximal CI values were similar between PBS- and ethanol-treated cells. However, when challenged with a 10-times higher dose of ethanol, a significant reduction of cell proliferation was observed, indicating an important degree of toxicity by this dose of ethanol (Figure 5A), likely caused by an excessive oxidative stress, which overcame the cytoprotective effects of endogenous antioxidant defense induced by low ethanol exposure.
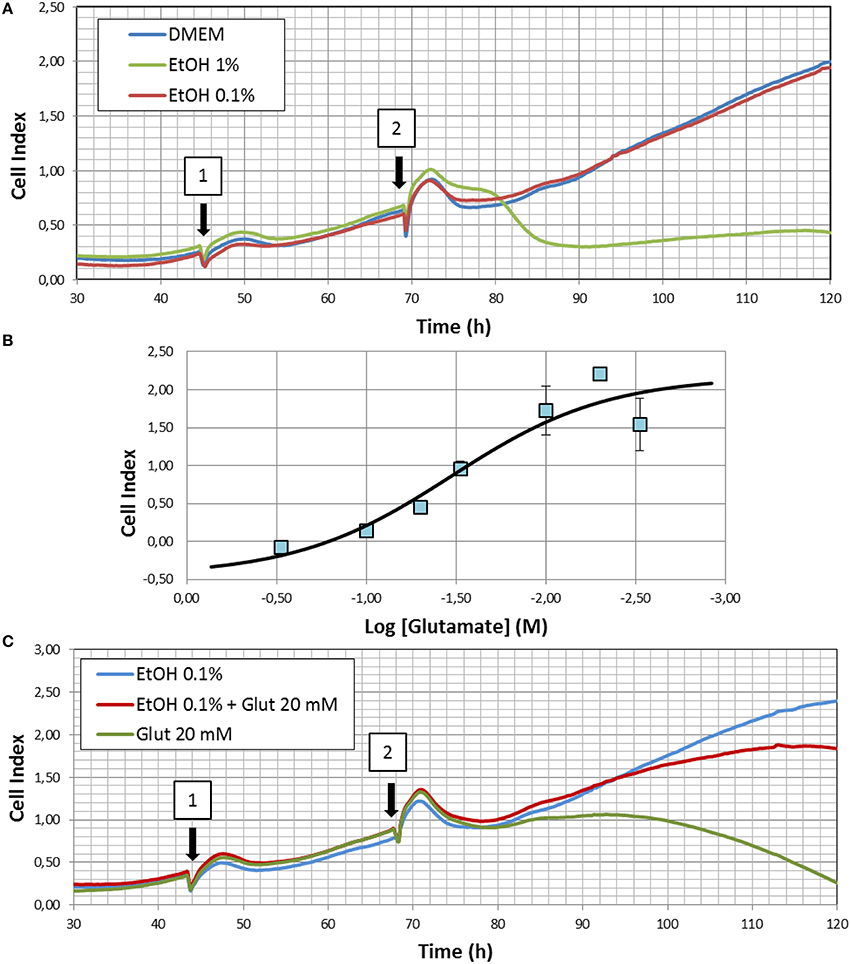
Figure 5. (A) Representative experiment showing the effects of 0.1 and 1% ethanol (EtOH) on real time cell proliferation. Arrows indicate the time where media were replaced by either DMEM or EtOH 0.1% in 1 or DMEM, EtOH 0.1, or EtOH 1% in 2. (B) Dose-response curve for glutamate toxicity in HT22 cells. Results summarize data from three different experiments and are indicated as mean ± SEM. (C) Neuroprotective effects of 0.1% ethanol. Illustrated correspond to a representative experiment of glutamate excitotoxicity in the presence or absence of ethanol. Arrows indicate the time where cells were exposed to either DMEM, EtOH 0.1, or EtOH 0.1% + glutamate in 1, or EtOH 0.1%, EtOH 0.1% + glutamate, or glutamate alone in 2. Three different replicates were performed for experiments illustrated in (A,C).
In order to assess whether changes in antioxidant gene expression might confer resistance to toxic oxidative insults, we used glutamate as it has been reported to cause excitotoxicity in HT22 cells (He et al., 2013) and oxidative stress secondary to cysteine depletion (Li et al., 1998). First, using non-linear regression to a four parameter logistic equation, we determined the IC50 value for glutamate toxicity against cell index, and we found a value of 19.5 mM (Figure 5B). Then, we assayed a glutamate concentration of 20 mM in ethanol (0.1%)-treated cells, while monitoring real time cell proliferation. We observed that pre-exposure to 0.1% ethanol significantly prevented glutamate-induced cell death to about 80% of ethanol-treated cells, compared to around 90% cell death in the absence of EtOH. Therefore, we concluded that ethanol efficiently reduced cell death caused by glutamate-induced excitotoxicity.
Discussion
Our present results demonstrate that treatment of hippocampal HT22 cells with sub-toxic doses of ethanol modifies the expression of specific genes within the classical, thioredoxin, and glutathione systems. We also show that these transcriptional changes are accompanied by consistent modifications in enzyme activities of the three systems and modulation of cellular antioxidant status. First, we observed that ethanol exposure stimulated gene expression of both superoxide dismutase genes (Sod1 and Sod2), and soon increased total SOD activity. The effects of ethanol exposure on the activity of superoxide dismutase are controversial, with reports of an increase (Somani et al., 1996; Enache et al., 2008), no change (Gonenc et al., 2005), or a decrease (Ledig et al., 1981), depending on the brain region, the dose and the duration of ethanol exposure. However, our results are in agreement with previous results showing significant increases in superoxide dismutase and catalase activities in the hippocampus of rats receiving acute intraperitoneal injections of ethanol (1.5 g/kg) (Enache et al., 2008). Similar results were observed in the rat cortex in response to acute ethanol administration (Somani et al., 1996). Interestingly, in our present study, although Cat gene expression was not altered by ethanol, a significant increase in enzyme activity was observed by the end of the experiment, which suggests a post-translational modulation of catalase, perhaps associated to increase H2O2 as a result of SOD activation. The existence of factors modulating catalase activity in response to oxidative stress has been demonstrated in different cell lines (Uenoyama and Ono, 1973; Cao et al., 2003). Several studies have shown that catalase interacts with c-Abl and Arg non-receptor tyrosine kinases, upon activation by H2O2through a mechanism dependent on protein kinase Cδ (Sun et al., 2000; Cao et al., 2003). The functional significance of these interactions are supported by the demonstration that cells deficient in both c-Abl and Arg exhibit substantial increases in H2O2 levels and a marked increase in H2O2-induced apoptosis (Cao et al., 2003).
Within the thioredoxin system we observed that the expression of the gene encoding for cytoplasmic thioredoxin reductase (Txnrd1) was significantly increased by ethanol from 6 h, while thioredoxin reductases of mitochondrial and endoplasmic reticulum origins were unaffected or down-regulated. Paralleling these observations, an equivalent increase in tTXNRD activity was observed shortly after the upregulation of Txnrd1 expression was observed. The finding that tTXNRD activity was augmented is consistent with the fact that cytosolic thioredoxin reductase (encoded by Txnrd1 gene) is the most abundant isoform in nerve cells (Arnér and Holmgren, 2000; Turanov et al., 2010). Another interesting observation was the dramatic down-regulation of Txnip gene expression in response to ethanol. It is known that Txnip gene encodes for the thioredoxin interacting protein, a 55 kDa protein that stabilizes reduced thioredoxin and keeps it inactive, thereby functioning as an endogenous inhibitor (Yoshihara et al., 2014). Despite ethanol does not alter thioredoxin genes (Txn1 and Txn2) expression in HT22 cells, reduction in the amount of TXNIP would obviously increase free thioredoxin (Trx) proteins, which would enhance its ROS buffering capacity. This effect is physiologically relevant since mammalian TRXRD reduces oxidized substrates, such as Trx and H2O2, but also other non-disulfide-containing molecules, such lipid hydroperoxides and other hydroperoxides even independently of Trx, but coupled to selenocysteine or selenodiglutathione reduction (Björnstedt et al., 1995; Arnér and Holmgren, 2000), which notably increases the antioxidant spectrum of TRXR.
A family of proteins related to Trx and regulated by ethanol is peroxiredoxins. Peroxiredoxins contain two conserved cysteines in their active site and utilize Trx as reductant (Rhee et al., 2005), therefore, tightly linked to Trx oxidative status (Hawkes et al., 2013). Currently six peroxiredoxins genes have been described in mammals, with Prdx2–5 genes being expressed in brain (Hattori et al., 2003; Rhee et al., 2005). We have observed that ethanol treatment brings about a generalized and significant down-regulation (18–39%) of all peroxyredoxin genes. These transcriptional alterations occurred soon after ethanol exposure (from 6 h) and lasted until 48 h. Noticeably, Srxn1 gene expression (which encodes for sulfiredoxin, the main protein responsible for reactivation of oxidized peroxiredoxins) remained unaffected in response to ethanol. At present, we have no explanation for this concerted reduction of peroxiredoxins but a plausible hypothesis is that by down-regulating their expression (at the same time Txnrd1 expression increases and Txnip expression decreases), reduction of Trx is mostly under the control of thioredoxin reductase activity, with lower amounts of reduced thioredoxin being used to reduce peroxiredoxins. As mentioned before, peroxiredoxins become oxidized upon ROS attack, and their reduction is coupled to oxidation of thioredoxin (Rhee et al., 2005). Holistically, such a mechanism will help to maintain higher cytosolic levels of reduced thioredoxin. Additional experiments, including determination of cytosolic levels of oxidized and reduced thioredoxin in response to ethanol, will help to unravel the physiological significance of these findings.
The last antioxidant system modulated by ethanol in HT22 cells is glutathione/glutaredoxin system. We observed that soon after ethanol exposure, expression levels of Gpx1 increased, and remained higher than in PBS throughout the experiment. Paralleling these findings, tGPx activity was higher in ethanol-treated cells from 6 h, therefore, correlating changes in expression levels. The increase in tGPx activity was likely attributable to GPx1 activity, since GPx4 activity (and gene expression) remained unaffected. Gclc gene expression also exhibited a significant increase in ethanol-treated cells, though in this case the response was delayed compared to Gpx1 gene, and was observed only after 30 h ethanol treatment. Clearly, this modulation of the glutathione/glutaredoxin system enhances the cellular antioxidant potential attributable to glutathione in neuronal cells, at the same time that provides an efficient strategy to ensure the reduction of oxidized glutathione. Indeed, in the present study, we have observed that levels of reduced (and also oxidized) glutathione remained unchanged in spite of the two ethanol challenges and also that TBARs levels were not different from those observed in PBS-treated cells throughout the experiment. These observations pinpoint to an efficient ROS-buffering capacity in HT22 cells in response to sub-toxic ethanol exposure. Interestingly, in agreement with our results, in vivo studies performed in the rat cerebral cortex and corpus striatum have shown that ethanol (1.6 g/kg) significantly increases total GPx (as well as SOD) activity (Somani et al., 1996).
It is well-known that an important effect of ethanol is to increase the generation of ROS, including superoxide and the hydroxyethyl radical (Das and Vasudevan, 2007). Generation of ethanol-derived ROS is expected to interact with cellular targets, particularly with membrane lipids, giving rise to lipid hydroperoxides, which, in turn, initiate a self-propagating oxidative damage (Niki et al., 2005). Therefore, it is expected that levels of lipid-related oxidative species progressively augment as time progresses. Although ROS are generally considered to exert deleterious effects, it is becoming increasingly evident that ROS may serve second messengers implicated in signaling processes, and participate in a number of normal physiological phenomena (Dröge, 2002). Thus, it is likely that ethanol-derived oxidized metabolites may be responsible for triggering transcriptional signals to boost the expression of components of cellular antioxidant systems, as we have previously observed for lipoperoxides derived from docosahexaenoic acid (Casañas-Sánchez et al., 2014). Indeed, It is known that some of the genes studied here, and upregulated by ethanol, contain “antioxidant response elements” (ARE) in their promoter regions (Kaspar et al., 2009; Hawkes et al., 2013). In this sense, recent studies have demonstrated that NF-E2-related factor 2 (Nrf2) is the master transcription factor for the regulation of ARE in different tissues, including the brain (Kobayashi and Yamamoto, 2005; Singh et al., 2010; Zhang et al., 2013).
Overall, we may conclude that sub-toxic ethanol exposure enhances global antioxidant capacity of hippocampal neurons by at least three mechanisms: (1) by enhancing the expression and activity of the generic system through up-regulating superoxide dismutase expression (2) by increasing thioredoxin reductase 1 expression, the most abundant isoform in neuronal tissue, at the same time that down-regulates Txnip and peroxiredoxins expression, and (3) by upregulating glutathione peroxidase 1 and glutathione-S-reductase genes expression. Taken together these observations led us to envisage that hippocampal cells become more resistant to oxidative insults after being exposed to acute sub-lethal ethanol. Indeed, recent in vivo evidence have shown that ethanol pre-conditioning render brain tissue more resistant to oxidative damage in animal models such as the ischemia-reperfusion injury in gerbil and rat models (Liao et al., 2003; Wang et al., 2007), pro-inflammatory lipopolysaccharide-injected rats (Singh et al., 2007), or even mice models of Alzheimers disease (Wang et al., 2006).
Further, in brain cultures, non-neurotoxic alcohol exposure blocks excitotoxic receptor-mediated neurodegeneration triggered by NMDA exposure (Chandler et al., 1993; Cebere and Liljequist, 2003; Belmadani et al., 2004). Effects of alcohol pre-conditioning on inflammatory protein (gp120IIIB)-induced neurotoxicity have also been explored in organotypic slices of rat hippocampus-entorhinal cortex, two brain regions significantly impacted in Alzheimers disease and other dementias (Collins et al., 2000, 2010). More recently, Muñoz and coworkers have shown that low concentrations of ethanol protect against synaptotoxicity induced by Aβ in hippocampal neurons (Muñoz et al., 2015). In line with this, we show here that ethanol (0.1%) can prevent excitotoxicity induced by glutamate exposure, which is in consonance with the results reported for NMDA exposure in rat primary cultured cells (Chandler et al., 1993) or in rat cerebellar granular cells (Cebere and Liljequist, 2003) in a similar range of concentrations and time-course as used here.
Different mechanisms have been proposed to underlie the neuroprotective effects of sub-lethal ethanol exposure. Overall, an emerging hypothesis is that alcohol pre-conditioning-induced neuronal survival mechanisms involve induction of heat-shock proteins (HSP27 and/or HSP70) upon ROS generation, and that HSP-dependent protection is intimately associated to selective protein kinase C (PKCα and PKCδ) and FAK (focal adhesion kinase) activation, NOS (nitric oxide synthase), the focal adhesion complex, and stabilization of the cytoskeleton (Collins et al., 2009). However, the present study is the first demonstrating that ethanol provides resistance to oxidative insults through mechanisms directly linked to transcriptional modulation of specific components within the set of antioxidant systems. Therefore, under this paradigm, ethanol may be considered an “Indirect Antioxidant,” as it has been coined for molecules which although lacking antioxidant activity per se, are capable to potentiate cellular antioxidant capacity by enhancing gene expression (Jung and Kwak, 2010). This newly identified neuroprotective (and perhaps anti-excitotoxic) effect of ethanol in vitro is clearly hormetic and might be clinically relevant (Rattan, 2004), but certainly it requires further studies before its significance and window of application is completely understood.
Author Contributions
VC and JP performed genetic analyses. DQ and VC performed analyses of enzyme activities. MD designed the study, analyzed the data and drafted the manuscript.
Conflict of Interest Statement
The authors declare that the research was conducted in the absence of any commercial or financial relationships that could be construed as a potential conflict of interest.
Acknowledgments
Supported by grants SAF2010-22114-C02-01 and SAF2014-52582-R from Ministerio de Economía y Competitividad (Spain). VC and DQ held fellowships from Gobierno de Canarias and Fundación Cajacanarias, respectively. We thank Dr. Juan Carlos Sánchez-Hernández (Universidad Castilla-La Mancha, Spain) for advice and support on antioxidant enzymology.
References
Arnér, E. S. J., and Holmgren, A. (2000). Physiological functions of thioredoxin and thioredoxin reductase. Eur. J. Biochem. 267, 6102–6109. doi: 10.1046/j.1432-1327.2000.01701.x
Arnér, E. S.J., Zhong, L., and Holmgren, A. (1999). Preparation and assay of mammalian thioredoxin and thioredoxin reductase. Methods Enzymol. 300, 226–239. doi: 10.1016/S0076-6879(99)00129-9
Bate, C., and Williams, A. (2011). Ethanol protects cultured neurons against amyloid-beta and alpha-synuclein-induced synapse damage. Neuropharmacology 61, 1406–1412. doi: 10.1016/j.neuropharm.2011.08.030
Belmadani, A., Kumar, S., Schipma, M., Collins, M. A., and Neafsey, E. J. (2004). Inhibition of amyloid-beta-induced neurotoxicity and apoptosis by moderate ethanol preconditioning. Neuroreport 15, 2093–2096. doi: 10.1097/00001756-200409150-00019
Björnstedt, M., Hamberg, M., Kumar, S., Xue, J., and Holmgren, A. (1995). Human thioredoxin reductase directly reduces lipid hydroperoxides by NADPH and selenocystine strongly stimulates the reaction via catalytically generated selenols. J. Biol. Chem. 270, 11761–11764. doi: 10.1074/jbc.270.20.11761
Bossy-Wetzel, E., Schwarzenbacher, R., and Lipton, S. A. (2004). Molecular pathways to neurodegeneration. Nat. Med. 10(Suppl.), S2–S9. doi: 10.1038/nm1067
Bradford, M. M. (1976). Rapid and sensitive method for quantitation of microgram quantities of protein utilizing principle of protein-dye binding. Anal. Biochem. 72, 248–254. doi: 10.1016/0003-2697(76)90527-3
Cao, C., Leng, Y., and Kufe, D. (2003). Catalase activity is regulated by c-Abl and Arg in the oxidative stress response. J. Biol. Chem. 278, 29667–29675. doi: 10.1074/jbc.M301292200
Carlberg, I., and Mannervik, B. (1985). Glutathione reductase. Methods Enzymol. 113, 484–490. doi: 10.1016/S0076-6879(85)13062-4
Casañas-Sánchez, V., Pérez, J. A., Fabelo, N., Herrera-Herrera, A. V., Fernández, C., Marín, R., et al. (2014). Addition of docosahexaenoic acid, but not arachidonic acid, activates glutathione and thioredoxin antioxidant systems in murine hippocampal HT22 cells: potential implications in neuroprotection. J. Neurochem. 131, 470–483. doi: 10.1111/jnc.12833
Cebere, A., and Liljequist, S. (2003). Ethanol differentially inhibits homoquinolinic acid-and NMDA-induced neurotoxicity in primary cultures of cerebellar granule cells. Neurochem. Res. 28, 1193–1199. doi: 10.1023/A:1024228412198
Chandler, L. J., Sumners, C., and Crews, F. T. (1993). Ethanol inhibits NMDA receptor-mediated excitotoxicity in rat primary neuronal cultures. Alcohol Clin. Exp. Res. 17, 54–60. doi: 10.1111/j.1530-0277.1993.tb00726.x
Collins, M. A., Neafsey, E. J., Mukamal, K. J., Gray, M. O., Parks, D. A., Das, D. K., et al. (2009). Alcohol in moderation, cardioprotection, and neuroprotection: epidemiological considerations and mechanistic studies. Alcohol Clin. Exp. Res. 33, 206–219. doi: 10.1111/j.1530-0277.2008.00828.x
Collins, M. A., Neafsey, E. J., Wang, K., Achille, N. J., Mitchell, R. M., and Sivaswamy, S. (2010). Moderate ethanol preconditioning of rat brain cultures engenders neuroprotection against dementia-inducing neuroinflammatory proteins: possible signaling mechanisms. Mol. Neurobiol. 41, 420–425. doi: 10.1007/s12035-010-8138-0
Collins, M. A., Neafsey, E. J., and Zou, J. Y. (2000). HIV-1 gp120 neurotoxicity in brain cultures is prevented by moderate ethanol pretreatment. Neuroreport 11, 1219–1222. doi: 10.1097/00001756-200004270-00015
Das, S. K., and Vasudevan, D. M. (2007). Alcohol-induced oxidative stress. Life Sci. 81, 177–187. doi: 10.1016/j.lfs.2007.05.005
Dröge, W. (2002). Free radicals in the physiological control of cell function. Physiol. Rev. 82, 47–95. doi: 10.1152/physrev.00018.2001
Enache, M., Van Waes, V., Vinner, E., Lhermitte, M., Maccari, S., and Darnaudéry, M. (2008). Impact of an acute exposure to ethanol on the oxidative stress status in the hippocampus of prenatal restraint stress adolescent male rats. Brain Res. 1191, 55–62. doi: 10.1016/j.brainres.2007.11.031
Givens, B., and McMahon, K. (1995). Ethanol suppresses the induction of long-term potentiation in vivo. Brain Res. 688, 27–33. doi: 10.1016/0006-8993(95)00499-G
Givens, B., Williams, J. M., and Gill, T. M. (2000). Septohippocampal pathway as a site for the memory-impairing effects of ethanol. Hippocampus 10, 111–121. doi: 10.1002/(SICI)1098-1063(2000)10:1<111::AID-HIPO12>3.0.CO;2-1
Gonenc, S., Uysal, N., Acikgoz, O., Kayatekin, B. M., Sonmez, A., Kiray, M., et al. (2005). Effects of melatonin on oxidative stress and spatial memory impairment induced by acute ethanol treatment in rats. Physiol. Res. 54, 341–348.
Habig, W. H., Pabst, M. J., and Jakoby, W. B. (1974). Glutathione S-transferases. The first enzymatic step in mercapturic acid formation. J. Biol. Chem. 249, 7130–7139.
Hattori, F., Murayama, N., Noshita, T., and Oikawa, S. (2003). Mitochondrial peroxiredoxin-3 protects hippocampal neurons from excitotoxic injury in vivo. J. Neurochem. 86, 860–868. doi: 10.1046/j.1471-4159.2003.01918.x
Hawkes, H. J., Karlenius, T. C., and Tonissen, K. F. (2013). Regulation of the human thioredoxin gene promoter and its key substrates: a study of functional and putative regulatory elements. Biochim. Biophys. Acta 840, 303–314. doi: 10.1016/j.bbagen.2013.09.013
He, M., Liu, J., Cheng, S., Xing, Y., and Suo, W. Z. (2013). Differentiation renders susceptibility to excitotoxicity in HT22 neurons. Neural Regen. Res. 8, 1297–1306. doi: 10.3969/j.issn.1673-5374.2013.14.006
Hellemans, J., Mortier, G., De Paepe, A., Speleman, F., and Vandesompele, J. (2007). qBase relative quantification framework and software for management and automated analysis of real-time quantitative PCR data. Genome Biol. 8:R19. doi: 10.1186/gb-2007-8-2-r19
Hissin, P. J., and Hilf, R. (1976). A fluorometric method for determination of oxidized and reduced glutathione in tissues. Anal. Biochem. 74, 214–226. doi: 10.1016/0003-2697(76)90326-2
Jung, K. A., and Kwak, M. K. (2010). The Nrf2 system as a potential target for the development of indirect antioxidants. Molecules 15, 7266–7291. doi: 10.3390/molecules15107266
Kaspar, J. W., Niture, S. K., and Jaiswal, A. K. (2009). Nrf2:INrf2(Keap1) signaling in oxidative stress. Free Radic. Biol. Med. 47, 1304–1309. doi: 10.1016/j.freeradbiomed.2009.07.035
Ke, N., Wang, X., Xu, X., and Abassi, Y. A. (2011). The xCELLigence system for real-time and label-free monitoring of cell viability. Methods Mol. Biol. 740, 33–43. doi: 10.1007/978-1-61779-108-6_6
Kobayashi, M., and Yamamoto, M. (2005). Molecular mechanisms activating the Nrf2-Keap1 pathway of antioxidant gene regulation. Antioxid. Redox Signal. 7, 385–394. doi: 10.1089/ars.2005.7.385
Lawrence, R. A., and Burk, R. F. (1976). Glutathione peroxidase activity in selenium-deficient rat liver. Biochem. Biophys. Res. Commun. 71, 952–958. doi: 10.1016/0006-291X(76)90747-6
Ledig, M., M'Paria, J. R., and Mandel, P. (1981). Superoxide dismutase activity in rat brain during acute and chronic alcohol intoxication. Neurochem. Res. 6, 385–390.
Li, Y., Maher, P., and Schubert, D. (1998). Phosphatidylcholine-specific phospholipase C regulates glutamate-induced nerve cell death. Proc. Natl. Acad. Sci. U.S.A. 95, 7748–7753. doi: 10.1073/pnas.95.13.7748
Liao, S. L., Chen, W. Y., Raung, S. L., and Chen, C. J. (2003). Ethanol attenuates ischemic and hypoxic injury in rat brain and cultured neurons. Neuroreport 14, 2089–2094. doi: 10.1097/00001756-200311140-00016
Mancuso, M., Coppede, F., Migliore, L., Siciliano, G., and Murri, L. (2006). Mitochondrial dysfunction, oxidative stress and neurodegeneration. J. Alzheimers Dis. 10, 59–73.
Marklund, S., and Marklund, G. (1974). Involvement of the superoxide anion radical in the autoxidation of pyrogallol and convenient assay for superoxide dismutase. Eur. J. Biochem. 47, 469–474. doi: 10.1111/j.1432-1033.1974.tb03714.x
Martín, V., Almansa, E., Fabelo, N., and Díaz, M. (2006). Selective enrichment in polyunsaturated fatty acids in phospholipids from neuronal-derived cell lines. J. Neurosci. Methods 153, 230–238. doi: 10.1016/j.jneumeth.2005.10.019
Mattson, M. P., Pedersen, W. A., Duan, W., Culmsee, C., and Camandola, S. (1999). Cellular and molecular mechanisms underlying perturbed energy metabolism and neuronal degeneration in Alzheimer's and Parkinson's diseases. Ann. N.Y. Acad. Sci. 893, 154–175. doi: 10.1111/j.1749-6632.1999.tb07824.x
Mukamal, K. J., Kuller, L. H., Fitzpatrick, A. L., Longstreth, W. T. Jr., Mittleman, M. A., and Siscovick, D. S. (2003). Prospective study of alcohol consumption and risk of dementia in older adults. JAMA 289, 1405–1413. doi: 10.1001/jama.289.11.1405
Muñoz, G., Urrutia, J. C., Burgos, C. F., Silva, V., Aguilar, F., Sama, M., et al. (2015). Low concentrations of ethanol protect against synaptotoxicity induced by Aβ in hippocampal neurons. Neurobiol. Aging 36, 845–856. doi: 10.1016/j.neurobiolaging.2014.10.017
Niki, E., Yoshida, Y., Saito, Y., and Noguchi, N. (2005). Lipid peroxidation: mechanisms, inhibition, and biological effects. Biochem. Biophys. Res. Commun. 338, 668–676. doi: 10.1016/j.bbrc.2005.08.072
Nolan, T., Hands, R. E., and Bustin, S. A. (2006). Quantification of mRNA using real-time RT-PCR. Nat. Protoc. 1, 1559–1582. doi: 10.1038/nprot.2006.236
Ohkawa, H., Ohishi, N., and Yagy, K. (1979). Assay for lipid peroxides in animal tissues by thiobarbituric acid reaction. Anal. Biochem. 95, 351–358. doi: 10.1016/0003-2697(79)90738-3
Pfaffl, M. W. (2001). A new mathematical model for relative quantification in real-time RT-PCR. Nucleic Acids Res. 29:e45. doi: 10.1093/nar/29.9.e45
Pfaffl, M. W., Horgan, G. W., and Dempfle, L. (2002). Relative expression software tool (REST©) for group-wise comparison and statistical analysis of relative expression results in real-time PCR. Nucleic Acids Res. 30:e36. doi: 10.1093/nar/30.9.e36
Ramachandran, B., Ahmed, S., Zafar, N., and Dean, C. (2015). Ethanol inhibits long-term potentiation in hippocampal CA1 neurons, irrespective of lamina and stimulus strength, through neurosteroidogenesis. Hippocampus 25, 106–118. doi: 10.1002/hipo.22356
Rattan, S. I. (2004). Aging, anti-aging, and hormesis. Mech. Ageing Dev. 125, 285–289. doi: 10.1016/j.mad.2004.01.006
Rhee, S. G., Chae, H. Z., and Kim, K. (2005). Peroxiredoxins: a historical overview and speculative preview of novel mechanisms and emerging concepts in cell signaling. Free Radic. Biol. Med. 38, 1543–1552. doi: 10.1016/j.freeradbiomed.2005.02.026
Sani, M., Sebaï, H., Gadacha, W., Boughattas, N. A., Reinberg, A., and Mossadok, B. A. (2006). Catalase activity and rhythmic patterns in mouse brain, kidney and liver. Comp. Biochem. Physiol. B Biochem. Mol. Biol. 145, 331–337. doi: 10.1016/j.cbpb.2006.08.005
Scheerer, P., Borchert, A., Krauss, N., Wessner, H., Gerth, C., Höhne, W., et al. (2007). Structural basis for catalytic activity and enzyme polymerization of phospholipid hydroperoxide glutathione peroxidase-4 (GPX4). Biochemistry 46, 9041–9049. doi: 10.1021/bi700840d
Schummers, J., and Browning, M. D. (2001). Evidence for a role for GABA(A) and NMDA receptors in ethanol inhibition of long-term potentiation. Brain Res. 94, 9–14. doi: 10.1016/S0169-328X(01)00161-9
Sikalidis, A. K., Mazor, K. M., Lee, J. I., Roman, H. B., Hirschberger, L. L, and Stipanuk, M. H. (2014). Upregulation of capacity for glutathione synthesis in response to amino acid deprivation: regulation of glutamate-cysteine ligase subunits. Amino Acids 46, 1285–1296. doi: 10.1007/s00726-014-1687-1
Simonian, N. A., and Coyle, J. T. (1996). Oxidative stress in neurodegenerative diseases. Ann. Rev. Pharmacol. Toxicol. 36, 83–106. doi: 10.1146/annurev.pa.36.040196.000503
Singh, A. K., Jiang, Y., Gupta, S., and Benlhabib, E. (2007). Effects of chronic ethanol drinking on the blood brain barrier and ensuing neuronal toxicity in alcohol-preferring rats subjected to intraperitoneal LPS injection. Alcohol Alcohol. 42, 385–399. doi: 10.1093/alcalc/agl120
Singh, S., Vrishni, S., Singh, B. K., Rahman, I., and Kakkar, P. (2010). Nrf2-ARE stress response mechanism: a control point in oxidative stress-mediated dysfunctions and chronic inflammatory diseases. Free Radic. Res. 44, 1267–1288. doi: 10.3109/10715762.2010.507670
Somani, S. M., Husain, K., Diaz-Phillips, L., Lanzotti, D. J., Kareti, K. R., and Trammell, G. L. (1996). Interaction of exercise and ethanol on antioxidant enzymes in brain regions of the rat. Alcohol 13, 603–610. doi: 10.1016/S0741-8329(96)00075-4
Suh, S. K., Hood, B. L., Kim, B. J., Conrads, T. P., Veenstra, T. D., and Song, B. J. (2004). Identification of oxidized mitochondrial proteins in alcohol-exposed human hepatoma cells and mouse liver. Proteomics 4, 3401–3412. doi: 10.1002/pmic.200400971
Sun, X., Majumder, P., Shioya, H., Wu, F., Kumar, S., Weichselbaum, R., et al. (2000). Activation of the cytoplasmic c-Abl tyrosine kinase by reactive oxygen species. J. Biol. Chem. 275, 17237–17240. doi: 10.1074/jbc.C000099200
Turanov, A. A., Kehr, S., Marino, S. M., Yoo, M. H., Carlson, B. A., Hatfield, D. L., et al. (2010). Mammalian thioredoxin reductase 1: roles in redox homoeostasis and characterization of cellular targets. Biochem. J. 430, 285–293. doi: 10.1042/BJ20091378
Uenoyama, K., and Ono, T. (1973). Post-transcriptional regulation of catalase synthesis in rat liver and hepatoma: factors activating and inhibiting catalase synthesis. J. Mol. Biol. 74, 439–452. doi: 10.1016/0022-2836(73)90038-7
Wang, J., Ho, L., Zhao, Z., Seror, I., Humala, N., Dickstein, D. L., et al. (2006). Moderate consumption of Cabernet Sauvignon attenuates Aβ neuropathology in a mouse model of Alzheimers disease. FASEB J. 20, 2313–2320. doi: 10.1096/fj.06-6281com
Wang, Q., Sun, A. Y., Simonyi, A., Kalogeris, T. J., Miller, D. K., Sun, G. Y., et al. (2007). Ethanol preconditioning protects against ischemia/reperfusion-induced brain damage: role of NADPH oxidase-derived ROS. Free Radic. Biol. Med. 43, 1048–1060. doi: 10.1016/j.freeradbiomed.2007.06.018
White, A. M., Matthews, D. B., and Best, P. J. (2000). Ethanol, memory, and hippocampal function: a review of recent findings. Hippocampus 10, 88–93. doi: 10.1002/(SICI)1098-1063(2000)10:1<88::AID-HIPO10>3.0.CO;2-L
Yoshihara, E., Masaki, S., Matsuo, Y., Chen, Z., Tian, H., and Yodoi, J. (2014). Thioredoxin/Txnip: redoxisome, as a redox switch for the pathogenesis of diseases. Front. Immunol. 4:514. doi: 10.3389/fimmu.2013.00514
Keywords: ethanol, antioxidant systems, superoxide dismutases, glutathione, thioredoxins, hippocampal cells, HT22 cells
Citation: Casañas-Sánchez V, Pérez JA, Quinto-Alemany D and Díaz M (2016) Sub-toxic Ethanol Exposure Modulates Gene Expression and Enzyme Activity of Antioxidant Systems to Provide Neuroprotection in Hippocampal HT22 Cells. Front. Physiol. 7:312. doi: 10.3389/fphys.2016.00312
Received: 19 April 2016; Accepted: 11 July 2016;
Published: 27 July 2016.
Edited by:
Ali Mobasheri, University of Surrey, UKReviewed by:
Alberto Passi, University of Insubria, ItalyAngel Catala, National University of La Plata, Argentina
Copyright © 2016 Casañas-Sánchez, Pérez, Quinto-Alemany and Díaz. This is an open-access article distributed under the terms of the Creative Commons Attribution License (CC BY). The use, distribution or reproduction in other forums is permitted, provided the original author(s) or licensor are credited and that the original publication in this journal is cited, in accordance with accepted academic practice. No use, distribution or reproduction is permitted which does not comply with these terms.
*Correspondence: Mario Díaz, madiaz@ull.es