 Hamid R. Molavian
 Mohammad Kohandel
 Sivabal Sivaloganathan
- Department of Applied Mathematics, University of Waterloo, Waterloo, ON, Canada
Since the original observation of the Warburg Effect in cancer cells, over 8 decades ago, the major question of why aerobic glycolysis is favored over oxidative phosphorylation has remained unresolved. An understanding of this phenomenon may well be the key to the development of more effective cancer therapies. In this paper, we use a semi-empirical method to throw light on this puzzle. We show that aerobic glycolysis is in fact energetically more favorable than oxidative phosphorylation for concentrations of peroxide (H2O2) above some critical threshold value. The fundamental reason for this is the activation and high engagement of the pentose phosphate pathway (PPP) in response to the production of reactive oxygen species (ROS) H2O2 by mitochondria and the high concentration of H2O2 (produced by mitochondria and other sources). This makes oxidative phosphorylation an inefficient source of energy since it leads (despite high levels of ATP production) to a concomitant high energy consumption in order to respond to the hazardous waste products resulting from cellular processes associated with this metabolic pathway. We also demonstrate that the high concentration of H2O2 results in an increased glucose consumption, and also increases the lactate production in the case of glycolysis.
Introduction
Increased aerobic glycolysis (the Warburg Effect) in proliferating cancer cells has been a perplexing puzzle that has remained unresolved for more than 80 years (Warburg, 1930, 1956; Gatenby and Gillies, 2004; Vander Heiden et al., 2009; Cairns et al., 2011; Schulze and Harris, 2012). The observation that cancerous cells are dominated by aerobic glycolysis is confounded by the fact that this metabolism produces far less energy compared to oxidative phosphorylation—generating 2 ATP from one molecule of glucose when compared to oxidative phosphorylation which generates 36 ATP (in the ideal case; Warburg, 1930, 1956). Initially, it was conjectured that defects in mitochondria might be the main reason for the increased aerobic glycolysis (Gatenby and Gillies, 2004; Vander Heiden et al., 2009; Cairns et al., 2011; Schulze and Harris, 2012), but successive experimental investigations have failed to confirm this scenario (Warburg, 1930, 1956).
Mitochondria produce reactive oxygen species (ROS) H2O2 in non-cancerous and cancerous cells during oxidative phosphorylation (Turrens, 2003). Moreover, in cancerous cells the concentration of H2O2 is also enhanced by the production of H2O2 through tumor suppressor and oncogenic agents (Szatrowski and Nathan, 1991; Vafa et al., 2002; Turrens, 2003; Sablina et al., 2005; Nogueira et al., 2008; Bensaad et al., 2009). The accumulation of H2O2 results in a toxic environment for cell compartments; moreover, mitochondria, as a source of H2O2, are much more vulnerable to H2O2 and as a result the development of conducible intracellular conditions can trigger tumor necrosis factors (TNF; Comporti, 1987; Schulze-Osthoff et al., 1993). As a defense mechanism, mitochondria import reduced glutathione (GSH), which is produced mainly through the activation of the pentose phosphate pathway (PPP) in the cytoplasm to detoxify the H2O2 (Deneke and Fanburg, 1989; Fernandez-Checa et al., 1997; Anastasiou et al., 2011). The removal of ROS is critical for cell survival since under high concentrations of H2O2, cell metabolism pathways are shut down in order to drive the flow of glucose to the PPP and thus produce enough GSH to detoxify the H2O2 (Anastasiou et al., 2011). However, the activation and maintenance of the PPP requires ATP hence an active, ramped up, productive cell metabolism is needed in order to produce more ATP when PPP is highly activated.
To understand the mechanism behind aerobic glycolysis and the role of ROS, we consider the following major metabolisms and detoxification pathway: oxidative phosphorylation, glycolysis, and the PPP. We assume that ATP, GSH, and H2O2 are the major players in the cell metabolism dynamics and the three chemical reactions involved are therefore (Supplementary Information),
In reaction (3), R5P may be used for synthesis of nucleotides and nucleic acids, which are necessary for cell proliferation, and GSH is used in the following equation to detoxify H2O2
This reaction involves intermediate steps in which GPxr interacts directly with H2O2 and GSH is a co-factor which produces GPxr (Supplementary Information). The concentration of GSH and GPxr in cells are respectively about 0.1–7 mM (Deneke and Fanburg, 1989; Li et al., 2000; Ng et al., 2007; Anastasiou et al., 2011) and 10 nM–5 μM (Antunes and Cadenas, 2001; Stone, 2004), hence it seems that there is always enough GSH to detoxify H2O2. However, at high concentration levels of H2O2, H2O2 primarily modulates the concentration levels of GSH. Cells respond to these elevated levels by producing more GSH to detoxify the accumulated H2O2 (Bellomo et al., 1992). Therefore, at high concentrations of H2O2, the production rate of GSH depends in turn on the concentration level of H2O2 (Li et al., 2000; Ng et al., 2007). A good indication of this behavior is the full diversion of glucose flux into the PPP when cells are contaminated with high concentrations of H2O2 (Fernandez-Checa et al., 1997). Increasing the concentration of H2O2 further, eventually results in cell death. Thus, we can define an upper limit for the concentration of H2O2 above which cells go through apoptosis and we call this the cell sensitivity concentration (CSC) level. For concentrations of H2O2 much lower than CSC the production rate of GSH is very low. As the concentration of H2O2 becomes comparable to CSC, cells start to activate the PPP to produce more GSH. The produced H2O2 by cell mitochondria is a major player in this response, since they are at the center of H2O2 production and they, if functional, can activate TNF. At high concentrations of H2O2, the H2O2 produced by mitochondria does not diffuse into the cell cytoplasm and accumulates instead around the mitochondria which, as a result, activate TNF.
We include these observations in the form where PGSH, , and are respectively the production rates of GSH, H2O2 by mitochondria and H2O2 by external sources, and β and γ are functions of the concentration of GSH and, the difference between CSC (C0) and the concentration of H2O2 (CROS). We choose β and γ to be different since, in general, the response of mitochondria to the accumulation of H2O2 differs from that of the rest of the cell. β and γ are very small for low concentrations of H2O2 and start to increase as the concentration of H2O2 increases. Close to C0 they become very large in order to drive most of the consumed glucose to the PPP pathway. Since mitochondria can activate TNF in their oxidative phosphorylation state (Schulze-Osthoff et al., 1993), there is a stronger response at high concentrations of H2O2, hence β should be significantly larger than γ.
We assume that both oxidative phosphorylation and glycolysis are activated to produce energy for cell needs and for the PPP and investigate the production rate of ATP in the presence of H2O2. The net production of ATP is the sum of the production of ATP by oxidative phosphorylation and glycolysis minus the consumption of ATP by the PPP (which primarily detoxifies the generated H2O2 by mitochondria and other sources). We obtain the production and consumption as functions of the oxygen and glucose consumption and GSH production (). Using , where α is the fraction of oxygen consumption (qO) converted to H2O2 by mitochondria [about 1/100−2/100 Turrens, 2003], thus we have (Supplementary Information):
where qG is the total consumption of glucose and r is the ratio between oxygen and metabolic glucose consumptions. We now consider the case when the net production rate of ATP exactly balances the energy requirements of the cell and derive the following result for the consumption of glucose in terms of the concentration and production rate of H2O2 (Supplementary Information):
where and are respectively the ATP and glucose consumption by the cell in the equilibrium state. Also, the total amount of lactate production for the case of pure glycolysis (r = 0) reads:
We first consider the special case of zero external production and low concentrations of H2O2 (αβ is very small). In this case, and for a purely glycolytic metabolism (r = 0), PATP = 2qG which implies that 2ATP are produced for each molecule of glucose—this is the well-known case of pure glycolysis. In the case of dominant respiration (r = 6) PATP = 36qG, which is again the net energy production rate for a cell under oxidative phosphorylation. A simple comparison of 2–36 ATP production leads to the superficial, albeit prominent conclusion that, for the case of low H2O2 concentrations, oxidative phosphorylation is the most efficient metabolism.
We now search for the most efficient metabolism in the presence of H2O2 by finding the maximum production rate of ATP (PATP) as a function of r. For αβ < αT, where αT = 68/9 the maximum production of ATP arises at r = 6. This is in agreement with the well-known fact that oxidative phosphorylation is the most efficient way for ATP production. However, rather interestingly, for αβ > αT the maximum production rate of ATP occurs at r = 0 and the transition point is independent of . This implies that for some concentrations of H2O2, glycolysis is in fact energetically more efficient than oxidative phosphorylation, which directly contradicts current prevailing explanations. To illustrate this metabolic transition in terms of the concentration of H2O2 we choose two functions and and substitute these into Equation (5). These functions mimic the real behavior of the system in which the production rate of GSH increases as the concentration of H2O2 increases. The coefficient β is chosen to be larger because (a) TNF is activated by mitochondria and (b) at high concentrations of H2O2, the produced H2O2 cannot diffuse into the cell and accumulates in the vicinity of the mitochondria which occupy a much smaller space within the cell. In Figure 1 we plot the normalized PATP (PATP is normalized to be one for any given concentration of ROS) as a function of CROS and r. For CROS < 0.87C0, which corresponds to β < αT, the maximum production rate arises at r = 6 and for CROS > 0.87C0, which corresponds to αβ > αT, it transitions to pure glycolysis (r = 0).
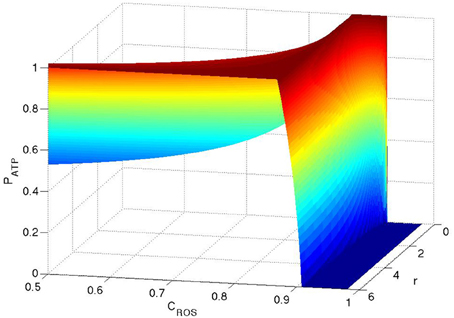
Figure 1. ATP production as functions of CROS and r. The production of ATP is normalized to one for any given concentration of ROS. Here .
As a first step to better understand the nature of the transition from oxidative phosphorylation to glycolysis, we first take note that the inefficiency observed in oxidative phosphorylation is fundamentally due to the fact that for some concentrations of H2O2, a cell must expend most of its produced ATP in detoxifying its self-generated H2O2 (by mitochondria). This is supported by the fact that for α = 0 (i.e., no production of H2O2 by mitochondria), it is respiration that is the more efficient metabolism for any concentration of H2O2. In contrast, for α≠0, no matter how small α is, the shift in metabolism (from respiration to glycolysis) occurs when concentrations of H2O2 exceed some critical threshold value. At these concentration levels of H2O2, the net produced energy by oxidative phosphorylation for one molecule of glucose is less than that produced through glycolysis. To gain a more quantitative understanding of this phenomenon, we first observe that α is a property of mitochondrial efficiency. It can safely be assumed that this remains constant independent of H2O2. Meanwhile β changes through either an increase in the concentration levels of H2O2 or a decrease in the concentration levels of GSH and thus results in a crossing of the transition point to glycolysis. In non-cancerous cells and under normal conditions, H2O2 is mainly produced by mitochondria and diffuses through the cell. In this case, the low production of GSH and other antioxidants are sufficient to detoxify the H2O2, hence normal cells function in the αβ < αT regime. In this case, oxidative phosphorylation is the most efficient mechanism for ATP production. However, in proliferating cancer cells, H2O2 is produced by growth factors and mitochondria that work at higher rates to compensate for the increased energy needs of proliferating cells. Hence, the concentrations of H2O2 are much higher and this can push the cell into the regime αβ > αT in which glycolysis is the more efficient metabolism.
In Figure 2 we plot the glucose consumption as functions of CROS for the two cases r = 0 and r = 6 under constant cell needs. These plots show the significant increase in glucose consumption as functions of the concentration of H2O2. Therefore, the generated H2O2 by growth factors and other sources is one of the major reasons for the increase in glucose consumption. Also, the two plots intersect for CROS = 0.87C0, which means that for a given cell glucose requirement, the energy expended for the consumption of glucose through oxidative phosphorylation exceeds the corresponding expenditure when the cell has shifted to a glycolysis metabolism and this is due to the production of H2O2 by mitochondria.
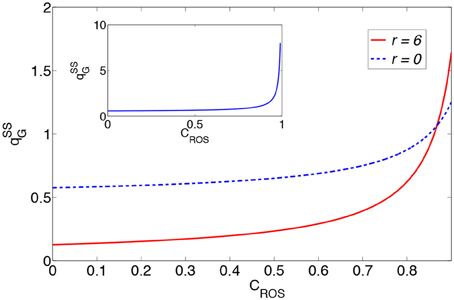
Figure 2. Glucose consumption as a function of the concentration of H2O2 for r = 0 and r = 6. Here, , , and is in the dimension of . The inset shows the glucose consumption as functions of CROS for r = 0.
In Figure 3 we plot the lactate production for r = 0 as a function of CROS assuming that remains constant. An increased concentration of H2O2 leads to enhanced lactate production. This suggests that the observed high lactate production in cancer cells does not occur solely because of the cell needs, but may also be related to the increase in the concentration levels of H2O2. We plot in the inset of Figure 3 the ratio between lactate production and glucose consumption against ROS concentration levels. This figure demonstrates that the larger portion of glucose is consumed by the cell metabolism, however, the corresponding share consumed by the PPP increases with elevations in the ROS concentration levels.
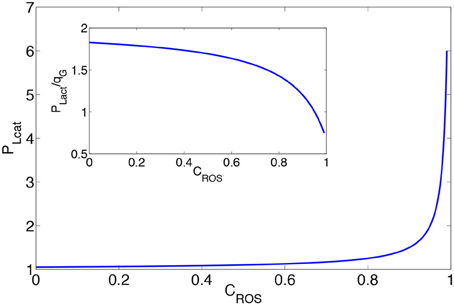
Figure 3. Production of lactate as a function of the concentration of H2O2. The inset shows the ratio between lactate production and glucose consumption. PLact is in the dimension of , and . In the inset, the ratio between lactate production to glucose consumption is plotted.
Notice that the presented results are qualitatively independent of the form of β and γ and we can derive the obtained results for any β and γ as long as they increase with increasing H2O2. These functions could be measured in vitro by putting different cell lines in a steady state flow of H2O2 and measuring the production rate of GSH for different concentrations of GSH. We also note that, at the same concentration of H2O2, glycolytic cells produce less GSH than cells that use oxidative phosphorylation.
In Shi et al. (2009) showed that by enhancing H2O2 in hepatoma cells, glycolysis activity increases, and by reducing H2O2 levels, this activity decreases. These observations are consistent with our prediction of a concomitant increase in glycolysis activity with increase in H2O2 and vice versa. We also note that Brand and Hermfisse (1997) observe that for proliferating rat thymocytes, cells switch to glycolysis to protect themselves against H2O2.
In Figure 4 we illustrate how the different dominant mechanisms in cell metabolism and detoxification evolve as the concentrations of oxygen and H2O2 vary. For concentrations of oxygen less than the hypoxic concentration (CH) and CROS less than the critical value for transition from oxidative phosphorylation to glycolysis (COG), the metabolism is anaerobic glycolysis. When the concentration of oxygen passes the hypoxic concentration levels, cells transit to oxidative phosphorylation or aerobic glycolysis depending on whether CROS is less or greater than COG. As the concentration of H2O2 increases and exceeds CGP, cells close all their metabolic pathways to drive the whole consumption of glucose toward PPP in order to reduce cell damage by H2O2. However, this process cannot continue indefinitely because changing glucose to G6P is ATP-dependent. Thus, cells need to keep their glycolytic metabolism active in order to continue the process of generating GSH and for detoxification of H2O2. When the concentrations of H2O2 exceed the critical concentration C0 tumor cells undergo apoptosis. Notice that this diagram is based on the most efficient mechanism of producing ATP and the availability of oxygen. It is possible that mutated cells activate less dominant metabolic pathways in any of these regions.
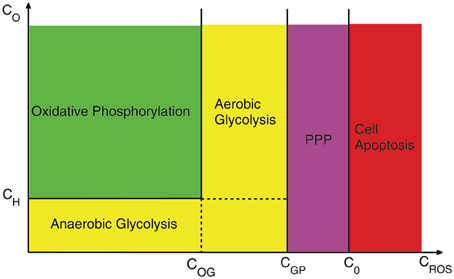
Figure 4. A schematic of cell behavior under different concentrations of oxygen and H2O2. COG, CGP are respectively the critical concentration for transition from oxidative phosphorylation to glycolysis and from Glycolysis to PPP and CH is the transition point to hypoxia. The scales are for purely illustrative proposes and do not correspond to experimental values.
When some cells adopt the glycolytic phenotype, they have chosen the most efficient way of generating energy under H2O2 stress and are more resistant to ROS. Hence, at high concentrations of H2O2, they have a higher survival advantage as compared to cells that rely on respiration. As a result, the glycolytic phenotypic population becomes the dominant population under ROS stress. Switching to the glycolytic phenotype may be realized through overexpression of glycolytic agents. In fact, experimental results report that PKM2 is activated in cancer cells which serves to shift the metabolism from oxidative phosphorylation to aerobic glycolysis (Christofk et al., 2008; Hitosugi et al., 2009). Interestingly, as the concentration of H2O2 gets close to the CSC (at which cell damage may occur), PKM2 is inhibited to drive the whole glucose flux to the PPP pathway and thus minimize the adverse effects of ROS (Anastasiou et al., 2011). Hence, PKM2 maybe be one of the primary candidates driving the described transition from oxidative phosphorylation to glycolysis.
We anticipate that there are other physiological and pathological situations in which our results might be pertinent and might help to explain certain biological behaviors. Two such examples are the observation of the glycolysis metabolism in embryos (Kondoh et al., 2007) and skeletal muscle (Richardson et al., 1998) which could well be described and understood based on our proposed model. Another example is the observation of the transition between glycolysis and oxidative phosphorylation in yeast (Chen et al., 2007). However, further investigations and more detailed discussion of these systems is beyond the scope of the current manuscript.
In conclusion, we have demonstrated that aerobic glycolysis is energetically more favorable than oxidative phosphorylation when the concentration levels of H2O2 exceed a certain critical value. This is because the energy generated by mitochondria is consumed by PPP to respond to the production and high concentrations of H2O2, generated by mitochondria. This makes oxidative phosphorylation an inefficient source of energy since it results in high energy consumption in order to respond to the production of H2O2 by mitochondria under high concentrations of H2O2. We have also shown that by increasing H2O2 levels, cells need to increase their glucose consumption via the glycolysis metabolism and PPP in order to satisfy their nutritional needs and for the purposes of removing H2O2. Thus, we propose that H2O2 is the major player behind the observed shift toward aerobic glycolysis in proliferating cancer cells.
Author Contributions
HM, MK and SS conceived and designed the research project. HM carried out the calculations and simulations. HM, MK and SS analyzed the results and wrote the manuscript.
Funding
SS and MK acknowledge NSERC funding through individual Discovery Grants.
Conflict of Interest Statement
The authors declare that the research was conducted in the absence of any commercial or financial relationships that could be construed as a potential conflict of interest.
Acknowledgments
We thank M. Milosevic, M. Gingras, M. Khorami, C. Phipps, and K. Kaveh for discussion and critical reviews. This work was financially supported by the Natural Sciences and Engineering Research Council of Canada (NSERC, discovery grant to SS) as well as NSERC/CIHR Collaborative Health Research grant (to MK and SS).
Supplementary Material
The Supplementary Material for this article can be found online at: http://journal.frontiersin.org/article/10.3389/fphys.2016.00362
References
Anastasiou, D., Poulogiannis, G., Asara, J. A., Boxer, M. B., Jiang, J., Shen, M., et al. (2011). Inhibition of pyruvate kinase m2 by reactive oxygen species contributes to cellular antioxidant responses. Science 334, 1278–1283. doi: 10.1126/science.1211485
Antunes, F., and Cadenas, E. (2001). Cellular titration of apoptosis with steady state concentrations of H(2)O(2): submicromolar levels of H(2)O(2) induce apoptosis through Fenton chemistry independent of the cellular thiol state. Free Radic. Biol. Med. 30, 1008–1018. doi: 10.1016/S0891-5849(01)00493-2
Bellomo, G., Vairetti, M., Stivala, L., Mirabelli, F., Richelmi, P., and Orrenius, S. (1992). Demonstration of nuclear compartmentalization of glutathione in hepatocytes. Proc. Natl. Acad. Sci. U.S.A. 89, 4412–4416. doi: 10.1073/pnas.89.10.4412
Bensaad, K., Cheung, E. C., and Vousden, K. H. (2009). Modulation of intracellular ROS levels by TIGAR controls autophagy. EMBO J. 28, 3015–3026. doi: 10.1038/emboj.2009.242
Brand, K. A., and Hermfisse, U. (1997). Aerobic glycolysis by proliferating cells: a protective strategy against reactive oxygen species. FASEB J. 11, 388–395.
Cairns, R. A., Harris, I. S., and Mak, T. W (2011). Regulation of cancer cell metabolism. Nat. Rev. Cancer 11, 85–95. doi: 10.1038/nrc2981
Chen, Z., Odstrcil, E. A., Tu, B. P., and McKnight, S. L. (2007). Restriction of DNA replication to the reductive phase of the metabolic cycle protects genome integrity. Science 29, 1916–1919. doi: 10.1126/science.1140958
Christofk, H. R., Vander Heiden, M. G., Harris, M. H., Ramanathan, A., Gerszten, R. E., Wei, R., et al. (2008). The M2 splice isoform of pyruvate kinase is important for cancer metabolism and tumor growth. Nature 452, 230–233. doi: 10.1038/nature06734
Comporti, M. (1987). Glutathione depleting agents and lipid peroxidation. Chem. Phys. Lipids 45, 143–169. doi: 10.1016/0009-3084(87)90064-8
Deneke, S. M., and Fanburg, B. L. (1989). Regulation of cellular glutathione. Am. J. Physiol. 257, Ll63–L173.
Fernández-Checa, J. C., Kaplowitz, N., García-Ruiz, C., Colell, A., Miranda, M., Marí, M., et al. (1997). GSH transport in mitochondria: defense against TNF-induced oxidative stress and alcohol-induced defect. Am. J. Physiol. 273, G7–G17.
Gatenby, R. A., and Gillies, R. J. (2004). Why do cancers have high aerobic glycolysis? Nat. Rev. Cancer 4, 891–899. doi: 10.1038/nrc1478
Hitosugi, T., Kang, S., Vander Heiden, M. J., Chung, T.-W., Elf, S., Lythgoe, K., et al. (2009). Tyrosine phosphorylation inhibits PKM2 to promote the warburg effect and tumor growth. Sci. Signal. 2, ra73. doi: 10.1126/scisignal.2000431
Kondoh, H., Lleonart, M. E., Nakashima, Y., Yokode, M., Tanaka, M., Bernard, D., et al. (2007). High glycolytic flux supports the proliferative potential of murine embryonic stem cells. Antioxid. Redox Signal. 9, 293–299. doi: 10.1089/ars.2006.1467
Li, S., Yan, T., Yang, J. Q., Oberley, T. D., and Oberley, L. W. (2000). The role of cellular glutathione peroxidase redox regulation in the suppression of tumor cell growth by manganese superoxide dismutase. Cancer Res. 60, 3927–3939.
Ng, C. F., Schafer, F. Q., Buettner, G. R., and Rodgers, V. G. (2007). The rate of cellular hydrogen peroxide removal shows dependency on GSH: mathematical insight into in vivo H2O2 and GPx concentrations. Free Radic. Res. 41, 1201–1211. doi: 10.1080/10715760701625075
Nogueira, V., Park, Y., Chen, C. C., Xu, P. Z., Chen, M. L., Tonic, I., et al. (2008). Akt determines replicative senescence and oxidative or oncogenic premature senescence and sensitizes cells to oxidative apoptosis. Cancer Cell 14, 458–470. doi: 10.1016/j.ccr.2008.11.003
Richardson, R. S., Noyszewski, E. A., Leigh, J. S., and Wagner, P. D. (1998). Lactate efflux from exercising human skeletal muscle: role of intracellular PO2. J. Appl. Physiol. 85, 627–634.
Sablina, A. A., Budanov, A. V., Ilyinskaya, G. V., Agapova, L. S., Kravchenko, J. E., and Chumakov, P. M. (2005). The antioxidant function of the p53 tumor suppressor. Nat. Med. 11, 306–313. doi: 10.1038/nm1320
Schulze, A., and Harris, A. L. (2012). How cancer metabolism is tuned for proliferation and vulnerable to disruption. Nature 491, 364–373. doi: 10.1038/nature11706
Schulze-Osthoff, K., Beyaert, R., Vandevoorde, V., Haegeman, G., and Fiers, W. (1993). Depletion of the mitochondrial electron transport abrogates the cytotoxic and gene-inductive effects of TNF. EMBO J. 12, 3095–3104.
Shi, D., Xie, F., Zhai, C., Stern, J. S., Liu, Y., and Liu, S. (2009). The role of cellular oxidative stress in regulating glycolysis energy metabolism in hepatoma cells. Mol. Cancer 8, 32–47. doi: 10.1186/1476-4598-8-32
Stone, J. R. (2004). An assessment of proposed mechanisms for sensing hydrogen peroxide in mammalian systems. Arch. Biochem. Biophys. 422, 119–124. doi: 10.1016/j.abb.2003.12.029
Szatrowski, T. P., and Nathan, C. F. (1991). Production of large amounts of hydrogen peroxide by human tumor. Cells Cancer Res. 51, 794–798.
Turrens, J. F. (2003). Mitochondrial formation of reactive oxygen species. J. Physiol. 552, 335–344. doi: 10.1113/jphysiol.2003.049478
Vafa, O., Wade, M., Kern, S., Beeche, M., Pandita, T. K., Hampton, G. M., et al. (2002). c-Myc can induce DNA damage, increase reactive oxygen species, and mitigate p53 function: a mechanism for oncogene-induced genetic instability. Mol. Cell. 9, 1031–1044. doi: 10.1016/S1097-2765(02)00520-8
Vander Heiden, M. G., Cantley, L. C., and Thompson, C. B. (2009). Understanding the Warburg Effect: the metabolic requirements of cell proliferation. Science 324, 1029–1033. doi: 10.1126/science.1160809
Keywords: cancer cell metabolism, warburg effect, glycolysis, oxidative phosphorylation, pentose phosphate pathway, reactive oxygen species
Citation: Molavian HR, Kohandel M and Sivaloganathan S (2016) High Concentrations of H2O2 Make Aerobic Glycolysis Energetically More Favorable for Cellular Respiration. Front. Physiol. 7:362. doi: 10.3389/fphys.2016.00362
Received: 25 March 2016; Accepted: 08 August 2016;
Published: 23 August 2016.
Edited by:
Osbaldo Resendis-Antonio, Instituto Nacional de Medicina Genómica, MexicoCopyright © 2016 Molavian, Kohandel and Sivaloganathan. This is an open-access article distributed under the terms of the Creative Commons Attribution License (CC BY). The use, distribution or reproduction in other forums is permitted, provided the original author(s) or licensor are credited and that the original publication in this journal is cited, in accordance with accepted academic practice. No use, distribution or reproduction is permitted which does not comply with these terms.
*Correspondence: Sivabal Sivaloganathan, ssivalog@uwaterloo.ca