 Petra Cela1,2
 Marek Hampl1,2Katherine K. Fu3
 Michaela Kunova Bosakova4Pavel Krejci4,5
 Joy M. Richman3
 Marcela Buchtova1,2*
- 1Institute of Animal Physiology and Genetics, v.v.i., Academy of Sciences of the Czech Republic, Brno, Czech Republic
- 2Department of Animal Physiology and Immunology, Institute of Experimental Biology, Masaryk University, Brno, Czech Republic
- 3Life Sciences Institute, University of British Columbia, Vancouver, BC, Canada
- 4Department of Biology, Faculty of Medicine, Masaryk University, Brno, Czech Republic
- 5International Clinical Research Center, St. Anne's University Hospital, Brno, Czech Republic
MORN5 (MORN repeat containing 5) is encoded by a locus positioned on chromosome 17 in the chicken genome. The MORN motif is found in multiple copies in several proteins including junctophilins or phosphatidylinositol phosphate kinase family and the MORN proteins themselves are found across the animal and plant kingdoms. MORN5 protein has a characteristic punctate pattern in the cytoplasm in immunofluorescence imaging. Previously, MORN5 was found among differentially expressed genes in a microarray profiling experiment of the chicken embryo head. Here, we provided in situ hybridization to analyse, in detail, the MORN5 expression in chick craniofacial structures. The expression of MORN5 was first observed at stage HH17-18 (E2.5). MORN5 expression gradually appeared on either side of the primitive oral cavity, within the maxillary region. At stage HH20 (E3), prominent expression was localized in the mandibular prominences lateral to the midline. From stage HH20 up to HH29 (E6), there was strong expression in restricted regions of the maxillary and mandibular prominences. The frontonasal mass (in the midline of the face) expressed MORN5, starting at HH27 (E5). The expression was concentrated in the corners or globular processes, which will ultimately fuse with the cranial edges of the maxillary prominences. MORN5 expression was maintained in the fusion zone up to stage HH29. In sections MORN5 expression was localized preferentially in the mesenchyme. Previously, we examined signals that regulate MORN5 expression in the face based on a previous microarray study. Here, we validated the array results with in situ hybridization and QPCR. MORN5 was downregulated 24 h after Noggin and/or RA treatment. We also determined that BMP pathway genes are downstream of MORN5 following siRNA knockdown. Based on these results, we conclude that MORN5 is both regulated by and required for BMP signaling. The restricted expression of MORN5 in the lip fusion zone shown here supports the human genetic data in which MORN5 variants were associated with increased risk of non-syndromic cleft lip with or without cleft palate.
Introduction
The vertebrate face is formed very early in development from the paired maxillary and mandibular prominences and the single frontonasal mass surrounding the oral cavity. These facial prominences arise during early embryogenesis from interactions between neural crest derived mesenchyme and head ectoderm. The frontonasal mass grows out, contacts and fuses together with the maxillary prominences to form the upper jaw. The midline facial skeleton consisting of the nasal septum, prenasal cartilage and premaxilla are all derived from the frontonasal mass (Richman and Lee, 2003). Craniofacial development is complex process coordinated by a network of transcription factors and signaling molecules (Murray and Schutte, 2004; Chai and Maxson, 2006; Jiang et al., 2006; Brunskill et al., 2014; Kurosaka, 2015; Marcucio et al., 2015; Nimmagadda et al., 2015). Disruption of this tightly controlled cascade can result in clefts where the facial prominences fail to meet and fuse (Leslie and Marazita, 2013).
Cleft lip and/or cleft palate are the most common craniofacial birth defects in humans (Setó-Salvia and Stanier, 2014; Watkins et al., 2014). The majority of clefts appear as isolated or non-syndromic clefts, because they occur in isolation from other developmental abnormalities. The causes of clefting are thought to be multifactorial, including an interaction between genes and the environmental factors (Schutte and Murray, 1999; Dixon et al., 2011; Leslie and Marazita, 2013; Setó-Salvia and Stanier, 2014; Watkins et al., 2014). Identification of genes contributing to clefts formation is important not only for our understanding of facial development, but also for improved prevention and treatment of affected individuals. The chicken embryo is a valuable experimental model to study the signals that control lip fusion. The avian primary palate closely resembles the primary palate in mammals (Abramyan et al., 2015). Moreover, the face can be accessed directly in the living embryo through a window in the shell. The disruption of FGF (Szabo-Rogers et al., 2008), BMP (Ashique et al., 2002), SHH (Hu et al., 2015), and WNT signaling (Geetha-Loganathan et al., 2014) causes a cleft lip in chickens that resembles that of humans.
Previously, a microarray study was performed to profile gene expression in individual chicken facial prominences in stage 18 embryos (Buchtová et al., 2010). From the list of genes that were significantly more highly expressed in the maxillary prominence, we selected MORN5 (also known as C9orf113, C9orf18 or FLJ46909) for further studies because it was described as a cleft susceptibility gene (Letra et al., 2010). Microarray analysis revealed 24 times higher expression of MORN5 in the maxillary prominence compared to expression in the frontonasal mass at stage 18, while mandibular prominence showed 10 times higher expression than the frontonasal mass (Buchtová et al., 2010).
Members of the MORN family were named for the presence of multiple MORN motifs (Membrane Occupation and Recognition Nexus). There are five paralogous genes in the MORN family (MORN1-5). Limited functional information is available for a subset of MORN genes. MORN1 has been identified in the parasite Toxoplasma gondii and other Apicomplexan protists where it plays role during cell division (Ferguson et al., 2008; Lorestani et al., 2010). Human MORN2 was found to facilitate phagocytosis-mediated restriction of some bacteria in macrophages (Abnave et al., 2014). Expression of MORN3 was detected in mouse testis, where it regulates spermatogenesis (Zhang et al., 2015). Finally, MORN4 promotes axonal degeneration in mouse sensory axons (Bhattacharya et al., 2012).
In chicken, the MORN5 gene is located on the forward strand of chromosome 17. On the reverse strand, NDUFA8 and LHX6 genes are nearby to the MORN5 gene. The size of the MORN5 gene is 13.5 kb and there are 6 exons (only 5 exons are coding) with four splice variants. The MORN5 gene encodes a protein of 172 amino acids, which contains a histone H3 K4-specific methyltransferase SET7/9 N-terminal domain (SSF82185) and three MORN motifs (Figure 1).
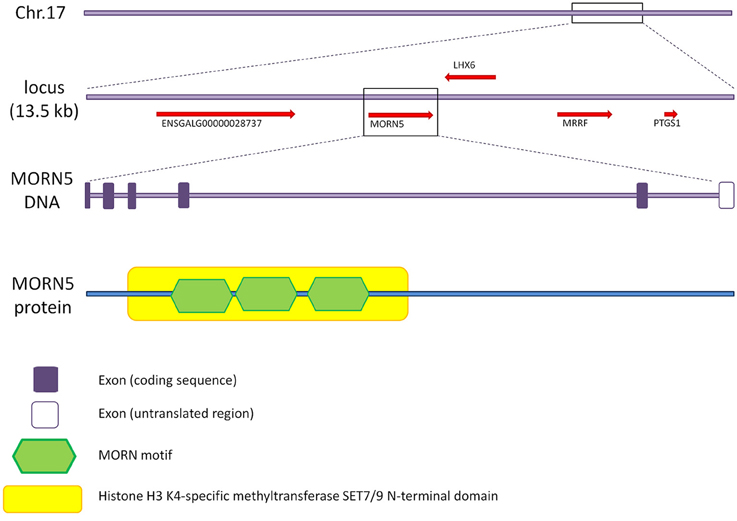
Figure 1. Gene characteristics of chicken MORN5 and domain analysis. MORN5 gene is located on chromosome 17 of the chicken genome and its length is 13.5 kb. The gene is composed of 6 exons where the last one is non-coding. The open reading frame codes for a protein 172 amino acids in length. The gene contains SSF82185 domain and three MORN motifs.
As the gene expression pattern or possible function of MORN5 during development had not been investigated in any animal model, we aim to analyzed chicken MORN5 expression in embryos and its integration into signaling pathways.
Materials and Methods
Embryonic Material
Fertilized chicken eggs (ISA brown) were obtained from the farm Integra (Žabčice, Czech Republic). Eggs were incubated in a humidified forced air incubator at 37.8°C. Embryos were staged and morphological characteristic were described according to Hamburger and Hamilton (1951). All procedures were conducted following a protocol approved by the Laboratory Animal Science Committee of the Institute of Animal Physiology and Genetics (Liběchov, Czech Republic).
Section In situ Hybridization (ISH)
Chicken MORN5 was obtained as chicken EST clone CHEST ID 543 F09 (Biovalley, France), where the probe sequence was cloned into pBluescript II KS+ vector. The entire region containing the probe sequence flanked by T3 and T7 RNA polymerase sites was amplified using M13 primers (forward primer: 5′-GTA AAA CGA CGG CCA G-3′, reverse primer: 5′-CAG GAA ACA GCT ATG AC-3′). Then, the amplicon was isolated via gel purification (QIAquick Gell Extraction Kit, Qiagen, Germany) and this linearized DNA fragment was used in RNA polymerase reactions. DIG labeled antisense riboprobe was synthesized with T3 RNA polymerase (antisense) or with T7 polymerase (sense controls).
Embryos were fixed in 4% paraformaldehyde (PFA), processed through ethanol and xylene into paraffin, and sectioned for ISH. Hybridization was performed with RNA probe at 60°C overnight as described previously (Holland et al., 1996). Anti-digoxigenin sheep antibody conjugated with alkaline phosphatase (1:2000, Roche, USA) was applied overnight at 4°C. Visualization was achieved by incubation with substrates for alkaline phosphatase (BM Purple AP, Roche, Germany) for several days. Slides were then counterstained with eosin. ISH was carried out on at least three embryos for each stage.
Embryo Manipulations
Embryos were treated with beads soaked in All-trans retinoic acid (RA), Noggin protein, Tris or Dimethyl Sulfoxide (DMSO) as described (Lee et al., 2001). Since DMSO was the solvent for RA, we used DMSO bead as a control for RA treatment and Tris as a control for Noggin treatment. AG1-X2 beads (Bio-Rad Laboratories, Hercules, Canada) of 100 μm in diameter were soaked in RA (cat. No. R2625 Sigma) at a concentration of 1 mg/ml for 1 h as previously described (Lee et al., 2001; Nimmagadda et al., 2015). Noggin proteins were soaked into Affigel blue beads (Bio-Rad Laboratories, Hercules, Canada) of 200 μm diameter for a minimum of 1 h at a concentration of 1 mg/ml (cat. No. 1967-NG, R&D Systems, Minneapolis, USA). Control beads were soaked with DMSO or Tris. Two beads were implanted into the maxillary region on the right side of chicken embryo at stage HH15. For ISH and QPCR, samples were collected 24 h post-bead implantation, embedded into paraffin and processed for ISH.
Immunofluorescence on Slides
Embryos were collected at stage HH24 for MORN5 protein detection. Chicken duodenum was used as a control according to the manufacturer's instruction. Samples were fixed in 4% PFA and processed into paraffin. Following deparaffinization and rehydration, antigen retrieval was carried out using citrate buffer for 1 min at 97°C. Polyclonal antibody to MORN5 (1:50, cat. No. NBP1-91230, Novus Biologicals, USA) was applied overnight at 4°C. The secondary anti-rabbit antibody (1:200, Alexa Fluor 594, cat. No. A-21207) was applied for 30 min at RT. Sections were washed in PBS and coverslipped with Prolong Gold anti-fade reagent containing DAPI (cat. No. P36935, Invitrogen, USA).
Quantitative RT-PCR
Gene expression of MORN5 was analyzed on tissues isolated from normal chicken prominences at stage 15, 18, 20, and 26. Moreover, Noggin or RA treated maxillary prominences were dissected 24 h following bead implantation at stage 15. Prominences were pooled from at least 15 embryos to produce one sample and 4 biological replicates were analyzed. Total RNA was extracted using the Mini RNeasy Kit (Qiagen, Germany) according to the manufacturer's instructions. The total RNA concentration and purity of each sample were assessed by spectrophotometry using a NanoDrop1000 (Thermo Scientific, Waltham, USA). First-strand cDNA was synthesized using the SuperScript Vilo cDNA synthesis Kit (cat. No. 11754050, Thermo Fisher, USA). The qPCR was performed in 10 μl final reaction volumes containing the one-step master mix (no AmpErase UNG, cat. No. 4324018, Applied Biosystems, Carlsbad, USA) mixed with MORN5 (TaqMan Assays, Assay ID: AJKAKYV, context sequence: TTCCTGAGAAATGCAGACGATGAGG, FAM-MGB, Applied Biosystems, Austin, USA) on LightCycler® 96 (Roche, Manheim, Germany) with preheating at 95°C/10 min, followed by 40 cycles of 95°C/15 s and 60°C/1 min. Gene expression levels were calculated using ΔΔCT method with normalization against the HPRT1 level (TaqMan Assays, Assay ID: Gg033338900_m1, context sequence: TTGAATCATATCTGTGTGATCAGTG, FAM-MGB, Applied Biosystems, Austin, USA), which was used as the housekeeping gene. Means of 3 technical replicates were generated for each of 3 biological replicates and these values were used for statistical analysis. All procedures were repeated in at least three independent experiments.
Transfection with MORN5 Plasmids in Cell Cultures
The expression vector containing C-terminally FLAG-tagged human MORN5 was obtained from OriGene (Rockville, MD). HEK293T cells were obtained from ATCC (Manassas, VA) and propagated in DMEM media (Sigma-Aldrich, St. Louis, MO) with 10% fetal bovine serum, 1% Pen/Strep and 1% l-glutamin (Invitrogen, Carlsbad, CA). Cells were transfected using FUGENE6 reagent according to manufacturer's protocol (Promega).
HEK293T cells grown on glass coverslips were fixed with 4% PFA (RT/15 min), permeabilized with 0.1%Triton-X100 in PBS (RT/5 min), and incubated with the following antibodies at 4°C overnight: MORN5 (1:100, cat. No. NBP1-91230, Novus Biologicals), FLAG (1:200, cat. No. F1804, Sigma-Aldrich). The secondary antibody AlexaFluor 488 (1:500; cat. No. A21206, Life Technologies) or AlexaFluor 594 (1:500; cat. No. A21203, Life Technologies) were used. Coverslips were mounted into DAPI-containing Mowiol. Images were taken on an LSM700 laser scanning microscope with acquisition done using ZEN Black 2012 software (Zeiss, Jenna, Germany).
siRNA Targeting gMORN5 in Chicken Embryos
Silencer Select custom designed siRNA (gMORN5, cat. No. 4399666, Ambion, Austin, USA) was mixed with FUGENE 6 (Roche, Mannheim, Germany), and then was injected into the maxillary prominence of chicken embryos. Negative siRNA (Silencer select negative control No.1 siRNA, cat. No. 4390843, Ambion, Austin, USA) was used as a control. The first injection of siRNA was performed at stage HH20 and the second one after 24 h about stage HH24. One day later after the second injection, embryos had reached stage HH28 and maxillary prominences were dissected for RNA isolation. Tissues were dissected from 5 embryos to form one sample and three biological samples were used for treated embryos (MORN5 siRNA) as well as for control (Silencer select negative control No.1 siRNA) embryos.
PCR Arrays
Total RNA was extracted from siRNA treated maxillary prominences using the Mini RNeasy Kit (Qiagen, Germany) according to the manufacturer's instructions. First-strand cDNA was synthesized using the SuperScript Vilo cDNA synthesis Kit (cat. No. 11754050, Thermo Fisher, USA). Downregulation of MORN5 expression after injection was first confirmed using qPCR before further processing for PCR Array analysis.
Custom made Chick-bone plates (KRD, Czech Republic) were used for analysis of BMP pathway genes. The PCR arrays were performed in 12 μl final reaction volumes containing SYBR Premix Ex Taq II (cat. No RR0821A, Takara, Japan) on LightCycler® 96 (Roche, Manheim, Germany) with preheating at 95°C/30 min, followed by 45 cycles of 95°C/5 s, 60°C/20 s and 72°C/15 s. Data were statistically evaluated by ΔΔCT method with normalization against HPRT1 levels. In each PCR array plate, there were three technical replicates for 24 genes, and 2 technical replicates for an additional 13 genes.
Statistical Analysis
All results were expressed as means ± standard deviations (SD) of three samples for each treatment and were compared by unpaired two-tailed Student's t-test for qPCR and PCR Array. Differences were considered to be significant at p < 0.05.
Results
Spatiotemporal Gene Expression Pattern of MORN5 in Facial Prominences
First, we analyzed spatiotemporal expression pattern of MORN5 in individual prominences of chicken face. Facial prominences begin to form during early embryonic development. In situ hybridization showed no expression in chicken face at Hamburger-Hamilton (HH) stage 15 (50–55 h of incubation, Figures 2A–C) which is shortly after neural crest cells have entered the face. Later at stage HH17 (52-64 h of incubation, Figures 2D–F), MORN5 expression appeared in the caudal part of the presumptive maxillary mesenchyme close to the maxillo-mandibular cleft. At stage HH18, the bulge of the maxillary prominence contained high levels of MORN5 transcripts (65–69 h of incubation, Figures 2G–I). Expression was also detected in the dorsal (oral side) part of the mandibular prominences close to the maxillo-mandibular cleft (Figures 2G,H). At stage HH20 (70–72 h of incubation), there continued to be restricted expression in caudal and medial domains within the maxillary prominences (Figures 3A–C). In the mandibular prominences, there was expression in the cranial mesenchyme on either side of the midline groove (Figures 3A–O) with the exceptions of mesenchymal condensations of Meckel's cartilage (Figures 3B,C). At stage HH24 (4 days of incubation), maxillary prominence enlarged and strong MORN5 expression was present throughout the mesenchyme (Figures 3E–G). Mandibular expression was similar to stage HH20 (Figures 2E–G). Thus, MORN5 is expressed in a restricted pattern in neural crest-derived mesenchyme but not in epithelium. Sense probe did not show signal in the maxillary prominence (Figures 3D,H,L,P).
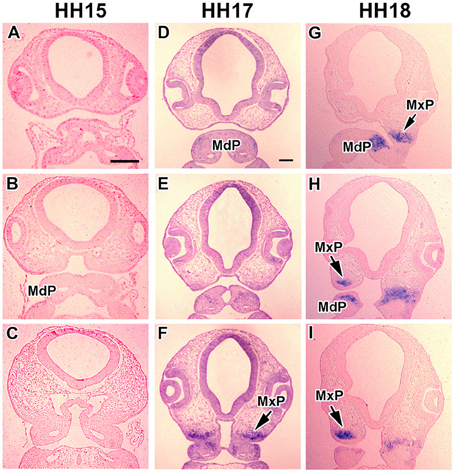
Figure 2. Gene expression of MORN5 in early chicken face. (A–C) Frontal sections of chicken face at stage HH15. (D–F) Frontal sections of chicken face at stage 17. (D,E) In the ventral part of maxillary and mandibular prominences, there was no expression. (F) MORN5 expression gradually appeared dorsally in caudal part of maxillary region. (G–I) Frontal sections of chicken face at stage HH18. MORN5 expression was strong in maxilla and also in central part of each mandibular prominence (G). MdP, mandibular prominence; MxP, maxillary prominence. Scale bars = 100 μm.
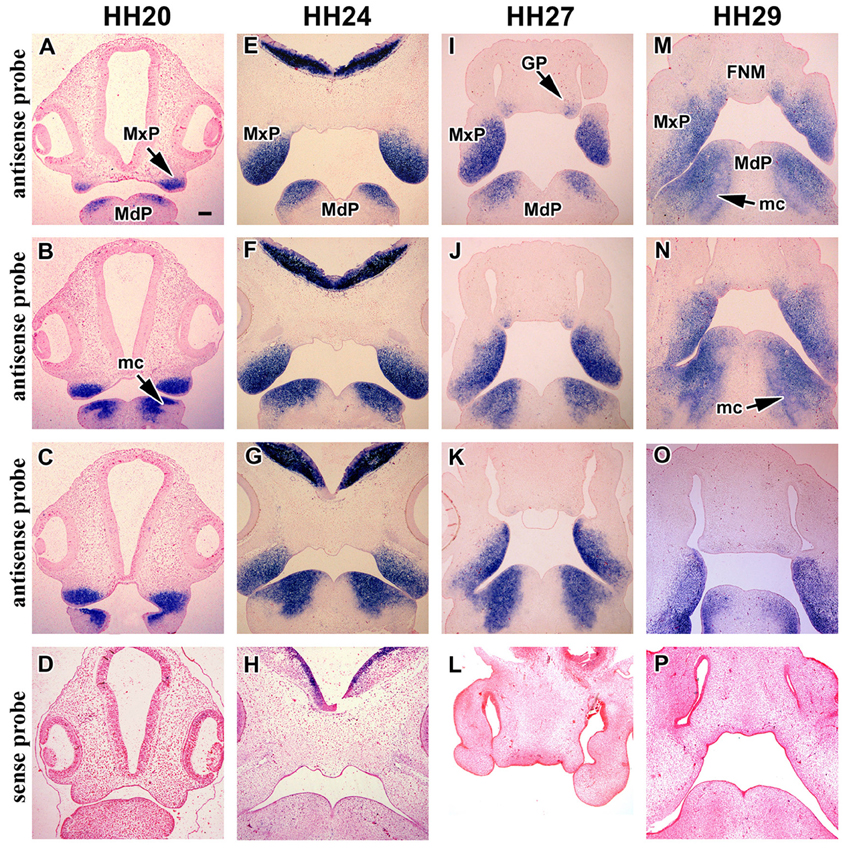
Figure 3. Gene expression of MORN5 in later stages of chicken embryo. (A–C) ISH analysis in frontal sections of chicken head at stage HH20. There was strong expression in the maxillary prominence. The expression appeared in the cranial part in each mandibular prominence and it continued in dorsal direction. (B) No expression was observed in mesenchymal condensations and close to the fusion region of mandibular prominences. (E–G) MORN5 expression in frontal section of chicken head at stage HH24. MORN5 expression was strong in the mesenchyme of maxillary prominences. MORN5 expression was localized in the dorsal part of mandibular prominence, but not in mesenchymal condensation and close to the midline. (I–K) Frontal sections of chicken head at stage HH27 showed prominent expression in the maxillary prominence. There was weak expression in the globular process. Prominent expression was observed in rostral part of maxillary prominence and also in the mandibular prominence with the exception of midline. (M–O) Frontal sections of chicken head at stage 29 where beak is evident. MORN5 expression was localized in rostral part of maxilla and in fusion region. In the mandibular prominence, there was strong expression but not in the midline. (D,H,L,P) ISH analysis using sense probe. FNM, frontonasal mass; GP, globular process; mc, mesenchymal condensation; MdP, mandibular prominence; MxP, maxillary prominence. Scale bars = 100 μm.
MORN5 Expression in the Lip Fusion Zone at Later Stages
The next critical phase of facial morphogenesis is the fusion of the lip. Between stage HH27–29, the cranial-medial edges of the maxillary prominences meet the lateral corners of medial nasal prominences (globular processes) and fuse (Abramyan et al., 2015). At stage HH27 (5 days of incubation), MORN5 expression was observed for the first time in the corners of the frontonasal mass (globular processes, Figures 3I,J). Expression in the maxillary prominences was high in the rostral-medial corner just where fusion with the globular processes will take place. There continued to be expression in the mandibular prominences similar to stage 24 (Figures 3I–K). At stage HH29 (6 days of incubation), MORN5 expression was located in the region of lip fusion (Figures 3M,N) as well as in the mandible. This is the first stage where expression of MORN5 in Meckel's cartilage was detected (Figure 3M). Further confirmation of the restricted expression in the lip fusion zone is shown in other embryos cut in the frontal (Figures 4A–C) or transverse plane at stage HH29 (Figures 4A–F). Note that mesenchymal bridging has taken place by stage HH29, unifying the domains of expression of MORN5 in the globular processes and maxillary prominences (Figures 4B,C).
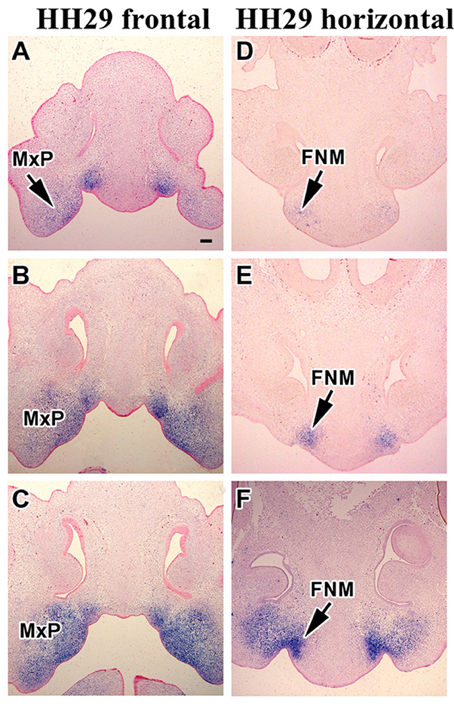
Figure 4. MORN5 expression in the fusion region at stage 29. (A–C) Frontal sections of chicken head showed strong expression in the maxilla and in the area where edges of the maxillary prominences grow together with medial nasal prominence. (D–F) Horizontal sections of chicken head. (E) Region of fusion had prominent MORN5 expression. (F) More caudal section (other sample). Scale bars = 100 μm.
To quantify the relative levels of expression between the stages of development, we performed QPCR for evaluation of MORN5 expression level in each prominence at four different stages (HH15, 18, 20, 26). Since stage HH15, we did not observe any expression of MORN5 by ISH, this level of expression was chosen as the reference value for ΔΔCt analysis for individual prominences. In the maxillary prominence, MORN5 expression gradually increased during development with the peak level seen at stage HH20 (Figure 5A). In the mandibular prominence, we observed significantly increased expression at stage HH20 and 26 compared to stage HH15 embryos (Figure 5B). In the frontonasal mass, MORN5 expression is very low except of the globular processes we were surprised to see a statistically significant increase in expression of stage HH20 embryos (Figure 5C). In the section of in situ experiments, we could not detect MORN5 at stage HH20 (data not shown) therefore sensitivity of QPCR is greater than in situ hybridization. By stage HH27, there is expression of MORN5 in the in situ experiments; however, QPCR data did not pick up a significant expression level in stage HH26 embryos (Figure 5C). Some of the variability may be due to the dissection process and whether the globular process was included in all the samples. We did not compare expression levels between the facial prominences due to the experimental design.
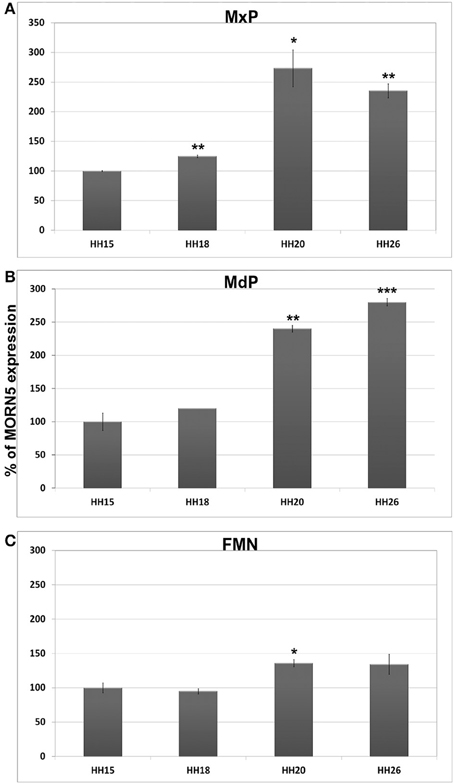
Figure 5. QPCR analysis of MORN5 expression during face development. (A) In the maxillary prominence, there was most prominent expression at stage HH20. All analyzed stages showed statistically significant overexpression in comparison to stage HH15. (B) In the mandibular prominence, we observed significant expression at stage HH20 and 26. (C) Very low MORN5 expression was detected in the frontonasal mass at stage HH15 and 18, but at stage HH20 was MORN5 expression significantly increased. FNM, frontonasal mass; MdP, mandibular prominence; MxP, maxillary prominence. t-test; ***p < 0.001, **0.001 < p < 0.01, *p < 0.05.
MORN5 Protein Expression in the Face
To correlate MORN5 protein distribution with MORN5 gene expression, we performed immunofluorescence staining. MORN5 protein was localized in developing chicken face at stage HH24, with the most prominent expression in individual cells in the maxillary and mandibular prominences (Figures 6A–H). Thus, only a subset of cells expressing MORN5 RNA expresses the protein. In positive control (adult chicken intestine), there was expected signal in Goblet cells, in the apical parts of enterocytes and in fibroblasts of the lamina propria (Figures 6I–L).
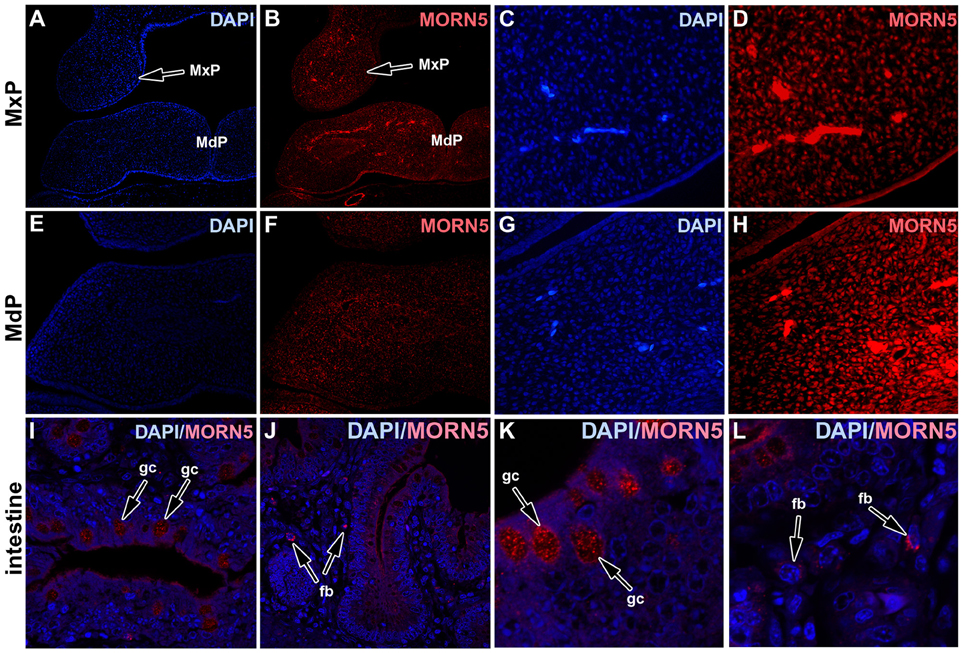
Figure 6. MORN5 protein detected by immunofluorescent labeling. (B,D) MORN5 protein was localized in the maxillary prominences at stage HH24. (F,H) In the mandibular prominence, there is very low signal in the mesenchyme. MORN5 expression showed dispersed pattern of distribution. (A,C,E,G) DAPI staining. (I–L) Chicken intestine was used as a positive control with strong positivity in Goblet cells (gc), in the apical parts of enterocytes and also spotted expression in fibroblasts (fb). MdP, mandibular prominence; MxP, maxillary prominence.
The specificity of the MORN5 antibody was also confirmed in HEK293T cells transfected with a MORN5-FLAG plasmid (Figures 7A–C). The staining of MORN5 and FLAG antibodies overlapped (Figures 7A–C). Similar to tissue section data, exogenous MORN5 protein was found in the cytoplasm in a punctate pattern (Figures 7D,E).
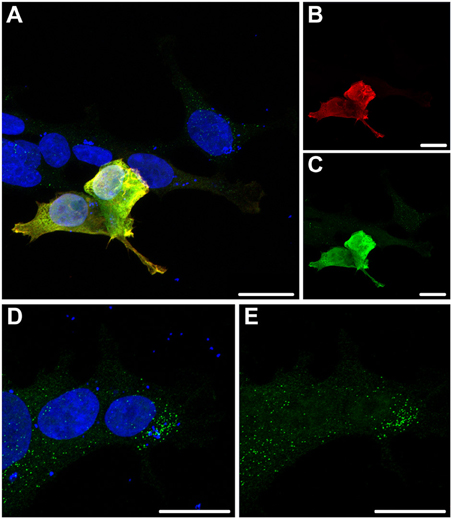
Figure 7. Cytosolic spotted pattern of MORN5 expression in HEK293T cells. (A–C) HEK293T cells were transfected with FLAG-tagged MORN5-expressing vector and immunostained using both FLAG and MORN5 antibodies. Cells expressing transgenic MORN5 were also MORN5-positive pointing to the specificity of the antibody. (D,E) In addition, a cytosolic spotted pattern of MORN5 expression was present in non-transfected cells. Scale bars = 100 μm.
Downregulation of MORN5 after Noggin a Retinoic Acid Treatment
Our study uncovered high levels of MORN5 expression in normal chicken embryos, however a previous study from our group discovered that MORN5 was downregulated in an experimental paradigm involving beads implanted into the chicken face (Nimmagadda et al., 2015). Beads soaked in the bone morphogenetic protein antagonist, Noggin and retinoic acid (RA) synergistically induced transformation of the maxillary prominence into the frontonasal mass (Lee et al., 2001). The tissues from embryos induced to form this duplicated beak were profiled using microarrays. A significant downregulation of MORN5 expression was observed in all the treatment groups compared to controls treated with DMSO-Tris beads (-3.77-fold Noggin-DMSO treatment, -3.68-fold Noggin-RA, -2-fold after RA-Tris treatment) (Nimmagadda et al., 2015). We wanted to follow up this findings since it appeared that the RA and BMP pathways were upstream regulators of MORN5 and that possibly MORN5 was one of a set of genes mediating the beak duplication phenotype. First, we validated the array results using QPCR on maxillary tissues collected from treated and control embryos. We found a significant downregulation of MORN5 after Nogin-RA and Noggin-DMSO treatment compared to Tris-DMSO controls (Figure 8A). Next, we asked whether there were any spatial differences in MORN5 expression induced by the bead implants using in situ hybridization. Control embryos implanted with beads soaked in DMSO-Tris showed strong expression in the maxillary region and maxillo-mandibular cleft (Figure 8B). In contrast, no expression was observed in the maxillary prominence of Noggin-RA or Noggin-DMSO treated embryos. Interestingly, there was residual expression of MORN5 observed in embryos treated with RA-Tris located just under the epithelium of maxilla-mandibular cleft (Figure 8B).
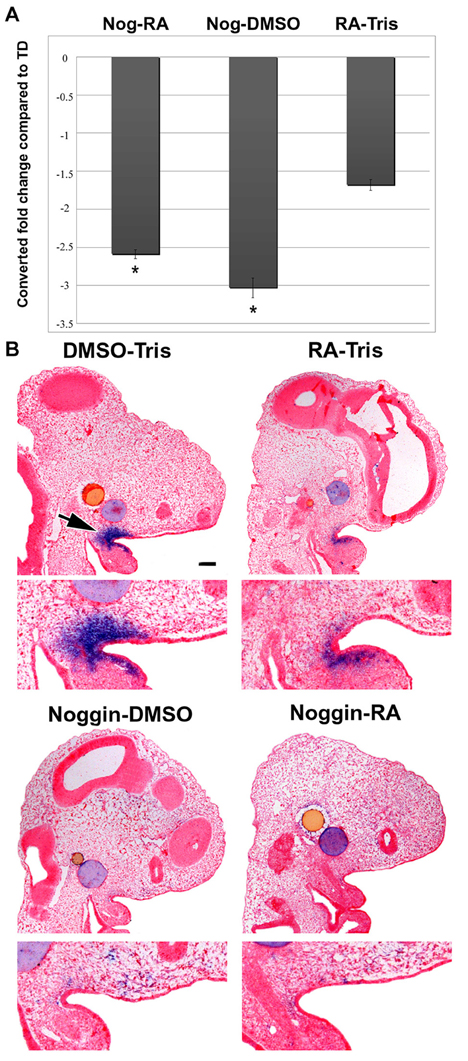
Figure 8. QPCR analysis and ISH of MORN5 expression after bead implantation. (A) QPCR analysis showed 1.68 times downregulation after RA-Tris, 3.03 after Noggin-DMSO and 2.59 after Noggin-RA treatment in comparison to control DMSO-Tris. (B) Control embryos implanted with beads soaked in DMSO-Tris had strong expression in maxillary region and maxilla-mandibular cleft. In RA-Tris treated embryos was very weak MORN5 expression. After Noggin-DMSO treatment, expression was rapidly decreased. No expression of MORN5 was observed after Noggin-RA treatment. Nog, Noggin; RA, Retinoic acid; TD, Tris-DMSO. Scale bars = 100 μm. t-test; *p < 0.05.
Downregulation of MORN5 by siRNA Altered Gene Expression of BMP and TGFβ Pathways Members
We had discovered that BMP activity was required for MORN5 expression but next wanted to investigate the genes that might be downstream of MORN5. As the first group of potential targets, we studied genes that are known to be in the BMP pathway. MORN5 expression in the maxillary prominence was downregulated to 75% of control levels following transfection with siRNA (2 rounds of transfection: at stage 20 and 24; Figure 9A). We used a PCR array that included 34 genes specific for the BMP pathway with HPRT1 acting as the reference control gene (Table S1).
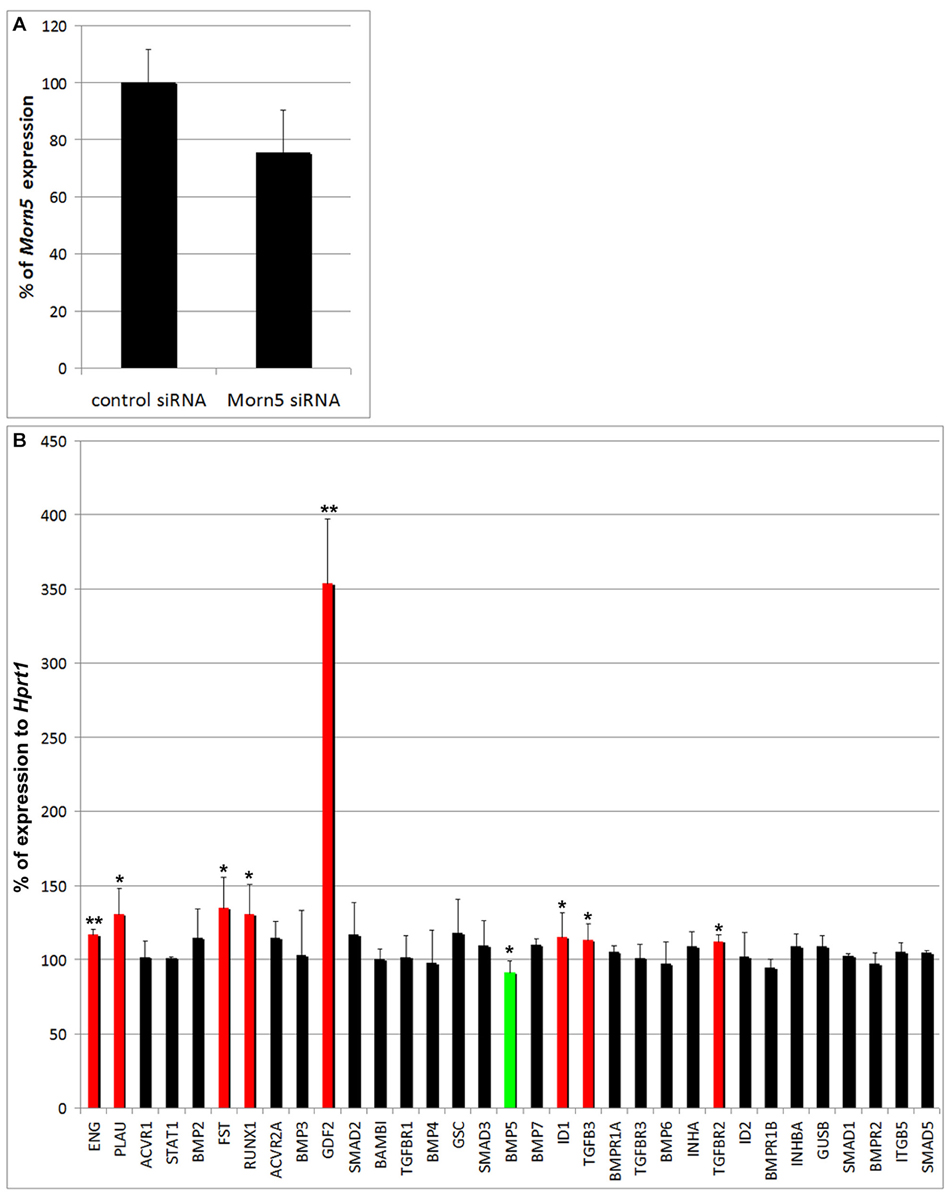
Figure 9. BMP pathway gene expression after MORN5 downregulation. (A) Downregulation of MORN5 expression after siRNA treatment. (B) MORN5 downregulation caused significant increase in GDF2, ENG, TGFBR2, TGFB3, PLAU, FST, RUNX1, and ID1 expression. Statistically significant downregulation was observed only in case of BMP5. t-test; **0.001 < p < 0.01, *p < 0.05.
Eight genes showed a statistically significant increase in their expression caused by partial MORN5 silencing (Figure 9B). These included ENG (Endoglin), Gdf2 (Growth differentiation factor 2, also BMP9), PLAU (plasminogen activator, urokinase), FST (Follistatin), Runx1 (Runt-related transcription factor 1), ID1 (Inhibitor of DNA binding 1), TGFβR2 (Transforming growth factor beta receptor 2) and TGFβ3 (Figure 9B). The most striking increase was seen with GDF2 (increased 3.5-fold). Statistically significant downregulation was observed only in the case of BMP5 (Figure 9B). It is interesting that MORN5 normally represses ID1, a transcription factor that positively regulates BMP signaling. Although levels of ID1 were increased, which should imply higher BMP signaling, there is also decreased expression of the BMP5 ligand. It is likely that cytoplasmic MORN5 indirectly regulates the expression of these genes and that further work is needed to determine the intermediate mediators of BMP and TGFβ signaling affected by MORN5.
Discussion
Here, we found spatially and temporally restricted expression of MORN5 in the face area during embryonic development suggesting its role in patterning of the maxillary prominences. Moreover, there was expression in the globular processes of frontonasal mass just before their fusion with the maxillary prominences. Previously, a human genetics study found that MORN5 was associated with non-syndromic cleft lip with or without cleft palate (NSCLP) (Letra et al., 2010). We are the first to document expression of MORN5 in the relevant parts of the face undergoing lip fusion. In addition, there is strong expression on the medial sides of the maxillary prominences, the sites where palatal shelves will arise. While the chicken has a naturally cleft palate, it is interesting that MORN5 is expressed in the intermediate stages of palatal shelf formation. Based on previous microarray studies carried out on the chicken face, MORN5 came up twice, once as a maxillary enriched gene (Buchtová et al., 2010) and second as a differentially expressed gene following Noggin and RA bead implants (Nimmagadda et al., 2015). Taken together, the human genetic and chicken data suggest that MORN5 is an important maxillary patterning and possibly lip fusion gene. Thus, it would be worthwhile targeting MORN5 using mouse models and to include this gene in human NSLCP studies.
Complex signaling interactions coordinate the outgrowth of facial prominences to form the adult face. Some of factors have been previously identified by whole genome expression screens or by candidate gene mapping. The BMP signaling pathway regulates many cellular processes of craniofacial development and it is necessary for mesenchymal outgrowth of facial prominences. The expression of BMPs in chicken face was found at the time prior and during lip fusion (Ashique et al., 2002). BMP4 transcripts were previously detected in the epithelium of the globular processes of frontonasal mass and MORN5 expression underlays the same area however entirely in the mesenchyme. Also in the maxillary and mandibular prominences, epithelial BMP4 expression was described in parallel areas to mesenchymal MORN5. Furthermore, BMP2 and BMP7 were previously detected in the mesenchyme of both facial prominences. Maxillary and mandibular prominences express also several downstream target of BMP signaling. MSX1 is strongly expressed in the maxillary prominence but in slightly different pattern than MORN5 in the mandible (Shigetani et al., 2000; Fuchs et al., 2010). There are additional transcription factors that appear to overlap with MORN5 specifically in the frontonasal mass globular processes and maxillary prominences, TBX22, DLX5, and MSX2 (Higashihori et al., 2010). These transcription factors may regulate expression of MORN5. Interestingly, in the microarray study on beak duplicated embryos, TBX22 was upregulated following Noggin-RA treatment and TBX22 acts as a transcriptional repressor. It will be necessary to analyze whether MORN5 is a target of TBX22 which is a known clefting gene in humans (Kantaputra et al., 2011). It is interesting to note that the gene LHX6 which is located 3′ to MORN5 on the opposite strand was reported to be highly expressed in the chicken face (Washbourne and Cox, 2006). Expression of LHX6 begins in the maxillo-mandibular cleft at stage 18 similar to MORN5 (Washbourne and Cox, 2006). There is also striking similarity of expression of LHX6 in the globular processes and medial maxillary prominences at stage 27. This suggests that the two genes may share some common enhancers that drive expression in particular regions of the face.
MORN5 knockdown revealed indirect roles for this gene in controlling the expression of BMP and TGFB signaling pathways. Since we have shown MORN5 is a cytoplasmic protein it is unlikely that it is directly involved in regulating gene transcription. Further biochemical studies are needed to determine the exact function of MORN5 in the cell. Nevertheless, the RNA changes we observed suggest a subset of genes are dependent on MORN5 for their expression. We did not study the TGFB pathway in our bead implantation studies; therefore, the PCR array data extended our original findings on MORN5 function. The most highly upregulated gene, GDF2, is known to associate with Endoglin (Castonguay et al., 2011) a glycoprotein located on cell surfaces that serves as a co-receptor for members of the Transforming growth factor-β superfamily (Cheifetz et al., 1992). This suggests that activity of TGFβ family is normally repressed by MORN5. Other changes such as the increase in the antagonist FST (Follistatin) may indicate that MORN5 operates in another way to regulate TGF signaling. MORN5 may normally repress this antagonist, which binds members of the TGFβ superfamily with a particular focus on activin (Lambert-Messerlian et al., 2007). We have shown that FST does not induce skeletal changes in the palate as compared to Noggin (Celá et al., 2016) therefore FST regulation by MORN5 may serve different functions outside of facial morphogenesis. Several other genes known to be in the TGFB pathway and essential for mouse palate development were upregulated including RUNX1 (Yamashiro et al., 2002), TGFβ3 (Cui et al., 1998) and ID1 (Rice et al., 2005). In summary, we discovered that MORN5 is involved in TGFB signaling at all levels. In conclusion, BMP signaling is required for MORN5 expression and reduction of MORN5 derepresses several genes in the BMP and TGFβ signaling pathways. Furthermore, MORN5 has two potential roles in facial patterning, to specify maxillary identity and to regulate lip fusion that warrant further study in animal models.
Author Contributions
MB, JR, and PC conceived the study. PC, MH, KF, MK conducted the experiments. PK provided intellectual contribution. PC, JR, and MB wrote the manuscript. All authors reviewed and approved the final manuscript.
Conflict of Interest Statement
The authors declare that the research was conducted in the absence of any commercial or financial relationships that could be construed as a potential conflict of interest.
Acknowledgments
This study was supported by the Grant Agency of the Czech Republic (14-37368G to MB lab), Agency for Healthcare Research of the Czech Republic (15-33232A to PK lab) and institutional support (RVO:67985904).
Supplementary Material
The Supplementary Material for this article can be found online at: http://journal.frontiersin.org/article/10.3389/fphys.2016.00378
References
Abnave, P., Mottola, G., Gimenez, G., Boucherit, N., Trouplin, V., Torre, C., et al. (2014). Screening in planarians identifies MORN2 as a key component in LC3-associated phagocytosis and resistance to bacterial infection. Cell Host Microbe. 16, 338–350. doi: 10.1016/j.chom.2014.08.002
Abramyan, J., Thivichon-Prince, B., and Richman, J. M. (2015). Diversity in primary palate ontogeny of amniotes revealed with 3D imaging. J. Anat. 226, 420–433. doi: 10.1111/joa.12291
Ashique, A. M., Fu, K., and Richman, J. M. (2002). Endogenous bone morphogenetic proteins regulate outgrowth and epithelial survival during avian lip fusion. Development 129, 4647–4660.
Bhattacharya, M. R., Gerdts, J., Naylor, S. A., Royse, E. X., Ebstein, S. Y., Sasaki, Y., et al. (2012). A model of toxic neuropathy in Drosophila reveals a role for MORN4 in promoting axonal degeneration. J. Neurosci. 32, 5054–5061. doi: 10.1523/JNEUROSCI.4951-11.2012
Brunskill, E. W., Potter, A. S., Distasio, A., Dexheimer, P., Plassard, A., Aronow, B. J., et al. (2014). A gene expression atlas of early craniofacial development. Dev. Biol. 391, 133–146. doi: 10.1016/j.ydbio.2014.04.016
Buchtová, M., Kuo, W. P., Nimmagadda, S., Benson, S. L., Geetha-Loganathan, P., Logan, C., et al. (2010). Whole genome microarray analysis of chicken embryo facial prominences. Dev. Dyn. 239, 574–591. doi: 10.1002/dvdy.22135
Castonguay, R., Werner, E. D., Matthews, R. G., Presman, E., Mulivor, A. W., Solban, N., et al. (2011). Soluble endoglin specifically binds bone morphogenetic proteins 9 and 10 via its orphan domain, inhibits blood vessel formation, and suppresses tumor growth. J. Biol. Chem. 286, 30034–30046. doi: 10.1074/jbc.M111.260133
Celá, P., Buchtová, M., Veselá, I., Fu, K., Bogardi, J. P., Song, Y., et al. (2016). BMP signaling regulates the fate of chondro-osteoprogenitor cells in facial mesenchyme in a stage-specific manner. Dev. Dyn. 245, 947–962. doi: 10.1002/dvdy.24422
Chai, Y., and Maxson, R. E. Jr. (2006). Recent advances in craniofacial morphogenesis. Dev. Dyn. 235, 2353–2375. doi: 10.1002/dvdy.20833
Cheifetz, S., Bellón, T., Calés, C., Vera, S., Bernabeu, C., Massagué, J., et al. (1992). Endoglin is a component of the transforming growth factor-beta receptor system in human endothelial cells. J. Biol. Chem. 267, 19027–19030.
Cui, X. M., Warburton, D., Zhao, J., Crowe, D. L., and Shuler, C. F. (1998). Immunohistochemical localization of TGF-beta type II receptor and TGF-beta3 during palatogenesis in vivo and in vitro. Int. J. Dev. Biol. 42, 817–820.
Dixon, M. J., Marazita, M. L., Beaty, T. H., and Murray, J. C. (2011). Cleft lip and palate: understanding genetic and environmental influences. Nat. Rev. 12, 167–178. doi: 10.1038/nrg2933
Ferguson, D. J., Sahoo, N., Pinches, R. A., Bumstead, J. M., Tomley, F. M., and Gubbels, M. J. (2008). MORN1 has a conserved role in asexual and sexual development across the apicomplexa. Eukaryot. Cell 7, 698–711. doi: 10.1128/EC.00021-08
Fuchs, A., Inthal, A., Herrmann, D., Cheng, S., Nakatomi, M., Peters, H., et al. (2010). Regulation of Tbx22 during facial and palatal development. Dev. Dyn. 239, 2860–2874. doi: 10.1002/dvdy.22421
Geetha-Loganathan, P., Nimmagadda, S., Fu, K., and Richman, J. M. (2014). Avian facial morphogenesis is regulated by c-Jun N-terminal kinase/planar cell polarity (JNK/PCP) wingless-related (WNT) signaling. J. Biol. Chem. 289, 24153–24167. doi: 10.1074/jbc.M113.522003
Hamburger, V., and Hamilton, H. L. (1951). A series of normal stages in the development of the chick embryo. J. Morphol. 88, 49–92.
Higashihori, N., Buchtová, M., and Richman, J. M. (2010). The function and regulation of TBX22 in avian frontonasal morphogenesis. Dev. Dyn. 239, 458–473. doi: 10.1002/dvdy.22182
Holland, L. Z., Holland, P. W. H., and Holland, N. D. (1996). “Revealing homologies between body parts of distantly related animals by in situ hybridization to developmental genes: amphioxus vs. vertebrates,” in Molecular Zoology: Advances, Strategies, and Protocols, eds J. D. P. Ferraris (New York, NY: Wiley), 267–282.
Hu, D., Young, N. M., Li, X., Xu, Y., Hallgrímsson, B., and Marcucio, R. S. (2015). A dynamic Shh expression pattern, regulated by SHH and BMP signaling, coordinates fusion of primordia in the amniote face. Development 142, 567–574. doi: 10.1242/dev.114835
Jiang, R., Bush, J. O., and Lidral, A. C. (2006). Development of the upper lip: morphogenetic and molecular mechanisms. Dev. Dyn. 235, 1152–1166. doi: 10.1002/dvdy.20646
Kantaputra, P. N., Paramee, M., Kaewkhampa, A., Hoshino, A., Lees, M., McEntagart, M., et al. (2011). Cleft lip with cleft palate, ankyloglossia, and hypodontia are associated with TBX22 mutations. J. Dent. Res. 90, 450–455. doi: 10.1177/0022034510391052
Kurosaka, H. (2015). The roles of hedgehog signaling in upper lip formation. Biomed Res. Int. 2015:901041. doi: 10.1155/2015/901041
Lambert-Messerlian, G., Eklund, E., Pinar, H., Tantravahi, U., and Schneyer, A. L. (2007). Activin subunit and receptor expression in normal and cleft human fetal palate tissues. Pediatr. Dev. Pathol. 10, 436–445. doi: 10.2350/06-05-0087.1
Lee, S. H., Fu, K. K., Hui, J. N., and Richman, J. M. (2001). Noggin and retinoic acid transform the identity of avian facial prominences. Nature 414, 909–912. doi: 10.1038/414909a
Leslie, E. J., and Marazita, M. L. (2013). Genetics of cleft lip and cleft palate. Am. J. Med. Genet. 163C, 246–258. doi: 10.1002/ajmg.c.31381
Letra, A., Menezes, R., Govil, M., Fonseca, R. F., McHenry, T., Granjeiro, J. M., et al. (2010). Follow-up association studies of chromosome region 9q and nonsyndromic cleft lip/palate. Am. J. Med. Genet. 152A, 1701–1710. doi: 10.1002/ajmg.a.33482
Lorestani, A., Sheiner, L., Yang, K., Robertson, S. D., Sahoo, N., Brooks, C. F., et al. (2010). A Toxoplasma MORN1 null mutant undergoes repeated divisions but is defective in basal assembly, apicoplast division and cytokinesis. PLoS ONE 5:e12302. doi: 10.1371/journal.pone.0012302
Marcucio, R., Hallgrimsson, B., and Young, N. M. (2015). Facial morphogenesis: physical and molecular interactions between the brain and the face. Curr. Top. Dev. Biol. 115, 299–320. doi: 10.1016/bs.ctdb.2015.09.001
Murray, J. C., and Schutte, B. C. (2004). Cleft palate: players, pathways, and pursuits. J. Clin. Invest. 113, 1676–1678. doi: 10.1172/JCI200422154
Nimmagadda, S., Buchtová, M., Fu, K., Geetha-Loganathan, P., Hosseini-Farahabadi, S., Trachtenberg, A. J., et al. (2015). Identification and functional analysis of novel facial patterning genes in the duplicated beak chicken embryo. Dev. Biol. 407, 275–288. doi: 10.1016/j.ydbio.2015.09.007
Rice, R., Thesleff, I., and Rice, D. P. (2005). Regulation of twist, snail, and Id1 is conserved between the developing murine palate and tooth. Dev. Dyn. 234, 28–35. doi: 10.1002/dvdy.20501
Richman, J. M., and Lee, S. H. (2003). About face: signals and genes controlling jaw patterning and identity in vertebrates. Bioessays 25, 554–568. doi: 10.1002/bies.10288
Schutte, B. C., and Murray, J. C. (1999). The many faces and factors of orofacial clefts. Hum. Mol. Genet. 8, 1853–1859. doi: 10.1093/hmg/8.10.1853
Setó-Salvia, N., and Stanier, P. (2014). Genetics of cleft lip and/or cleft palate: association with other common anomalies. Eur. J. Med. Genet. 57, 381–393. doi: 10.1016/j.ejmg.2014.04.003
Shigetani, Y., Nobusada, Y., and Kuratani, S. (2000). Ectodermally derived FGF8 defines the maxillomandibular region in the early chick embryo: epithelial-mesenchymal interactions in the specification of the craniofacial ectomesenchyme. Dev. Biol. 228, 73–85. doi: 10.1006/dbio.2000.9932
Szabo-Rogers, H. L., Geetha-Loganathan, P., Nimmagadda, S., Fu, K. K., and Richman, J. M. (2008). FGF signals from the nasal pit are necessary for normal facial morphogenesis. Dev. Biol. 318, 289–302. doi: 10.1016/j.ydbio.2008.03.027
Washbourne, B. J., and Cox, T. C. (2006). Expression profiles of cIRF6, cLHX6 and cLHX7 in the facial primordia suggest specific roles during primary palatogenesis. BMC Dev. Biol. 6:18. doi: 10.1186/1471-213X-6-18
Watkins, S. E., Meyer, R. E., Strauss, R. P., and Aylsworth, A. S. (2014). Classification, epidemiology, and genetics of orofacial clefts. Clin. Plast. Surg. 41, 149–163. doi: 10.1016/j.cps.2013.12.003
Yamashiro, T., Aberg, T., Levanon, D., Groner, Y., and Thesleff, I. (2002). Expression of Runx1, -2 and -3 during tooth, palate and craniofacial bone development. Gene Expr. Patterns 2, 109–112. doi: 10.1016/S0925-4773(02)00298-8
Keywords: cleft lip, maxillary prominence, mandibular prominence, frontonasal mass, BMP
Citation: Cela P, Hampl M, Fu KK, Kunova Bosakova M, Krejci P, Richman JM and Buchtova M (2016) MORN5 Expression during Craniofacial Development and Its Interaction with the BMP and TGFβ Pathways. Front. Physiol. 7:378. doi: 10.3389/fphys.2016.00378
Received: 05 June 2016; Accepted: 17 August 2016;
Published: 31 August 2016.
Edited by:
Thimios Mitsiadis, University of Zurich, SwitzerlandReviewed by:
Amel Gritli-Linde, University of Gothenburg, SwedenJavier Catón, CEU San Pablo University, Spain
David Clouthier, University of Colorado Anschutz Medical Campus, USA
Copyright © 2016 Cela, Hampl, Fu, Kunova Bosakova, Krejci, Richman and Buchtova. This is an open-access article distributed under the terms of the Creative Commons Attribution License (CC BY). The use, distribution or reproduction in other forums is permitted, provided the original author(s) or licensor are credited and that the original publication in this journal is cited, in accordance with accepted academic practice. No use, distribution or reproduction is permitted which does not comply with these terms.
*Correspondence: Marcela Buchtova, buchtova@iach.cz