 Jorge A. Lobato-Álvarez1María L. Roldán1Teresa del Carmen López-Murillo1
 Ricardo González-Ramírez2
 José Bonilla-Delgado3
 Liora Shoshani1*
- 1Laboratory of Epithelial Research, Department of Physiology, Biophysics and Neurosciences, CINVESTAV-IPN, México City, Mexico
- 2Department of Molecular Biology and Histocompatibility, Hospital General Dr. Manuel Gea González, México City, Mexico
- 3Research Unit, Laboratory of Genetics and Molecular Diagnosis, Hospital Juárez de México, México City, Mexico
Na+, K+-ATPase, or the Na+ pump, is a key component in the maintenance of the epithelial phenotype. In most epithelia, the pump is located in the basolateral domain. Studies from our laboratory have shown that the β1 subunit of Na+, K+-ATPase plays an important role in this mechanism because homotypic β1-β1 interactions between neighboring cells stabilize the pump in the lateral membrane. However, in the retinal pigment epithelium (RPE), the Na+ pump is located in the apical domain. The mechanism of polarization in this epithelium is unclear. We hypothesized that the apical polarization of the pump in RPE cells depends on the expression of its β2 subunit. ARPE-19 cells cultured for up to 8 weeks on inserts did not polarize, and Na+, K+-ATPase was expressed in the basolateral membrane. In the presence of insulin, transferrin and selenic acid (ITS), ARPE-19 cells cultured for 4 weeks acquired an RPE phenotype, and the Na+ pump was visible in the apical domain. Under these conditions, Western blot analysis was employed to detect the β2 isoform and immunofluorescence analysis revealed an apparent apical distribution of the β2 subunit. qPCR results showed a time-dependent increase in the level of β2 isoform mRNA, suggesting regulation at the transcriptional level. Moreover, silencing the expression of the β2 isoform in ARPE-19 cells resulted in a decrease in the apical localization of the pump, as assessed by the mislocalization of the α2 subunit in that domain. Our results demonstrate that the apical polarization of Na+, K+-ATPase in RPE cells depends on the expression of the β2 subunit.
Introduction
Na+, K+-ATPase, or the Na+ pump, is the principal transporter in eukaryotic cells that sustains a non-equilibrium distribution of Na+ and K+ ions across the plasma membrane (Kaplan, 2002). Na+, K+-ATPase is a heterodimer that consists primarily of α and β subunits. The α subunit has a molecular mass of 110 kDa and is responsible for the catalytic functions of the enzyme (Ohtsubo et al., 1990). The β subunit is a glycoprotein with a molecular mass of 35 kDa and is indispensable for the structural stabilization and functional maturation of the holoenzyme (Geering et al., 1989; Ackermann and Geering, 1990) and the transport of the α subunit to the plasma membrane (Noguchi et al., 1987; Martin-Vasallo et al., 1989). Ion transport requires the participation of both α and β subunits (Fambrough, 1988; Martin-Vasallo et al., 1989). There are four distinct isoforms of the α subunit (α1, α2, α3, and α4) and three isoforms of the β subunit (β1, β2, and β3) that are tissue-specific in their expression (Fambrough, 1988; Cortas et al., 1991; Blanco and Mercer, 1998). Finally, there is a small γ subunit that belongs to the FXYD family of proteins that modulates Na+, K+-ATPase activity (Cortas et al., 1991).
The establishment of cell surface polarity for most membrane proteins in epithelia implicates sorting signals that are encoded in their amino acid sequence (Sweadner et al., 2000; Rodriguez-Boulan et al., 2005), trafficking routes that involve apical or basolateral recycling endosomes (Weisz and Rodriguez-Boulan, 2009), and interactions with epithelial-specific protein complexes such as AP-1B and clathrin, which may be regulated by small GTPases (Ellis et al., 2006; Gonzalez and Rodriguez-Boulan, 2009; Weisz and Rodriguez-Boulan, 2009). Na+, K+-ATPase is polarized and directed toward the basolateral membrane of most epithelial cells (Deborde et al., 2008) and, more specifically, at cell borders facing the intercellular space (Contreras et al., 1995; Cereijido et al., 2001). In epithelial cells, newly synthesized Na+, K+-ATPase is delivered directly to the basolateral membrane (Contreras et al., 1989; Shoshani et al., 2005). Although it is clear that the α1 subunit carries the information for the basolateral targeting of Na+, K+-ATPase in typical epithelia (Mays et al., 1995), efforts to identify an amino acid sequence that functions as a basolateral polarity signal in the α1 subunit have been unsuccessful (Dunbar et al., 2000). In the target membrane domain, the asymmetric distribution of Na+, K+-ATPase is reinforced by selective retention through binding to the ankyrin-fodrin cytoskeleton (Hammerton et al., 1991; Muth et al., 1998). Several lines of evidence have demonstrated that the β1 subunit anchors the pump at the lateral borders of epithelial cells through homotypic β1-β1 interactions, provided the neighboring cells express an identical β1 subunit (Contreras et al., 1995; Shoshani et al., 2005). Recent studies have further shown that the adhesive properties of the β1 subunit play a principal role in the basolateral localization of the pump (Vagin et al., 2006; Padilla-Benavides et al., 2010). However, in the choroid plexus epithelium (Wright, 1972), cockroach salivary gland epithelium (Just and Walz, 1994) and retinal pigment epithelium (RPE; Gundersen et al., 1991), Na+, K+-ATPase is expressed in the apical membrane.
The RPE makes up the outmost layer of the retina and has many supporting functions that are fundamental for the survival of photoreceptors. The RPE forms the outer hemato-retinal barrier and regulates the volume and chemical composition of the subretinal space. Na+, K+-ATPase is vital for several RPE cell functions, such as the vectorial transport of ions and solutes from the choroid to the photoreceptors and the reestablishment of Na+ and K+ gradients required for the photoreceptor dark current, synaptic activity, action potentials, and transmitter uptake in the subretinal space (Miller and Steinberg, 1979). RPE cells are distinctive in that they contain apical Na+, K+-ATPase (Miller and Steinberg, 1979; Gundersen et al., 1991). Nevertheless, depending on the RPE preparation studied, apical expression can be lost (Geisen et al., 2006) or accompanied by basolateral expression (Okami et al., 1990; Hu et al., 1994; Marrs et al., 1995). Despite many years of investigation, the sorting signals and mechanisms that mediate the apical polarization of Na+, K+-ATPase remain poorly understood (Cereijido et al., 2012).
The present work focuses on the intriguing mechanism underlying the polarity of the Na+ pump in the RPE. Because the β1 subunit plays a key role in the basolateral localization of the pump in classic epithelia, we anticipated that β subunit isoforms may be crucial elements in explaining the apical localization of the pump in the RPE. In this context, it is worth recalling that a role for the β subunit, particularly the β2 isoform, in the apical polarization of Na+, K+-ATPase has been suggested in previous studies (Wilson et al., 2000; Vagin et al., 2005). In the present study, we examined the hypothesis that the apical targeting of Na+, K+-ATPase in RPE cells depends on the expression of the β2 subunit.
Materials and Methods
Reagents and Antibodies
The following reagents were used: DMEM, F12, PBS, and FBS (GIBCO Cat. 12100-061, Cat. 21700-026, Cat. 21300-058, and Cat. A15-751), the antibiotics penicillin and streptomycin (10,000 U/μg/ml, In vitro, A-01), laminin (SIGMA-ALDRICH Cat. L2020), ITS (a mixture of insulin, human transferrin and selenic acid, BD Biosciences Cat. 354352), Protease Inhibitor Mix (GE Healthcare, Cat. 80-6501-23), a chemiluminescent detection system (ECL Plus; Amersham Biosciences Cat. RPN2132), Lipofectamine 2000 (Invitrogen, Cat. 11668-019), an siRNA Labeling Kit-Cy3 (Ambion by Life Technologies Cat. AM1632), Sp1 siRNA (Sta. Cruz Cat. sc-29488), siRNA β1 and β2 (FlexiTube siRNA QIAGEN: SI04284966, SI04249098, SI04173134, SI03149909, SI04273003, SI04138162, SI04274543, SI04284014), the Light Cycler-Fast Start DNAMaster SYBR Green I Kit (Roche, (Applied Biosystems, 4309159), and BCA protein assay reagent (Thermo Scientific, 23224 and 23223).
The following antibodies were used: anti-Na+, K+-ATPase α1 subunit (IF: Novus NB300-146), anti-α2 Na+, K+-ATPase (Thermo Scientific, PA5-25725), anti-Na+, K+-ATPase β1 subunit (IF: Bio Reagents Cat. No. MA3-93; WB: Novus 464.8), anti-Na+, K+-ATPase β2 subunit (WB: Transduction Laboratories Cat. No. BD610915, IF: Biorbit orb10952 and Creative Biolabs MOB-3916z), anti-Na+, K+-ATPase β3 subunit (Transduction Laboratories Cat. No. BD610992), anti-Ezrin (Sigma E1281), anti-β-catenin (Invitrogen 13-8400), anti-N-cadherin (IF: ZYMED Cat. No. 333900), anti-CD147 (Bioscience No. Cat. 555961), Alexa 488- or 594-conjugated donkey anti-mouse or anti-rabbit IgG (Invitrogen, A11094, A21207, A21203, and A21202), TO-PRO (Invitrogen, T3605), Hoechst (Invitrogen H21491), peroxidase-conjugated anti-mouse and anti-rabbit antibodies (Zymed California, Cat. 62-6520 and 62-6120), and FITC-phalloidin (Sigma Chemical).
Cell Culture
The ARPE-19 cell line (ATCC CRL-2302) was originally obtained from a spontaneously transformed human RPE primary culture. We only used cells from the 5th to the 20th passages, when the cultures grew rapidly and formed cobblestone monolayers. Cells were maintained in 6-cm-diameter culture dishes in Dulbecco's Modified Eagle's Medium (DMEM) supplemented with fetal bovine serum (FSB; 10%), penicillin (100 U/ml) and streptomycin (100 μg/ml). The cultures were incubated in an atmosphere of 95% air with 5% CO2 at 37°C. The cells were propagated on 6.5-mm or 24-mm-diameter Millicell Hanging Cell Culture Inserts (0.4 μm pore) (Transwell Corning Incorporated cat. 3450 and 3470) that had been previously coated with laminin (10 μg/ml) and were maintained in 1:1 Dulbecco's Modified Eagle's Medium and Ham's F-12 medium (DMEM:F-12) supplemented with FBS (10%) for 1 week. For the remaining time, they were supplemented with FBS (1%) and ITS until a polarized monolayer was formed (4–6 weeks). These culture conditions were defined as re-morphogenic conditions.
Transepithelial Resistance (TER)
The degree of tight junction (TJ) sealing to ionic solutes was assessed by measuring the TER of cells grown for 6 weeks on transwell-permeable supports using an epithelial volt-ohmmeter (EVOM; World Precision Instruments Inc., Sarasota, FL). All measurements were performed at room temperature. Final values were obtained by subtracting the resistance of the bathing solution and the empty insert, and the results are expressed as the mean ± SE in ohms times centimeters squared (Ω•cm2).
Immunofluorescence (IF), Immunocytochemistry and Confocal Microscopy
IF assay were performed using monolayers grown on 6.5-mm transwells covered with laminin that were washed with PBS (phosphate-buffered saline) and fixed with ice-cold methanol for 10 min. The cells were then soaked in blocking solution (PBS containing 3% BSA) for 1 h at 37°C or overnight at 4°C. Then, cells were incubated with the primary antibodies for 60 min at 37°C, washed quickly 7 times with PBS, and then incubated with the secondary antibodies for 45 min at 37°C. All antibodies were diluted in blocking solution, and the following secondary antibodies were used: Alexa 488- or 594-conjugated donkey anti-mouse or anti-rabbit IgG. Nuclei were counterstained with TO-PRO dye and then washed twice. To detect filamentous actin, the cells were fixed in paraformaldehyde and labeled with FITC-phalloidin.
Human eye preparations were obtained from the ophthalmic pathology service at the “Dr. Luis Sánchez Bulnes” APEC hospital in Mexico City. Paraffin-embedded eyes without lesions in their fundus were selected from the service compendium, and 5-μm sections were mounted on slides. For Na+, K+-ATPase assessment, β2 subunit-stained sections were deparaffinized and rehydrated using a series of incubations with xylene (2–5 min and 1:1 xylene/ethanol) and ethanol (2 min each in 100, 95, 80, and 70% ethanol), followed by three washes in PBS or water. The samples were bleached via incubation in 0.25% KMnO4 and PBS-Ca2+ for 30 min. After three washes with PBS-Ca2+, the samples were incubated in 1% oxalic acid and washed again. Antigen retrieval was accomplished via incubation in 0.05% trypsin for 10–30 min at 37°C. Sections were permeabilized using 0.25% Triton X-100 and 1% FBS for 30 min and then blocked with 0.25% Triton X-100 and 10% FBS for 90–120 min. The samples were incubated with primary antibodies (against CD147 and the α2 and β2 subunits of Na+, K+-ATPase) in permeabilization solution overnight at 4°C. The next day, the samples were washed three times and incubated with a secondary antibody for 1 h at 37°C. The samples were washed twice, and the nuclei were counterstained with DAPI.
Confocal microscopy was performed using a Leica laser-scanning confocal microscope (Leica TCS SP2 or TCS SP8). Data acquisition and analysis were performed with the LCS Leica software and ImageJ® software from the National Institutes of Health (Bethesda, MD), respectively. The relative fluorescence intensity was quantified using ImageJ 1.43u software.
Western Blot (WB) Analysis
All extraction steps were performed at 4°C. To detect the protein levels of the Na+, K+-ATPase subunits, monolayers grown on 24-mm transwells covered with laminin were lysed in a buffer containing 40 mM Tris (pH 7.6), 150 mM NaCl, 2 mM EDTA, 10% glycerol, 1% Triton X-100, 0.5% Na+ deoxycholate, 0.2% SDS, and protease inhibitors (Complete, Mini). The extract was sonicated for 30 s and centrifuged at 15,000 × g in a microfuge for 15 min. The supernatant was recovered, and the protein content was measured using BCA protein assay reagent following the manufacturer's instructions. Thirty micrograms of protein from each condition were separated via 10% SDS-PAGE and immunoblotted with the indicated primary antibodies, followed by species-appropriate peroxidase-conjugated secondary antibodies, which were imaged using a chemiluminescence detection system. The immunoblots were quantified via densitometry using ImageJ 1.43u software.
Steady State Surface Biotinylation Assay
ARPE-19 cells were maintained for 4 weeks in a culture on polyester transwell inserts as described above. Cell monolayers were biotinylated with 1 mg/ml of EZ-Link Sulfo-NHS-SS-Biotin (Thermo scientific, 21331). After quenching the biotinylation reaction, the cells were washed and then lysed, and the membranes were solubilized by incubating them with 200 μl of PBS (pH 8.0) with 1% Triton X-100 and protease inhibitors. Cell lysates were clarified via centrifugation (15,000 × g for 10 min). Samples containing 50 μl of supernatant mixed with SDS-containing sample buffer were loaded into SDS-PAGE gels to determine the total ARPE-19 protein in the supernatant (input). To isolate biotinylated proteins, the rest of each supernatant was incubated with 100 μl of streptavidin-agarose beads (Gibco, 5942SA) in a total volume of 150 μl of lysis buffer overnight at 4°C with continuous rotation. The bead-adherent complexes were washed 6 times [PBS (pH 8.0), 1% Triton X-100 and 150 mM NaCl]. Next, the proteins were eluted from the beads via incubation in SDS-PAGE sample buffer for 5 min at 80°C, separated in SDS-PAGE gels and analyzed via WB analysis using primary antibodies against human Na+, K+-ATPase β subunits and human N-cadherin.
Transfection of siRNA
ARPE-19 cells were cultured for 4 weeks and incubated for 48 h with a mixture of Lipofectamine 2000 and 278 ng/μl of siRNA for the β1 subunit, 700 ng/μl of siRNA for the β2 subunit or 75 pmoles/μl of siRNA for Sp1, as indicated by the manufacturer. Thereafter, the transfection medium was removed, and the cells were processed for IF or WB analysis to estimate the silencing efficiency. siRNA for the Na+, K+-ATPase β2 subunit and for Sp1 were pre-labeled with Cy3 using the siRNA Labeling Kit-Cy3 according to the manufacturer's protocol.
Relative mRNA Quantification via qPCR
Real-time PCR was performed with a Light Cycler 2.0 system (Roche) using the Light Cycler-Fast Start DNA Master SYBR Green I Kit (Applied Biosystems). We used the following sets of primers: β2 subunit forward: GAGCTTCGTTCCACAGCTTC and reverse: CCCACCAAACCGTCTAGA AA; β1 subunit forward: AGGCGTACGGTGAGAACATT and reverse: GGGAAAGATTTGTGCTTG TGA; β3 subunit forward: TCGAGTACTCCCCGTAACGA and reverse: AGGCTCTGGTTGAGGGAC TT; α1 forward: GAAGCAAGACGTCCTGGAAT and reverse: TTTCAGTCTTTCCGGGTGTT; α2 forward: CTACCCTGTTGCTTTGGCTTTC and reverse: TGAGGGACCTTAGCGGGAGA; and GAPDH forward: ACGGCACAGTCAAGGCTGAG and reverse: CAGCATCACCCCATTTGATGTTGG. PCRs were performed using 45 cycles that included the following steps: 30 s of denaturation at 95°C, a 30-s annealing phase at 60°C, and a 30-s template-dependent elongation phase at 72°C. The amplification of each DNA template was performed in at least three experiments with two technical replicates in the same PCR run. The differential gene expression of the investigated genes was calculated as the ratio normalized to the expression of the GAPDH gene. The data were analyzed using the equation described by Livak (Livak and Schmittgen, 2001; amount of target = 2−ΔΔCT).
Statistical Analysis
GraphPad Prism version 4.00 software was used for all statistical analyses. The data are presented as the mean ± SEM. Statistical significance was determined using a one-tailed, non-parametric t-test. P ≤ 0.05 were considered significant.
Results
The β2-subunit of Na+, K+-ATPase is Expressed at the Apical Domain of the RPE in the Eye
To test the hypothesis that the apical targeting of Na+, K+-ATPase in RPE cells involves the expression of the β2 subunit, we first analyzed the expression of the β2 isoform at the apical membrane of the RPE in the eye. As shown in sections from human eye (Figure 1), co-localization at the apical domain was observed using anti-β2 antibody and anti-CD147 antibody (basigin or cluster of differentiation 147, the accessory subunit of monocarboxylate transporters; 35). Thus, our data suggest that the apical Na+, K+-ATPase expressed in human RPE includes the β2 isoform.
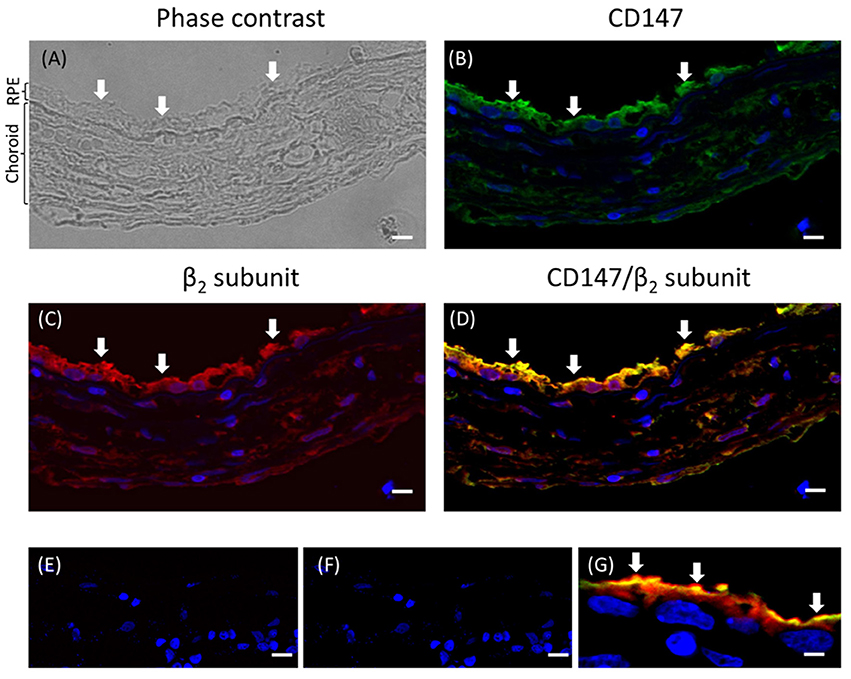
Figure 1. Immunofluorescence of adult human eye in situ. (A) A phase-contrast image of the human eye section studied. The RPE layer and the choroid are indicated. The retina is already detached in the paraffin block. This section was co-stained for CD147 (B) and the β2 subunit of the Na+, K+-ATPase (C) using Alexa 488- and Alexa 594-conjugated donkey anti-rabbit and anti-mouse IgG secondary antibodies, respectively. The merged image showing co-localization at the apical domain is in (D). Panels (E,F) show similar sections treated only with the fluorescent secondary antibody (anti-rabbit and anti-mouse IgG, respectively) as negative controls. Panel (G) shows a higher-magnification image from a different field of the same preparation. All the preparations were counterstained with DAPI (blue). Arrows indicate the apical domain of RPE cells. Scale bars are 40 μm in (A–F) and 10 μm in (G).
ARPE-19 Cells are Suitable for Studying the Mechanism Underlying the Polarity of Na+, K+-ATPase in the RPE
To further test our hypothesis, we chose human ARPE-19 cells as a model. ARPE-19 cells are fibroblast-like when cultured on inserts and go through a process of re-morphogenesis that lasts 6–8 weeks (Dunn et al., 1996). This period probably reflects the time required to up-regulate the expression of genes associated with differentiated RPE cells and is needed to develop the molecular machinery involved in membrane protein localization in RPE cells. First, we analyzed the polarized expression of Na+, K+-ATPase in ARPE-19 cells. In ARPE-19 cells cultured up to 4 weeks on transwell inserts covered with laminin, immunofluorescent staining of actin using rhodamine phalloidin showed flat cells with stress fibers and very few circumferential actin microfilament bundles (Figure 2A). The expression of CD147, was detected in the apical membrane domain using a specific antibody (Figure 2B). The expression of Na+, K+-ATPase using anti-α1 and β1 antibodies was mostly observed in the basolateral membrane (Figures 2C,D). Furthermore, using anti-human β2 antibody, a very weak signal was detected (Figure 2E). Under these culture conditions, we were unable to study the mechanism underlying the apical polarization of the Na+ pump. Thus, we decided to add ITS, which has been reported to epithelialize ARPE-19 cells (Luo et al., 2006). We then examined whether this supplement resulted in the apical localization of Na+, K+-ATPase. As shown in Figure 3, after 4 weeks of culturing, cells cultivated in the presence of ITS were epithelial-like in shape, with a circumferential actin microfilament bundle and occasional stress fibers (Figure 3A). As expected for RPE cells, the expression of molecular markers such as β-catenin and N-cadherin was observed in the lateral membrane (Figures 3B,C), and CD147 was observed at the apical and basolateral membrane (Figure 3D). Ezrin, a membrane-organizing phosphoprotein that tethers actin microfilaments to cell membrane proteins, is an apical polarization marker in the RPE (Kivelä et al., 2000). As shown in Figure 3E, after 4 weeks of culturing in the presence of ITS, ezrin was localized at the apical membrane in a pattern suggesting the formation of microvilli. The expression of Na+, K+-ATPase assessed using anti-α1 and anti-β1 antibodies (Figures 3F,G) was mainly observed in the basolateral domain, although β1 expression was also observed in the apical domain. An apical pattern was observed using anti-β2 antibody (Figure 3H). TJ formation was evaluated based on measurement of the TER of the monolayers. As depicted in Figure 3I, the TER was stabilized at 4 weeks, with an average value of 80 Ω•cm2, which is a characteristic value reported in these cells (Dunn et al., 1996; Luo et al., 2006). Hence, we considered that under these conditions (designated as re-morphogenic conditions and detailed in the Methods), it would be feasible to perform experiments addressing the intriguing issue of the “reversed” apical polarization of Na+, K+-ATPase in RPE cells.
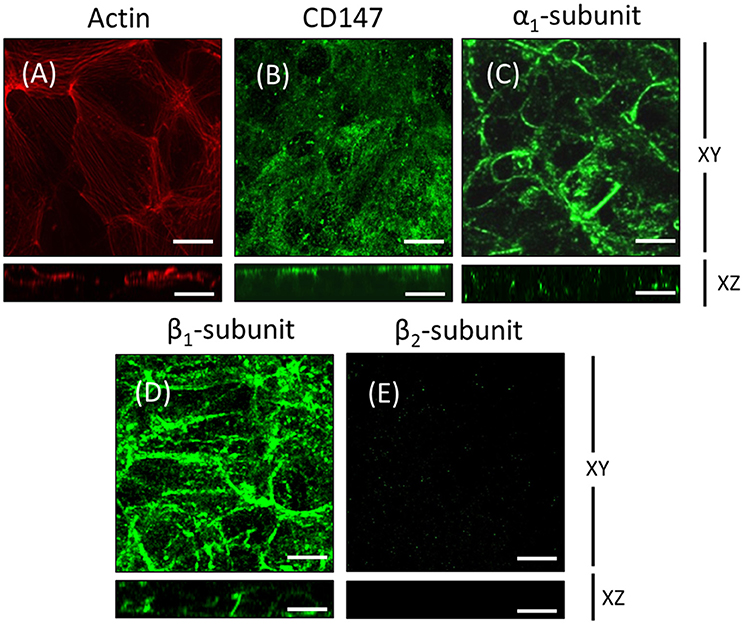
Figure 2. ARPE-19 cells cultured on transwell inserts for 4 weeks are not completely polarized. ARPE-19 cells were cultured up to 4 weeks on transwell inserts covered with laminin. The immunofluorescence image in (A) shows actin localization using rhodamine phalloidin. The cells are flat with stress fibers and very little circumferential actin microfilament bundles. The expression of CD147, a RPE marker, was detected using a specific antibody in the apical membrane domain (B). The expression of Na+, K+-ATPase using anti-α1 (C) and anti-β1 antibodies (D) was observed mostly at the basolateral membrane. Immunofluorescence detection with anti-human β2 antibody revealed a very weak signal (E). Scale bar: 10 μm.
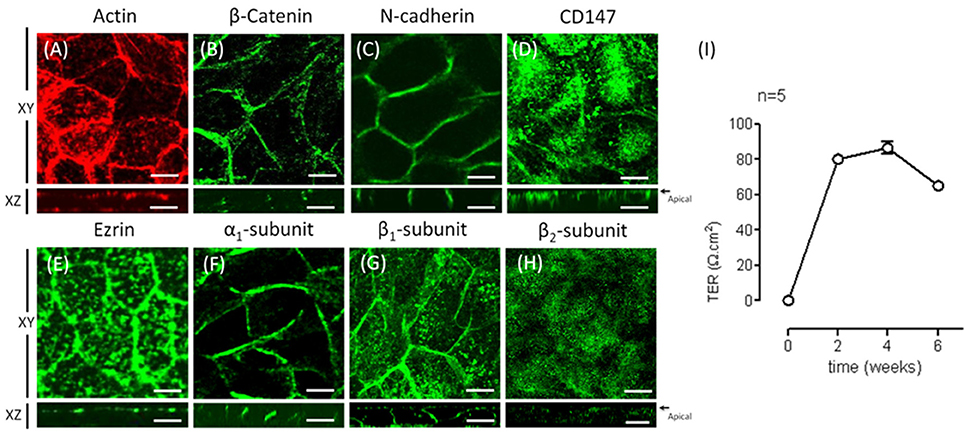
Figure 3. Re-morphogenesis of ARPE-19 cells treated with ITS. (A) The photomicrographs show ARPE-19 cells cultured for 4 weeks with ITS and stained for actin with Texas Red-X phalloidin. Note the tight intercellular contact, epithelial-like cellular shape, and predominantly peripheral cortical actin staining. Confocal immunofluorescence images of the same culture conditions showing β-catenin (B) and N-cadherin (C) at the lateral membrane, CD147 (D) mostly in the apical domain and ezrin (E) in the apical domain. (F) The immunofluorescence image shows immunostaining of the α1 subunit of Na+, K+-ATPase at the lateral membrane and more precisely, as observed in the XZ image, at the cell-cell contacts. (G) The β1 subunit is observed at the cell border and at the apical domain; the XZ image confirms both basolateral and apical staining. (H) The β2 subunit is observed mainly at the apical domain; the XZ image confirms apical staining. Scale bar: 10 μm. (I) Quantitative analysis of the transepithelial resistance (TER) of ARPE-19 cells during re-morphogenesis is depicted. Note a stable TER of ~80 Ω cm2 between the second and fourth week in culture.
Expression of the α2 and β2 Isoforms is Up-regulated during Re-morphogenesis
To characterize the expression of Na+, K+-ATPase under re-morphogenic conditions, we analyzed the mRNA and protein expression levels of various isoforms of the α and β subunits. The applied antibodies were carefully chosen to ensure that they were specific for the designated isoform. As shown in Figure 4A, ARPE-19 cells cultured in the presence of ITS expressed the three β subunits (β1, β2, β3). Remarkably, these findings are the first evidence of β3 isoform expression in ARPE-19 cells. We then evaluated changes in the amount of mRNA for the α and β isoforms over time via qPCR. As shown in Figures 4B,C, mRNAs corresponding to all five studied isoforms (α1–2, β1–3) were expressed in ARPE-19 cells, and their relative amounts increased during re-morphogenesis. As shown in Figure 4B, although the relative amounts of β1 and β2 mRNA increased up to the sixth week, the mRNA levels of β2 increased to a significantly higher value than those of β1. However, the amount of β3 mRNA remained relatively constant during this time period (Figure 4B). Therefore, we did not study this isoform further. Nevertheless, while the amount of α1 mRNA was doubled, the expression of α2 increased 6-fold (Figure 4C). When analyzing the amounts of total protein of the β1 and β2 isoforms, we observed an increase over time, reaching maximal expression at 6 weeks. Altogether, Figure 4 shows that during re-morphogenesis, the expression of the β2 subunit was up-regulated, resulting in increasing amounts of both mRNA and protein. This suggests transcriptional level regulation.
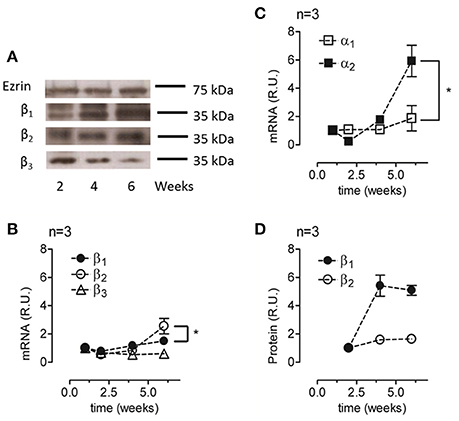
Figure 4. Analyses of the relative amounts of α and β isoforms in ARPE-19 cells during re-morphogenesis. (A) Western blot analysis of the lysates of ARPE-19 cells cultured for the indicated time under conditions established for re-morphogenesis. The upper part of the blot was probed with an antibody against ezrin (as a loading control), whereas the lower part was probed with antibodies against the β1, β2, and β3 subunits. Western blot analyses of all samples were conducted on the same day. A non-relevant lane between 2 and 4 weeks in the ezrin blot was eliminated; therefore, it appears to be discontinued. The blots represent three different experiments. Total mRNA was extracted at weeks 1, 2, 4, and 6 of culture and analyzed via qPCR. The relative mRNA levels of the β1, β2, and β3 subunits (B) and of the α1 and α2 subunits (C) are illustrated. The amount of mRNA was normalized to that detected in the first week. (D) Quantification of β1 and β2 subunit expression via densitometry in three independent experiments normalized to the loading control. Densitometry results were also corrected for the film light level whenever the background level was different. Error bars represent the mean ± SEM of three independent experiments. Significant changes are indicated by an asterisk (P < 0.05, non-parametric t-test).
The Transcription Factor Sp1 is Involved in Regulating the Expression of the β2 Subunit in ARPE-19 Cells
During re-morphogenesis, expression of the α2 and β2 isoforms is up-regulated, increasing both their mRNA and protein levels. The transcription factor specificity protein 1 (Sp1) binds GC-rich motifs and regulates gene expression through protein–protein interactions (Shull et al., 1989; Samson and Wong, 2002). Based on previous works by Kawakami et al. (1990, 1992) and Avila et al. (1998) that reported that Sp1 enhances the promoter activity of the β2 subunit in rat neuroblastoma, in rat embryo cell lines and in human lymphocytes, we suspected that Sp1 could be at least one of the factors regulating this process. Therefore, we explored whether Sp1 was involved in the up-regulation of the β2 subunit during the re-morphogenesis of ARPE-19 cells. As shown in Figure 5A, the relative amount of Sp1, as estimated via WB analysis, was slightly changed during re-morphogenesis. IF images in Figure 5B show that Sp1 was expressed in the nuclei of ARPE-19 cells cultured for 4 weeks in the presence of ITS. The silencing of Sp1 by siRNAs specific for human Sp1 in ARPE-19 cells (cultured for 4 weeks) reduced the total protein level, as estimated from the WBs, by ~40% (Figure 5C). This partial silencing corresponds to the IF image of the silenced cells in Figure 5D. The arrowheads indicate cells in which the expression of Sp1 (in green) was not observed, although these were still surrounded by cells that did express Sp1 in their nuclei. We anticipated that if Sp1 was involved in β2 transcription, Sp1 silencing would also reduce the amount of the β2 subunit in ARPE-19 cells. As shown in Figure 5E, the total amount of β2 estimated via WB analysis was reduced by ~50% in Sp1-silenced cells. Correspondingly, the IF image of β2 subunit expression (Figure 5F) shows zones in the Sp1-silenced monolayer with low fluorescence signal (indicated by arrowheads). These data suggest that the transcription factor Sp1 is probably involved in regulating the expression of the β2 subunit in ARPE-19 cells.
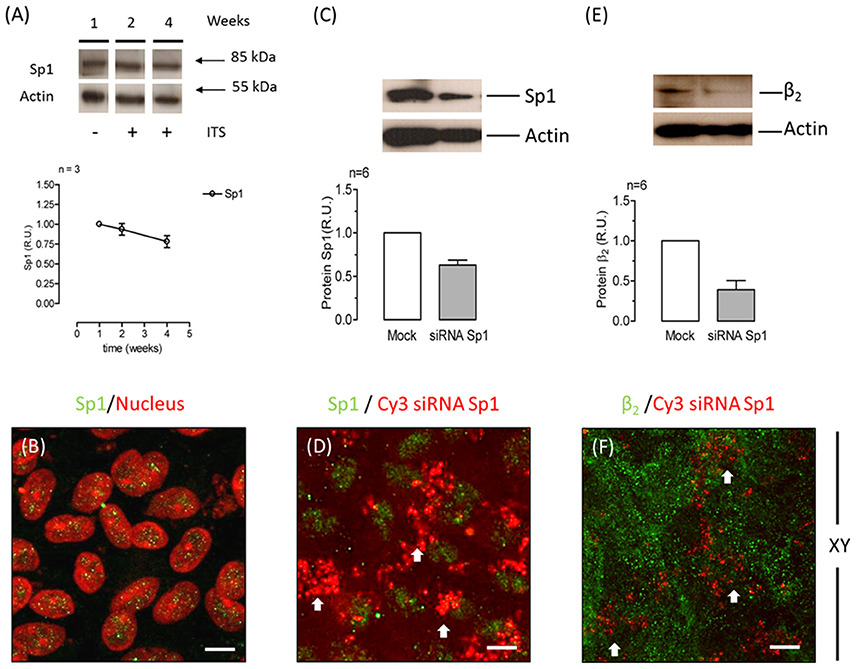
Figure 5. The transcription factor Sp1 is involved in β2 subunit regulation in ARPE-19 cells. (A) Western blot analysis showing the expression of Sp1 over 4 weeks of culturing (upper panel). Actin was used as a loading control in all Western blots shown in this figure. Quantitative analysis of Sp1 normalized to the loading control is illustrated in the lower panel. (B) Immunofluorescent staining of Sp1 in ARPE-19 cells is shown in green. Counterstaining of nuclei is shown in red. Merged image shows the nuclear localization of Sp1 in ARPE-19 cells cultured for 4 weeks in the presence of ITS. Scale bar: 20 μm. (C) Representative Western blot and quantitative analyses of six independent experiments conducted on ARPE-19 cells treated with Sp1 siRNA are shown. Control cells were transfected without siRNA (Mock). Error bars represent the mean ± SEM. (D) Immunofluorescence image of ARPE-19 cells incubated with Cy3-siRNAs to silence Sp1 (red) and immunostained for Sp1 expression (green). White arrows indicate siRNA-transfected cells (identified by red fluorescence) that did not express Sp1 in the nucleus. Scale bar: 20 μm. (E) Representative Western blot and quantitative results of the immunodetection of the β2 subunit in six independent experiments of Sp1 knockdown in cells (60%). (F) Immunofluorescence image of Sp1-silenced ARPE-19 cells stained for β2 subunit expression.
Apical Expression of Na+, K+-ATPase in ARPE-19 Cells during Re-morphogenesis is Correlated with the Expression of the α2 and β2 Isoforms
The WB and qPCR results in Figure 4 show that ARPE-19 cells expressed all three β isoforms and at least two α isoforms. We therefore proceeded to analyze the polarized distribution of the different α and β isoforms in these cells. As observed from the confocal IF analysis (Figure 6) and in contrast to the non-polarized distribution of the β1 isoform shown in Figure 3G, β3 was mostly localized at the basolateral membrane and did not co-localize with ezrin (Figure 6A). Therefore, we did not study the role of this isoform in the apical localization of the pump in RPE. The β2 subunit was distributed in a typical dotted pattern that suggested an apical localization (Figure 6B). The β1 subunit was distributed in both the basolateral and apical domains (Figure 6C). Nonetheless, the apparent apical pattern was not homogenous, presenting a mosaicism that has been previously reported for RPE cells (Burke, 2008). Because the β subunit must associate with the α subunit to reach the plasma membrane, we analyzed the α isoform accompanying the β2 subunit in ARPE-19 cells using an IF assay. Figure 6D shows that α1 was present at the basolateral membrane and was clearly excluded from the apical domain marked by ezrin. However, α2 was distributed in an apical pattern and was apparently excluded from cell-cell contacts (Figure 6E), very similar to the β2 pattern. We also observed a lack of co-localization between α1 and β2 (Figure 6F), α2 and β1 (Figure 6G) and α1 and α2 isoforms (Figure 6H). Thus, the apical pump in RPE cells is most likely an α2/β2 complex. Although the IF distribution pattern of the β2 subunit in polarized ARPE-19 cells suggests an apical localization, we had to confirm that the pump assembled by the β2 isoform was actually delivered to the apical membrane domain of ARPE-19 cells. Therefore, we examined the co-localization of the β2 and α2 subunits with the apical marker CD147 (Figures 7A,B) and with the basolateral markers N-cadherin and β-catenin (Figures 7C,D). Images obtained via confocal microscopy (Figure 7) show that the β2 subunit did not co-localize with markers of the basolateral or apical domains. However, a lack of co-localization demonstrated by IF was not sufficient to conclude that β2 does not reside at the apical membrane. Thus, we proceeded to perform a steady-state surface biotinylation assay. ARPE-19 cells were cultured for 4 weeks with ITS on inserts. Biotin was added to both the apical and basolateral sides of the monolayer. As shown in Figure 7E, these cells expressed both N-cadherin and the β2 subunit, as detected in the total cell lysate (input). N-cadherin was labeled with biotin as expected. Nevertheless, the β2 subunit was not detected in the biotin-labeled (streptavidin-precipitated) fraction in any of the 6 experiments performed. Therefore, our results indicate that apical pumps including β2 subunits probably did not accumulate in the apical membrane domain of ARPE-19 cells. To evaluate this possibility we used immunofluorescence assays to analyze whether α2 and β2 co-localize at the apical domain in sections of human eye. As shown in Figure 8, the α2 and β2 subunits co-localize in an apical domain. Considering that the β2 subunit is an adhesion molecule (Gloor et al., 1990), we speculated that it did not stabilize in the plasma membrane because it could not interact with a receptor protein at the apical “lumen” of the monolayer. Hence, the apical pumps observed via IF in ARPE-19 cells may result from apical recycling of β2 subunits accumulated in endosomes (AREs or CREs, 12). Interestingly, the β1 isoform was clearly detected when the biotin-labeled fraction of the ARPE-19 cells was blotted for the β1 subunit (data not shown), suggesting that the β1 isoform had a slower turnover in the plasma membrane and therefore was detectable in a steady-state analysis. However, these findings do not preclude the involvement of the β2 subunit in the apical polarization of Na+, K+-ATPase.
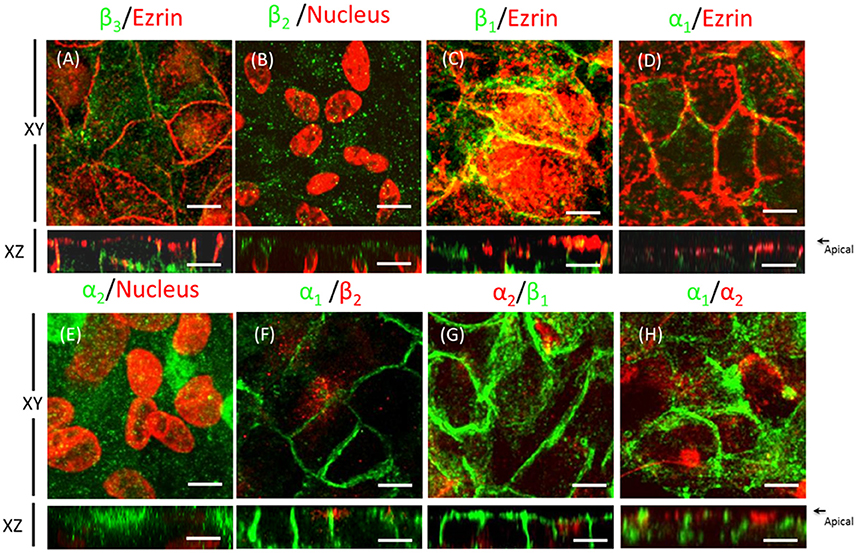
Figure 6. Domain-specific distribution of the Na+, K+-ATPase isoforms in ARPE-19 cells. Immunofluorescence assays of ARPE-19 cells cultured for 4 weeks with ITS. (A–E) Fluorescence images of immunostaining with isoform-specific antibodies against the α and β subunits of Na+, K+-ATPase; co-staining with anti-ezrin as an apical marker (A,C,D) or counterstaining with propidium iodide for the detection of nuclei (B,E). β3 (A) and α1 (D) subunit expression was detected mainly in the lateral domain. The distribution pattern of the β2 and α2 subunits (B,E) suggests an apical localization. The distribution pattern of the β1 subunit (C) in both the lateral and apical domains suggests non-polarized expression. Minor co-localization with ezrin at the apical domain is observed. The α1/β2 (F), α2/β1 (G) and α1/ α2 subunits (H) do not co-localize. Scale bar: 10 μm.
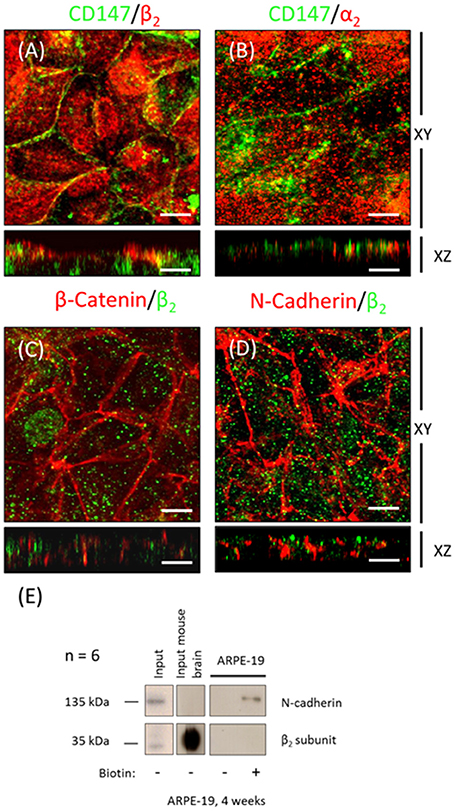
Figure 7. The β2 subunit in ARPE-19 cells does not stabilizes at the apical plasma membrane domain. Confocal images of the β2 and α2 subunits (in red) were analyzed for co-localization with CD147 (green), an apical marker (A,B). Co-localization of the basolateral markers β-catenin and N-cadherin (in red) with the β2 subunits (in green) are shown in (C,D). Although an apparently apical pattern is observed for the Na+, K+-ATPase subunits β2 and α2, they do not co-localize with either apical or lateral markers. Scale bar: 10 μm. Representative Western blot of six independent experiments conducted in ARPE-19 cells for steady state surface labeling with biotin is presented in (E). Notice the lack of a β2 subunit band in the biotin labeled lane.
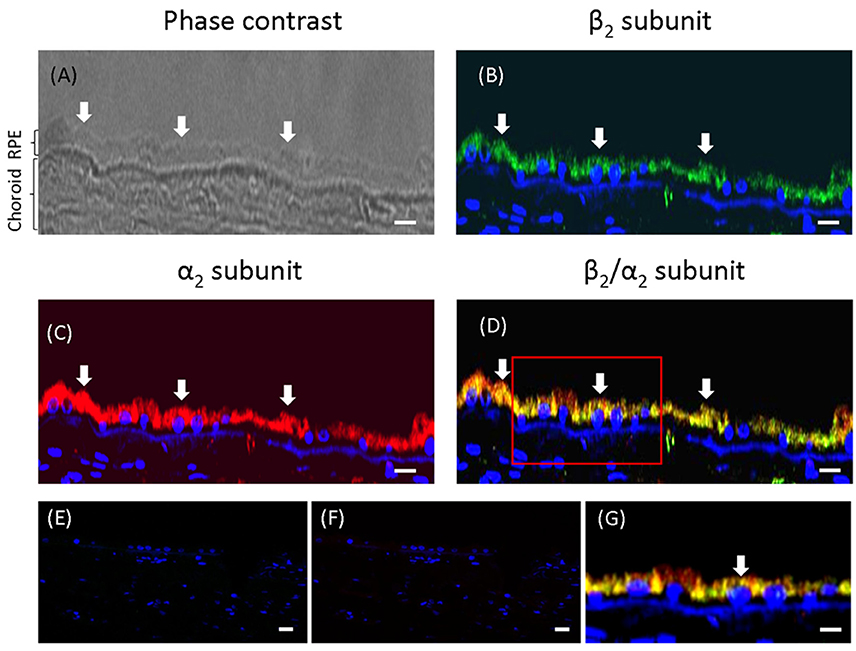
Figure 8. Co-localization of the α2 and β2 subunits in adult human eye. (A) A phase-contrast image of the human eye section studied. The RPE layer and the choroid are indicated. This section was co-stained for the β2 (B) and α2 subunits (C) of Na+, K+-ATPase using Alexa 488- and Alexa 594-conjugated donkey anti-rabbit and anti-mouse IgG secondary antibodies, respectively. The merged image showing co-localization at the apical domain is in (D). Panels (E,F) show images of similar sections treated only with the secondary fluorescent antibody (anti-rabbit and anti-mouse, IgG, respectively) as a negative control. Panel (G) shows the field indicated by the square in (D) at higher magnification. All the preparations were counterstained with DAPI (blue). Arrows indicate the apical domain of RPE cells. Scale bars are 25 μm in (A–D), 40 μm in (E,F) and 30 μm in (G).
Silencing the Expression of the β2 Isoform in Mature ARPE-19 Cells Decreases the Apical Localization of Na+, K+-ATPase
To further examine the dependence of the apical sorting of the Na+ pump on the expression of the β2 isoform, we knocked down the β2 isoform using siRNAs. As shown in Figure 9A, the expression of β2 mRNA in ARPE-19 cells treated with siRNAs specific for human β2 decreased by 60%. Meanwhile, the relative amount of α2 mRNA was also reduced. Nevertheless, the mRNA levels of the α1 and β1 isoforms were sustained at the same levels observed in the non-silenced cells (mock). The WB results for the total cell lysates (Figure 9B) show that the overall amount of β2 in siRNA-treated monolayers of ARPE-19 cells was only slightly decreased. This can be explained by the fact that ARPE-19 monolayers have a low index of proliferation and therefore a low rate of protein recycling. Although the amount of mRNAs is significantly reduced there is always a high amount of remnant proteins in the cells. Nevertheless, the IF images in Figure 10B show areas in the monolayer in which silencing was apparently effective because the fluorescence signal due to β2 expression in green was faint. At the same time, the apical expression of the α2 subunit (Figure 10D) also seemed to be reduced. The localization of β1 subunits changed substantially, displaying more apical rather than lateral distribution (Figures 10E,F). The lateral distribution of α1 subunit, as shown in Figures 6D,F, 10G, was also altered, showing a mixed distribution in the apical and lateral domains. The WB and IF results in Figures 9, 10 show a partial silencing. The siRNA-transfected monolayer still contained cells expressing the α2 and β2 subunits at the apical membrane, Therefore, it was difficult to determine whether the apical localization of the pump was indeed altered. Hence, we knocked down the monolayer with siRNAs that were pre-labeled with the fluorochrome Cy3 because it helped us identify probable silenced cells in a partially silenced monolayer. As shown in Figures 11A,B, the monolayer was not completely silenced, and β2-subunit staining was still observed at the apical domain in non-silenced cells (green fluorescence spots). Nevertheless, as shown in Figure 11B, expression of the β2 subunit in silenced cells that were stained with Cy3 (in red) is clearly weaker (white arrows), suggesting effective silencing in these cells. In Figure 11C, we measured the green fluorescence intensity of the β2 subunit in Cy3-positive cells. The average expression in these cells is reduced by 75%, indicating effective silencing. Expression of the α2 subunit was also monitored in silenced cells. As illustrated in Figures 11D,E, the apical localization of the α2 subunit was conserved. Nevertheless, measuring the fluorescence intensity of the α2 subunit in Cy3-positive cells revealed a 40% decrease in α2 subunit expression (Figure 11F). Our silencing results support the notion that the apical sorting of Na+, K+-ATPase in ARPE-19 cells during re-morphogenesis depends on the expression of the β2 isoform and its association with the α2 subunit.
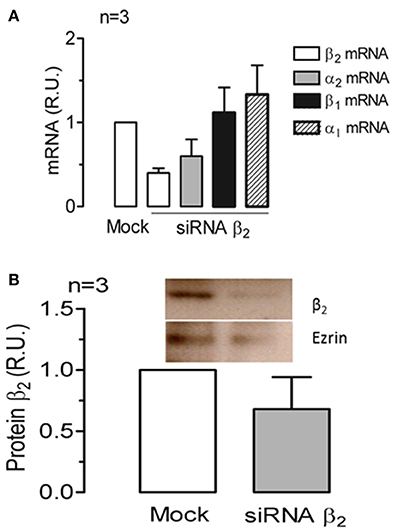
Figure 9. siRNA silencing of the human Na+, K+-ATPase β2 isoform in mature ARPE-19 cells. ARPE-19 cells cultured for 4 weeks with ITS were knocked down using siRNAs against the human β2 subunit. (A) mRNA levels of the α1, α2, β1, and β2 subunits were assessed in three independent experiments in ARPE-19 cells transfected with β2 siRNA or without any siRNA (Mock) via qPCR. The extent of β2 mRNA silencing was ~60%. (B) Western blot and quantitative results from silenced ARPE-19 cells treated as in (A) are presented. The amount of protein corresponding to the β2 subunit was normalized to the level detected in the mock-transfected cells. The extent of β2 protein silencing was ~40%.
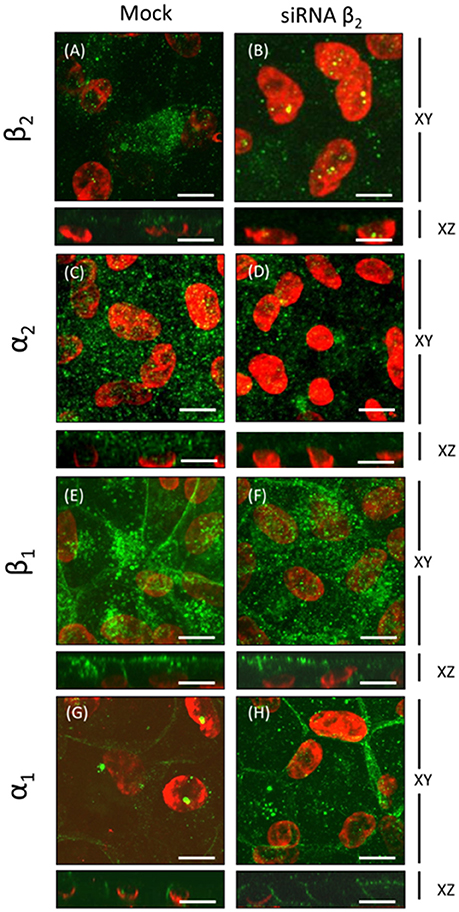
Figure 10. Immunofluorescence analyses of ARPE-19 cells silenced with siRNA against the human β2 isoform. ARPE-19 cells cultured for 4 weeks were transfected with or without siRNA specific to the human β2 isoform, as shown in Figure 8. Confocal images of silenced (right panels) or not-silenced (left panels) cells immunostained for specific α and β isoforms are displayed. Apical expression of the β2 and α2 isoforms in mock-transfected cells is apparent in (A,C). Mislocalization and reductions in the fluorescence intensity of both β2 and α2 subunits are observed in silenced cells (B,D). Basolateral and apical expression of the β1 isoform (E) is generally maintained in β2-silenced cells. However, in the presented field, β1 has a noted apical distribution pattern (F). The mainly basolateral pattern of the α1 isoform (G,H) is maintained in silenced cells. Scale bar: 10 μm.
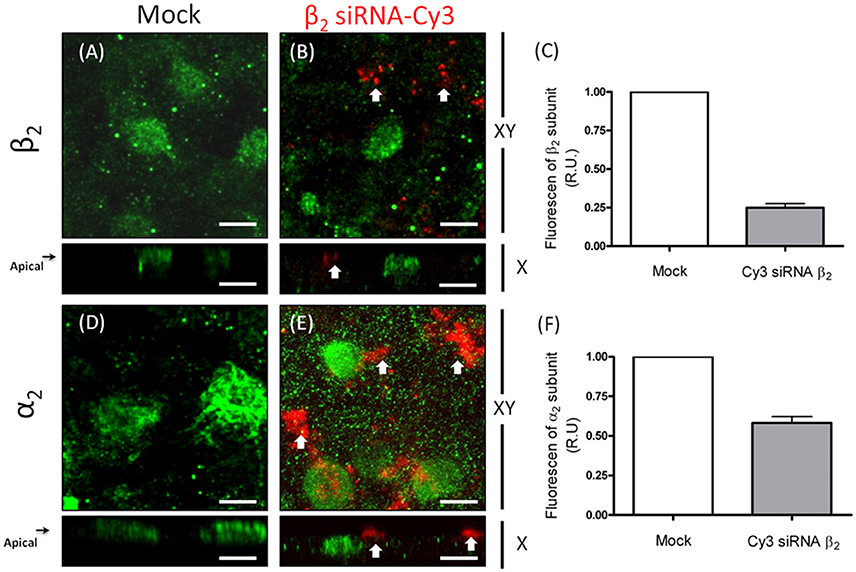
Figure 11. Silencing of the β2 subunit in ARPE-19 cells affects the apical distribution of Na+, K+-ATPase. The transfected siRNAs for the β2 isoform are labeled with Cy3. Red fluorescent spots thus identify transfected cells. Confocal images of mock-transfected cells in which the β2 and α2 subunits are immunostained (A,D), respectively show an apical distribution pattern for both subunits. Images of silenced cells show an apical expression of the β2 (B) and α2 (E) subunits (green) in non-transfected cells. Arrows in (B) indicate the lack of β2 expression in the apical domain of siRNA-transfected cells. The absence of α2 immunostaining in the apical domain is also indicated by arrows in panel (E), implying the mislocalization of Na+, K+-ATPase from the apical domain. The fluorescence intensity of β2 (C) and α2 subunits (F) in silenced cells was measured in 10 different fields, and the mean ± SEM is shown. Scale bar: 10 μm.
Discussion
RPE cultures appear to have a limited ability to reiterate epithelialization and undergo phenotypic maturation, a process described as re-morphogenesis by Burke (2008). In the present study, we first had to establish conditions that supported the re-morphogenesis of ARPE-19 cells in vitro. The appearance of Na+, K+-ATPase in the apical domain of ARPE-19 cells reflects the maturation and differentiation of the monolayer (Burke et al., 2000; Kannan et al., 2006; Sonoda et al., 2010). In this study, we addressed one aspect of the apical polarization mechanism: identifying the isoform that may contain the apical information (signal) necessary for the apical sorting of Na+, K+-ATPase in the RPE. Our observations indicate that the α2 and β2 isoforms are rarely detected in non-mature ARPE-19 cells (Figure 2) and constitute the apical pump in polarized RPE cells (Figure 8). We showed that the apical sorting of Na+, K+-ATPase in ARPE-19 cells correlates with the expression of the β2 subunit (Figure 6), a finding that is consistent with the observations in fixed eye sections (Figure 1). We also showed that during the process of re-morphogenesis, the expression of the α2 and β2 isoforms was up regulated (Figure 4) and that Sp1 is probably involved in that regulation (Figure 5). Although in the eye, the pumps composed of α2 and β2 subunits were localized in the apical membrane domain (Figure 8), they did not accumulate in the apical membrane in cultured ARPE-19 cells (Figure 7) but were probably retained in a sub-apical compartment. The increase in mRNA was much more pronounced than that of the extracted protein. Accordingly, silencing of the Na+, K+-ATPase β2 subunit by siRNA resulted in a decrease in the apical localization of Na+, K+-ATPase in knocked-down cells (Figures 10, 11) but without a clear change in α1/β1 localization.
ARPE-19 Cells As a Model for Studying Polarity in the RPE
The RPE forms the outer blood-retinal barrier that regulates the movement of solutes between the capillaries of the choroid and the photoreceptor layer of the retina. Although human fetal RPE (hfRPE) primary cultures are considered the best model for exploring the polarity and trafficking mechanisms in RPE (Lehmann et al., 2014), we have no access to primary cultures of hfRPE. Therefore, we used the cell line ARPE-19, which was obtained from a spontaneously transformed human RPE primary culture (Dunn et al., 1996). ARPE-19 shows acceptable conservation of polarity and barrier function for studies of protein trafficking. The main advantages of ARPE-19 cells are its normal karyotype, relatively fast proliferation rate, and maintenance of several RPE-specific characters (Dunn et al., 1996). Lehmann et al. (2014) mention that in ARPE-19 cells, “the trafficking machinery is likely different from RPE in situ because the Na+, K+-ATPase was reported to be basolateral in ARPE-19 cells.” Based on our experiments, we suggest using greater precision when considering Na+, K+-ATPase polarity and discussing specific dimer compositions: α1β1 or α2β2. Thus, our data are consistent with the findings of Ahmado et al. (2011) with respect to the basolateral distribution of α1β1. Surprisingly, several studies do report an apical localization of the Na+ pump when using anti-α1 antibodies in ARPE-19 cells. Nevertheless, different authors define distinct patterns of localization based on IF images as apical (Geisen et al., 2006; Kannan et al., 2006). It is well documented that both primary cultures and cell lines tend to lose the RPE-specific properties with consecutive passages. The disruption of cell-cell adhesion induces an EMT, resulting in a loss of the RPE phenotype that can become irreversible (Grisanti and Guidry, 1995; Gallagher-Colombo et al., 2010; Tamiya et al., 2010; Adijanto et al., 2012). Accordingly, we suggest that α1β1 is the default dimer expressed and is sorted primarily to the basolateral membrane domain in non-differentiated ARPE-19 cells. During re-morphogenesis, only some ARPE-19 cells epithelialize to achieve a RPE phenotype, while others remain in a mesenchymal state. Here, we applied culture conditions that augmented the proportion of well-differentiated cells but still failed to obtain a fully differentiated cell population. Under these improved conditions, the expression of the α2β2 dimer was up-regulated, and after 4 weeks, there was a large proportion of cells with this dimer localized in a pattern resembling an apical distribution. Evidently, the α2β2 dimer was absent from the basolateral domain. The apparent apical localization probably depends on the maturation and differentiation of the apical trafficking machinery, which was also only partially achieved.
The Transcription Factor Sp1 Expressed in ARPE-19 Cells is Probably Involved in Regulating the Expression of the β2-Subunit
During re-morphogenesis, the mRNA and protein expressions of the α2 and β2 isoforms are up-regulated. It is conceivable that this long-range up-regulation suggests transcriptional regulation and thus the participation of transcription factors. Shull et al. (1989) and Ikeda et al. (1993) observed that Sp1 also activates the α2 promoter in rat and human skeletal myoblasts. Together, these data suggest that the transcription factor Sp1 is involved in the up-regulation of α2 and β2. Our observations (Figure 5) support these previous findings. Recent evidence points to a role for Sp1 in regulating the transcription of genes in response to extracellular signals such as insulin (Therien and Blostein, 2000). Hence, the addition of insulin (a component of the ITS mixture) to the culture medium could activate Sp1, promoting Na+, K+-ATPase expression via binding to positive regulatory cis-acting elements on the Na+, K+-ATPase β2 gene (Takeyasu and Kawakami, 1989; Sweadner et al., 2000; Tanos and Rodriguez-Boulan, 2008). Nevertheless, additional experiments are needed to clarify the mechanism of β2 regulation via Sp1 in ARPE-19 cells.
The Apparent Apical Polarization of the α1β1 and α2β2 Dimers in ARPE-19 Cultures
In classic epithelia, the mechanism underlying the basolateral polarization of Na+, K+-ATPase is related to the expression of the α1 and β1 subunits. Nevertheless, published reports on the isomer-specific composition of Na+, K+-ATPase in the RPE are somewhat confusing. Because the RPE originates from the neuroepithelium of the optic vesicle, we hypothesized that it would express the neuronal AMOG/β2 isoform, which was supported by our IF experiments depicted in Figures 1, 8. Nonetheless, the literature includes both consistent and contradictory reports. (a) An analysis of human RPE mRNA revealed the expression of the α1, β1 and β2 isoforms but not the α2 isoform (Ruiz et al., 1995, 1996). (b) The distribution of all subunits examined revealed that α1 and β1 were the predominant isoforms expressed in mouse and rat RPE, while the β2 isoform was detected in photoreceptors, bipolar cells and Müller glia but not in the RPE (Wetzel et al., 1999). (c) Most studies using RPE cells in vitro have utilized anti-α1 and anti-β1 antibodies for immunodetection of Na+, K+-ATPase (Miller and Steinberg, 1979; Rizzolo and Zhou, 1995; Burke et al., 2000; Kannan et al., 2006). Our observations suggest that in non-polarized ARPE-19 cells, the ubiquitous α1β1 dimer is the default housekeeping Na+ pump essential for all living cells. This dimer likely uses the non-differentiated trafficking mechanism to arrive at the plasma membrane and is then stabilized and enriched in cell-cell contacts due to β1-β1 trans interactions between neighboring cells. Considering that the β2 subunit is an adhesion molecule, in the eye, it would interact with a heterotypic adhesion protein localized on the outer segment of the photoreceptor membrane, maintaining the complex at the apical domain. Our images taken from human eye sections (Figure 8) support this assumption. Accordingly, it is plausible that Na+, K+-ATPase is only detected at the apical domain of cultured RPE cells under very specific conditions (Hu et al., 1994; Marrs et al., 1995; Rizzolo and Zhou, 1995; Kannan et al., 2006; Sonoda et al., 2010) because of the lack of an interaction of RPE cells with photoreceptors in cultures. However, in various RPE models, Na+, K+-ATPase is observed in the apical domain, even in the absence of contact with the retina. Nevertheless, no previous studies have confirmed these observations via co-staining with apical markers or surface biotinylation. Evidently, the absence of photoreceptors on the apical side of cultured RPE cells does not mean that the Na+ pump is not being sorted and delivered to that domain, but it implies that the α1β1 dimer, observed mostly using anti-α1 antibody, is actually a non-polarized pump that is directed to all membrane domains, including the apical one (Figure 6 and Hu et al., 1994; Sonoda et al., 2010; Kannan et al., 2006). Our silencing experiments support this notion, as silencing the β2 isoform diminished the apical localization of theα2β2 dimer but not that of α1β1 (Figure 10).
Apical/Basolateral Sorting of Multimeric Membrane Proteins is an Intricate Mechanism
Current models of apical/basolateral sorting mechanisms in epithelia are mostly based on evidence obtained for monomeric proteins (TfR, LDLR, and FcR; Matter et al., 1994; Gan et al., 2002; Perez Bay et al., 2014). Corresponding models for multimeric proteins, such as Na+, K+-ATPase, have not been clearly established. It is accepted that polarized proteins carry apical or basolateral sorting signals and that in some cases, two or more opposing signals co-exist in the same protein (Philp et al., 2011). In the case of Na+, K+-ATPase, the α1 subunit contains an unidentified dominant basolateral signal. However, it has been established that the β subunits also contain sorting information that is recessive relative to the basolateral signal of α1. In particular, the N-glycosylation of the β2 subunit functions as an apical sorting signal (Vagin et al., 2005). As shown by Castorino et al. (2011) for the sorting signals of CD147, the same sorting signal can be interpreted in different ways in distinct cell types. This observation justifies investigating the role of the apical sorting signal of the β2 subunit in ARPE cells. Our present observations in polarized ARPE-19 cells, summarized in Figure 12, partially clarify some of the complicated and confusing data presented in the literature, as illustrated by the following points. (a) Na+, K+-ATPase evaluated based on the expression of the β1 isoform was detected in both the basolateral and apical domains, consistent with the findings of Hu et al. (1994). (b) The predominant combination at the apical membrane domain of polarized ARPE-19 cells is the α2β2 combination, which is consistent with the concept that the α2 isoform is the preferred binding partner of the β2 isoform in assembling the Na+, K+-ATPase in different tissues (Lin et al., 2005; Harada et al., 2006; Tokhtaeva et al., 2012) and with the co-localization of α2β2 in human eye sections shown in this work. (c) Polarized ARPE-19 monolayers express Na+, K+-ATPase subunits in a membrane domain-specific pattern: α1 is detected only at the basolateral domain, α2 is present only in the apical domain (as seen in Figure 6), β1 subunits are localized in both the basolateral and apical domains, β2 subunits are preferentially localized in the apical domain, and β3 subunits are exclusively localized in the basolateral domain. Together, these results suggest that α1β1 and α1β3 are the basolateral combinations. It is unclear whether apical β1 is a mislocalized α1β1 dimer or a non-preferential combination with α2. It is most likely an α2β1 dimer because we did not detect α1 subunits in the apical domain (Figure 4). (d) IF assays in human eye sections (Figures 1, 8) reveal apical staining of the RPE using antibodies specific to α2 and β2 isoforms. These data indicate that the apical Na+, K+-ATPase in RPE cells includes the α2β2 dimer. Thus, a comprehensive analysis of the sorting machinery and trafficking routes that direct the α2β2 complex to the apical domain in polarized ARPE-19 cells must be performed in future studies.
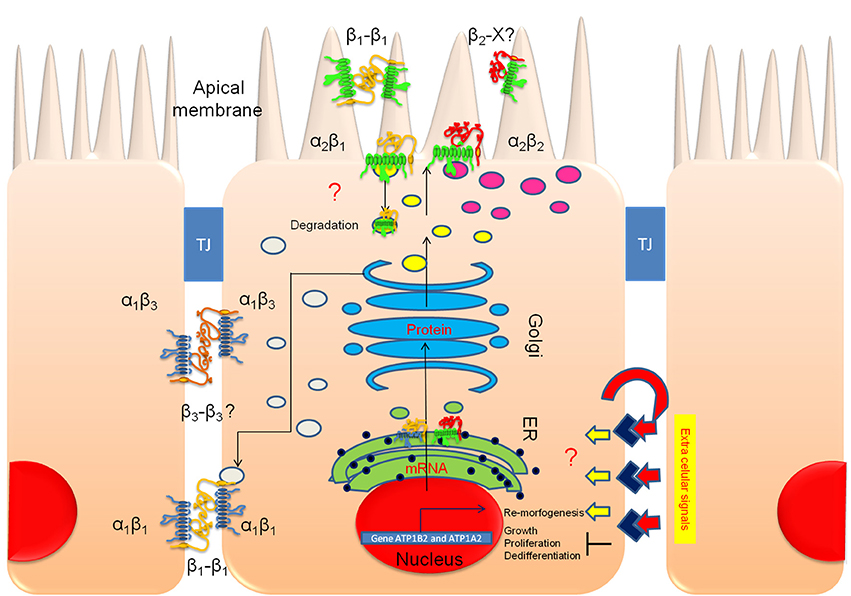
Figure 12. The apical polarization of Na+, K+-ATPase in polarized ARPE-19 cells is regulated by the β2 subunit. An illustration of polarized ARPE-19 cells cultured for 4 weeks on permeable inserts in the presence of ITS is depicted; the cells are relatively tall, express RPE markers and form adjacent tight junctions (TJs). Our model proposes that extracellular signals trigger transduction pathways that activate re-morphogenesis. In non-polarized ARPE-19 cells, a basolateral targeting mechanism carries α1β1 and α1β3 dimers to the lateral membrane (gray vesicles). The β1-β1 (and perhaps β3-β3) trans-interaction between neighboring cells stabilizes and retains these dimers at the lateral membrane domain for housekeeping. Upon the triggering of re-morphogenesis, a concurrent apical targeting mechanism is activated by the association of the α2 and β2 subunits. α2β2 is delivered to the apical domain (magenta vesicles). In cultures, this complex probably does not stabilize at the apical plasma membrane but accumulates in a sub-apical compartment. In situ, the pump is inserted in the apical membrane domain, where it is probably stabilized by heterotypic trans interaction(s) of the β2 subunit with adhesion proteins on the outer segments of the photoreceptor (β2-X).
Author Contributions
JL designed and performed the experiments, analyzed the data, made the figures and wrote the manuscript. JB, MR, and TL performed experiments. RG and JB designed the experiments and revised the manuscript. LS designed the study, analyzed the data and wrote the manuscript.
Funding
This study was supported by a grant for LS and a Doctoral scholarship for JL and TL from CONACYT-MEXICO.
Conflict of Interest Statement
The authors declare that the research was conducted in the absence of any commercial or financial relationships that could be construed as a potential conflict of interest.
Acknowledgments
The authors thank Dr. Abelardo Rodriguez (Chief Ophthalmic Pathology Service APEC, Hospital “Dr. Luis Sánchez Bulnes”) for helping with the human eye preparations. We also thank Rosalia Aguirre for her dedicated technical assistance. This work was supported by research grant and research fellowship (JALA and TLM) from CONACYT (National Research Council of México).
Abbreviations
ITS (mixture of insulin, transferrin and selenic acid); RPE (retinal pigment epithelium).
References
Ackermann, U., and Geering, K. (1990). Mutual dependence of Na, K-ATPase alpha- and beta-subunits for correct posttranslational processing and intracellular transport. FEBS Lett. 269, 105–108. doi: 10.1016/0014-5793(90)81130-G
Adijanto, J., Castorino, J. J., Wang, Z. X., Maminishkis, A., Grunwald, G. B., and Philp, N. J. (2012). Microphthalmia-associated transcription factor (MITF) promotes differentiation of human retinal pigment epithelium (RPE) by regulating microRNAs-204/211 expression. J. Biol. Chem. 287, 20491–20503. doi: 10.1074/jbc.M112.354761
Ahmado, A., Carr, A. J., Vugler, A. A., Semo, M., Gias, C., Lawrence, J. M., et al. (2011). Induction of differentiation by pyruvate and DMEM in the human retinal pigment epithelium cell line ARPE-19. Invest. Ophthalmol. Vis. Sci. 52, 7148–7159. doi: 10.1167/iovs.10-6374
Avila, J., Alvarez de la Rosa, D., González-Martínez, L. M., Lecuona, E., and Martín-Vasallo, P. (1998). Structure and expression of the human Na,K-ATPase beta 2-subunit gene. Gene 208, 221–227. doi: 10.1016/S0378-1119(97)00661-6
Blanco, G., and Mercer, R. W. (1998). Isozymes of the Na-K-ATPase: heterogeneity in structure, diversity in function. Am. J. Physiol. 275, F633–F650.
Burke, J. M. (2008). Epithelial phenotype and the RPE: is the answer blowing in the Wnt? Prog. Retin. Eye Res. 27, 579–595. doi: 10.1016/j.preteyeres.2008.08.002
Burke, J. M., Cao, F., and Irving, P. E. (2000). High levels of E-/P-cadherin: correlation with decreased apical polarity of Na/K ATPase in bovine RPE cells in situ. Invest. Ophthalmol. Vis. Sci. 41, 1945–1952. Available online at: http://iovs.arvojournals.org/article.aspx?articleid=2123633
Castorino, J. J., Deborde, S., Deora, A., Schreiner, R., Gallagher-Colombo, S. M., Rodriguez-Boulan, E., et al. (2011). Basolateral sorting signals regulating tissue-specific polarity of heteromeric monocarboxylate transporters in epithelia. Traffic 12, 483–498. doi: 10.1111/j.1600-0854.2010.01155.x
Cereijido, M., Contreras, R. G., Shoshani, L., and Larre, I. (2012). The Na+-K+-ATPase as self-adhesion molecule and hormone receptor. Am. J. Physiol. Cell Physiol. 302, C473–C481. doi: 10.1152/ajpcell.00083.2011
Cereijido, M., Shoshani, L., and Contreras, R. G. (2001). The polarized distribution of Na+, K+-ATPase and active transport across epithelia. J. Membr. Biol. 184, 299–304. doi: 10.1007/s00232-001-0097-y
Contreras, R. G., Avila, G., Gutierrez, C., Bolívar, J. J., González-Mariscal, L., Darzon, A., et al. (1989). Repolarization of Na+-K+ pumps during establishment of epithelial monolayers. Am. J. Physiol. 257, C896–C905.
Contreras, R. G., Lázaro, A., Bolivar, J. J., Flores-Maldonado, C., Sánchez, S. H., González-Mariscal, L., et al. (1995). A novel type of cell-cell cooperation between epithelial cells. J. Membr. Biol. 145, 305–310. doi: 10.1007/BF00232722
Cortas, N., Elstein, D., Markowitz, D., and Edelman, I. S. (1991). Anomalous mobilities of Na,K-ATPase alpha subunit isoforms in SDS-PAGE: identification by N-terminal sequencing. Biochim. Biophys. Acta 1070, 223–228. doi: 10.1016/0005-2736(91)90168-8
Deborde, S., Perret, E., Gravotta, D., Deora, A., Salvarezza, S., Schreiner, R., et al. (2008). Clathrin is a key regulator of basolateral polarity. Nature 452, 719–723. doi: 10.1038/nature06828
Dunbar, L. A., Aronson, P., and Caplan, M. J. (2000). A transmembrane segment determines the steady-state localization of an ion-transporting adenosine triphosphatase. J. Cell Biol. 148, 769–788. doi: 10.1083/jcb.148.4.769
Dunn, K. C., Aotaki-Keen, A. E., Putkey, F. R., and Hjelmeland, L. M. (1996). ARPE-19, a human retinal pigment epithelial cell line with differentiated properties. Exp. Eye Res. 62, 155–169. doi: 10.1006/exer.1996.0020
Ellis, M. A., Potter, B. A., Cresawn, K. O., and Weisz, O. A. (2006). Polarized biosynthetic traffic in renal epithelial cells: sorting, sorting, everywhere. Am. J. Physiol. Renal Physiol. 291, F707–F713. doi: 10.1152/ajprenal.00161.2006
Fambrough, D. M. (1988). The sodium pump becomes a family. Trends Neurosci. 11, 325–328. doi: 10.1016/0166-2236(88)90096-3
Gallagher-Colombo, S., Maminishkis, A., Tate, S., Grunwald, G. B., and Philp, N. J. (2010). Modulation of MCT3 expression during wound healing of the retinal pigment epithelium. Invest. Ophthalmol. Vis. Sci. 51, 5343–5350. doi: 10.1167/iovs.09-5028
Gan, Y., McGraw, T. E., and Rodriguez-Boulan, E. (2002). The epithelial-specific adaptor AP1B mediates post-endocytic recycling to the basolateral membrane. Nat. Cell Biol. 4, 605–609. doi: 10.1038/ncb827
Geering, K., Theulaz, I., Verrey, F., Häuptle, M. T., and Rossier, B. C. (1989). A role for the beta-subunit in the expression of functional Na+-K+-ATPase in Xenopus oocytes. Am. J. Physiol. 257, C851–C858.
Geisen, P., McColm, J. R., King, B. M., and Hartnett, M. E. (2006). Characterization of barrier properties and inducible VEGF expression of several types of retinal pigment epithelium in medium-term culture. Curr. Eye Res. 31, 739–748. doi: 10.1080/02713680600837408
Gloor, S., Antonicek, H., Sweadner, K. J., Pagliusi, S., Frank, R., Moos, M., et al. (1990). The adhesion molecule on glia (AMOG) is a homologue of the beta subunit of the Na,K-ATPase. J. Cell Biol. 110, 165–174. doi: 10.1083/jcb.110.1.165
Gonzalez, A., and Rodriguez-Boulan, E. (2009). Clathrin and AP1B: key roles in basolateral trafficking through trans-endosomal routes. FEBS Lett. 583, 3784–3795. doi: 10.1016/j.febslet.2009.10.050
Grisanti, S., and Guidry, C. (1995). Transdifferentiation of retinal pigment epithelial cells from epithelial to mesenchymal phenotype. Invest. Ophthalmol. Vis. Sci. 36, 391–405.
Gundersen, D., Orlowski, J., and Rodriguez-Boulan, E. (1991). Apical polarity of Na,K-ATPase in retinal pigment epithelium is linked to a reversal of the ankyrin-fodrin submembrane cytoskeleton. J. Cell Biol. 112, 863–872. doi: 10.1083/jcb.112.5.863
Hammerton, R. W., Krzeminski, K. A., Mays, R. W., Ryan, T. A., Wollner, D. A., and Nelson, W. J. (1991). Mechanism for regulating cell surface distribution of Na+,K(+)-ATPase in polarized epithelial cells. Science 254, 847–850. doi: 10.1126/science.1658934
Harada, K., Lin, H., Endo, Y., Fujishiro, N., Sakamoto, Y., and Inoue, M. (2006). Subunit composition and role of Na+, K+-ATPases in ventricular myocytes. J. Physiol. Sci. 56, 113–121. doi: 10.2170/physiolsci.RP001905
Hu, J. G., Gallemore, R. P., Bok, D., Lee, A. Y., and Frambach, D. A. (1994). Localization of NaK ATPase on cultured human retinal pigment epithelium. Invest. Ophthalmol. Vis. Sci. 35, 3582–3588.
Ikeda, K., Nagano, K., and Kawakami, K. (1993). Anomalous interaction of Sp1 and specific binding of an E-box-binding protein with the regulatory elements of the Na, K-ATPase alpha 2 subunit gene promoter. Eur. J. Biochem. 218, 195–204. doi: 10.1111/j.1432-1033.1993.tb18365.x
Just, F., and Walz, B. (1994). Immunocytochemical localization of Na+/K(+)-ATPase and V-H(+)-ATPase in the salivary glands of the cockroach, periplaneta americana. Cell Tissue Res. 278, 161–170.
Kannan, R., Zhang, N., Sreekumar, P. G., Spee, C. K., Rodriguez, A., Barron, E., et al. (2006). Stimulation of apical and basolateral VEGF-A and VEGF-C secretion by oxidative stress in polarized retinal pigment epithelial cells. Mol. Vis. 12, 1649–1659. Available online at: http://www.molvis.org/molvis/v12/a189/
Kaplan, J. H. (2002). Biochemistry of Na,K-ATPase. Annu. Rev. Biochem. 71, 511–535. doi: 10.1146/annurev.biochem.71.102201.141218
Kawakami, K., Okamoto, H., Yagawa, Y., and Nagano, K. (1990). Regulation of Na+,K(+)-ATPase. II. Cloning and analysis of the 5′-flanking region of the rat NKAB2 gene encoding the beta 2 subunit. Gene 91, 271–274. doi: 10.1016/0378-1119(90)90099-D
Kawakami, K., Suzuki-Yagawa, Y., Watanabe, Y., and Nagano, K. (1992). Identification and characterization of the cis-elements regulating the rat AMOG (adhesion molecule on glia)/Na, K-ATPase beta 2 subunit gene. J. Biochem. 111, 515–522.
Kivelä, T., Jääskeläinen, J., Vaheri, A., and Carpén, O. (2000). Ezrin, a membrane-organizing protein, as a polarization marker of the retinal pigment epithelium in vertebrates. Cell Tissue Res. 301, 217–223. doi: 10.1007/s004410000225
Lehmann, G. L., Benedicto, I., Philp, N. J., and Rodriguez-Boulan, E. (2014). Plasma membrane protein polarity and trafficking in RPE cells: past, present and future. Exp. Eye Res. 126, 5–15. doi: 10.1016/j.exer.2014.04.021
Lin, H., Ozaki, S., Fujishiro, N., Takeda, K., Imanaga, I., Prestwich, G. D., et al. (2005). Subunit composition and role of Na+,K+-ATPases in adrenal chromaffin cells. J. Physiol. 564, 161–172. doi: 10.1113/jphysiol.2004.081455
Livak, K. J., and Schmittgen, T. D. (2001). Analysis of relative gene expression data using real-time quantitative PCR and the 2(-Delta Delta C (T)) method. Methods 25, 402–408. doi: 10.1006/meth.2001.1262
Luo, Y., Zhuo, Y., Fukuhara, M., and Rizzolo, L. J. (2006). Effects of culture conditions on heterogeneity and the apical junctional complex of the ARPE-19 cell line. Invest. Ophthalmol. Vis. Sci. 47, 3644–3655. doi: 10.1167/iovs.06-0166
Marrs, J. A., Andersson-Fisone, C., Jeong, M. C., Cohen-Gould, L., Zurzolo, C., Nabi, I. R., et al. (1995). Plasticity in epithelial cell phenotype: modulation by expression of different cadherin cell adhesion molecules. J. Cell Biol. 129, 507–519. doi: 10.1083/jcb.129.2.507
Martin-Vasallo, P., Dackowski, W., Emanuel, J. R., and Levenson, R. (1989). Identification of a putative isoform of the Na,K-ATPase beta subunit. Primary structure and tissue-specific expression. J. Biol. Chem. 264, 4613–4618.
Matter, K., Yamamoto, E. M., and Mellman, I. (1994). Structural requirements and sequence motifs for polarized sorting and endocytosis of LDL and Fc receptors in MDCK cells. J. Cell Biol. 126, 991–1004. doi: 10.1083/jcb.126.4.991
Mays, R. W., Siemers, K. A., Fritz, B. A., Lowe, A. W., van Meer, G., and Nelson, W. J. (1995). Hierarchy of mechanisms involved in generating Na/K-ATPase polarity in MDCK epithelial cells. J. Cell Biol. 130, 1105–1115. doi: 10.1083/jcb.130.5.1105
Miller, S. S., and Steinberg, R. H. (1979). Potassium modulation of taurine transport across the frog retinal pigment epithelium. J. Gen. Physiol. 74, 237–259. doi: 10.1085/jgp.74.2.237
Muth, T. R., Gottardi, C. J., Roush, D. L., and Caplan, M. J. (1998). A basolateral sorting signal is encoded in the alpha-subunit of Na-K-ATPase. Am. J. Physiol. 274, C688–C696.
Noguchi, S., Mishina, M., Kawamura, M., and Numa, S. (1987). Expression of functional (Na+ + K+)-ATPase from cloned cDNAs. FEBS Lett. 225, 27–32. doi: 10.1016/0014-5793(87)81125-0
Ohtsubo, M., Noguchi, S., Takeda, K., Morohashi, M., and Kawamura, M. (1990). Site-directed mutagenesis of Asp-376, the catalytic phosphorylation site, and Lys-507, the putative ATP-binding site, of the alpha-subunit of Torpedo californica Na+/K(+)-ATPase. Biochim. Biophys. Acta 1021, 157–160. doi: 10.1016/0005-2736(90)90028-M
Okami, T., Yamamoto, A., Omori, K., Takada, T., Uyama, M., and Tashiro, Y. (1990). Immunocytochemical localization of Na+,K(+)-ATPase in rat retinal pigment epithelial cells. J. Histochem. Cytochem. 38, 1267–1275. doi: 10.1177/38.9.2167328
Padilla-Benavides, T., Roldán, M. L., Larre, I., Flores-Benitez, D., Villegas-Sepúlveda, N., Contreras, R. G., et al. (2010). The polarized distribution of Na+, K+-ATPase: role of the interaction between {beta} subunits. Mol. Biol. Cell 21, 2217–2225. doi: 10.1091/mbc.E10-01-0081
Perez Bay, A. E., Schreiner, R., Benedicto, I., and Rodriguez-Boulan, E. J. (2014). Galectin-4-mediated transcytosis of transferrin receptor. J. Cell Sci. 127, 4457–4469. doi: 10.1242/jcs.153437
Philp, N. J., Shoshani, L., Cereijido, M., and Rodriguez-Boulan, E. (2011). “Epithelial domains,” in Cellular Membrane Domains, ed I. R. Nabi (Hoboken, NJ: John Wiley & Sons, Inc.), 351–369.
Rizzolo, L. J., and Zhou, S. (1995). The distribution of Na+,K(+)-ATPase and 5A11 antigen in apical microvilli of the retinal pigment epithelium is unrelated to alpha-spectrin. J. Cell Sci. 108, 3623–3633.
Rodriguez-Boulan, E., Kreitzer, G., and Müsch, A. (2005). Organization of vesicular trafficking in epithelia. Nat. Rev. Mol. Cell Biol. 6, 233–247. doi: 10.1038/nrm1593
Ruiz, A., Bhat, S. P., and Bok, D. (1995). Characterization and quantification of full-length and truncated Na,K-ATPase alpha 1 and beta 1 RNA transcripts expressed in human retinal pigment epithelium. Gene 155, 179–184. doi: 10.1016/0378-1119(94)00812-7
Ruiz, A., Bhat, S. P., and Bok, D. (1996). Expression and synthesis of the Na,K-ATPase beta 2 subunit in human retinal pigment epithelium. Gene 176, 237–242. doi: 10.1016/0378-1119(96)00258-2
Samson, S. L., and Wong, N. C. (2002). Role of Sp1 in insulin regulation of gene expression. J. Mol. Endocrinol. 29, 265–279. doi: 10.1677/jme.0.0290265
Shoshani, L., Contreras, R. G., Roldán, M. L., Moreno, J., Lázaro, A., Balda, M. S., et al. (2005). The polarized expression of Na+,K+-ATPase in epithelia depends on the association between beta-subunits located in neighboring cells. Mol. Biol. Cell 16, 1071–1081. doi: 10.1091/mbc.E04-03-0267
Shull, M. M., Pugh, D. G., and Lingrel, J. B. (1989). Characterization of the human Na, K-ATPase alpha 2 gene and identification of intragenic restriction fragment length polymorphisms. J. Biol. Chem. 264, 17532–17543.
Sonoda, S., Sreekumar, P. G., Kase, S., Spee, C., Ryan, S. J., Kannan, R., et al. (2010). Attainment of polarity promotes growth factor secretion by retinal pigment epithelial cells: relevance to age-related macular degeneration. Aging 2, 28–42. doi: 10.18632/aging.100111
Sweadner, K. J., Wetzel, R. K., and Arystarkhova, E. (2000). Genomic organization of the human FXYD2 gene encoding the gamma subunit of the Na,K-ATPase. Biochem. Biophys. Res. Commun. 279, 196–201. doi: 10.1006/bbrc.2000.3907
Takeyasu, K., and Kawakami, K. (1989). [Na+,K(+)-ATPase: genes, expression and membrane insertion]. Seikagaku 61, 394–401.
Tamiya, S., Liu, L., and Kaplan, H. J. (2010). Epithelial-mesenchymal transition and proliferation of retinal pigment epithelial cells initiated upon loss of cell-cell contact. Invest. Ophthalmol. Vis. Sci. 51, 2755–2763. doi: 10.1167/iovs.09-4725
Tanos, B., and Rodriguez-Boulan, E. (2008). The epithelial polarity program: machineries involved and their hijacking by cancer. Oncogene 27, 6939–6957. doi: 10.1038/onc.2008.345
Therien, A. G., and Blostein, R. (2000). Mechanisms of sodium pump regulation. Am. J. Physiol. Cell Physiol. 279, C541–C566. Available online at: http://ajpcell.physiology.org/content/279/3/C541.long
Tokhtaeva, E., Clifford, R. J., Kaplan, J. H., Sachs, G., and Vagin, O. (2012). Subunit isoform selectivity in assembly of Na,K-ATPase α-β heterodimers. J. Biol. Chem. 287, 26115–26125. doi: 10.1074/jbc.M112.370734
Vagin, O., Tokhtaeva, E., and Sachs, G. (2006). The role of the beta1 subunit of the Na,K-ATPase and its glycosylation in cell-cell adhesion. J. Biol. Chem. 281, 39573–39587. doi: 10.1074/jbc.M606507200
Vagin, O., Turdikulova, S., and Sachs, G. (2005). Recombinant addition of N-glycosylation sites to the basolateral Na,K-ATPase beta1 subunit results in its clustering in caveolae and apical sorting in HGT-1 cells. J. Biol. Chem. 280, 43159–43167. doi: 10.1074/jbc.M508262200
Weisz, O. A., and Rodriguez-Boulan, E. (2009). Apical trafficking in epithelial cells: signals, clusters and motors. J. Cell Sci. 122, 4253–4266. doi: 10.1242/jcs.032615
Wetzel, R. K., Arystarkhova, E., and Sweadner, K. J. (1999). Cellular and subcellular specification of Na,K-ATPase alpha and beta isoforms in the postnatal development of mouse retina. J. Neurosci. 19, 9878–9889.
Wilson, P. D., Devuyst, O., Li, X., Gatti, L., Falkenstein, D., and Robinson, S. (2000). Apical plasma membrane mispolarization of NaK-ATPase in polycystic kidney disease epithelia is associated with aberrant expression of the beta2 isoform. Am. J. Pathol. 156, 253–268. doi: 10.1016/S0002-9440(10)64726-8
Keywords: Na+, K+-ATPase, retinal pigment epithelium, apical polarity, ARPE-19, AMOG/β2, re-morphogenesis
Citation: Lobato-Álvarez JA, Roldán ML, López-Murillo TC, González-Ramírez R, Bonilla-Delgado J and Shoshani L (2016) The Apical Localization of Na+, K+-ATPase in Cultured Human Retinal Pigment Epithelial Cells Depends on Expression of the β2 Subunit. Front. Physiol. 7:450. doi: 10.3389/fphys.2016.00450
Received: 26 May 2016; Accepted: 20 September 2016;
Published: 07 October 2016.
Edited by:
Olga Vagin, University of California, Los Angeles, USACopyright © 2016 Lobato-Álvarez, Roldán, López-Murillo, González-Ramírez, Bonilla-Delgado and Shoshani. This is an open-access article distributed under the terms of the Creative Commons Attribution License (CC BY). The use, distribution or reproduction in other forums is permitted, provided the original author(s) or licensor are credited and that the original publication in this journal is cited, in accordance with accepted academic practice. No use, distribution or reproduction is permitted which does not comply with these terms.
*Correspondence: Liora Shoshani, liora.shoshani@gmail.com; shoshani@fisio.cinvestav.mx