 Vincent Pichot
 Frédéric Roche
 Sébastien Celle1
 Jean-Claude Barthélémy
 Florian Chouchou
- 1EA SNA-EPIS 4607, Department of Clinical and Exercise Physiology, University of Lyon, Jean Monnet University, Saint-Etienne, France
- 2NeuroPain Unit, Lyon Neuroscience Research Centre, Institut National de la Santé et de la Recherche Médicale U 1028/Centre National de la Recherche Scientifique UMR 5292, University of Lyon, Lyon, France
Since the pioneering studies of the 1960s, heart rate variability (HRV) has become an increasingly used non-invasive tool for examining cardiac autonomic functions and dysfunctions in various populations and conditions. Many calculation methods have been developed to address these issues, each with their strengths and weaknesses. Although, its interpretation may remain difficult, this technique provides, from a non-invasive approach, reliable physiological information that was previously inaccessible, in many fields including death and health prediction, training and overtraining, cardiac and respiratory rehabilitation, sleep-disordered breathing, large cohort follow-ups, children's autonomic status, anesthesia, or neurophysiological studies. In this context, we developed HRVanalysis, a software to analyse HRV, used and improved for over 20 years and, thus, designed to meet laboratory requirements. The main strength of HRVanalysis is its wide application scope. In addition to standard analysis over short and long periods of RR intervals, the software allows time-frequency analysis using wavelet transform as well as analysis of autonomic nervous system status on surrounding scored events and on preselected labeled areas. Moreover, the interface is designed for easy study of large cohorts, including batch mode signal processing to avoid running repetitive operations. Results are displayed as figures or saved in TXT files directly employable in statistical softwares. Recordings can arise from RR or EKG files of different types such as cardiofrequencemeters, holters EKG, polygraphs, and data acquisition systems. HRVanalysis can be downloaded freely from the Web page at: https://anslabtools.univ-st-etienne.fr HRVanalysis is meticulously maintained and developed for in-house laboratory use. In this article, after a brief description of the context, we present an overall view of HRV analysis and we describe the methodological approach of the different techniques provided by the software.
Introduction
In the 18th century, Stephen Hales was the first to note that pulse fluctuations were related to blood pressure and respiratory rate (Lewis, 1994; Billman, 2011). However, not until the 1960s was interest renewed in spontaneous changes in cardiovascular parameters (Hon and Lee, 1963; Luczak and Laurig, 1973; Sayers, 1973; Billman, 2011). This opened the way to an understanding of cardiovascular regulation. Since then, considerable advances have been made in explorations of the autonomic nervous system (ANS) through examinations of heart rate variability (HRV)—or RR interval variability—which quantifies the successive variations in the interval from the peak of one QRS complex to the peak of the next, as shown on an electrocardiogram.
Although, the results interpretation has been the subject of intense criticism (Eckberg, 1997, 1998; Malik, 1998; Malliani et al., 1998; Sleight and Bernardi, 1998; Billman, 2013), the HRV method is widely used today (Rajendra Acharya et al., 2006; Chouchou and Desseilles, 2014). Generally speaking, cardiac activity is controlled by both the sympathetic and parasympathetic systems (Guyenet, 2006), which induce heart rate oscillations at different rhythms. The analysis of these oscillations allows assessing the initial efferent autonomic nervous activity. Pharmacological studies in animals and humans have identified physiological rhythm components of HRV (Sayers, 1973; Akselrod et al., 1981; Pomeranz et al., 1985). Overall, it has been shown that rapid changes of heart rate are due to parasympathetic activity, whereas slower changes are due to both parasympathetic and sympathetic activity. In this view, HRV analysis provides a non-invasive approach that allows examining physiological phenomena that were previously inaccessible, and which are often associated to health.
Several methods for HRV quantification have been developed. They can be classified into frequency, temporal, nonlinear, and time-frequency analysis methods (Rajendra Acharya et al., 2006), and they are used in a variety of research fields, as evidenced by the growing number of publications on HRV analysis (Figure 1). Furthermore, HRV analysis indices have a wide range of applications, including research in physiology, cardiology, sport, health, mortality prediction, sleep, and pain, as well as for routine procedures in medicine and sports. The available data for HRV analysis therefore include RR interval series obtained from Holter systems or heart rate monitors or EKG data from acquisition or polygraph systems. Analyses can focus on short-duration recordings or 24-h recordings, and the data may concern small subject samples as well as large cohorts of hundreds or thousands of subjects, as in mortality prediction studies. Several HRV analysis methods are currently available, including Holter and heart rate monitor systems and free independent software such as Kubios (Tarvainen et al., 2014), Kardia (Perakakis et al., 2010), ARTiiFACT (Kaufmann et al., 2011), POLYAN (Maestri and Pinna, 1998), RHRV (Rodriguez-Linares et al., 2011), ECGLab (Carvalho et al., 2002), and the HRV Toolkit developed by the PhysioNet Project (Goldberger et al., 2000), each with its own specificity. Drawing on a large panel of users, we developed HRVanalysis (version 1.0), a software that includes a wide range of HRV analysis functions, from local to 24 h-recording, from single to large cohort files, and supporting various import formats. HRVanalysis is the outcome of almost 20 years of expertise, with each feature developed and improved for optimum adaptability to a variety of settings. The objective of this article is to provide an overall view of HRV analysis to a large community of users, to present the different proposed techniques along with their interests and limits, to detail the pre-processing of RR series, and, to present the wide possibilities of analysis allowed by the software.
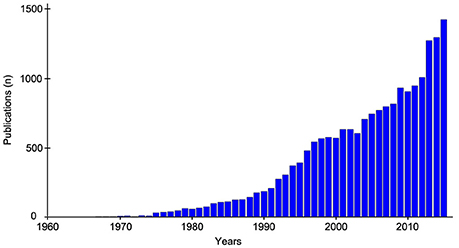
Figure 1. Evolution of the annual number of publication related to Heart rate variability since 1960. Medline search based on the terms “heart rate variability” or “RR intervals variablityi.”
HRV: Different Methods for Different Types of Exploration of Cardiac Autonomic Function
Time-Domain Analysis
Time-domain analysis is applied to quantify HRV using indices based on means or standard deviations, generally calculated over long-term recordings, typically 24 h (Kleiger et al., 1995; Balocchi et al., 2006; Rajendra Acharya et al., 2006). Because these indices represent short- to long-term variations in RR intervals, some indices are dependent on the recording length. It is therefore recommended to perform the calculations on recordings of similar duration to allow comparisons between measures or subjects.
The standard deviation of normal-to-normal intervals (SDNN) represents the variability over the entire recording period, giving the overall autonomic modulation regardless of sympathetic or parasympathetic arm. Some indices have been developed to quantify high frequency variations arising from parasympathetic activity such as the pNN50, calculated as the percent difference between adjacent normal RR intervals greater than 50 ms, and the rMSSD, calculated as the square root of the mean of the sum of the squared differences between adjacent normal RR intervals. The SDANN index, calculated as the standard deviation of the mean of all normal RR intervals for 5-min segments, quantifies the changes in heart rate due to cycles longer than 5 min. The SDNNIDX index, calculated as the mean of the standard deviation of all normal RR intervals for all 5-min segments, quantifies the changes in heart rate due to cycles shorter than 5 min (Task Force of the European Society of Cardiology and the North American Society of Pacing and Electrophysiology, 1996).
Geometrical Analysis
The geometrical indices are calculated on the sample density distribution of the RR intervals, which corresponds to the assignment of the number of equally long RR intervals to each value of their length (Malik, 1995; Task Force of the European Society of Cardiology and the North American Society of Pacing and Electrophysiology, 1996; Rajendra Acharya et al., 2006). The main studies that have validated this method have used bins of 7.8125 ms width that were adapted for RR series obtained from EKG at a sampling rate of 128 Hz. To allow comparisons, this bin width must be the same, regardless of the EKG sampling rate. Thus, for sampling rates other than 128 Hz, the sample density distribution graph presents discontinuities, and is then reconstructed by smoothing the curve using a moving average function. The HRV triangular index is calculated as the integral of the density distribution divided by the maximum of the density distribution (Y). The histogram can be interpolated as a triangle, using the minimum square difference. The triangular interpolation of the RR interval histogram (TINN) is the baseline width of this triangle.
These measures quantify overall HRV, and are influenced mainly by slow—but not rapid—oscillations of RR intervals (Malik et al., 1989). This geometrical method provides a good-quality analysis but requires a reasonable number of beats for effective application.
Frequency-Domain Analysis: Fourier Transforms
The power spectral density (PSD) defined using Fourier transform is used to assess the different frequencies in the RR series. The spectrum is calculated using Welch's periodogram algorithm with a Hamming window of 256 points, an overlap of 50%, and at a precision of 256 points/Hz. The analyzed series can also be resampled from 1 to 8 Hz. The frequency indices are calculated as the integral of the PSD in specific bands of interest, as standardized by the Task Force in 1996 (Task Force of the European Society of Cardiology and the North American Society of Pacing and Electrophysiology, 1996). After that time, frequency-domain analyses of HRV were recommended to be performed on short-term 5-min recording segments and on long-term segments of typically 24 h. The two durations involve different bands of interest. The default bandwidths used to calculate the total power (Ptot), ultra-low frequencies (ULF), very low frequencies (VLF), low frequencies (LF), and high frequencies (HF) are summarized in Table 1. For short-term analyses, LF and HF are also expressed as normalized values LFnu = 100*LF/(Ptot-VLF) and HFnu = 100*HF/(Ptot-VLF), and the LF/HF ratio is calculated (Table 1).
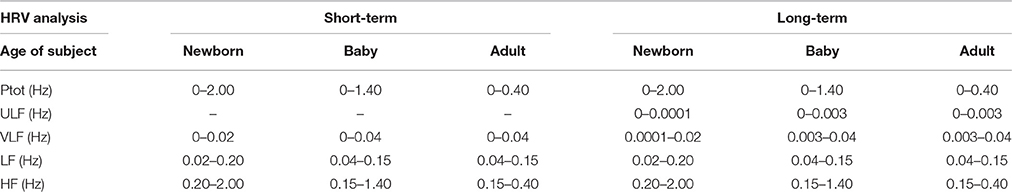
Table 1. Default bandwidth utilized for the calculation of frequency indices.
Total spectral power (Ptot) indicates overall HRV, and is used to assess overall autonomic cardiac modulation as well as the SDNN parameter. HF power represents short-term HR variation. Studies have shown that injected atropine completely eliminated HF power (Akselrod et al., 1981; Pomeranz et al., 1985). Thus, HF power is modulated by parasympathetic activity only, corresponding to peak respiratory rate. Pharmacological studies have shown that muscarinic cholinergic blocker and beta-adrenergic blocker lowered LF power, enhanced by dual blockade (Akselrod et al., 1981; Pomeranz et al., 1985). Both parasympathetic and sympathetic cardiac activity would therefore be associated with HR power in the LF band. Saul et al. (1990) and others (Pagani et al., 1997) showed a concomitant increase in LF power and muscle sympathetic nerve activity measured by microneurography. Furthermore, under atropine, LF power increased during orthostatic testing (Taylor et al., 1998). Although, these studies showed sympathetic cardiac modulation in LF power, changes in LF power can be interpreted only in relation to HF power. Accordingly, normalized indexes such as the LF/HF ratio, LFnu, and HFnu are used to examine this relationship.
To summarize, whereas HF power is modulated by parasympathetic modulation, LF power is controlled by both sympathetic and parasympathetic activity, and normalized indexes or the LF/HF ratio are used to estimate sympathetic modulation and autonomic equilibrium (Pagani et al., 1984) although this last index remains criticized (Billman, 2013).
Time-Frequency Transforms: Transit Changes in HRV
None of the above-described methods allow temporal localization of sudden changes in RR signal behavior. To overcome these limitations, we applied wavelet transform (Pichot et al., 1999), which obtains a temporally localized sliding analysis of the signal, providing access to the heart rate variability at any time, for example, when the autonomous nervous system equilibrium is suddenly disrupted by an acute clinical situation or a physiological laboratory intervention. This method has been used successfully to assess autonomic reactivity to tilt tests (Jasson et al., 1997), exercise (Tiinanen et al., 2009), sleep apneas (Chouchou et al., 2014), experimental pain (Chouchou et al., 2011), generalized interictal EEG discharge (Sforza et al., 2014), pharmacological blockades (Pichot et al., 1999) and, anesthesia (Pichot et al., 2001).
For the analysis, a temporal sliding window of different weights (corresponding to different analysis levels or frequency ranges) containing the wavelet function is shifted along the signal. The weight characterizes a family member with a particular dilatation factor. The calculation gives a serial list of wavelet coefficients, which represent changes in the correlation between the RR signal and a given wavelet at different levels of analysis (or different frequency ranges) along the signal. The correspondence between wavelet coefficients and frequencies allows calculating the standard, ULF, VLF, LF, HF, LFnu, HFnu, and the LF/HF ratio along time. A complete description of this method, which is implemented in the software, is available in two previously published articles (Pichot et al., 1999; Wiklund et al., 2002).
A Nonlinear Approach: The Complexity of HRV
An alternative, nonlinear approach was proposed to examine cardiac autonomic control (Voss et al., 1995). In recent years, interest has grown in the nonlinear dynamics that characterize autonomic cardiovascular control (Rajendra Acharya et al., 2006; Maestri et al., 2007b). Investigations of the complex feedback loops that impact the cardiac function have led to new indices designed to reflect signal complexity. We therefore incorporate certain of these indices that have proven useful for HRV interpretation and for health and mortality prediction (Maestri et al., 2007a; Huikuri et al., 2009).
Poincaré Plot
The Poincaré plot, also called the Lorenz plot, is a graphic tool used to visualize a series of RR intervals (Kamen et al., 1996). SD1 and SD2 are calculated as the standard deviation of the distances of the RR intervals from the y = x line and the y = −x + 2*mean (RR) line, respectively. The SD1/SD2 ratio is also calculated. SD1 represents short-term RR variability and SD2 represents long-term variability.
Fractality
The analysis of the fractality of heart rate variability consist to quantify the repetition of patterns display at different scales. Many methods are available:
The detrended fluctuation analysis (DFA) is used to quantify the degree of self-similarity (fractuality) of the RR signal by calculating the average amount of RR fluctuation at different bin sizes. A detailed description of the method is provided in Peng et al. (1995). Briefly, the root-mean-square fluctuations of integrated and detrended RR series are measured across windows of different sizes and plotted according to the size of the observation window on a log-log scale. Two scaling exponents α1 and α2 are then calculated as the slope of the fluctuation = f (window size) line, for short- and long-term fluctuations, respectively.
Similarly, the Hurst exponent (H) measures the self-similarity of the RR signal. A fractal signal will result in an exponent value of around 1, a random signal will result in a value of 0.5, and strongly correlated signal behavior will result in a value of 1.5.
The power-law slope (ß) is influenced mainly by autonomic input to the heart. It quantifies the complexity of the RR interval in the long term, from minutes to hours. The ß index is the slope calculated on the PSD plotted on a log-log scale from 10−4 to 10−2 Hz (Bigger et al., 1996). The smaller the slope, the greater the loss of complexity. A value of −1.5 was determined to be the optimum threshold to predict mortality in the elderly (Huikuri et al., 1998; Makikallio et al., 2001).
Also, Higuchi and Katz algorithms were proposed to determine the fractal dimension of heart rate variability signal (Rajendra Acharya et al., 2006).
Entropy
Applied to heart rate variability, entropy is a measure of the regularity and complexity of pattern of different length. Entropy is high when the patterns are identicaly distributed and decreases if some patterns are more likely. Many indices have been proposed: the Shanon entropy and its derived indices (conditional entropy, corrected conditional entropy, normalized corrected conditional entropy) (Porta et al., 1998), the sample entropy (Richman and Moorman, 2000) and approximate entropy (Pincus and Goldberger, 1994). Another way to measure the rate of patterns recurrences in RR series is the Lempel-Ziv complexity (Ferrario et al., 2004).
Heart Rate Turbulence
Heart rate turbulence (HRT) denotes the fluctuations in RR following a single premature ventricular contraction (PVC) (Bauer et al., 2008), typically involving an early 2-to-3-beat acceleration phase, a late 10-to-20-beat deceleration phase, and a return to the base RR interval. The method consists of aligning and averaging all recorded PVCs in order to plot the PVC tachogram. The obtained pattern is characterized by two indices. Turbulence onset (TO) is the amount of acceleration following a PVC (i.e., the difference between the mean of the two RR intervals immediately following a PVC and the mean of the two RR intervals preceding the PVC). The turbulence slope (TS) corresponds to the steepest slope for five consecutive RR intervals within the 15 beats following a PVC. The TO quantifies the vagal withdrawal, and TS is explained by vagal reactivation (Bauer et al., 2008). HRT has been demonstrated a powerfull risk stratifiers after acute myocardial infarction (Schmidt et al., 1999). HRT calculation requires several PVCs, and is usually calculated on long-duration recordings, typically 24 h.
Deceleration and Acceleration Capacities
These two indices are used to estimate the vagal and sympathetic capacities by analyzing heart deceleration and acceleration capacity (Bauer et al., 2006). The method consists of finding all sequences of two successive RR beats that increase (deceleration) in order to align and average the segments surrounding the sequences. From the obtained pattern, the deceleration capacity (DC) is calculated as the difference between the mean of the two beats following deceleration and the mean of the two beats before deceleration. Similarly, the acceleration capacity (AC) is calculated by detecting all sequences that decrease. The DC index has been demonstrated to predict mortality after myocardial infarction (Bauer et al., 2006).
Largest Lyapunov Exponent
The largest Lyapunov exponent is used in nonlinear analysis of physiological signals for detecting chaos (Wolf et al., 1985). Indeed, its value will tend to zero for slowly varing RR signals, and will increases as the variations of the RR is higher (Acharya et al., 2004).
Symbolic Dynamics
The principal of this analysis is to spread the chosen RR sequence on a fixed number of levels, to transform it into short patterns, to classified all patterns according to the direction of variation of the successive RRs (0V, 1V, 2LV, 2UV), and to evaluate their rates of occurrence (Porta et al., 2001). This method allows to study short heart rate variability pattern behavior. For example, the symbolic dynamics permitted to elucidate the neural pathophysiological mechanisms preceding acute cardiac events (Guzzetti et al., 2005).
Empirical Mode Decomposition
This principle of this analysis, adapted for nonlinear and non-stationar time series, is to decompose them into a limited number of oscillatory components (modes) from which are calculated the instantaneous frequencies (Balocchi et al., 2004). Then, the powers associated to selected modes corresponding to the low and high frequencies are calculated (pLF1, pLF2, pHF1, and pHF2), as well as the ratios between low and high frequency indices (IMAI1 and IMAI2).
Limitations
Cardiac activity is controlled by the sympathetic and parasympathetic systems as well as hormonal system (Guyenet, 2006). These systems induce heart rate oscillations at different rhythms and HRV methods are used to study these rhythms and consequently autonomic cardiac modulations.
Slow and fast oscillations do not carry the same accuracy to represent sympathetic and parasympathetic activities. HRV analysis has been demonstrated reliable in assessing parasympathetic activity (Sayers, 1973; Akselrod et al., 1981; Pomeranz et al., 1985) while this method remains less accurate to assess sympathetic activity as heart rate slow changes are related partly to sympathetic and parasympathetic activity (Task Force of the European Society of Cardiology and the North American Society of Pacing and Electrophysiology, 1996). A better approach of sympathetic activity relies on examining relative changes in the LF/HF ratio and LF%, or SD1/SD2 (Pagani et al., 1984; Tulppo et al., 1996; Malliani et al., 1998). Several studies have shown that relative changes in fast- and slow-oscillations allow approaching relative sympathetic activity in response to tilt testing under atropine (Taylor et al., 1998) or experimental pain (Burton et al., 2009; Chouchou et al., 2011).
Furthermore, some indices, such as temporal indices for example, depend on the length of the selected RR series to analyse while other are not, such as PSD. Ideally, except for time-frequency analyses, the data should be stationary (Chouchou et al., 2009), not less than 5-min duration or 250 beats, recorded over comparable time period, and in similar situations as sitting, upright, lying for example (Bahjaoui-Bouhaddi et al., 2000).
Also, interpretation of HRV indices remains especially debated in long-term recordings, because major determinants of HRV such as environmental factors, physical activity, and sleep duration vary significantly over time (Lombardi and Stein, 2011). Thus, HRV indices can be calculated on the whole RR sample or as the mean of successive epochs. Users might be aware of that and can refer to Table 2 for these specifications.
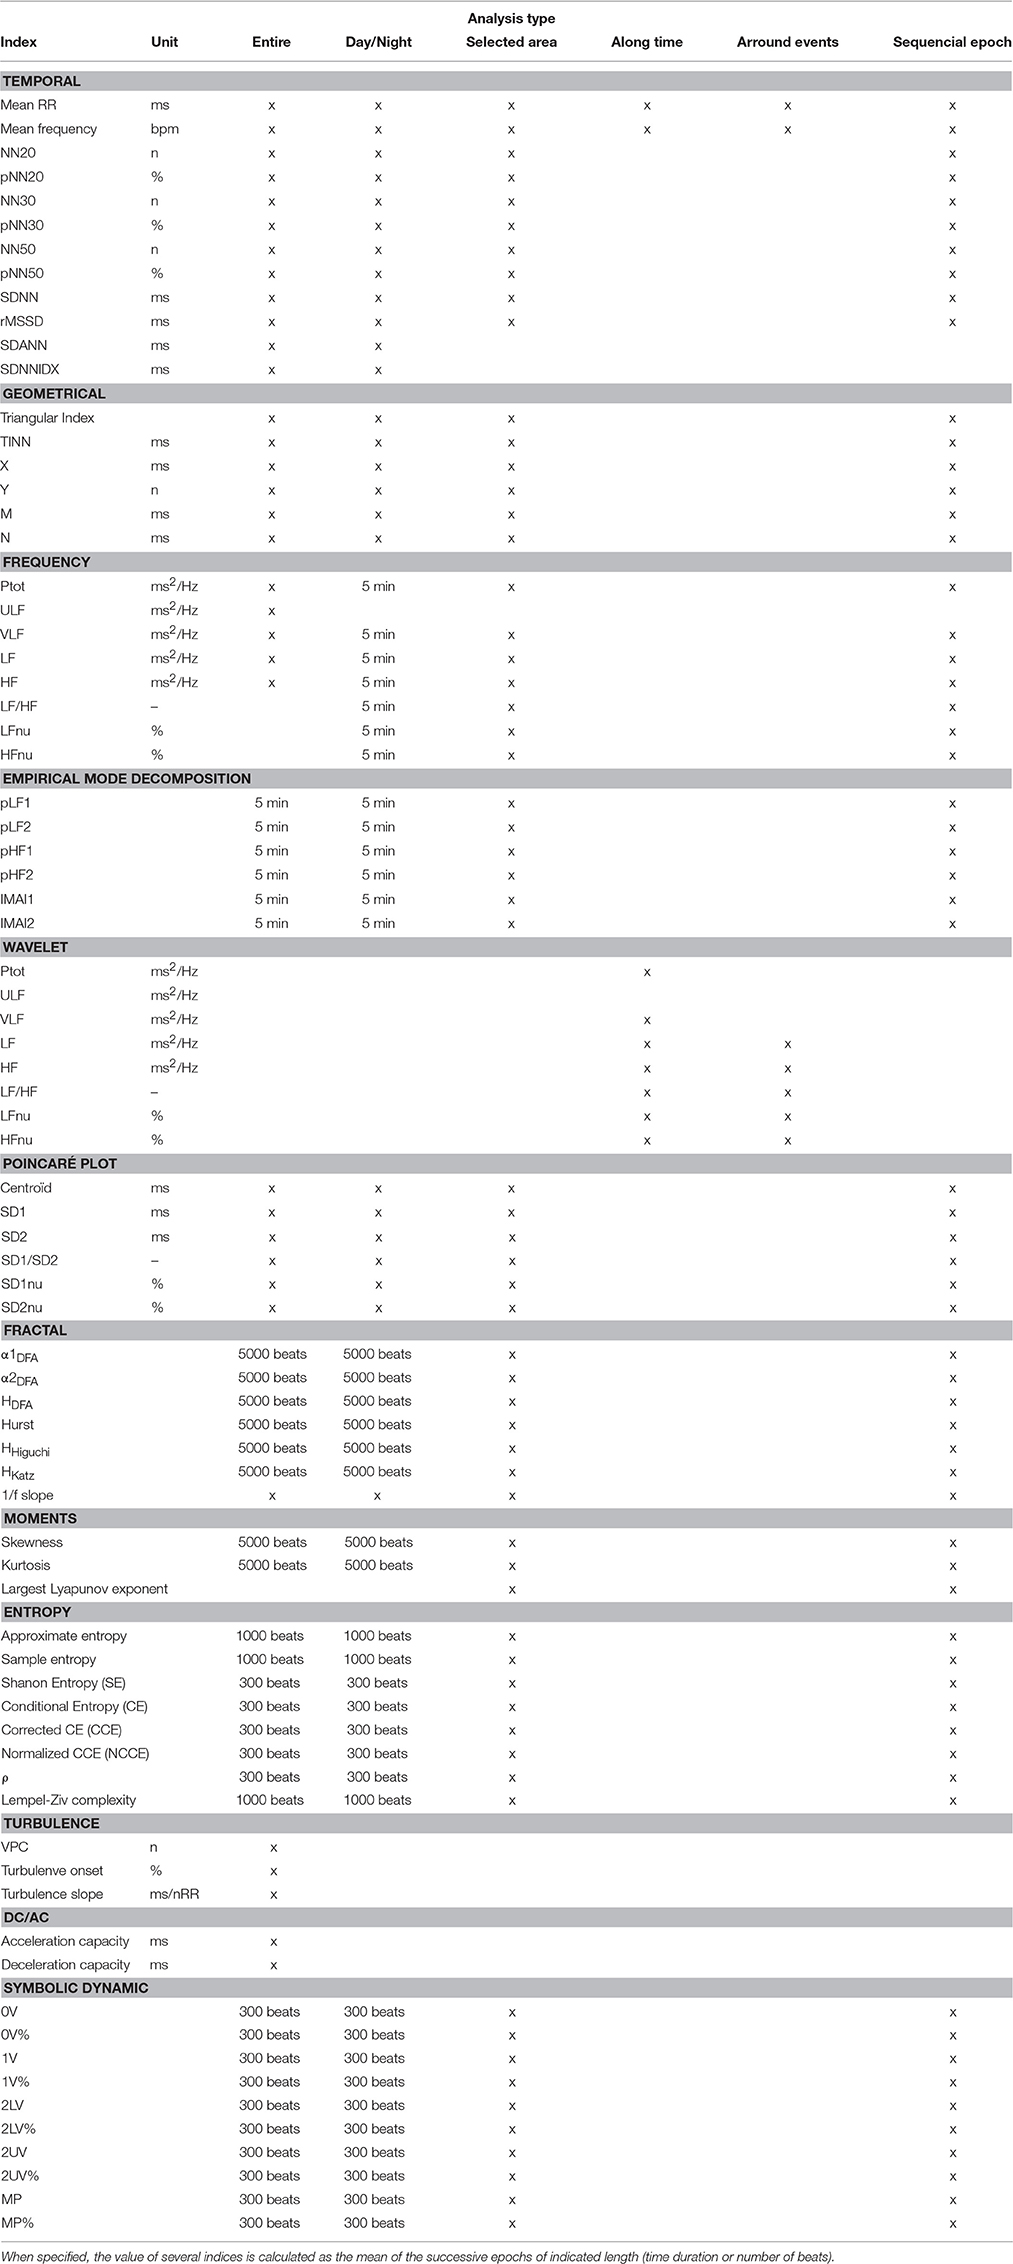
Table 2. HRV indices calculated in HRVanalysis program.
The software is optimized for analysing RR signal arizing from human recordings. R-peaks detection as well as HRV anayses can be performed on animal dataset by setting the adapted parameters in the preferences window. However, users must verify the accuracy of the methods for animals while some of them have been previously validated, such as Fourier analysis (Cerutti et al., 1991), others are not commonly use.
Finally, HRV analysis requires clean RR series while noisy recordings may lead to invalid physiological interpretations (Saul et al., 1988). An accurate preprocessing based on interpolation is usually utilize to correct for missing and extra beats.
Signal Processing and Software Description
The RR recording processing is decomposed in three data treatment steps: (1) RR importation or R peaks detection, (2) RR corrections and formatting, and (3) calculation of HRV indices (Figure 2). A tutorial containing a detailed description of the software is directly accessible from the main menu, and some sample runs for testing procedures are included with the software package.
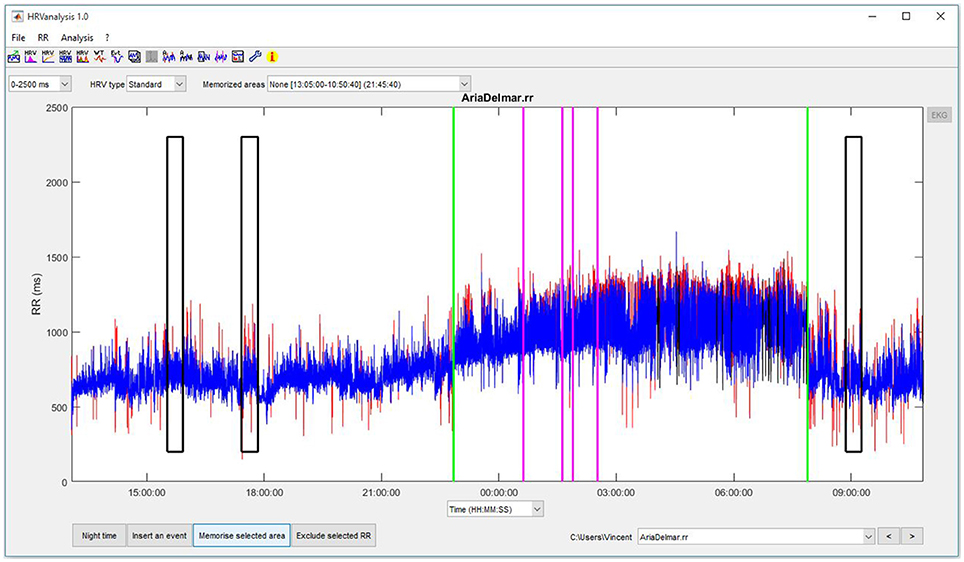
Figure 2. Main figure of HRVanalysis.
Data Importation and R Peaks Detection
Data can be imported from EKG or RR files. The available formats for EKG data are EDF, ISHNE, binary, text, Matlab. A generic import window allows to pre-visualize the EKG trace while the user sets the data file specifications. Preformatted RR files can be imported from text and binary files. Several preformated configurations are proposed (Suunto, Polar, Aria Delmar, and Vista Novacor Holters).
R peaks are detected from EKG signals using a laboratory-developed algorithm largely inspired by Chen et al.'s method (Chen et al., 2006). This moving average-based method, initially developed for real-time QRS detection, has demonstrated a 99.5% detection rate in the MIT-BIH Arrhythmia Database. First, the raw EKG signals are upsampled at 1000 Hz to ensure good time resolution for the RR intervals, even at a low initial EKG sampling rate. The raw EKG signal is first denoised using wavelet transform. The denoised signal is then passed through a moving averaging-based linear high-pass filter in order to highlight the QRS complex, which is processed by full-wave rectification and nonlinear amplification followed by sliding-window summation. The resulting pulse train (i.e., waveform) is used to calculate an adaptive threshold for QRS complex detection.
RR Corrections and Formatting
EKG recordings can contain ectopic beats—due to cardiac dysrhythmia—and missing or spurious beats—generally due to poor EKG signal quality. These nonsinusal beats must be corrected, because they induce errors in the calculation of HRV indices (Saul et al., 1988), which could result in invalid physiological interpretations.
In order to replace invalid beats, the software therefore provides automatic correction of the RR series, inspired by the algorithm developed by Kamath and Fallen (Kamath and Fallen, 1995). First, false beats are detected using Cheung's algorithm (Cheung, 1981): a high and low threshold are set for the relative variation in successive RR intervals (+32.5% and −24.5%, respectively). Second, for each detected error, the number of missing beats is estimated by comparing the total time duration within the error period with the duration of the immediately preceding beat. If the number of beats to recalculate is 3 or less, a cubic spline interpolation is done. This configuration generally originates from a single supraventricular or ventricular ectopic beat, or from an isolated R-peak missdetection. For 4 or more successive errors, the missing beats are interpolated by copying and inserting the same number of previous RRs between the first and last valid RR Although, these corrections generally results in a clean RR signal, this type of automatic algorithm can produce inconsistent values when the original EKG or RR signal is too corrupted, with lengthy portions of successive false beats. It is therefore recommended to visually inspect and review each series before performing HRV analyses. Additionally to RR correction, the software enables excluding parts of the signal from analysis, and the number of corrections is displayed in the results.
RR can also be manually corrected by two methods. First, the user can select an RR interval and change its value either by entering a new value or by using spline cubic interpolation to determine it. Second, when the EKG trace is available, R peaks can be manually inserted and removed by editing the EKG signal.
EKG recordings commonly contain excessive artifacted data that cannot be correctly interpolated. If the number of these data is low, HRV analysis can be performed on the remaining valid signals. HRVanalysis 1.0 allows excluding certain data from the analyses to avoid abnormal HRV values. This can be done by manually selecting the area to exclude or by using an automatic method based on successive beat-to-beat variations and RR labels (if present).
Calculation of HRV Indices
Calculations are performed according to the parameters set in the Preferences menu. For each type of analysis, a menu allows saving the results as a.txt file, saving the figure, and printing the figure. When saving the results, if the user selects an already existing.txt file, the data will be appended to the file. This allows combining analyses derived from different parts of the signal and/or different files and using the results directly in a statistical analysis program.
Linear and Nonlinear HRV Analysis of 24-h, Day, and Night Periods
The software allows linear and nonlinear HRV analyses performed for long-term recordings, for example, using the 24-h ambulatory Holter system, as recommended by the Task Force (Task Force of the European Society of Cardiology and the North American Society of Pacing and Electrophysiology, 1996). In practice, the software allows analyses for RR series of durations longer than 2 h. If the night time has been entered, the analyses are computed for day, night, and entire recording periods (Figures 3, 4).
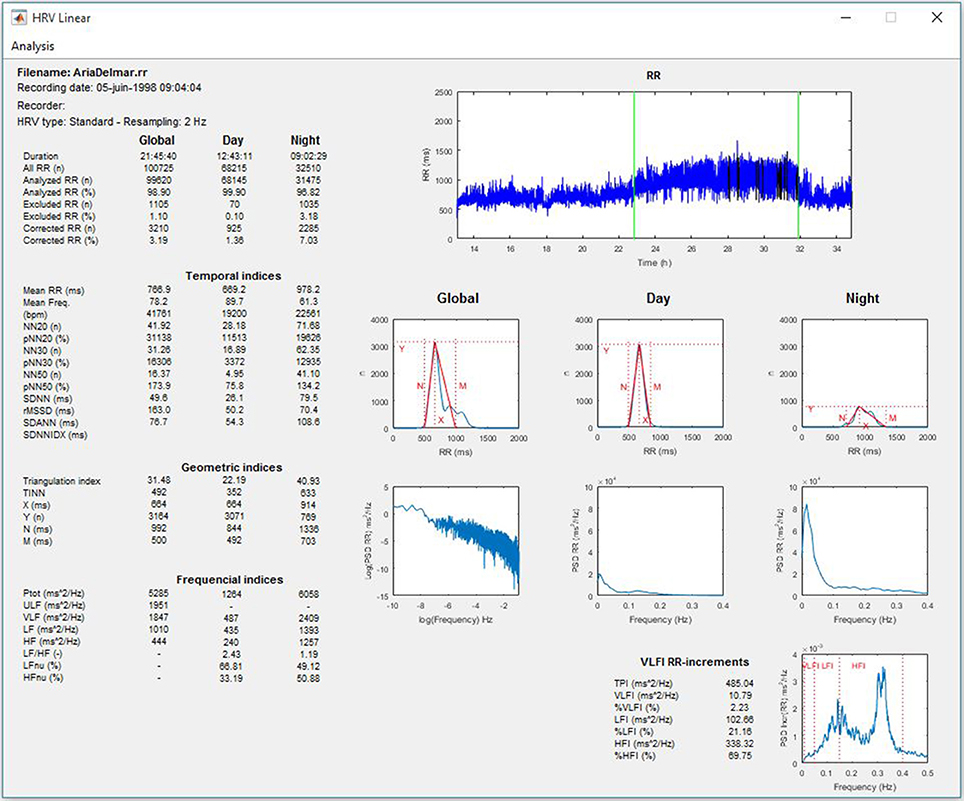
Figure 3. Linear HRV analysis whole recording/day/night periods.
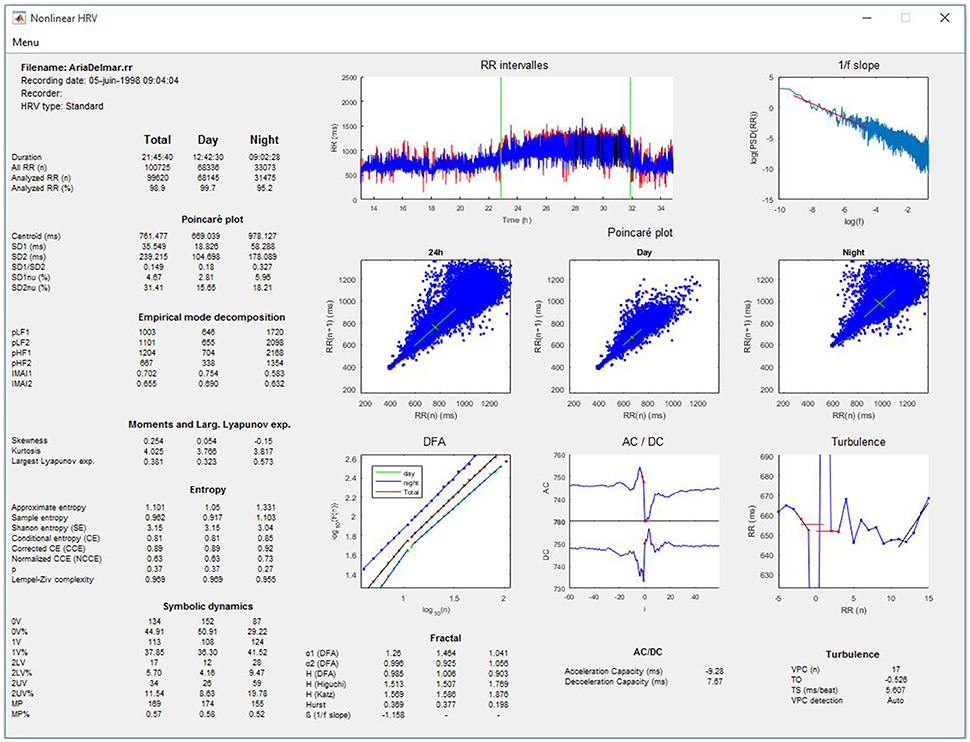
Figure 4. Nonlinear HRV analysis whole recording/day/night periods.
Sequential Analysis of HRV
This analysis allows calculating changes in linear and nonlinear indices for successive epochs along the entire signal (Figure 5). The epoch duration is selected from a list of preset values ranging from 5 min to 1-h duration or from 250 to 4096 beats. If an epoch contains excluded RR intervals, the HRV calculation is not performed on the portion of the signal.
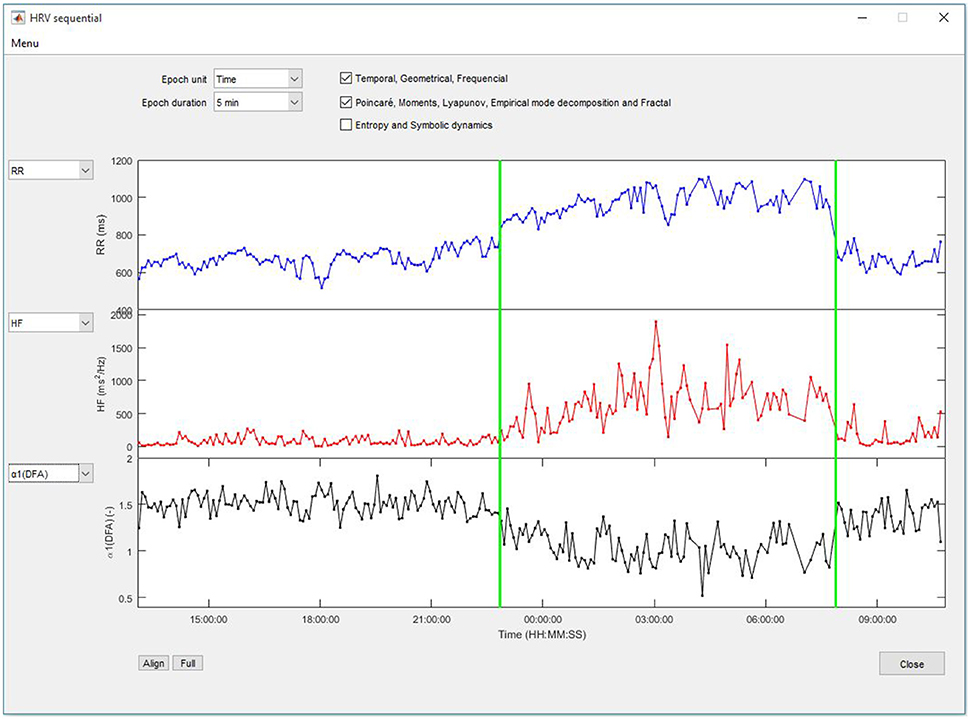
Figure 5. HRV indices calculated on successive epochs.
Local Analysis
HRV indices
This analysis calculates the linear and nonlinear indices of HRV for the RR part of the signal which is selected from the total RR signal (Figure 6).
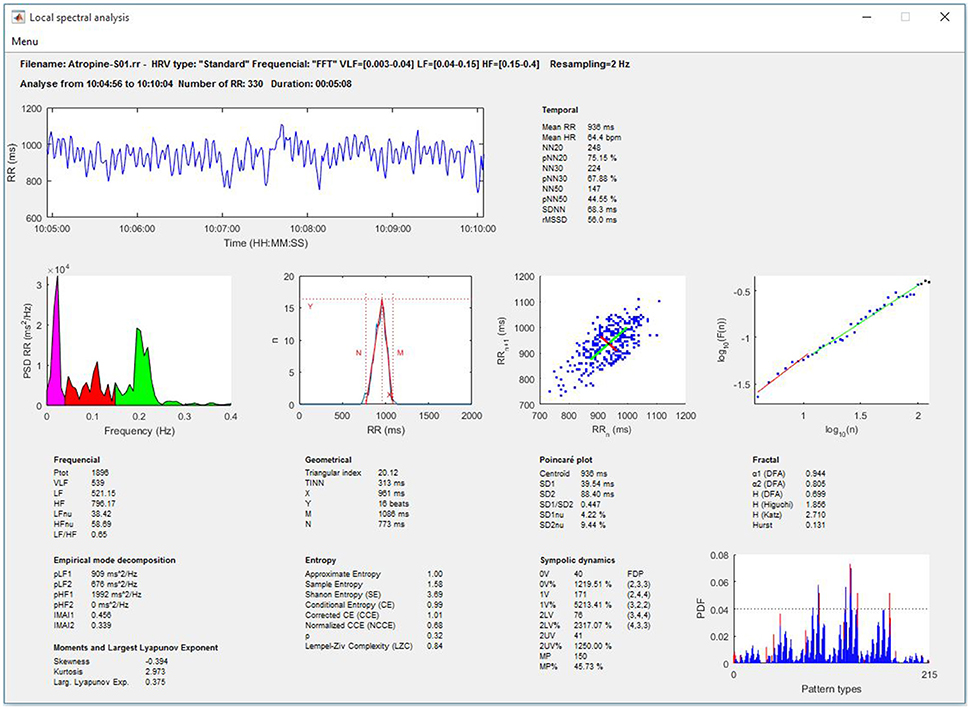
Figure 6. Local linear and nonlinear analysis on a selected portion of the recording.
Time-frequency analysis
The HRV indices are calculated using wavelet transform, as described in the Signal processing section. Three graphs allow plotting changes in RR, heart rate, LF, HF, LFnu, HFnu, and the LF/HF ratio along a time scale (Figure 7).
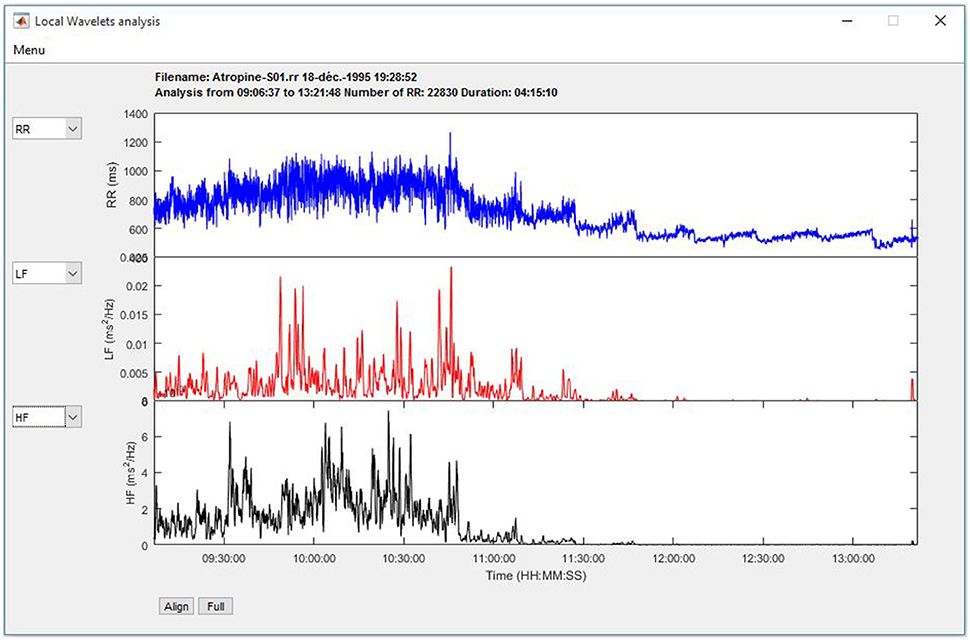
Figure 7. Time-frequency analysis using Wavelet transform.
Analysis of surrounding events
Another analysis is available for the cumulative changes in HRV indices surrounding a single event or repeatedly calibrated events entered by the user. The program searches all the sequences that meet the entered criteria and plots the results (Figure 8).
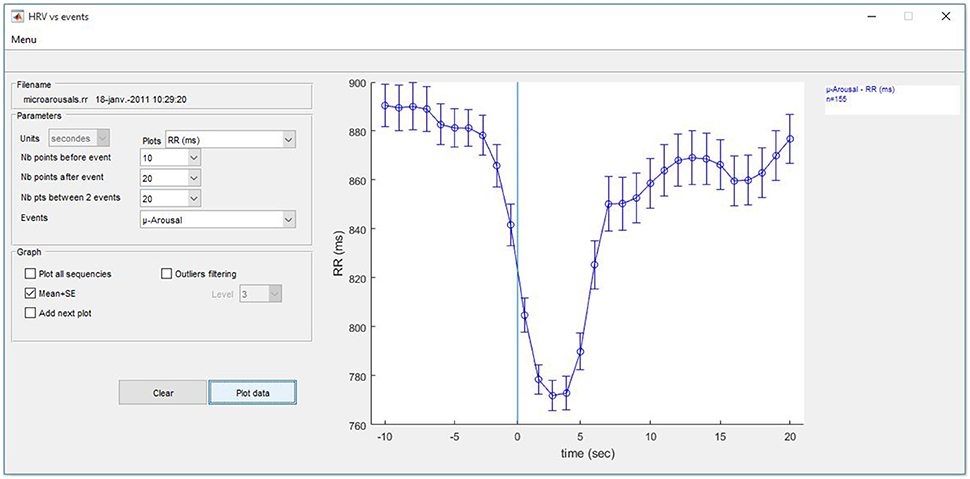
Figure 8. Evolution of HRV around user-entered events.
Possible indices are RR, heart rate, LF, HF, LFnu, HFnu, and the LF/HF ratio calculated using wavelet transform. All calculations are resampled at 1 Hz to allow plotting at 1-s steps. To allow comparisons, several options enable adding multiple analyses using different HRV indices and/or different events to the same graph. Results can be plotted with all sequences or on the mean ± SD, and simple outlier filtering can be applied.
Batch Analysis
All the above-described HRV analyses can be performed in batch mode to enable processing a wide series of RR files without running repetitive operations. The results for all files found in the selected folder are then saved as.txt files, which are directly importable and ready for use in statistical software environments.
Five types of analysis are provided: Linear and nonlinear HRV (24 h/day/night), sequential HRV, HRV analysis of surrounding events, as described above, and, HRV analysis on all areas preset by the user.
Hardware Specifications and System Requirements
HRVanalysis was developed using MATLAB 2016a and compiled using MATLAB compiler 6.2. MATLAB functions were used to develop the program, except for the calculation of entropy indices, Katz and Higuchi fractal indices, which were adapted from copyright files of Alvarez JM, the detrended fluctuation analysis, which was adapted from copyright files of Wenye G, the largest Lyapunov exponent which originates from copyright file of Wolf A, the Lampel-Ziv complexity index which comes from copyright files of Thai Q, and, the empirical mode decomposition which were adapted from copyright files of Rilling G and Flandrin P. It is not necessary to have MATLAB installed on the computer, because MATLAB Runtime v9.0.1 is packaged with the software, and is automatically installed if required. HRVanalysis works with Windows 64-bit operating systems.
To enable rapid plotting and calculation, it is recommended to have 2 GB of RAM and a minimal screen size of 1280 × 768.
Sample Runs
Some sample runs are distributed with the software package. These files are included to help the user get acquainted with the general functioning of the software and the included features.
Availability, Licensing and Installation Procedure
HRVanalysis is available free of charge for non-commercial use only (Freemium license, November the 9th 2015, under the number IDDN.FR.001.470001.000.S.P.2015.000.30000). Interested persons can download the software from the Web page at: https://anslabtools.univ-st-etienne.fr. Registration is requested so that users may be kept informed of free software updates.
The software is installed by running the Installer program and following the installation procedure. The program is delivered with a tutorial and sample runs. Bug reports, comments, and suggestions concerning the program can be emailed to ANSLabTools@univ-st-etienne.fr.
When using HRVanalysis to analyze data meant for publication, please cite this article and the software download webpage in the methods section. Please also credit the authors of the software when referencing it for the evaluation of the usefulness of the software and to add the reference to the HRVanalysis web pages.
Conclusion and Future Directions
HRVanalysis was designed to meet laboratory requirements. It has been used and improved for over 20 years by the SNA-EPIS laboratory, Saint-Etienne, France. It has enabled the analysis and publication of HRV analyses for numerous purposes, including training and overtraining, cardiac and respiratory rehabilitation, sleep-disordered breathing, large cohort follow-ups, and children's autonomic status, pain (see references at https://anslabtools.univ-st-etienne.fr).
The main strength of HRVanalysis is its wide application scope. In addition to standard analysis, the software allows time-frequency analysis using wavelet transform as well as analysis of autonomic nervous system status surrounding scored events and on preselected labeled areas. Moreover, HRVanalysis is suitable for a considerable range of recording modes, from single recordings to large cohorts, and including batch signal processing.
HRVanalysis is meticulously maintained and developed for in-house laboratory use, and in response to users' comments and needs. Upcoming features to be developed in future versions include (1) more types of preformatted files for importing RR and EKG data; (2) selection of automatic RR correction levels, with specific thresholds for particular populations, such as newborns, babies, or athletes; (3) options to import events scored with other software such as polysomnography or polygraphy software, or from user-entered.txt files; (4) more time-frequency task options, such as selecting the wavelet shape and analysis level; and, (5) the addition of other significant cardiovascular signals such as blood pressure and respiration.
Author Contributions
Programmed of the software: VP. Design of the software: VP, FC, FR, JB. Debugged the software: VP, FC, SC, FR, JB. Wrote the paper: VP, FC. Managed the license agreement: FC. Managed the website: FC, VP. Revising the draft: FR, JB.
Conflict of Interest Statement
The authors declare that the research was conducted in the absence of any commercial or financial relationships that could be construed as a potential conflict of interest.
References
Acharya, U. R., Kannathal, N., and Krishnan, S. M. (2004). Comprehensive analysis of cardiac health using heart rate signals. Physiol. Meas. 25, 1139–1151. doi: 10.1088/0967-3334/25/5/005
Akselrod, S., Gordon, D., Ubel, F. A., Shannon, D. C., Berger, A. C., and Cohen, R. J. (1981). Power spectrum analysis of heart rate fluctuation: a quantitative probe of beat-to-beat cardiovascular control. Science 213, 220–222. doi: 10.1126/science.6166045
Bahjaoui-Bouhaddi, M., Cappelle, S., Henriet, M. T., Dumoulin, G., Wolf, J. P., and Regnard, J. (2000). Graded vascular autonomic control versus discontinuous cardiac control during gradual upright tilt. J. Auton. Nerv. Syst. 79, 149–155. doi: 10.1016/S0165-1838(99)00068-5
Balocchi, R., Cantini, F., Varanini, M., Raimondi, G., Legramante, J. M., and Macerata, A. (2006). Revisiting the potential of time-domain indexes in short-term HRV analysis. Biomed. Tech. (Berl). 51, 190–193. doi: 10.1515/BMT.2006.034
Balocchi, R., Menicucci, D., Santarcangelo, E., Sebastiani, L., Gemignani, A., Ghelarducci, B., et al. (2004). Deriving the respiratory sinus arrhythmia from the heartbeat time series using Empirical Mode Decomposition. Chaos Solitons Fractals 20, 171–177. doi: 10.1016/S0960-0779(03)00441-7
Bauer, A., Kantelhardt, J. W., Barthel, P., Schneider, R., Makikallio, T., Ulm, K., et al. (2006). Deceleration capacity of heart rate as a predictor of mortality after myocardial infarction: cohort study. Lancet 367, 1674–1681. doi: 10.1016/S0140-6736(06)68735-7
Bauer, A., Malik, M., Schmidt, G., Barthel, P., Bonnemeier, H., Cygankiewicz, I., et al. (2008). Heart rate turbulence: standards of measurement, physiological interpretation, and clinical use: International Society for Holter and Noninvasive Electrophysiology Consensus. J. Am. Coll. Cardiol. 52, 1353–1365. doi: 10.1016/j.jacc.2008.07.041
Bigger, J. T. Jr., Steinman, R. C., Rolnitzky, L. M., Fleiss, J. L., Albrecht, P., and Cohen, R. J. (1996). Power law behavior of RR-interval variability in healthy middle-aged persons, patients with recent acute myocardial infarction, and patients with heart transplants. Circulation 93, 2142–2151. doi: 10.1161/01.CIR.93.12.2142
Billman, G. E. (2011). Heart rate variability - a historical perspective. Front. Physiol. 2:86. doi: 10.3389/fphys.2011.00086
Billman, G. E. (2013). The LF/HF ratio does not accurately measure cardiac sympatho-vagal balance. Front. Physiol. 4:26. doi: 10.3389/fphys.2013.00026
Burton, A. R., Birznieks, I., Bolton, P. S., Henderson, L. A., and Macefield, V. G. (2009). Effects of deep and superficial experimentally induced acute pain on muscle sympathetic nerve activity in human subjects. J. Physiol. 587, 183–193. doi: 10.1113/jphysiol.2008.162230
Carvalho, J. L. A., Rocha, A. F., Nascimento, F. A. O., Souza Neto, J., and Junqueira, L. F. Jr. (2002). “Development of a matlab software for analysis of heart rate variability,” in Proceedings of the 6th International Conference on Signal Processing, Institute Of Electrical and Electronics Engineering, ed Y. Tang (Beijing), 1488–1491.
Cerutti, C., Gustin, M. P., Paultre, C. Z., Lo, M., Julien, C., Vincent, M., et al. (1991). Autonomic nervous system and cardiovascular variability in rats: a spectral analysis approach. Am. J. Physiol. 261(4 Pt 2), H1292–H1299.
Chen, S. W., Chen, H. C., and Chan, H. L. (2006). A real-time QRS detection method based on moving-averaging incorporating with wavelet denoising. Comput. Methods Programs Biomed. 82, 187–195. doi: 10.1016/j.cmpb.2005.11.012
Cheung, M. N. (1981). Detection of and recovery from errors in cardiac interbeat intervals. Psychophysiology 18, 341–346. doi: 10.1111/j.1469-8986.1981.tb03045.x
Chouchou, F., and Desseilles, M. (2014). Heart rate variability: a tool to explore the sleeping brain? Front. Neurosci. 8:402. doi: 10.3389/fnins.2014.00402
Chouchou, F., Pichot, V., Barthelemy, J. C., Bastuji, H., and Roche, F. (2014). Cardiac sympathetic modulation in response to apneas/hypopneas through heart rate variability analysis. PLoS ONE 9:e86434. doi: 10.1371/journal.pone.0086434
Chouchou, F., Pichot, V., Garet, M., Barthelemy, J. C., and Roche, F. (2009). Dominance in cardiac parasympathetic activity during real recreational SCUBA diving. Eur. J. Appl. Physiol. 106, 345–352. doi: 10.1007/s00421-009-1010-0
Chouchou, F., Pichot, V., Perchet, C., Legrain, V., Garcia-Larrea, L., Roche, F., et al. (2011). Autonomic pain responses during sleep: a study of heart rate variability. Eur. J. Pain 15, 554–560. doi: 10.1016/j.ejpain.2010.11.011
Eckberg, D. L. (1997). Sympathovagal balance: a critical appraisal. Circulation 96, 3224–3232. doi: 10.1161/01.CIR.96.9.3224
Eckberg, D. L. (1998). Sympathovagal balance: a critical appraisal. Reply. Circ. 98, 2643–2644. doi: 10.1161/01.CIR.98.23.2643
Ferrario, M., Signorini, M. G., and Cerutti, S. (2004). Complexity analysis of 24 hours heart rate variability time series. Conf. Proc. IEEE Eng. Med. Biol. Soc. 6, 3956–3959. doi: 10.1109/iembs.2004.1404105
Goldberger, A. L., Amaral, L. A., Glass, L., Hausdorff, J. M., Ivanov, P. C., Mark, R. G., et al. (2000). PhysioBank, PhysioToolkit, and PhysioNet: components of a new research resource for complex physiologic signals. Circulation 101, E215–E220. doi: 10.1161/01.CIR.101.23.e215
Guyenet, P. G. (2006). The sympathetic control of blood pressure. Nat. Rev. Neurosci. 7, 335–346. doi: 10.1038/nrn1902
Guzzetti, S., Borroni, E., Garbelli, P. E., Ceriani, E., Della Bella, P., Montano, N., et al. (2005). Symbolic dynamics of heart rate variability: a probe to investigate cardiac autonomic modulation. Circulation 112, 465–470. doi: 10.1161/CIRCULATIONAHA.104.518449
Hon, E. H., and Lee, S. T. (1963). Electronic evaluation of the fetal heart rate. VIII. Patterns preceding fetal death, further observations. Am. J. Obstet. Gynecol. 87, 814–826.
Huikuri, H. V., Makikallio, T. H., Airaksinen, K. E., Seppanen, T., Puukka, P., Raiha, I. J., et al. (1998). Power-law relationship of heart rate variability as a predictor of mortality in the elderly. Circulation 97, 2031–2036. doi: 10.1161/01.CIR.97.20.2031
Huikuri, H. V., Perkiömäki, J. S., Maestri, R., and Pinna, G. D. (2009). Clinical impact of evaluation of cardiovascular control by novel methods of heart rate dynamics. Philos. Trans. A. Math. Phys. Eng. Sci. 367, 1223–1238. doi: 10.1098/rsta.2008.0294
Jasson, S., Medigue, C., Maison-Blanche, P., Montano, N., Meyer, L., Vermeiren, C., et al. (1997). Instant power spectrum analysis of heart rate variability during orthostatic tilt using a time-/frequency-domain method. Circulation 96, 3521–3526. doi: 10.1161/01.CIR.96.10.3521
Kamath, M., and Fallen, E. (1995). “Correction of the heart rate variability signal for ectopics and missing beats,” in Heart Rate Variability, eds M. Malik and A. Camm (Armonk, NY: Futura Publishing Company), 75–85.
Kamen, P. W., Krum, H., and Tonkin, A. M. (1996). Poincare plot of heart rate variability allows quantitative display of parasympathetic nervous activity in humans. Clin. Sci. 91, 201–208. doi: 10.1042/cs0910201
Kaufmann, T., Sutterlin, S., Schulz, S. M., and Vogele, C. (2011). ARTiiFACT: a tool for heart rate artifact processing and heart rate variability analysis. Behav. Res. Methods 43, 1161–1170. doi: 10.3758/s13428-011-0107-7
Kleiger, R., Stein, P., Bosner, M., and Rottman, J. (1995). “Time-domain measurements of heart rate variability,” in Heart Rate Variability, eds M. Malik and A. Camm (Armonk, NY: Futura publishing company), 33–45.
Lewis, O. (1994). Stephen Hales and the measurement of blood pressure. J. Hum. Hypertens. 8, 865–871.
Lombardi, F., and Stein, P. K. (2011). Origin of heart rate variability and turbulence: an appraisal of autonomic modulation of cardiovascular function. Front. Physiol. 2:95. doi: 10.3389/fphys.2011.00095
Luczak, H., and Laurig, W. (1973). An analysis of heart rate variability. Ergonomics 16, 85–97. doi: 10.1080/00140137308924484
Maestri, R., and Pinna, G. D. (1998). POLYAN: a computer program for polyparametric analysis of cardio-respiratory variability signals. Comput. Methods Programs Biomed. 56, 37–48. doi: 10.1016/S0169-2607(98)00004-2
Maestri, R., Pinna, G. D., Accardo, A., Allegrini, P., Balocchi, R., D'Addio, G., et al. (2007a). Nonlinear indices of heart rate variability in chronic heart failure patients: redundancy and comparative clinical value. J. Cardiovasc. Electrophysiol. 18, 425–433. doi: 10.1111/j.1540-8167.2007.00728.x
Maestri, R., Pinna, G. D., Porta, A., Balocchi, R., Sassi, R., Signorini, M. G., et al. (2007b). Assessing nonlinear properties of heart rate variability from short-term recordings: are these measurements reliable? Physiol. Meas. 28, 1067–1077. doi: 10.1088/0967-3334/28/9/008
Makikallio, T. H., Huikuri, H. V., Makikallio, A., Sourander, L. B., Mitrani, R. D., Castellanos, A., et al. (2001). Prediction of sudden cardiac death by fractal analysis of heart rate variability in elderly subjects. J. Am. Coll. Cardiol. 37, 1395–1402. doi: 10.1016/S0735-1097(01)01171-8
Malik, M. (1995). “Geometrical methods for heart rate variability assessment,” in Heart Rate Variability, eds M. Malik and A. Camm (Armonk, NY: Futura Publishing Company), 47–61.
Malik, M. (1998). Sympathovagal balance: a critical appraisal. Circulation 98, 2643–2644. doi: 10.1161/01.CIR.98.23.2643
Malik, M., Farrell, T., Cripps, T., and Camm, A. J. (1989). Heart rate variability in relation to prognosis after myocardial infarction: selection of optimal processing techniques. Eur. Heart J. 10, 1060–1074.
Malliani, A., Pagani, M., Montano, N., and Mela, G. S. (1998). Sympathovagal balance: a reappraisal. Circulation 98, 2640–2643. doi: 10.1161/01.CIR.98.23.2640
Pagani, M., Lombardi, F., Guzzetti, S., Sandrone, G., Rimoldi, O., Malfatto, G., et al. (1984). Power spectral density of heart rate variability as an index of sympatho-vagal interaction in normal and hypertensive subjects. J. Hypertens. Suppl. 2, S383–S385.
Pagani, M., Montano, N., Porta, A., Malliani, A., Abboud, F. M., Birkett, C., et al. (1997). Relationship between spectral components of cardiovascular variabilities and direct measures of muscle sympathetic nerve activity in humans. Circulation 95, 1441–1448. doi: 10.1161/01.CIR.95.6.1441
Peng, C. K., Havlin, S., Stanley, H. E., and Goldberger, A. L. (1995). Quantification of scaling exponents and crossover phenomena in nonstationary heartbeat time series. Chaos 5, 82–87. doi: 10.1063/1.166141
Perakakis, P., Joffily, M., Taylor, M., Guerra, P., and Vila, J. (2010). KARDIA: a Matlab software for the analysis of cardiac interbeat intervals. Comput. Methods Programs Biomed. 98, 83–89. doi: 10.1016/j.cmpb.2009.10.002
Pichot, V., Buffiere, S., Gaspoz, J. M., Costes, F., Molliex, S., Duverney, D., et al. (2001). Wavelet transform of heart rate variability to assess autonomic nervous system activity does not predict arousal from general anesthesia. Can. J. Anaesth. 48, 859–863. doi: 10.1007/BF03017350
Pichot, V., Gaspoz, J. M., Molliex, S., Antoniadis, A., Busso, T., Roche, F., et al. (1999). Wavelet transform to quantify heart rate variability and to assess its instantaneous changes. J. Appl. Physiol. 86, 1081–1091.
Pincus, S. M., and Goldberger, A. L. (1994). Physiological time-series analysis: what does regularity quantify? Am. J. Physiol. 266(4 Pt 2), H1643–H1656.
Pomeranz, B., Macaulay, R. J., Caudill, M. A., Kutz, I., Adam, D., Gordon, D., et al. (1985). Assessment of autonomic function in humans by heart rate spectral analysis. Am. J. Physiol. 248(1 Pt 2), H151–H153.
Porta, A., Baselli, G., Liberati, D., Montano, N., Cogliati, C., Gnecchi-Ruscone, T., et al. (1998). Measuring regularity by means of a corrected conditional entropy in sympathetic outflow. Biol. Cybern. 78, 71–78. doi: 10.1007/s004220050414
Porta, A., Guzzetti, S., Montano, N., Furlan, R., Pagani, M., Malliani, A., et al. (2001). Entropy, entropy rate, and pattern classification as tools to typify complexity in short heart period variability series. IEEE Trans. Biomed. Eng. 48, 1282–1291. doi: 10.1109/10.959324
Rajendra Acharya, U., Paul Joseph, K., Kannathal, N., Lim, C. M., and Suri, J. S. (2006). Heart rate variability: a review. Med. Biol. Eng. Comput. 44, 1031–1051. doi: 10.1007/s11517-006-0119-0
Richman J. S. Moorman J. R. (2000). Physiological time-series analysis using approximate entropy and sample entropy. Am. J. Physiol. Heart Circ. Physiol. 278, H2039–H2049. Available online at: http://ajpheart.physiology.org/content/278/6/H2039
Rodriguez-Linares, L., Mendez, A. J., Lado, M. J., Olivieri, D. N., Vila, X. A., and Gomez-Conde, I. (2011). An open source tool for heart rate variability spectral analysis. Comput. Methods Programs Biomed. 103, 39–50. doi: 10.1016/j.cmpb.2010.05.012
Saul, J. P., Arai, Y., Berger, R. D., Lilly, L. S., Colucci, W. S., and Cohen, R. J. (1988). Assessment of autonomic regulation in chronic congestive heart failure by heart rate spectral analysis. Am. J. Cardiol. 61, 1292–1299. doi: 10.1016/0002-9149(88)91172-1
Saul, J. P., Rea, R. F., Eckberg, D. L., Berger, R. D., and Cohen, R. J. (1990). Heart rate and muscle sympathetic nerve variability during reflex changes of autonomic activity. Am. J. Physiol. 258(3 Pt 2), H713–H721.
Sayers, B. M. (1973). Analysis of heart rate variability. Ergonomics 16, 17–32. doi: 10.1080/00140137308924479
Schmidt, G., Malik, M., Barthel, P., Schneider, R., Ulm, K., Rolnitzky, L., et al. (1999). Heart-rate turbulence after ventricular premature beats as a predictor of mortality after acute myocardial infarction. Lancet 353, 1390–1396. doi: 10.1016/S0140-6736(98)08428-1
Sforza, E., Pichot, V., Gschwind, M., Roche, F., and Maeder-Ingvar, M. (2014). Bradycardia and asystole during generalised interictal EEG discharges. Epileptic Disord. 16, 506–509. doi: 10.1684/epd.2014.0710
Sleight, P., and Bernardi, L. (1998). Sympathovagal balance. Circulation 98:2640. doi: 10.1161/01.CIR.98.23.2640
Tarvainen, M. P., Niskanen, J. P., Lipponen, J. A., Ranta-Aho, P. O., and Karjalainen, P. A. (2014). Kubios HRV–heart rate variability analysis software. Comput. Methods Programs Biomed. 113, 210–220. doi: 10.1016/j.cmpb.2013.07.024
Task Force of the European Society of Cardiology the North American Society of Pacing Electrophysiology (1996). Heart rate variability. Standards of measurement, physiological interpretation, and clinical use. Task Force of the European Society of Cardiology and the North American Society of Pacing and Electrophysiology. Eur. Heart. J. 17, 354–381. doi: 10.1093/oxfordjournals.eurheartj.a014868
Taylor, J. A., Carr, D. L., Myers, C. W., and Eckberg, D. L. (1998). Mechanisms underlying very-low-frequency RR-interval oscillations in humans. Circulation 98, 547–555. doi: 10.1161/01.CIR.98.6.547
Tiinanen, S., Kiviniemi, A., Tulppo, M., and Seppanen, T. (2009). Time-frequency representation of cardiovascular signals during handgrip exercise. Conf. Proc. IEEE Eng. Med. Biol. Soc. 2009, 1762–1765. doi: 10.1109/iembs.2009.5333097
Tulppo, M. P., Makikallio, T. H., Takala, T. E., Seppanen, T., and Huikuri, H. V. (1996). Quantitative beat-to-beat analysis of heart rate dynamics during exercise. Am. J. Physiol. 271(1 Pt 2), H244–H252.
Voss, A., Kurths, J., Kleiner, H. J., Witt, A., and Wessel, N. (1995). Improved analysis of heart rate variability by methods of nonlinear dynamics. J. Electrocardiol. 28(Suppl), 81–88. doi: 10.1016/S0022-0736(95)80021-2
Wiklund, U., Akay, M., Morrison, S., and Niklasson, U. (2002). Wavelet decomposition of cardiovascular signals for baroreceptor function tests in pigs. IEEE Trans. Biomed. Eng. 49, 651–661. doi: 10.1109/TBME.2002.1010848
Keywords: heart rate variability, autonomic nervous system, autonomic neuroscience, parasympathetic, sympathetic, RR interval variability, software
Citation: Pichot V, Roche F, Celle S, Barthélémy J-C and Chouchou F (2016) HRVanalysis: A Free Software for Analyzing Cardiac Autonomic Activity. Front. Physiol. 7:557. doi: 10.3389/fphys.2016.00557
Received: 20 June 2016; Accepted: 04 November 2016;
Published: 22 November 2016.
Edited by:
Elisabeth Lambert, Baker IDI Heart and Diabetes Institute, AustraliaReviewed by:
Mathias Baumert, University of Adelaide, AustraliaAndrea Marchi, Polytechnic University of Milan, Italy
Copyright © 2016 Pichot, Roche, Celle, Barthélémy and Chouchou. This is an open-access article distributed under the terms of the Creative Commons Attribution License (CC BY). The use, distribution or reproduction in other forums is permitted, provided the original author(s) or licensor are credited and that the original publication in this journal is cited, in accordance with accepted academic practice. No use, distribution or reproduction is permitted which does not comply with these terms.
*Correspondence: Vincent Pichot, vincent.pichot@univ-st-etienne.fr