 Gwénaël M. D. J.-M. Gaussand1 Qi Jia1 Eric van der Graaff1 Gerda E. M. Lamers1 Paul F. Fransz2 Paul J. J. Hooykaas1 Sylvia de Pater1*
- 1 Molecular and Developmental Genetics Department, Institute of Biology Leiden, Leiden University, Leiden, Netherlands
- 2 Swammerdam Institute for Life Sciences, University of Amsterdam, Amsterdam, Netherlands
From a pool of transgenic Arabidopsis (Arabidopsis thaliana) plants harboring an activator T-DNA construct, one mutant was identified that developed spontaneous necrotic spots (sns-D) on the rosette leaves under aseptic conditions. The sns-D mutation is dominant and homozygous plants are embryo lethal. The mutant produced smaller rosettes with a different number of stomata than the wild-type. DNA fragmentation in the nuclei of cells in the necrotic spots and a significant increase of caspase-3 and caspase-6 like activities in sns-D leaf extracts indicated that the sns-D mutation caused programmed cell death (PCD). The integration of the activator T-DNA caused an increase of the expression level of At1g13020, which encodes the eukaryotic translation initiation factor eIF4B2. The expression level of eIF4B2 was positively correlated with the severity of sns-D mutant phenotype. Overexpression of the eIF4B2 cDNA mimicked phenotypic traits of the sns-D mutant indicating that the sns-D mutant phenotype is indeed caused by activation tagging of eIF4B2. Thus, incorrect regulation of translation initiation may result in PCD.
Introduction
In plants, cell death occurs via the process of necrosis or as programmed cell death (PCD). Necrosis is a consequence of persistent trauma and is not considered to be genetically coordinated (Pasqualini et al., 2003). In contrast, PCD is genetically controlled and is characterized by cell shrinkage, cytoplasmic condensation, chromatin condensation, and DNA fragmentation. PCD is a normal process involved in development of anthers, megagametophytes, and vascular tissues (He and Kermode, 2003; Li et al., 2006; Gunawardena, 2008), in senescence (Uzelac et al., 2008), pollen self-incompatibility (Bosch and Franklin-Tong, 2008; Poulter et al., 2010), and seed germination (Domínguez et al., 2001). In addition, plants employ PCD as a controlled response to different biotic and abiotic stresses (Malerba et al., 2008; Reape et al., 2008; Zuppini et al., 2010).
During their life cycle, plants are exposed to invading microorganisms, including bacteria, fungi, oomycetes, and viruses that are potentially pathogenic (Ma and Berkowitz, 2007). When such pathogens invade a plant, a complex defense response, named hypersensitive response (HR), causes the formation of necrotic lesions by activation of a PCD pathway, in order to restrict the growth of the pathogen. The HR commonly precedes a slower systemic (whole plant) response, which ultimately leads to systemic acquired resistance (SAR; Greenberg et al., 1994; Lorrain et al., 2003). The induction of HR is similar to apoptosis in animals, since apoptotic features such as DNA breaks with 3′OH ends, blebbing of the plasma membrane, as well as nuclear and cytoplasmic condensation, are present in cells undergoing HR (Levine et al., 1996; Ryerson and Heath, 1996; Wang et al., 1996; Heath, 2000).
Considerable efforts to understand the control and execution of the HR were made by the identification of mutant lines in which cell death is deregulated. These so-called lesion mimic mutants (LMMs) phenotypically resemble plants in which HR is invoked by a pathogen. Many mutants that show spontaneous cell death were initially isolated in maize (Hoisington et al., 1982) and subsequently also in other plants, including rice (Takahashi et al., 1999; Wang et al., 2005), barley (Wolter et al., 1993), and Arabidopsis (Greenberg and Ausubel, 1993; Dietrich et al., 1994; Greenberg et al., 1994; Lorrain et al., 2004; Bouchez et al., 2007). LMMs show different lesion phenotypes with respect to the timing and conditions of lesion appearance, and with respect to the color and the size of the lesions. They are classified into two classes: initiation mutants and feedback or propagation mutants (Lorrain et al., 2003). This classification is based upon the assumption that two different mechanisms are involved in controlling cell death: a pathway to initiate PCD, and a pathway to suppress PCD. Initiation mutants form localized necrotic spots of determinate size, whereas propagation mutants are unable to control the rate and extent of the lesions. The study of these LMMs provided the opportunity to unravel the molecular basis for PCD and pathogen resistance. This has revealed a wide variety of important players in PCD: defense related genes, salicylic acid, abscisic acid, Ca2+ influx, ROS formation and sensing, sphingolipid metabolism and porphyrin/chlorophyll biosynthesis and catabolism (Lorrain et al., 2003; Moeder and Yoshioka, 2008; Mosher et al., 2010).
One of the mutants identified in an activator T-DNA tagged mutant collection (van der Graaff and Hooykaas, 1998) was found to develop necrotic spots on its leaves. This sns-D mutant was characterized in an attempt to find new genes involved in PCD. The spontaneous necrotic spots formed by the Arabidopsis sns-D mutant resemble the lesions of plants in which HR cell death is invoked by a pathogen. The phenotype of the sns-D mutant plants was analyzed in detail, and biochemical analyses were performed for caspase-like activity and DNA fragmentation. Furthermore, the increased expression level of the gene encoding the eukaryotic initiation factor eIF4B2, which is located close to the activator T-DNA and binary vector insertion, was found to be correlated with the observed phenotype.
Materials and Methods
Plant Material and Microscopy
A T-DNA activation tagging construct was made by cloning the pUC9 vector containing the 35S double enhancer, the Alfalfa Mosaic Virus (AMV) 5′ leader and the hygromycin resistance marker between the synthetic borders of the pBIN19 derived pSDM14 vector using the unique XhoI site. Arabidopsis thaliana (ecotype C24) was transformed with this activation tagging construct and transformants were screened for developmental mutants. Initial characterization of the T-DNA/vector insert was described by van der Graaff (1997). Seeds were sterilized by incubation during 1 min in 70% ethanol, then 20 min in 1% hypochlorite, followed by four rinses with sterile water. Seeds were imbibed on solidified 0.5 MS medium, in the dark, for 2–4 days at 4°C. The seeds were then placed in a culture chamber (21°C, 16 h of light/8 h of dark, 3000 lux) to germinate. The transgenic plants were selected by germination on 10 mg/l hygromycin-containing medium (Duchefa). Hygromycin resistant seedlings were scored 2 weeks after germination. Microscopic images of wild-type and sns-D plants were recorded with a Leica MZ12 stereomicroscope (Leica Microsystems), equipped with a DKC-5000 camera (Sony). Plant material was fixed in 2% glutaraldehyde in 0.1 M sodium cacodylate buffer (pH 7.2) for 8 h at room temperature, dehydrated through an ethanol series and embedded in epon. Cross-sections were stained with toluidine blue, mounted in epon, and analyzed with an upright compound microscope.
Thermal Asymmetric Interlaced PCR
For analysis of the T-DNA-plant DNA border sequence, thermal asymmetric interlaced (TAIL) PCR was performed according to Liu and Whittier (1995), with specific primers HYGLB1, HYGLB2, and HYGLB3 and random primer AD3 (Table 1).
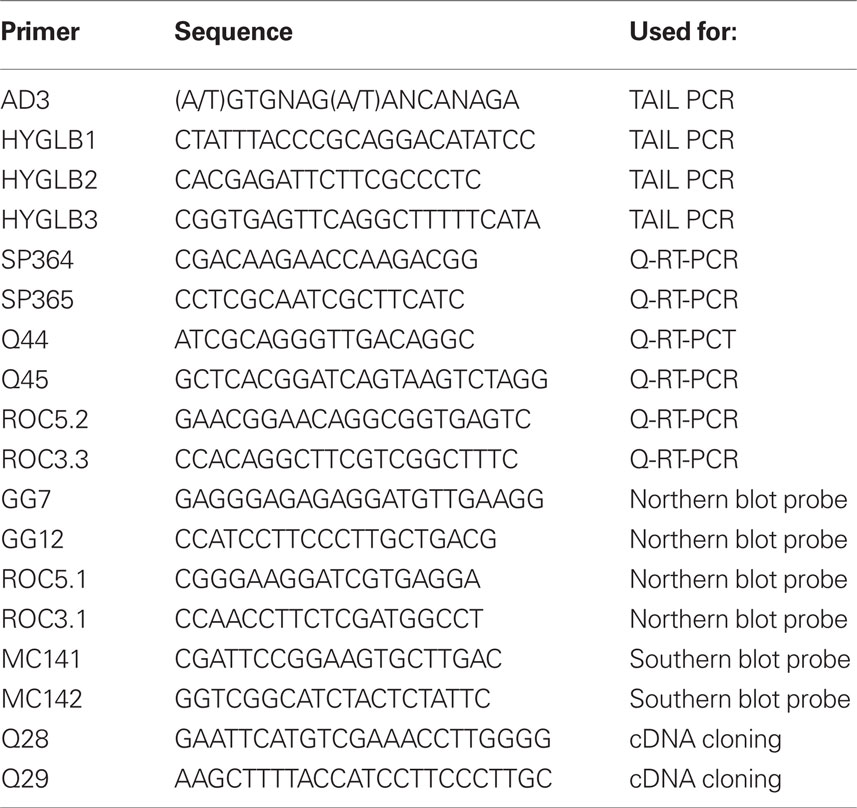
Table 1. Sequences of PCR primers.
Fluorescence in situ Hybridization
Flower buds were used as a source for nuclei preparations. Tissue fixation, cell spreading, screening for appropriate stages, and fluorescence in situ hybridization (FISH) have been described by Schubert et al. (2001). BAC F3F19 and BAC F13K23 are located adjacent to each other on chromosome 1 near the T-DNA/vector integration site and they were labeled with biotin-dUTP and digoxigenin-dUTP and detected with rhodamine-labeled streptavidin (magenta fluorescence) and fluorescein isothiocyanate-labeled antibodies against mouse-anti-digoxigenin (green fluorescence), respectively. The preparations were counterstained and mounted in 1 mg ml 4′,6-diamino-2-phenylindole (DAPI) in vectashield (Vector Laboratories). Preparations were analyzed with a microscope (model BH2-RFC, Olympus) equipped with a 100 W mercury lamp. Images were acquired with a cooled CCD camera (Astro-med).
Scanning Electron Microscopy
One- and five-week-old wild-type and sns-D seedlings were fixed in a mixture of 2% (w/v) paraformaldehyde and 2.5% (v/v) glutaraldehyde in 0.1 M sodium cacodylate buffer, pH 7.3, for 3 h at room temperature. Samples were dehydrated through a graded series of 50, 70, 90, 96, and 100% (v/v) acetone and then dried with a Bal-Tec CPD 030 critical point drier (Leica Microsystems). The samples were then mounted on stubs, coated with gold on a Polaron SEM coating unit E5100 and observed by use of a Jeol 6400 scanning electron microscope (Jeol).
Crude Protein Extraction and Caspase Assays
Ten plants of about 5-week-old were ground in 10 ml ice-cold extraction buffer containing 100 mM HEPES (pH 7.2), 10% (w/v) sucrose, 0.1% (w/v) CHAPS, 5 mM DTT, and 10−6% (v/v) NP40 with an Ultra-turrax (three pulses at 24000 rpm of 30 s each with 30 s intervals, on ice). Subsequently, the homogenate was incubated on ice for 15 min. Then, the homogenate was centrifuged to pellet cell debris at 2000×g for 5 min and the supernatant was centrifuged to pellet insoluble material and the microsomal fraction for 10 min at 100000×g at 4°C. The lipid layer was removed from the surface by sucking with a needle and a syringe. The soluble protein extract was filtered over a 0.22 μm Millex syringe driven filter unit (Millipore). Protein concentrations were determined using the Bradford method (Bio-Rad) with BSA as the standard (Bradford, 1977). In a 96-well plate, 75 μl of soluble protein extract containing 5 μg of proteins were mixed with 25 μl of the synthetic fluorogenic caspase-3 or caspase-6 substrates (Ac-DEVD-AMC or Ac-VEID-AMC, respectively, 75 μM final concentrations; Calbiochem). The specificity was measured by addition of caspase-3 or caspase-6 inhibitor (Ac-DEVD-CHO or Ac-VEID-CHO respectively, 250 μM final concentration). During 2 h, the proteolytic activity was measured every 10 min at room temperature in triplicates per sample. Substrate cleavage was detected in a fluorescence spectrometer LS50B (Perkin Elmer, USA) at an excitation wavelength of 380 nm and an emission wavelength of 460 nm, with an excitation and an emission slit value of 5.0. Kinetics of substrate hydrolysis was tested to be linear throughout 2 h of reaction. The caspase-like activity was calculated as increase of fluorescence units per microgram of protein per hour. The data presented were representative of three independent experiments (n = 3) with three different extracts and the data were presented as mean ± SD.
Terminal Deoxynucleotidyl Transferase-Mediated dUTP Nick End Labeling
Five-week-old wild-type or sns-D leaves were fixed in 2% (w/v) glutaraldehyde in 10 mM NaH2PO4, 120 mM NaCl, 2.7 mM KCl, pH 7.4 (phosphate-buffered saline, PBS) overnight at room temperature. After dehydration at room temperature in a graded series of 70, 90, 96, and 100% (v/v) ethanol, samples were embedded in Technovit (Heraeus). Sections (2 μm) were attached on Biobond (Biocell) coated slides. Terminal deoxynucleotidyl transferase-mediated dUTP nick end labeling (TUNEL) assay was done with an in situ cell death detection kit (Roche). Following TUNEL reaction, Sytox orange nuclear staining was performed as described (Maraschin et al., 2005). Samples were analyzed with a Zeiss Axioplan confocal microscope (Zeiss) with a MRC 1024 ES Bio-Rad module (Bio-Rad). An Argon/Krypton laser (488/568 nm) was used to visualize the TUNEL (Ex 488 nm, Em 522 DF 32) and the Sytox orange (Ex 568, Em 605 DF 32) signals.
Total RNA Isolation, Q-RT-PCR, Northern and Southern Blot Analysis
Total RNA was isolated from entire wild-type and sns-D plants or leaves with an RNeasy Plant Mini Kit (Qiagen). Residual DNA was removed from the RNA samples with DNase I (Ambion) in the presence of the RNase inhibitor RNasin (Promega). cDNA was produced on 1 μg of RNA using iScript cDNA synthesis kit according to the manufacturer’s instructions (Bio-Rad). Quantitative real-time PCR (Q-PCR) analyses were done in triplicate using the iQ™ SYBR® Green Supermix (Bio-Rad). Specific fragments (about 200 bp) were amplified of the genes flanking the T-DNA insertion site: At1g21550 (primers SP364 and SP365) and At1g13020 (primers Q44 and Q45) using a DNA Engine Thermal Cycler (MJ Research) equipped with a Chromo4 real-time PCR detection system (Bio-Rad). The sequences of the primers are listed in Table 1. The cycling parameters were 95°C for 3 min, 40 cycles of (95°C for 1 min, 60°C for 40 s), 72°C for 10 min. Normalization of relative gene expression was based on expression of the housekeeping gene Roc1 (At4g38740; primers ROC3.3, ROC5.2) and were presented as relative expression ratios. The value of the wild-type was set on 1. Standard deviations (SD) for the expression levels in the sns-D mutant were shown as error bars.
For northern blot analysis, RNA samples (10 μg) were electrophoretically separated in a 1.5% (w/v) agarose gel containing 2% (v/v) formaldehyde, 20 mM 3-(N-morpholino) propanesulfonic acid, 8 mM sodium acetate, 10 mM EDTA, pH 7.0; blotted with 50 mM Na-phosphate buffer pH 6.5 and 5 mM EDTA onto hybond-N (Amersham Biosciences) membranes and hybridized with 32P-labeled cDNA probes as described previously (Menke et al., 1999). To generate radioactively labeled [32P]dCTP probes DNA fragments were amplified for At1g13020 (primers GG7 and GG12) and Roc1 (primers ROC3.1 and ROC5.1). The last probe was used to check equal loading of RNA. The corresponding cDNA fragments were purified from agarose gels using Qiaquick Gel Extraction kit (Qiagen). cDNA probes were labeled with Prime a Gene labeling system kit (Promega) and purified by use of ProbeQuant G-50 micro columns (Amersham Biosciences). The bands on the blots were quantified using the software program Quantity One (Bio-Rad). Normalization of relative gene expression was based on band intensities of the housekeeping gene Roc1 and was presented as relative expression ratios. For each developmental stage the value of the wild-type was set on 1.
For Southern blotting, 5 μg DNA of the sns-D mutant was digested with HindIII and separated in 0.7% agarose gel along a dig-labeled Lambda EcoRI/HindIII marker, blotted onto Hybond-N and hybridized in DIG easy hyb (Roche) supplemented with 50 μg/ml herring sperm DNA with a hpt probe, labeled in a PCR reaction with primers MC141 and MC142 (Table 1) using DIG-labeling mix (Roche). After 16–20 h, blots were washed twice with 2 × SSC; 0.1% SDS at room temperature and three times with 0.2 × SSC; 0.1% SDS at 65°C. Detection was performed using the DIG wash and block buffer set and CDP-star (Roche), according the manufacturers protocol.
Cloning of eIF4B2 cDNA and Overexpression
cDNA was produced from total wild-type RNA and using primers Q28 and Q29 the At1g13020 coding region was amplified and cloned in pJET1.2 (Fermentas). After sequence confirmation the EcoRI–HindIII fragment was cloned in pHANNIBAL (Helliwell and Waterhouse, 2003) and the SacI–XbaI fragment from the resulting plasmid was cloned in pCambia1302 (http://www.cambia.org). The resulting binary vector was introduced in Agrobacterium tumefaciens strain AGL1 (Lazo et al., 1991) by electroporation and the strain was used for floral dip transformation to produce transgenic plants overexpressing At1g13020.
Statistical Analysis
Significance of the differences in mean values of the specific caspase-3 or caspase-6 like activities and the number of stomata were tested with the Student’s t-test.
Results
Genetic Analysis of the sns-D Mutant Reveals a Genomic Rearrangement of Chromosome 1
A pool of transgenic Arabidopsis plants harboring the activator T-DNA construct pSDM1550 was previously screened for developmental mutants (van der Graaff and Hooykaas, 1998). One of the T-DNA tagged transgenic lines is the Arabidopsis sns-D mutant, which produces spontaneous necrotic spots on the rosette leaves, even under aseptic conditions. Southern analysis demonstrated that only one T-DNA was integrated (Figure 1). The sequences flanking the right border of the insert were obtained by plasmid rescue employing the carbenicillin resistance gene present in the pUC9 vector sequences or the kanamycin gene of the binary vector. Interestingly, sequence analysis revealed that the T-DNA integrated together with the complete binary vector sequence resulting from T-strand formation initiated on the left border, followed by right border skipping (van der Graaff et al., 1996; line 17 is the sns-D mutant). Analysis of the 2 kb of plant DNA that flanks the integrated binary vector sequence showed that the T-DNA and binary vector sequences inserted in the 3′UTR of the gene At1g13020 (Figure 2) that encodes the eukaryotic initiation factor eIF4B2. In order to obtain the plant DNA sequences flanking the left border of the T-DNA, the genomic DNA sequences from DNA of hygromycin resistant plants were amplified by TAIL PCR, cloned, and sequenced. This revealed that the left border of the T-DNA was linked to the region between the genes At1g21550 and AT1g21560, suggesting that some chromosomal rearrangement had occurred.
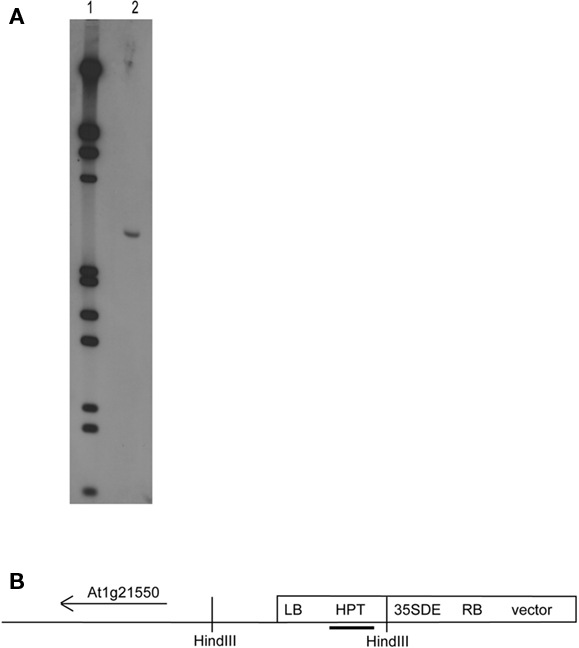
Figure 1. Southern blot analysis of sns-D. (A) Plant DNA (5 μg) of the sns-D mutant (lane 2) was digested with HindIII and separated in 0.7% agarose gel along a dig-labeled Lambda EcoRI/HindIII marker (lane 1), blotted and hybridized with a DIG-labeling hpt probe. (B) Schematic presentation of the sns-D HindIII fragment, which consists of the T-DNA region containing the left border (LB) and the flanking plant DNA close to the gene At1g21550. The hpt probe used to detect the HindIII fragment on the blot is shown as black bar.
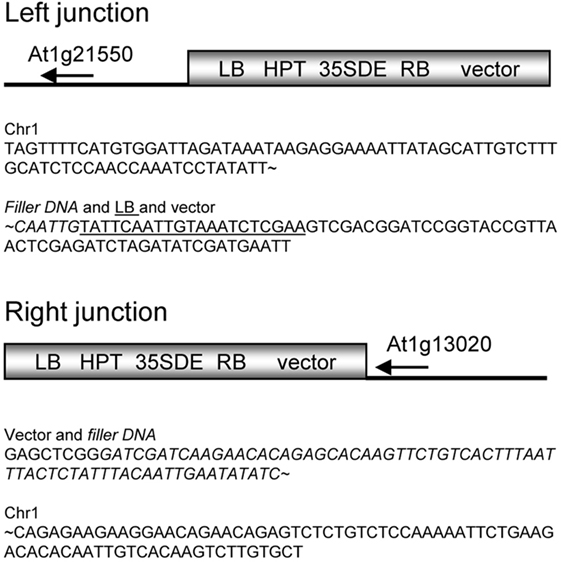
Figure 2. Genetic characterization of the sns-D mutant. Schematic representation and sequences of the left and right junctions of the T-DNA and binary vector insert in chromosome 1 of the sns-D mutant. Sequence of filler DNA is italicized and sequence of LB is underlined. LB, left T-DNA border repeat; RB, right T-DNA border repeat; HPT, hygromycin phosphotransferase gene; p35SDE, 35S CaMV promoter with double enhancer.
In order to obtain more evidence for chromosomal rearrangements, FISH technique was performed (Figure 3). Two adjacent BAC clones, BAC F3F19 (magenta signal) and BAC F13K23 (green signal), were used as probes, of which BAC F3F19 overlaps the integration site in At1g13020. Wild-type nuclei (Figure 3A) showed continuous single magenta and green signals on each of the chromosomes. However, sns-D mutant nuclei showed continuous magenta and green signals only on one chromosome and discontinuous magenta and green signals on the other chromosome (Figures 3B,D), suggesting that a chromosomal rearrangement took place. In pachytene chromosomes which are fully paired and display a well-differentiated pattern, we observed an extra magenta signal (Figures 3C,E), indicating that indeed a region hybridizing with BAC F3F19 had been rearranged. The proposed structure of chromosome 1 of the sns-D mutant is shown in Figure 3F.
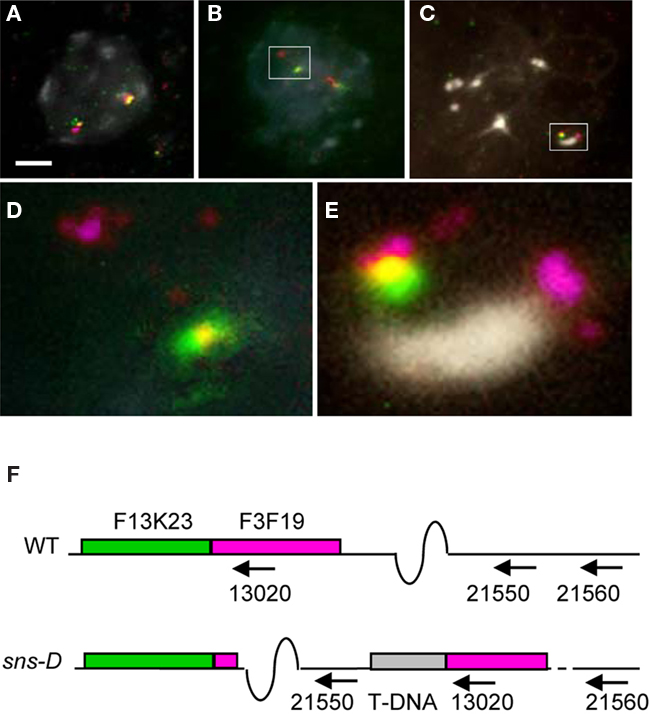
Figure 3. Fluorescence in situ hybridization (FISH). Nuclei from wild-type (A) and sns-D(B,C) plants were stained with DAPI and hybridized with BAC F13K23 (green signal) and BAC F3F19 (magenta signal). The boxed areas of (B,C) are shown enlarged in (D,E), respectively. The bar in (A) is 2.5 μm. (F) Schematic representation of the At1g13020 region on chromosome 1 in sns-D. The two BAC clones BAC F13K23 (green box) and BAC F3F19 (magenta box) are located adjacent on the wild-type chromosome 1, but discontinuously on the other chromosome 1 of the sns-D mutant. Due to a chromosomal rearrangement, the T-DNA and vector (gray bar) are located between the genes At1g21550 and At13020.
The T-DNA contained a hygromycin phosphotransferase (HPT) gene that confers resistance to the antibiotic hygromycin. Segregation of hygromycin resistance in the next generation occurred at a ratio 2:1 (291 resistant: 144 sensitive). PCR analysis showed that all hygromycin resistant plants were heterozygous. Analysis of siliques produced by hygromycin resistant plants showed empty spaces representing aborted embryos in the siliques (Figure 4), suggesting that homozygous T-DNA inserts in the sns-D mutant plants are lethal.
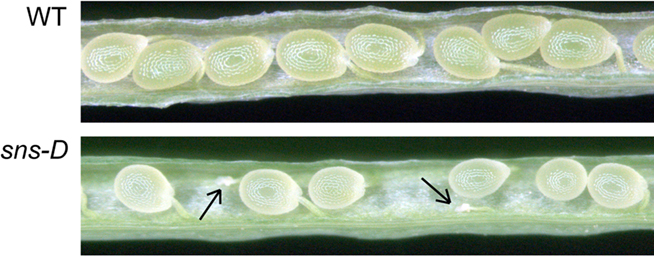
Figure 4. Siliques of a wild-type and a sns-D plant. The arrows indicate aborted seeds.
The sns-D Mutant Spontaneously Develops Necrotic Spots
The sns-D seedlings displayed a specific phenotype first visible after 2 weeks of growth on 0.5 MS medium in the culture chamber, consisting of the spontaneous formation of necrotic spots on the rosette leaves. It was not possible to differentiate between wild-type and mutant seedlings at an earlier stage. As shown in Figure 5, neither necrotic spots nor differences in morphology were visible on cotyledons or the first leaves for 1-week-old seedlings. After 2 weeks, sns-D seedlings started to produce necrotic spots (Figures 5G,H) on their oldest leaves, whereas this was never observed for wild-type seedlings cultured under the same conditions (Figures 5E,F). In addition, sns-D plants remained smaller than wild-type plants. The severity of the sns-D mutant phenotype increased throughout development and the differences between wild-type (Figures 5I,J) and the sns-D mutant (Figures 5K–N) were more pronounced after 5 weeks of growth. Two classes were distinguished among the sns-D plants, which both produce necrotic spots on the leaves and are smaller than the wild-type: the weak phenotype with leaves which are still green (Figures 5K,L) and the strong phenotype consisting of small and coiled leaves, which are rather necrotic (Figures 5M,N). Many of the sns-D plants with the strong phenotype died before an inflorescence could be formed or they produced a very small inflorescence. The sns-D plants with the weak phenotype formed bigger flowers, but after fertilization the siliques were smaller (Figures 5O–R). To determine whether the severity of the sns-D phenotype was determined by the parental origin of the T-DNA, reciprocal crosses were performed with wild-type plants. Crosses performed with the sns-D mutant as pollen donor as well as those with the sns-D mutant as ovule acceptor produced progenies that segregated for the strong and weak mutant phenotype. Thus, the severity of the sns-D phenotype could not be explained by the parental origin of the mutation (father or mother). Nevertheless, the germination frequency was reduced to 7% when the sns-D mutation was transmitted through the female gamete.
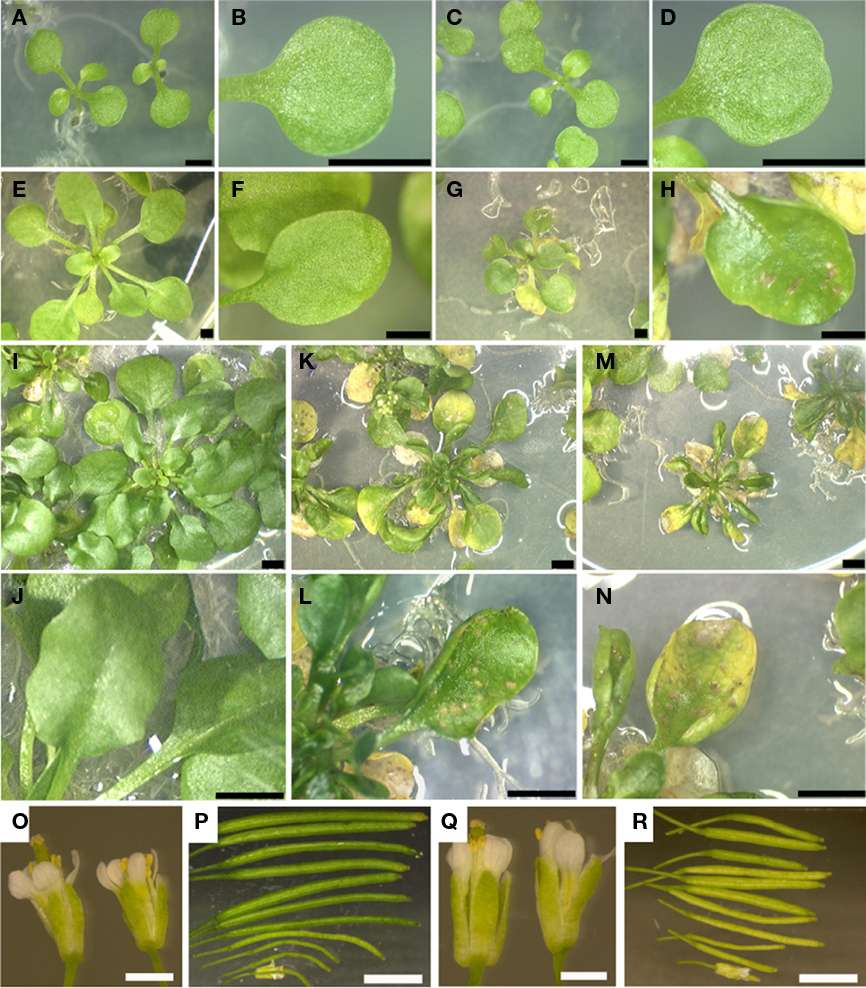
Figure 5. Phenotype of wild-type and sns-D mutant plants and development of necrotic spots on the leaves. Leaves and cotyledons of 1-week-old wild-type (A,B) and sns-D(C,D) seedlings, 3-week-old wild-type (E,F) and sns-D (G,H) seedlings, and 5-week-old wild-type (I,J) and sns-D (K–N) seedlings. Among the sns-D plants, two classes were distinguished: a class with big, rather green leaves (weak phenotype; K,L) and a class with smaller and coiled, necrotic leaves (strong phenotype; M,N). Flowers and siliques of the wild-type (O,P) and sns-D plants (Q,R). Bars are 2 mm (A–N), 1 mm (O,Q), or 5 mm (P,R).
To further characterize developmental alterations caused by the sns-D mutation, analysis of rosette leaves was performed with scanning electron microscopy. No differences between the wild-type and the sns-D mutant were observed in their early stages of development. The adaxial and abaxial sides of the cotyledons of 1-week-old wild-type (Figures 6A–C) and sns-D seedlings (Figures 6J–L) were similar. However, analysis of 5-week-old seedlings showed that patches of epidermal cells of the sns-D mutants (Figures 6M–R) were flattened on both sides of the leaves. This was not observed in wild-type seedlings (Figures 6D–I). In cross-sections of the leaves of sns-D seedlings the collapsed cells in the necrotic regions were clearly visible (Figure 7).
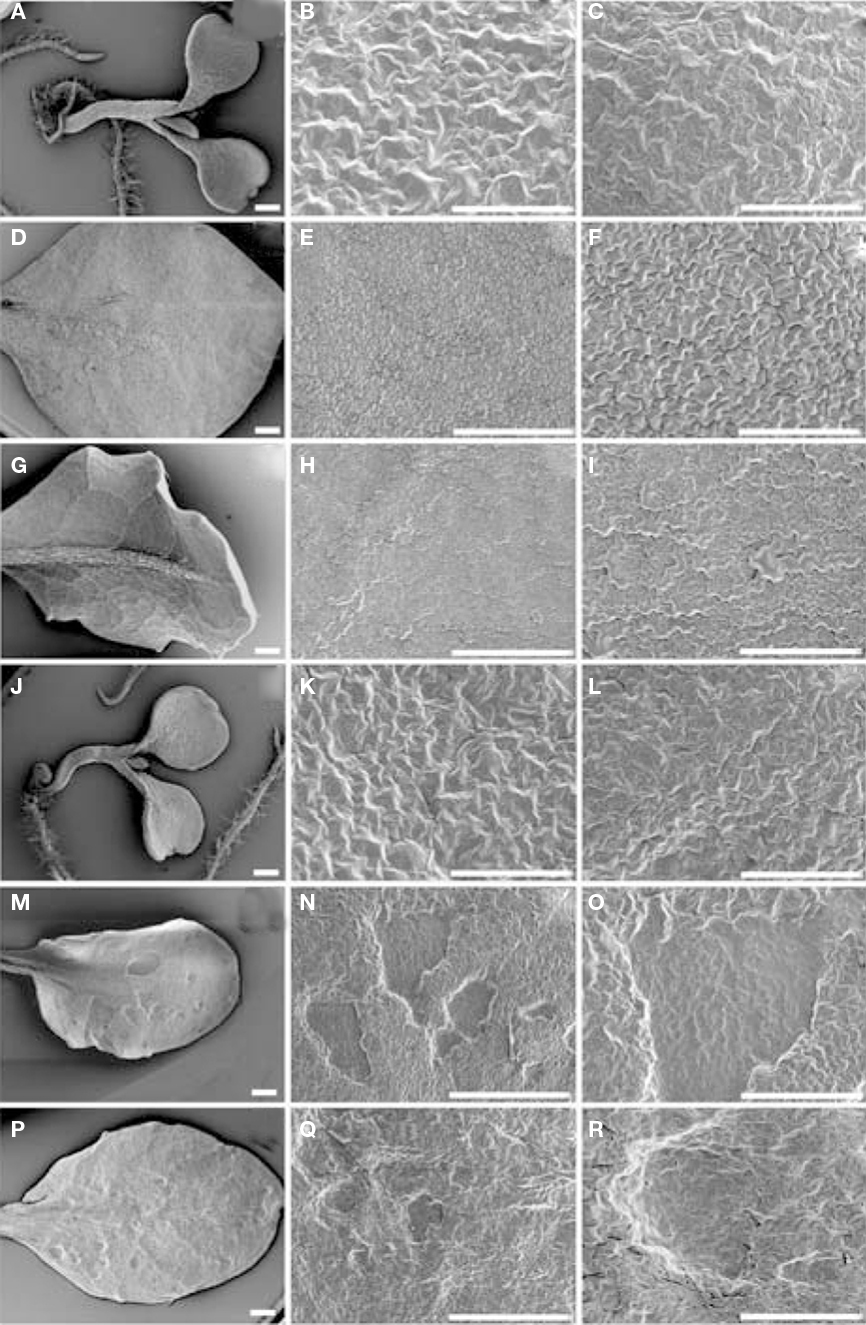
Figure 6. Scanning electron microscopy analysis. Cotyledons and leaves of one-week-old wild-type (A–C) and sns-D(J–L) seedlings, and 5-week-old wild-type (D–I) and sns-D (M–R) plants were analyzed. Adaxial sides of cotyledons (B,K) or leaves (D,E,F,M,N,O) and abaxial sides of cotyledons (C,L) or leaves (G,H,I,P,Q,R) are shown. Bars in (A,D,E,G,H,J,M,N,P, Q) are 500 μm and in (B,C,F,I,K,L,O,R) are 200 μm.
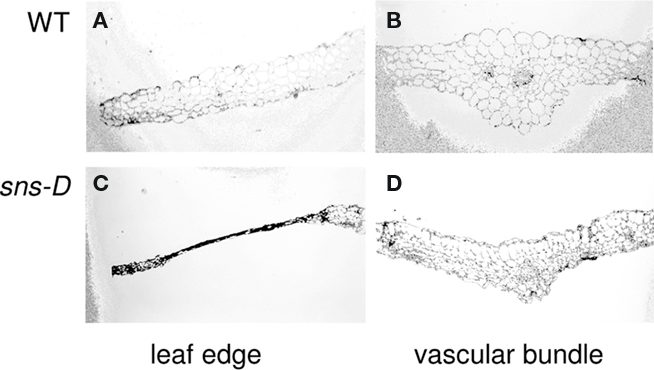
Figure 7. Anatomical analysis of wild-type and sns-D leaves. Cross-sections were made from rosette leaves from 2-week-old plants grown in soil. (A,B) wild-type, (C,D) Mutant sns-D showing cross section through a necrotic spot (C).
The sns-D mutant produced smaller leaves. The size of the pavement cells was reduced resulting in two times more cells per surface area (Figure 8). The number of stomata was also determined on the adaxial side of rosette leaves from 5-week-old plants (Table 2). Compared to the wild-type, the sns-D mutant produced 1.5 times more stomata per surface area on the adaxial side of the leaves (2.9 ± 0.5/10−8 m2 and 4.5 ± 1.0/10−8 m2, respectively). Thus, the total number of pavement cells and stomata remained nearly unaltered, but the cell size was reduced in the sns-D mutant leaves.
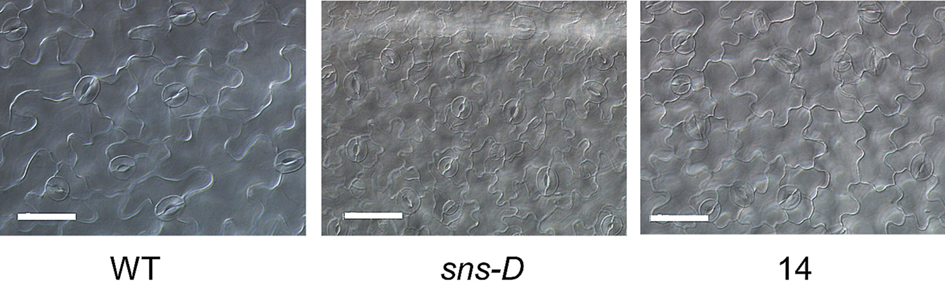
Figure 8. Adaxial sides of leaves of a wild-type plant (WT), the sns-D mutant (sns-D), and an overexpression line (14). The bars are 40 μm.
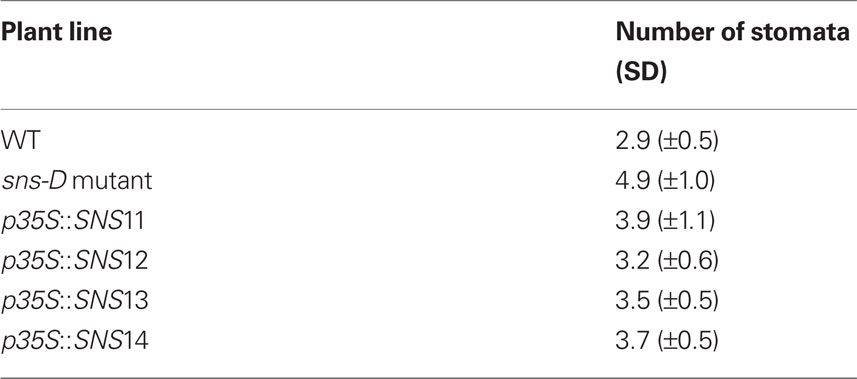
Table 2. Number of stomata on adaxial side of leaves of 5-week-old plants on 10− 8 m2 tissue.
Programmed Cell Death is Increased in the sns-D Mutant
Analysis of the mutant leaves suggested that both the epidermal and the internal cell layers of the necrotic spots contain dead cells. Cell death can occur by necrosis or by PCD. The latter is characterized by an activation of caspase-like proteases and specific DNA cleavage. We assayed for caspase-3 and caspase-6 like activities in leaf extracts by use of the synthetic fluorogenic caspase-3 substrate Ac-DEVD-AMC and the synthetic fluorogenic caspase-6 substrate Ac-VEID-AMC, respectively. Using these substrates, caspase-like activities have previously been found in plant cells (del Pozo and Lam, 1998; Sun et al., 1999; Lam and del Pozo, 2000; Bozhkov et al., 2004; Chichkova et al., 2010; Xu and Zhang, 2010). Because of the increasing severity of the sns-D phenotype throughout development, caspase activity was determined in leaf extracts from 5-weeks-old plants. An increase of the caspase-3-like activity was measured in leaf extracts from the sns-D mutant (Figure 9, gray bars). The caspase-3 like activity was about two-fold higher in the weak phenotypic class and about four-fold higher in the strong phenotypic class as compared to the wild-type control. A similar observation was made for caspase-6 like activity (Figure 9, black bars). Caspase-6 like activity was about 1.5- and 4-fold higher in the weak and strong phenotypic class, respectively. Thus, sns-D plants exhibit higher caspase-3 and caspase-6 like activities, indicative of PCD, with the highest activities in the strongest phenotypic mutant class.
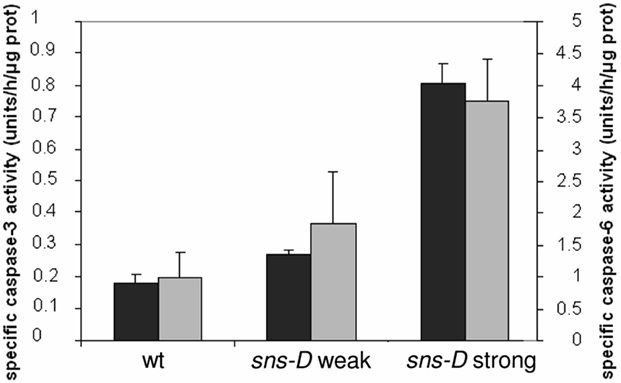
Figure 9. Caspase activity assay. Specific caspase-3 like (gray bars) and caspase-6 like (black bars) activities measured in leaf extract of 5-week-old wild-type plants and sns-D mutants with weak and strong phenotypes.
DNA cleavage, another hallmark of PCD was visualized by the TUNEL assay. In wild-type rosette leaves TUNEL-positive nuclei were not detected (Figures 10A–D), whereas pre-incubation with DNase I prior to the TUNEL reaction induced DNA cleavage throughout the leaf (Figures 10E–H). The sns-D mutant showed TUNEL-positive nuclei in the cells located in the necrotic spots, whereas no TUNEL signal was detected outside the necrotic spots (Figures 10I–L). With transmitted light the necrotic spots appeared as a brown zone of collapsed cells. Sytox orange was used to detect all nuclei in cross-sections of sns-D leaves. Pre-incubation with DNase I prior to the TUNEL reaction induced DNA cleavage throughout the leaf (Figures 10M–P). To conclude, the in situ detection of DNA fragmentation by TUNEL analysis of the leaves showed that many cells in the necrotic spots contain fragmented DNA, one of the hallmarks of PCD.
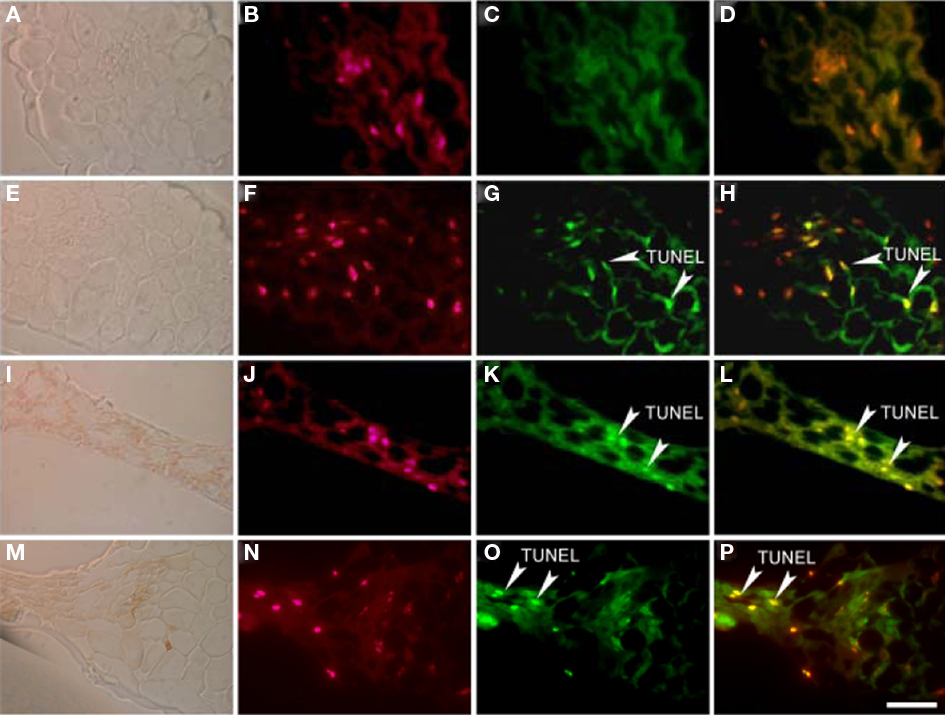
Figure 10. TUNEL staining in necrotic spots. Transmitted light images (A,E,I,M), sytox orange nuclear staining (B,F,J,N) and TUNEL staining (C,G,K,O) on cross-sections of 5-week-old wild-type (A–D), and sns-D leaves (I–L). As positive controls, DNase I-treated cross-sections of wild-type (E–H) and sns-D leaf (M–P) are shown. (D,H,L,P) are merged images of (B) with (C), (F) with (G), (J) with (K), (N) with (O), respectively. TUNEL-positive nuclei are indicated by arrows. The bar is 25 μm.
The sns-D Mutant Phenotype Correlates with the Expression Level of the eIF4B2 Gene
Due to a chromosomal rearrangement of chromosome 1, the T-DNA and the binary vector were inserted flanking the genes At1g21550 and At1g13020 (eIF4B2). Since the T-DNA is an activator tagging construct that contains the strong 35S enhancer, it is possible that the sns-D mutant phenotype is caused by increased expression (activation) of one or more genes flanking this T-DNA insert. The expression levels of the flanking genes were determined with Q-RT-PCR in both phenotypic classes of sns-D plants and compared with the expression levels in wild-type plants (Figure 11A). The expression levels of both At1g13020 and At1g21550 were higher in sns-D plants. The level of expression of At1g13020 correlated with the severity of the phenotype, whereas At1g21550 expression did not. Northern blot analysis showed that the expression of At1g13020 was higher in 2- to 5-week-old sns-D seedlings than in wild-type seedlings of the same age. In addition, the expression level was higher in sns-D plants and leaves with the strong phenotype than in plants and leaves with the weak phenotype (Figure 11B). Thus, the Atg13020 expression levels correlated with the timing and severity of the developmental defects that were observed in the sns-D mutant plants.
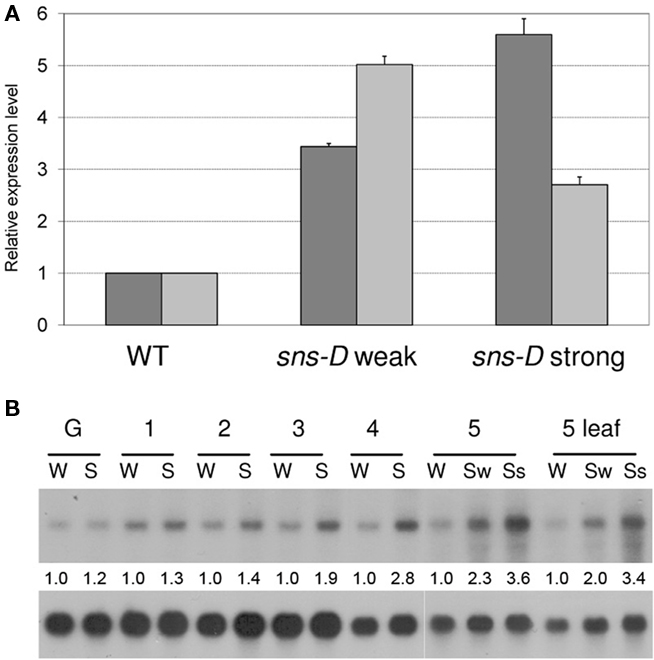
Figure 11. Expression levels of genes flanking the T-DNA/vector insert. (A) Relative expression levels of At1g13020 (dark gray bars) and At1g21550 (light gray bars) in wild-type plants (WT) and in sns-D mutants with weak and strong phenotypes as determined via Q-RT-PCR. The expression level in the wild-type was set on 1 and the SD in the mutants was indicated by error bars. (B) Northern blot analysis of At1g13020 in the wild-type (W) and the sns-D mutant (S) at different growth stages. G, just germinated; 1, 1 week after germination; 2, 2 weeks after germination; 3, 3 weeks after germination; 4, 4 weeks after germination; 5, 5 weeks after germination; Sw, sns-D plants with weak phenotype; Ss, sns-D plants with strong phenotype. Loading of RNA was determined by quantification of the bands after hybridization with At4g38740 (cyclophilin). Relative expression of At1g13020 in the mutant plants was shown for each developmental stage. The expression in the wild-type was set on 1.
Overexpression of eIF4B2 Mimics the sns-D Mutant Phenotype
To confirm that the sns-D mutant phenotype was indeed caused by the activation tagging of At1g13020, resulting in increased eIF4B2 expression levels, plants were produced with the eIF4B2 coding region under transcriptional control of the constitutive CaMV 35S promoter. Transgenic plants were obtained, some having necrotic spots on their leaves (Figure 12A) and some having a very severe phenotype with large necrotic regions on their leaves that died before setting seeds. Plants that produced seeds were further analyzed. In the next generation most plant lines showed different size classes, like the sns-D mutant (Figure 12B).
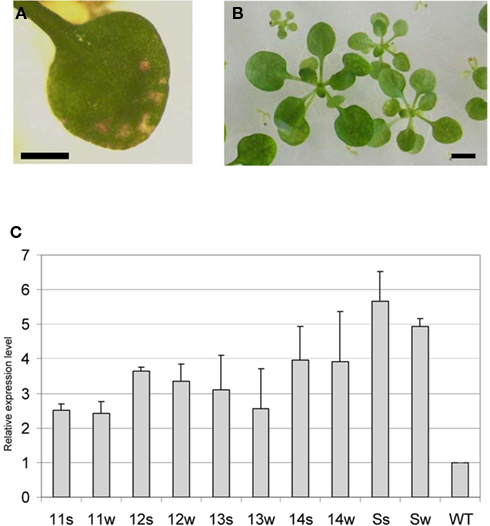
Figure 12. Phenotype and expression level of At1g13020 overexpression lines. (A) Necrotic spots on a leaf of a primary transformant overexpressing At1g13020 cDNA. (B) Sizes of seedlings of an At1g13020 overexpression line. (C) Relative expression level of At1g13020 as determined via Q-RT-PCR in progeny seedlings with a strong phenotype (s) or weak phenotype (w) of four overexpression lines (11, 12, 13, 14) and the sns-D mutant compared to wild-type plants (WT). The expression level in the wild-type was set on 1 and the SD in the mutants was indicated by error bars.
Progeny of four plant lines were analyzed by Q-RT-PCR to determine the expression level of eIF4B2. These lines showed a 2.5- to 4-fold increased expression level, which was somewhat lower than the 4.9- and 5.5-fold increased expression level in sns-D plants with the weak and strong phenotype, respectively (Figure 12C). Note that the expression level in the sns-D mutant with the weak phenotype was somewhat higher in this experiment compared to the experiment of Figure 11. Subsequently, the overexpression lines were grown on soil along with the wild-type and the sns-D mutant. The phenotypic characteristics were comparable with those of the sns-D mutants with a weak phenotype (Figure 13) and accordingly the severity of this phenotype increased in older plants. The rosettes were small and bushy and the leaves were curled with necrotic spots or areas. Inflorescences appeared late and were small with little flowers. Since cell size of the sns-D leaves was reduced and the number of stomata was increased, we determined the cell size and the number of stomata on the leaves of the overexpression lines (Table 2). Indeed, the size of the pavement cells was reduced (Figure 8) resulting in more stomata per surface area on the adaxial side of these leaves compared to the wild-type and the number was in between the number on the wild-type leaves and that seen on the sns-D leaves. Thus, increased eIF4B2 expression levels caused phenotypic alterations that mimicked those detected in the sns-D mutant, indicating that the sns-D mutant phenotype is caused by activation tagging of eIF4B2.
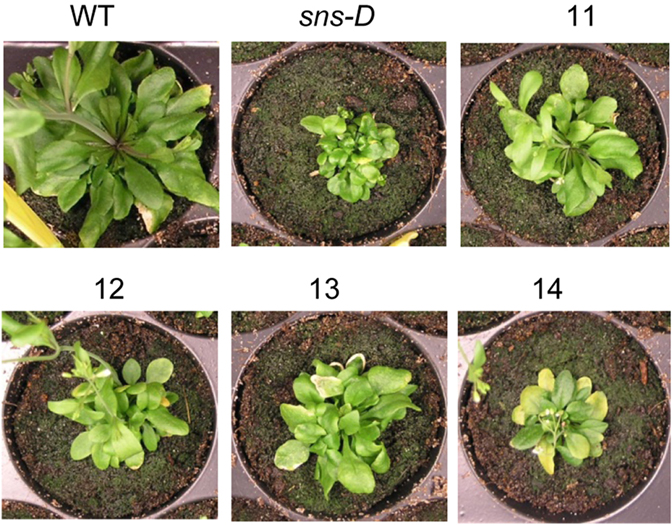
Figure 13. Phenotype of At1g13020 overexpression lines. Five-week-old plants were grown on soil; overexpression lines (11, 12, 13, 14), the sns-D mutant and the wild-type (WT).
Discussion
The inserted T-DNA activation tagging construct contains a double 35S enhancer that might increase the expression of flanking genes. Activation tagging proved to be a powerful method to generate dominant mutations with various phenotypes (Weigel et al., 2000; van der Graaff et al., 2002). The overexpressed genes causing the dominant mutations in these activation tagged mutants, were almost always found immediately adjacent to the inserted 35S enhancer sequences located on the activator T-DNA insert, which had been integrated either upstream or downstream of the overexpressed genes. As a result of the insertion of the activator T-DNA/vector in the sns-D mutant, a rearrangement of chromosome 1 took place. The expression level of one of the genes immediately flanking the activator T-DNA insert in the sns-D mutant (At1g21550) was increased, but the expression level did not correlate with the observed sns-D phenotypic classes. Furthermore, this gene is possibly regulated by light (Rossel et al., 2007; Chen et al., 2008) and probably not involved in PCD. However, the expression level of the gene adjacent to the other side of the T-DNA/vector insert (At1g13020), which encodes the eukaryotic translation initiation factor eIF4B2, was increased to a higher level, and its expression correlated with the strength of the observed phenotypic sns-D classes. Most likely, this three to six times increased expression level is caused by the 35S enhancer located on the inserted T-DNA functioning as an activator element. The overexpression of the eIF4B2 cDNA mimicked the sns-D mutant phenotype, strongly indicating that this mutant phenotype is caused by activation tagging of the eIF4B2 gene (At1g13020). Although the CaMV 35S promoter was used for overexpression of the eIF4B2 cDNA, the expression level was only moderately elevated. In untransformed plants, expression of eIF4B2 is low in all plant organs except for sperm cells (Hruz et al., 2008). A few fold higher expression level already resulted in a phenotype. Probably high eIF4B2 expression levels are lethal and only transgenic plants with moderately increased eIF4B2 expression levels could be obtained.
The initiation of protein synthesis in eukaryotes is a complicated process (for a review see Jackson et al., 2010). Initiation requires more than 10 eukaryotic initiation factors (eIFs), which mediate the binding of the 40S ribosomal subunit to the initiation codon and subsequent formation of the complete ribosome by joining with the 60S ribosomal subunit. The eIF4B from wheat and Arabidopsis is a member of a multigene family (Metz et al., 1999). In Arabidopsis, two eIF4B isoforms are present encoded by eIF4B1 (At3g26400) and eIF4B2 (At1g13020), which share 70% identity at the amino acid level. eIF4B is an RNA-binding protein that functions to enhance the helicase activity of eIF4A and the eIF4E component of the eIF4F complex (Rogers et al., 2001). It was shown that eIF4B influences mRNA discrimination during initiation of translation (Mayberry et al., 2009). Individual mRNAs or classes of mRNAs may respond to the relative abundance of a particular initiation factor, which in turn may affect the amount of protein translated, resulting in optimal translation under a variety of cellular conditions. Selective reduction of translation was observed for mRNAs harboring strong to moderate secondary structures in their 5′UTRs, most of them encoding proteins, which function in cell proliferation (Shahbazian et al., 2010). Disturbing the relative abundance of initiation factors can have major consequences. In mammals, overexpression of eIF4E and the corresponding increased formation of eIF4F is associated with a wide range of cancers (Silvera et al., 2010).
Recently, another Arabidopsis eukaryotic initiation factor (eIF5A) was found to be involved in pathogen-induced cell death and to play a crucial role in plant development and stress responses (Thompson et al., 2004; Feng et al., 2007; Hopkins et al., 2008; Xu et al., 2010). This highly conserved protein found in all eukaryotic organisms also selectively binds specific subsets of mRNA (Xu et al., 2004). It was demonstrated that a mutation in the eIF5A-2 gene causes severe developmental defects in the Arabidopsis mutant fumonisin B1-resistant12 (fbr12; Feng et al., 2007). The eIF5A-2 gene expression level is decreased in this fbr12 mutant, resulting in an anti-apoptotic phenotype. In contrast, transgenic plants with constitutive eIF5A-2 overexpression display phenotypes like necrotic lesions and stunted growth, consistent with precocious cell death. The sns-D mutant exhibiting an increased eIF4B2 gene expression level also showed similar phenotypes, like necrotic lesions, stunted growth, and increased levels of markers indicative of PCD. Because the spontaneous necrotic lesions are also formed under aseptic conditions, the sns-D mutant is disturbed in the regulation of PCD (initiation mutant). The observed effects on PCD resulting from altered expression levels of the elongation factors eIF4B2 and eIF5A-2 suggests that the control of protein translation is important for the pathogen defense response. We hypothesize that the translation of specific proteins is affected, since eIF4B has been implicated in mRNA discrimination during initiation of translation (Mayberry et al., 2009). Most LMMs characterized to date revealed other important players in PCD: defense related genes, salicylic acid, abscisic acid, Ca2+ influx, ROS formation and sensing, sphingolipid metabolism and porphyrin/chlorophyll biosynthesis and catabolism (Lorrain et al., 2003; Moeder and Yoshioka, 2008; Mosher et al., 2010). Further analysis of our mutant may reveal novel targets for practical agronomical applications aimed at preventing yield loss by pathogen infection.
In mammals, the control of protein translation has been correlated with apoptosis in diverse developmental processes and during stress responses (Wek et al., 2006; Chang et al., 2007; Dumstorf et al., 2010). In addition, perturbations in protein translation caused by stress conditions affect a multitude of pathways aimed to cope with the stress situation (Wek et al., 2006). Following pathogen infection, plants need to balance between robustness to efficiently abolish infection and negative impacts of immune responses on plant fitness (Sato et al., 2010). The developmental defects resulting from increased eIF4B2 and eIF5A-2 expression indicates that the balance in such lines is shifted predominantly toward abolishing the pathogen infection, severely affecting plant fitness. Many different mutations and environmental stresses result in inhibition of cell expansion and stunted growth. Thus, the correct regulation of translation initiation mediated through the expression and activity of eukaryotic initiation factors is important for diverse developmental processes, including the regulation of PCD to control pathogen infections.
Conclusion
Analysis of the sns-D mutant revealed that an increased expression level of the gene encoding the eukaryotic initiation factor eIF4B2 resulted in spontaneous necrotic spots, DNA fragmentation and increased caspase activity, indicating that PCD was induced in this mutant. This shows that disturbing the relative abundance of translation factors may have major consequences for PCD and pathogen responses in plants.
Conflict of Interest Statement
The authors declare that the research was conducted in the absence of any commercial or financial relationships that could be construed as a potential conflict of interest.
Acknowledgments
This work was supported by Stichting Binair Vector Systeem (Gwénaël M. D. J.-M. Gaussand) and Chinese Scholarship Council (Qi Jia).
References
Bosch, M., and Franklin-Tong, V. E. (2008). Self-incompatibility in Papaver: signalling to trigger PCD in incompatible pollen. J. Exp. Bot. 59, 481–490.
Bouchez, O., Huard, C., Lorrain, S., Roby, D., and Balagué, C. (2007). Ethylene is one of the key elements for cell death and defense response control in the Arabidopsis lesion mimic mutant vad1. Plant Physiol. 145, 465–477.
Bozhkov, P. V., Filonova, L. H., Suarez, M. F., Helmersson, A., Smertenko, A. P., Zhivotovsky, B., and von Arnold, S. (2004). VEIDase is a principal caspase-like activity involved in plant programmed cell death and essential for embryonic pattern formation. Cell Death Differ. 11, 175–182.
Bradford, M. M. (1977). A rapid and sensitive method for the quantitation of microgram quantities of protein utilizing the principle of protein-dye binding. Anal. Biochem. 72, 248–254.
Chang, R. C., Yu, M. S., and Lai, C. S. (2007). Significance of molecular signaling for protein translation control in neurodegenerative diseases. Neurosignals 15, 249–258.
Chen, X., Lin, W.-H., Wang, Y., Luan, S., and Xue, H.-W. (2008). An inositol polyphosphate 5-phosphatase functions in PHOTOTROPIN1 signaling in Arabidopsis by altering cytosolic Ca2+. Plant Cell 20, 353–366.
Chichkova, N. V., Shaw, J., Galiullina, R. A., Drury, G. E., Tuzhikov, A. I., Kim, S. H., Kalkum, M., Hong, T. B., Gorshkova, E. N., Torrance, L., Vartapetian, A. B., and Taliansky, M. (2010). Phytaspase, a relocalisable cell death promoting plant protease with caspase specificity. EMBO J. 29, 1149–1161.
del Pozo, O., and Lam, E. (1998). Caspases and programmed cell death in the hypersensitive response of plants to pathogens. Curr. Biol. 8, 1129–1132.
Dietrich, R. A., Delaney, T. P., Uknes, S. J., Ward, E. R., Ryals, J. A., and Dangl, J. L. (1994). Arabidopsis mutants simulating disease resistance response. Cell 77, 565–577.
Domínguez, F., Moreno, J., and Cejudo, F. J. (2001). The nucellus degenerates by a process of programmed cell death during the early stages of wheat grain development. Planta 213, 352–360.
Dumstorf, C. A., Konicek, B. W., McNulty, A. M., Parsons, S. H., Furic, L., Sonenberg, N., and Graff, J. R. (2010). Modulation of 4E-BP1 function as a critical determinant of enzastaurin-induced apoptosis. Mol. Cancer Ther. 9, 3158–3163.
Feng, H., Chen, Q., Feng, J., Zhang, J., Yang, X., and Zuo, J. (2007). Functional characterization of the Arabidopsis eukaryotic translation initiation factor 5A-2 that plays a crucial role in plant growth and development by regulating cell division, cell growth, and cell death. Plant Physiol. 144, 1531–1545.
Greenberg, J. T., and Ausubel, F. M. (1993). Arabidopsis mutants compromised for the control of cellular damage during pathogenesis and aging. Plant J. 4, 327–341.
Greenberg, J. T., Guo, A., Klessig, D. F., and Ausubel, F. M. (1994). Programmed cell death in plants: a pathogen-triggered response activated co-ordinately with multiple defense functions. Cell 77, 551–563.
Gunawardena, A. H. (2008). Programmed cell death and tissue remodelling in plants. J. Exp. Bot. 59, 445–451.
He, X., and Kermode, A. R. (2003). Proteases associated with programmed cell death of megagametophyte cells after germination of white spruce (Picea glauca) seeds. Plant Mol. Biol. 52, 729–744.
Helliwell, C., and Waterhouse, P. (2003). Constructs and methods for high-throughput gene silencing in plants. Methods Enzymol. 30, 289–295.
Hoisington, D. A., Neuffer, M. G., and Walbot, V. (1982). Disease lesion mimics in maize. Effect of genetic background, temperature, developmental age, and wounding on necrotic spot formation with Les1. Dev. Biol. 93, 381–388.
Hopkins, M. T., Lampi, Y., Wang, T.-W., Liu, Z., and Thompson, J. E. (2008). Eukaryotic translation initiation factor 5A is involved in pathogen-induced cell death and development of disease symptoms in Arabidopsis. Plant Physiol. 148, 479–489.
Hruz, T., Laule, O., Szabo, G., Wessendorp, F., Bleuler, S., Oertle, L., Widmayer, P., Gruissem, W., and Zimmermann, P. (2008). Genevestigator V3: a reference expression database for the meta-analysis of transcriptomes. Adv. Bioinformatics 2008, 420747.
Jackson, R. J., Hellen, C. U. T., and Pestova, T. V. (2010). The mechanism of eukaryotic translation initiation and principles of its regulation. Nat. Rev. 10, 113–127.
Lam, E., and del Pozo, O. (2000). Caspase-like protease involvement in the control of plant cell death. Plant Mol. Biol. 44, 417–428.
Lazo, G. R., Stein, P. A., and Ludwig, R. A. (1991). A DNA transformation-competent Arabidopsis genomic library in Agrobacterium. Biotechnology 9, 963–967.
Levine, A., Pennell, R. I., Alvarez, M. E., Palmer, R., and Lamb, C. (1996). Calcium-mediated apoptosis in a plant hypersensitive disease resistance response. Curr. Biol. 6, 427–437.
Li, N., Zhang, D. S., Liu, H. S., Yin, C. S., Li, X. X., Liang, W. Q., Yuan, Z., Xu, B., Chu, H. W., Wang, J., Wen, T. Q., Huang, H., Luo, D., Ma, H., and Zhang, D. B. (2006). The rice tapetum degeneration retardation gene is required for tapetum degradation and anther development. Plant Cell 18, 2999–3014.
Liu, Y. G., and Whittier, R. F. (1995). Thermal asymmetric interlaced PCR: automatable amplification and sequencing of insert end fragments from P1 and YAC clones for chromosome walking. Genomics 25, 674–681.
Lorrain, S., Lin, B., Auriac, M. C., Kroj, T., Saindrenan, P., Nicole, M., Balagué, C., and Roby, D. (2004). Vascular associated death1, a novel GRAM domain-containing protein, is a regulator of cell death and defense responses in vascular tissues. Plant Cell 16, 2217–2232.
Lorrain, S., Vailleau, F., Balague, C., and Roby, D. (2003). Lesion mimic mutants: keys for deciphering cell death and defense pathways in plants? Trends Plant Sci. 8, 263–271.
Ma, W., and Berkowitz, G. A. (2007). The grateful dead: calcium and cell death in plant innate immunity. Cell. Microbiol. 9, 2571–2885.
Malerba, M., Contran, N., Tonelli, M., Crosti, P., and Cerana, R. (2008). Role of nitric oxide in actin depolymerization and programmed cell death induced by fusicoccin in sycamore (Acer pseudoplatanus) cultured cells. Physiol. Plant. 133, 449–527.
Maraschin, S. F., Gaussand, G., Pulido, A., Olmedilla, A., Lamers, G. E. M., Korthout, H., Spaink, H. P., and Wang, M. (2005). Programmed cell death during the transition from multicellular structures to globular embryos in barley androgenesis. Planta 221, 459–470.
Mayberry, L. K., Allen, M. L., Dennis, M. D., and Browning, F. S. (2009). Evidence for variation in the optimal translation initiation complex: plant eIF4B, eIF4F and eIF(iso)4F differentially promote translation of mRNAs. Plant Physiol. 150, 1844–1854.
Menke, F. L. H., Parchmann, S., Mueller, M. J., Kijne, J. W., and Memelink, J. (1999). Involvement of the octadecanoid pathway and protein phosphorylation in fungal elicitor-induced expression of terpenoid indole alkaloid biosynthetic genes in Catharanthus roseus. Plant Physiol. 119, 1289–1296.
Metz, A. M., Wong, K. C., Malmström, S. A., and Browning, K. S. (1999). Eukaryotic initiation factor 4B from wheat and Arabidopsis thaliana is a member of a multigene family. Biochem. Biophys. Res. Commun. 266, 314–321.
Moeder, W., and Yoshioka, K. (2008). Lesion mimic mutants: a classical, yet still fundamental approach to study programmed cell death. Plant Signal. Behav. 3, 764–767.
Mosher, S., Moeder, W., Nishimura, N., Jikumaru, Y., Joo, S.-H., Urquhart, W., Klessig, D. F., Kim, S.-K., Nambara, E., and Yoshioka, K. (2010). The lesion-mimic mutant cpr22 shows alteration in abscisic acid signaling and abscisic acid insensitivity in a salicylic acid-dependent manner. Plant Physiol. 152, 1901–1913.
Pasqualini, S., Piccioni, C., Reale, L., Ederli, L., Della Tore, G., and Ferranti, F. (2003). Ozone-induced cell death in tobacco cultivar Bel W3 plants. The role of programmed cell death in lesion formation. Plant Physiol. 133, 1122–1134.
Poulter, N. S., Wheeler, M. J., Bosch, M., and Franklin-Tong, V. E. (2010). Self-incompatibility in Papaver: identification of the pollen S-determinant PrpS. Biochem. Soc. Trans. 38, 588–592.
Reape, T. J., Molony, E. M., and McCabe, P. F. (2008). Programmed cell death in plants: distinguishing between different modes. J. Exp. Bot. 59, 435–444.
Rogers, G.W. Jr., Richter, N. J., Lima, W. F., and Merrick, W. C. (2001). Modulation of the helicase activity of eIF4A by eIF4B, eIF4H and eIF4F. J. Biol. Chem. 276, 30914–30922.
Rossel, J. B., Wilson, P. B., Hussain, D., Woo, N. S., Gordon, M. J., Mewett, O. P., Howell, K. A., Whelan, J., Kazan, K., and Pogson, B. J. (2007). Systemic and intracellular responses to photooxidative stress in Arabidopsis. Plant Cell 19, 4091–4110.
Ryerson, D. E., and Heath, M. C. (1996). Cleavage of nuclear DNA into oligonucleosomal fragments during cell death induced by fungal infection or by abiotic treatments. Plant Cell 8, 393–402.
Sato, M., Tsuda, K., Wang, L., Coller, J., Watanabe, Y., Glazebrook, J., and Katagiri, F. (2010). Network modeling reveals prevalent negative regulatory relationships between signaling sectors in Arabidopsis immune signaling. PLoS Pathog. 6, e1001011. doi: 10.1371/journal.ppat.1001011
Schubert, I., Fransz, P. F., Fuchs, J., and de Jong, J. H. (2001). Chromosome painting in plants. Methods Cell Sci. 23, 57–69.
Shahbazian, D., Parsyan, A., Petroulakis, E., Hershey, J., and Sonenberg, N. (2010). eIF4B controls survival and proliferation and is regulated by proto-oncogenic signaling pathways. Cell Cycle 15, 4106–4109.
Silvera, D., Formenti, S. C., and Schneider, R. J. (2010). Translational control in cancer. Nat. Rev. 10, 254–266.
Sun, Y. L., Zhao, Y., Hong, X., and Zhai, Z. H. (1999). Cytochrome c release and caspase activation during menadione-induced apoptosis in plants. FEBS Lett. 462, 317–321.
Takahashi, A., Kawasaki, T., Henmi, K., Shil, K., Kodama, O., Satoh, H., and Shimamoto, K. (1999). Lesion mimic mutants of rice with alterations in early signaling events of defense. Plant J. 17, 535–545.
Thompson, J. E., Hopkins, M. T., Taylor, C., and Wang, T. W. (2004). Regulation of senescence by eukaryotic translation initiation factor 5A: implications for plant growth and development. Trends Plant Sci. 9, 174–179.
Uzelac, B., Janosevi, D., and Budimir, S. (2008). In situ detection of programmed cell death in Nicotiana tabacum leaves during senescence. J. Microsc. 230, 1–3.
van der Graaff, E. (1997). Developmental Mutants of Arabidopsis thaliana Obtained After T-DNA Transformation. Ph.D. thesis, Leiden University.
van der Graaff, E., den Dulk-Ras, A., and Hooykaas, P. J. (1996). Deviating T-DNA transfer from Agrobacterium tumefaciens to plants. Plant Mol. Biol. 31, 677–681.
van der Graaff, E., and Hooykaas, P. J. (1998). Transformation of Arabidopsis thaliana C24 leaf discs by Agrobacterium tumefaciens. Methods Mol. Biol. 82, 245–258.
van der Graaff, E., Hooykaas, P. J., and Keller, B. (2002). Activation tagging of the two closely linked genes LEP and VAS independently affects vascular cell number. Plant J. 32, 819–830.
Wang, L., Pei, Z., Tian, Y., and He, C. (2005). OsLSD1, a rice zinc finger protein, regulates programmed cell death and callus differentiation. Mol. Plant Microbe Interact. 18, 375–384.
Wang, M., Oppedijk, B. J., Lu, X., van Duijn, B., and Schilperoort, R. A. (1996). Apoptosis in barley aleurone during germination and its inhibition by abscisic acid. Plant Mol. Biol. 32, 1125–1134.
Weigel, D., Ahn, J. H., Blázquez, M. A., Borevitz, J. O., Christensen, S. K., Fankhauser, C., Ferrándiz, C., Kardailsky, I., Malancharuvil, E. J., Neff, M. M., Nguyen, J. T., Sato, S., Wang, Z.-Y., Xia, Y., Dixon, R. A., Harrison, M. J., Lamb, C. J., Yanofsky, M. F., and Chory, J. (2000). Activation tagging in Arabidopsis. Plant Physiol. 122, 1003–1013.
Wek, R. C., Jiang, H. Y., and Anthony, T. G. (2006). Coping with stress: eIF2 kinases and translational control. Biochem. Soc. Trans. 34, 7–11.
Wolter, M., Hollricher, K., Salamini, F., and Schulze-Lefert, P. (1993). The mlo resistance alleles to powdery mildew infection in barley trigger a developmentally controlled defence mimic phenotype. Mol. Gen. Genet. 239, 122–128.
Xu, A., Joa, D. L.-E., and Chen, K. Y. (2004). Identification of mRNA that binds to eukaryotic initiation factor 5A by affinity co-purification and differential display. Biochem. J. 384, 585–590.
Xu, J., Zhang, B., Jiang, C., and Ming, F. (2010). RceIF5A, encoding an eukaryotic translation initiation factor 5A in Rosa chinensis, can enhance thermotolerance, oxidative and osmotic stress resistance of Arabidopsis thaliana. Plant Mol. Biol. 75, 167–178.
Xu, Q., and Zhang, L. (2010). Plant caspase-like proteases in plant programmed cell death. Plant Signal. Behav. 4, 902–904.
Keywords: Arabidopsis thaliana, caspase-3 and caspase-6 like activities, eIF4B2, necrosis, programmed cell death, spontaneous necrotic spots
Citation: Gaussand GMDJ-M, Jia Q, van der Graaff E, Lamers GEM, Fransz PF, Hooykaas PJJ and de Pater S (2011) Programmed cell death in the leaves of the Arabidopsis spontaneous necrotic spots (sns-D) mutant correlates with increased expression of the eukaryotic translation initiation factor eIF4B2. Front. Plant Sci. 2:9. doi: 10.3389/fpls.2011.00009
Received: 08 February 2011; Paper pending published: 01 March 2011;
Accepted: 28 March 2011; Published online: 08 April 2011.
Edited by:
José R. Dinneny, Temasek Life Sciences Laboratory, SingaporeReviewed by:
Kirsten Bomblies, Harvard University, USAAnne Bagg Britt, University of California at Davis, USA
Copyright: © 2011 Gaussand, Jia, van der Graaff, Lamers, Fransz, Hooykaas and de Pater. This is an open-access article subject to a non-exclusive license between the authors and Frontiers Media SA, which permits use, distribution and reproduction in other forums, provided the original authors and source are credited and other Frontiers conditions are complied with.
*Correspondence: Sylvia de Pater, Sylvius Laboratory, Molecular and Developmental Genetics Department, Institute of Biology, Leiden University, Sylviusweg 72, 2333 BE Leiden, Netherlands. e-mail: b.s.de.pater@biology.leidenuniv.nl