Forest response and recovery following disturbance in upland forests of the Atlantic Coastal Plain

- Department of Biological Sciences, Rutgers University, Newark, NJ, USA
Stomatal conductance controls carbon and water fluxes in forest ecosystems. Therefore, its accurate characterization in land-surface flux models is necessary. Sap-flux scaled canopy conductance was used to evaluate the effect of drought, disturbance, and mortality of three oak species (Quercus prinus, Q. velutina, and Q. coccinea) in an upland oak/pine stand in the New Jersey Pine Barrens from 2005 to 2008. Canopy conductance (GC) was analyzed by performing boundary line analysis and selecting for the highest value under a given light condition. Regressing GC with the driving force vapor pressure deficit (VPD) resulted in reference canopy conductance at 1 kPa VPD (GCref). Predictably, drought in 2006 caused GCref to decline. Q. prinus GCref was least affected, followed by Q. coccinea, with Q. velutina having the highest reductions in GCref. A defoliation event in 2007 caused GCref to increase due to reduced leaf area and a possible increase in water availability. In Q. prinus, GCref quadrupled, while doubling in Q. velutina, and increasing by 50% in Q. coccinea. Tree mortality in 2008 led to higher GCref in the remaining Q. prinus but not in Q. velutina or Q. coccinea. Comparing light response curves of canopy conductance (GCref) and stomatal conductance (gS) derived from gas-exchange measurements showed marked differences in behavior. Canopy GCref failed to saturate under ambient light conditions whereas leaf-level gS saturated at 1,200 μmol m−2 s−1. The results presented here emphasize the differential responses of leaf and canopy-level conductance to saturating light conditions and the effects of various disturbances (drought, defoliation, and mortality) on the carbon and water balance of an oak-dominated forest.
Introduction
Interactions between climate change, forests, and disturbance events will undoubtedly change ecosystem dynamics and ecosystem function (Dale et al., 2000, 2001). As humans rely on forests for timber, fuel, water storage, and other ecosystem services, current understanding, and future predictions of disturbance events and their impact on forest ecosystem services are crucial. Some of the significant ecosystem services of forests are carbon (C) sequestration and water (H2O) flux regulation. Protecting these ecosystem services are pivotal for human existence, thus knowledge of their intricate interactions will help guide modeling as well as conservation efforts.
Forest disturbance such as insect outbreaks and fire are predicted to increase under global climate change due to an expansion or range shift of insects, higher survival rates of pest insect populations and increased fire proneness due to increased droughts (Ayres and Lombardero, 2000; Seidl et al., 2008; Jönsson et al., 2009; Régnière et al., 2009; Cudmore et al., 2010; Metsaranta et al., 2010). In addition, the impact of forest disturbance on ecosystem services such as timber extraction incurs economic costs (Seidl et al., 2008). The effect of forest disturbances on energy and gas-exchange may result in increased vulnerability to disturbance and further climate alteration, thus creating a positive feedback loop (Ayres and Lombardero, 2000; Heliasz et al., 2011). Reduced leaf area after defoliation events have been shown to decrease interception and thus increasing soil moisture and increasing soil temperature thereby potentially increasing soil respiration (Classen et al., 2005). These changes in the microclimate of forests will affect ecosystem scale processes. Forest carbon and water cycling are, therefore, intermediaries of these disturbance and climate events and, thus, need to be accurately characterized (Ayres and Lombardero, 2000).
Stomata are the gateway for carbon dioxide (CO2) and H2O exchange at the leaf-level, thus regulating not only the gas but also the energy exchange between the biosphere and the atmosphere. This exchange of energy and gas is likely to be altered not only under changing climate and elevated CO2 conditions, but also during disturbance events such as fire and herbivory. Stomata operate under the constraints of limiting water loss and preventing cavitation along the soil – plant – atmosphere continuum (Sperry et al., 1998). Based on these hydraulic considerations, stomata respond in a predictable manner to one of its primary driving forces, vapor pressure deficit (VPD, Oren et al., 1999b). However, under stress these responses may be altered, and therefore, are often ill-parameterized in models (Ball et al., 1987). It is well known that stomata close under drought conditions to prevent further water loss (Alder et al., 1996; Cochard et al., 1996; Sperry et al., 1998), but less is known about how stomata respond to disturbance. Some leaf-level investigations suggest an increase in photosynthesis after defoliation as a means to compensate for lost leaf area (VanderKlein and Reich, 1999; Wallin et al., 2003; Turnbull et al., 2007; Delaney, 2008; Gálvez and Tyree, 2009). However, the scaling of individual leaf responses to the entire canopy is rarely investigated.
An integrated approach to investigate canopy stomatal conductance (GC) responses with respect to disturbance and drought events is offered with sap-flux scaled canopy conductance (Oren et al., 1999a,b). This has the advantage of integrating across horizontal and vertical canopy strata, thus allowing a more generalized interpretation of forest canopy responses to environmental conditions and stress. It is conceivable that different disturbance regimes will have differential responses in stomatal conductance (gS) or GC. For example, a pine bark beetle infestation limits water supply thus mimicking drought stress, whereas a defoliator such as gypsy moth limits demand, thus leaving more water available to remaining leaves (Gálvez and Tyree, 2009). In the first instance, one would expect a reduction in gS or GC and, in the latter case, an increase. In addition, a reduction in leaf area due to defoliation will increase light transmission through the canopy potentially increasing GC without necessarily effecting individual leaf-level gS (Classen et al., 2005). Therefore, the objective of this study was to investigate the differential responses of gS and GC to environmental parameters such as light and VPD under varying stressor regimes including drought and defoliation. Variation in GC in three different oak species over a 4-year period were investigated including a baseline year (2005), a drought year (2006), a defoliation year (2007), and a recuperation year (2008) after the defoliation event.
Materials and Methods
Study Site
The study site was located in Central New Jersey, USA, in the New Jersey Pinelands also known as the New Jersey Pine Barrens (39.916825, −74.598045). The New Jersey Pine Barrens are the largest protected area in the state comprising more than 4,500 km2. The Pine Barrens Reserve is comprised of 80% forest, 10% non-forested areas, with the remainder made up of agricultural land, wetland, and water bodies (Luque, 2000). The forested area contains oak/pine, pine/oak, and pine forests. This study was conducted in an oak/pine forest at the Rutgers University Pinelands Research Station (Silas Little Experimental Forest) with a maximum canopy height of 18.8 m and a mean of about 8 m. The mean temperature from 2005 to 2008 was 12.2 ± 1.1ºC (SE) and mean monthly precipitation was 83.5 ± 6 mm (SE) with most precipitation occurring in spring and least at the end of summer. The soil is a nutrient-poor sand (>97%, Table 1) and characterized as a podzol (Rhodehamel, 1998). Soil sample analysis was performed at the soil testing lab of the University of Massachusetts, Amherst, USA.
TABLE 1
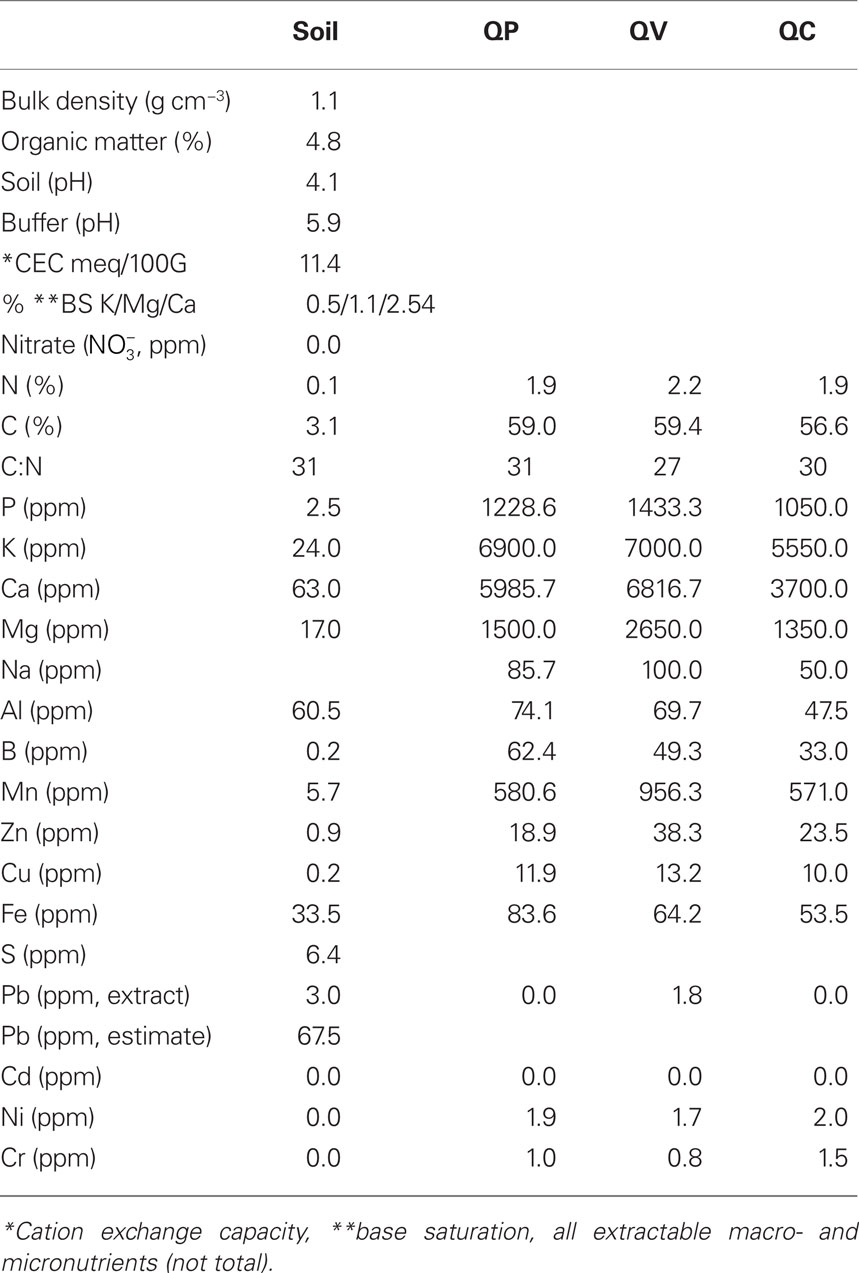
Table 1. Soil of the upper horizon and leaf characteristics of the site and species investigated, QP, Quercus prinus; QV, Q. velutina; QC, Q. coccinea.
Meteorological Data
Environmental data including air temperature (Tair), relative humidity (RH, HMP45C Vaisala Inc.), net radiation (Rn, NRLite, Kipp and Zonen, Inc.), photosynthetic photon flux density (PPFD, Li-190, LiCor Inc, Lincoln, NE, USA), and precipitation (P, TE525, Texas Electronics Inc, TX ) were measured from a 19-m weather tower every 10 s, and half-hourly averages were recorded in a data-logger (CR23X, Campbell Scientific, Inc, Logan, UT, USA). Soil moisture (Θ m3 m−3, CS616, Campbell Scientific, Inc, Logan, UT, USA) was only available in 2006. Tair and RH were used to calculate VPD. All meteorological data are available on the Ameriflux web site at http://public.ornl.gov/ameriflux/. Mean soil moisture condition in 2006 was 0.08 m3 m−3 but during the height of the drought Θ averaged 0.04 m3 m−3, which lasted for 2 weeks in August 2006.
Biometric Measurements
Details of the measurement setup and plot details are described in Schäfer et al. (2010). Briefly, diameters at breast height for trees and saplings >2.5 cm dbh were measured at the end of each year from which sapwood area per unit ground area (AS:AG) was derived. The measurement plot area was 0.3 ha. Sapwood area was estimated from a relationship of dbh to sapwood area measured via tree cores. Leaf area index (LAI) estimates were calculated from litter traps (Clark et al., 2010). Understory tree leaves (dbh < 2.5 cm) were also captured in the traps, but the overall water flux, and thus stomatal conductance, did not include their sapwood area. However, the overall reduction in GC due to the inclusion of small tree leaf areas would be rather small (Schäfer et al., 2010).
Leaf area dynamics during the defoliation event were captured using light detection and ranging (LiDAR; Skowronski et al., 2007), which captured the dynamics of the entire canopy and not individuals or individual species. This could potentially bias the GC calculations at the beginning and end of the season as well as the onset of the defoliation and during re-flushing. Therefore, data for analysis were selected outside of these transitional times in order to have a clearer response pattern with respect to pre- and post-defoliation. The total amount of leaf area for each plant functional group was determined by litter traps, thus reflecting the closest approximation to the leaf area re-flushed after defoliation.
Sap-Flux Measurements and Scaling to GC
Sap-flux was measured with Kucera-type sensors using the heat balance method (Čermák et al., 1973) inserted into the north side of the tree (Model P4.2, EMS Brno, CZ) in six mature individuals of Quercus prinus (chestnut oak), five Q. velutina (black oak), and seven Q. coccinea (scarlet oak). Kucera-type sensors consist of three heated and one non-heated sensor with an input of 0.5–2.4 W and the insertion depth of the sensors approximately equal to the sapwood depth. This eliminated the need for radial pattern adjustments (Phillips et al., 1996) or corrections for sensors located in non-conducting tissue (Clearwater et al., 1999). Measurements were recorded every 30 s and 30 min averages were stored in the system data-logger, which were then converted to sap-flux ( ) using system software (Mini32 version 4.1.5.0) programmed according to the instruction manual (May 2003, EMS Brno, CZ).
Sap-flux was scaled to stand transpiration (EC) by multiplying the mean sap-flux for each species (n = 5–7) by AS:AG of each tree species. It should be noted that dead trees are taken out of the analysis, thus the sample size slightly decreased in 2008 by two trees for Q. velutina and three trees for Q. coccinea. Transpiration per unit leaf area (EL) was calculated by dividing EC by LAI for each species. LAI dynamics were partially derived from litter traps and partially from LiDAR measurements, especially during the defoliation event in 2007 (Skowronski et al., 2007; Schäfer et al., 2010). Species-specific canopy conductance (GC) was calculated using EL divided by VPD (Eq. 1) with corrections for unit conversion (Köstner et al., 1992). Canopy conductance calculations are only valid when the canopy is well-coupled to the atmosphere and storage contributions are accounted for (Granier and Loustau, 1994). This canopy is well-coupled to the atmosphere and storage contributions were accounted for by lagging EL to VPD (Granier and Loustau, 1994).
Canopy conductance was calculated according to Köstner et al. (1992) as follows:

where GV (0.462 m3 kPa kg−1 K−1) is the universal gas constant adjusted for water vapor, Tair (in K) is Tair, σ is density of water in liquid form (998 kg m−3), and EL is canopy transpiration per unit leaf area (mmol m−2 s−1). In order to limit errors, canopy conductance was only calculated for VPD > 0.6 kPa (Ewers and Oren, 2000).
Gas-Exchange Measurements
In the summer of 2006, monthly gas-exchange measurements were performed on five individuals of each of the three oak study species at three different canopy-levels with a LiCOR 6400 (LiCOR inc, Lincoln, NE, USA; Schäfer et al., 2010). Stomatal conductance (gS) measurements were used to corroborate or refute observed patterns in calculated GC. Leaf gas-exchange measurements were comprised of light response (PPFD – gS) measurements and CO2 concentration response measurements to photosynthesis (Anet − Ci curves).
Analysis
The overall coefficient of variation of sap-flux within species varied between 38 and up to 220% depending on species, time of day and year, whereby early morning at the onset of transpiration, the highest variation occurred. The GC data of the three oak species were subjected to a boundary line analysis (Schäfer et al., 2000), separating them first into light levels of 250 μmol m−2 s−1 increments, and selecting all values above the mean plus 1 SE above the mean in each light bin. The selected values were subjected to a regression with the natural logarithm of VPD (Oren et al., 1999b). The resulting intercept and slope are the reference conductance at 1 kPa VPD (GCref) and the sensitivity to VPD (GCsens) for each light level respectively. This ensures (1) independent data, i.e., no autocorrelation, (2) best possible environmental conditions, and (3) similar conditions for comparison among different species and between different years. Regressions and statistical analysis were performed using Sigmaplot (version 11, Systat software Inc, Chicago, IL, USA). In order to analyze the effect before and after drought and disturbance GCref, a paired t-test of the three (n = 3) species for the highest light level was performed. Due to the small sample size a p value of = <0.1 was deemed significant for this analysis. For the leaf–level analysis however, sufficient samples (n = 15) were available to test for within and among species effect of drought in 2006.
Results
Effects of Drought on Leaf-Level Stomatal Conductance
Leaf-level stomatal conductance (gS) under saturating light conditions (1,500 μmol m−2 s−1) was significantly reduced by drought in Q. velutina (p = 0.004) and Q. coccinea (p < 0.001) but not in Q. prinus (p = 0.9, Figures 1A,B). In Q. velutina, maximum gS decreased from 180 mmol m−2 s−1 before the drought to 90 mmol m−2 s−1 during the drought. In Q. coccinea, gS decreased from 180 to 80 mmol m−2 s−1 and in Q. prinus, gS remained constant at about 110 mmol m−2 s−1. There were no differences between the various canopy layers in each species either before or during the drought (data not shown).
FIGURE 1
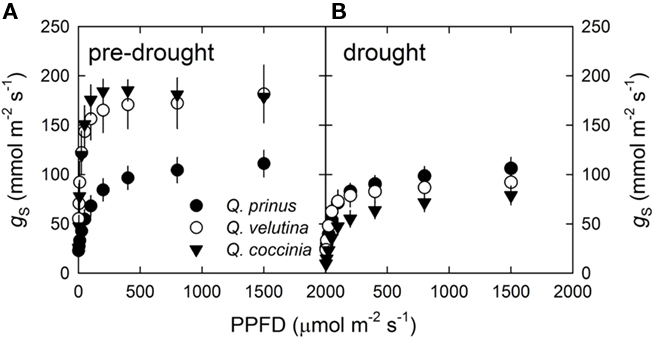
Figure 1. Stomatal conductance (gS) to light (PPFD) response curves measured with the LiCOR 6400 for Quercus prinus (filled circle), Q. velutina (open circle), and Q coccinea (filled triangle) (A) before the onset of drought in June 2006 and (B) during drought in August of 2006. Error bars are the SE around the mean.
Effects of Drought on Canopy Stomatal Conductance
Unlike the leaf-level gS–PPFD curves, canopy-level stomatal conductance (GCref) did not saturate at any measured PPFD level during the pre-drought period in any of the oak species (Figure 2A). However, during the drought, all three oak species failed to respond to increasing light levels (Figure 2B). Likewise, GCref at the highest measured light levels (PPFD > 1,500 μmol m−2 s−1) was significantly different before and during the drought in all three oak species (p = 0.09, Student’s pair-wise comparison; Figure 2). Drought conditions reduced GCref at maximum light conditions from 120 to 35 mmol m−2 s−1 in Q. velutina, from 70 to 40 mmol m−2 s−1 in Q. coccinea and from 70 to 30 mmol m−2 s−1 in Q. prinus.
FIGURE 2
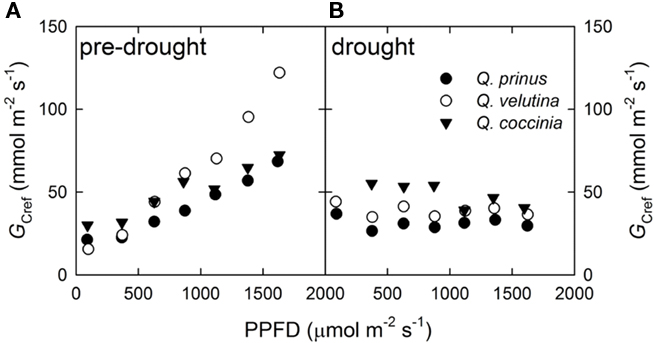
Figure 2. Reference canopy stomatal conductance (GCref) with respect to light (PPFD) (A) pre-drought and (B) during drought. Quercus prinus (filled circle), Q. velutina (open circle), and Q coccinea (filled triangle).
GCref Following Disturbance and Death
In 2008 after the previous year’s gypsy moth (Lymantria dispar L.) defoliation, only 73% of the canopy trees leafed out (dbh > 2.5 cm), indicating 27% mortality after the defoliation (Figure 3). The mortality was unevenly distributed among species, with 59% of Q. coccinea dead, 53% of Q. velutina and only 17% of Q. prinus dead within the measurement plot. The dbh classes of dead trees were evenly distributed indicating no preferential losses among a particular dbh class (Figure 3).
FIGURE 3
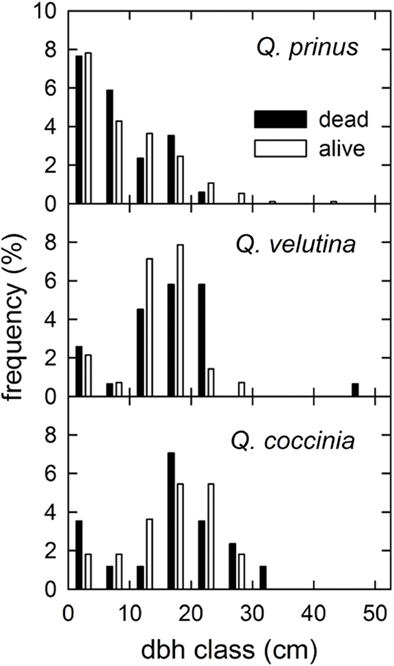
Figure 3. Percentage of trees of each species within the measurement plot alive (white bars) and dead (black bars) in 2008 after the previous year’s gypsy moth defoliation for each diameter in breast height (dbh) class.
Comparing the light response of GCref in a pre-defoliation year (2005) vs. a post-defoliation year (2008), shows that GCref at maximum light conditions increased in Q. prinus from 100 to 130 mmol m−2 s−1, remained constant in Q. velutina at about 130 mmol m−2 s−1, and decreased in Q. coccinea from 120 to 90 mmol m−2 s−1 (Figure 4). Likewise, all species showed a linear increase in GCref with increasing light signaling a lack of saturation on a canopy-level in either year (similar to the 2006 pre-drought data).
FIGURE 4
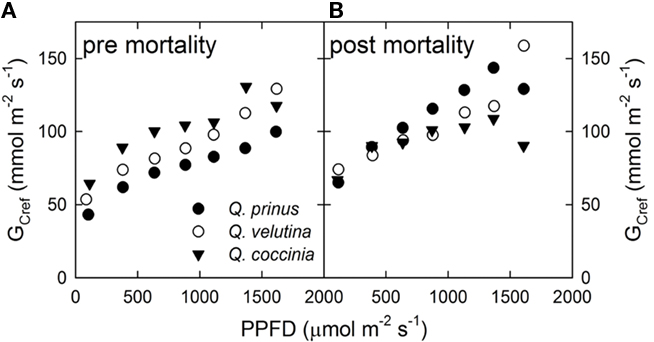
Figure 4. Reference canopy stomatal conductance (GCref) vs. light (PPFD) response (A) before drought and disturbance in 2005 and (B) after mortality occurred in 2008. Quercus prinus (filled circle), Q. velutina (open circle), and Q coccinea (filled triangle).
An overall comparison of GCref for all three oak species for the years 2005–2008 under “saturating” light conditions is presented in Figure 5. The error bars represent the average of light conditions greater than 1,200 μmol m−2 s−1 based on saturating light conditions for leaf-level gS. As predicted, GCref declined under drought and increased after defoliation (Figure 5). In 2008, GCref increased for Q. prinus, but declined for Q. velutina and Q. coccinea after mortality occurred in this forest (Figure 5). As LAI was determined by litter traps, no bias is introduced in calculating GC. However, due to the mortality, a bias is introduced due to the changed sample size and thus mean sap-flux.
FIGURE 5
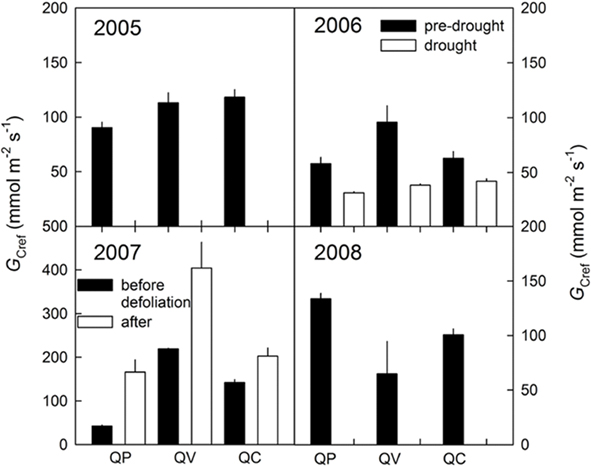
Figure 5. Reference canopy stomatal conductance (GCref) under non-limiting light conditions for all years investigated (2005–2008). In 2006, the black bars denote before, the white bars during drought and in 2007, the black bars denote before, and the white bars after the defoliation event. QP, Quercus prinus; QV, Q. velutina; QC, Q. coccinea.
Discussion
Comparison of Canopy and Leaf-Level Stomatal Responses
There are only a limited number of studies on canopy stomatal responses under conditions of actual defoliation by insect outbreaks (Ewers et al., 2007). Therefore, comparison of these data with existing literature is limited to gas-exchange measurements made on the leaf-level or simulated defoliation conditions. As was shown here, responses of conductance to light may differ between leaf-level and canopy-level. Overall canopy stomatal responses are spatially integrated, and therefore, do not necessarily reflect responses on the leaf-level. In a study on Liquidambar styraciflua under elevated CO2, Wullschleger et al. (2002) found that GC was reduced less than gS under elevated CO2 compared to ambient CO2. However, earlier investigations have shown good matches between sap flow and leaf gas-exchange measurements (Schulze et al., 1985). The overall response of Q. velutina and Q. coccinea on the leaf-level matched qualitatively with canopy-level responses showing decreased conductance during drought in both instances. However, this was not the case for Q. prinus (compare Figures 1 and 2) where under conditions of drought, GCref was reduced under high PPFD levels but not gS. As was already mentioned by Wullschleger et al. (2002) the integration of space on the canopy-level dampens leaf-level responses. Therefore, depending on the questions and scope of the investigation, the appropriate scale needs to be applied. For land-surface flux models, the canopy-level responses investigated here may be more informative for disturbance and drought events than leaf-level responses.
Responses of GC Following Drought
Under drought, GCref displayed a lack of response to an increase in light, emphasizing the extremely water-limited environment of the New Jersey Pine Barrens (Figure 2B). This indicates strong stomatal control to limit water loss and prevent hydraulic failure, which is particularly sensitive in ring-porous species (Sperry et al., 1993, 1998, 2008). Despite soil water-limiting conditions, this forest stand still shows moderate productivity (Clark et al., 2010; Schäfer et al., 2010) and does not seem to be impaired by nitrogen limitation (Table 1). A soil moisture limitation may also explain the increase in GCref after mortality, as the available soil moisture is used by 30% fewer trees. Schäfer et al. (2010) found that the reduction in canopy assimilation was almost as pronounced during a drought year as a defoliation year compared to a year with no drought and disturbance, emphasizing the severity of water limitations in this ecosystem. It should be noted that Q. velutina and Q. coccinea suffered more under drought conditions than Q. prinus, which may also explain the differential recovery responses after defoliation (see below).
Responses of GC Following Disturbance
A quadrupling or doubling in GCref after defoliation as was shown here for Q. prinus and Q. velutina, was also observed for gS in Populus tremuloides in a simulated defoliation experiment (Gálvez and Tyree, 2009). Thus, trees compensate for leaf area losses and reduced CO2 uptake by capitalizing on higher water availability for the remaining leaves. Likewise, Pataki et al. (1998) showed an increase in GC proportional to the reduction in leaf area caused by cutting, simulating a defoliation event. Thus, stomata compensated for leaf area losses by increasing conductance to water vapor possibly in order to maintain positive carbon balance. However, Cunningham et al. (2009) found that tree sap flow was strongly reduced by leaf herbivory proportional to the leaf area losses. Assuming comparable atmospheric conditions, this would yield a reduction in GC proportional to the leaf area losses. Increased GCref following defoliation suggests that the overall sap flow remained stable or may have slightly increased, therefore, decreased canopy leaf area would yield higher GC. It should again be noted that species-specific leaf area was not directly assessed and an error may have been introduced in GC calculations. However, overall leaf area was estimated using litter traps, thus the overall trajectory of GC changes are qualitatively correct.
Conclusion
The differential responses of GCref of the three oak species investigated here, has implications to overall water balance of forests. While Q. prinus recuperated and capitalized on available water, Q. coccinea and Q. velutina were not able to take advantage. Thus, it is conceivable that Q. prinus will potentially outcompete the other two oak species under disturbance regime. Recovery may take 5–15 years in order for CO2 and H2O fluxes to resume to pre-disturbance levels (Amiro et al., 2010; Metsaranta et al., 2010). In a study on Tamarisks (Tamarix spp), Hultine et al. (2010) found that water savings occur after repeated defoliation events, but whether this will translate into more stream water or groundwater recharge is unclear. As the Pine Barrens of New Jersey and the Kirkwood-Cohansey aquifer beneath it are a vital water resource to New Jersey residents, the effect of defoliation and tree mortality on groundwater recharge will require further investigation. Thus, changes in GC will have consequences to the overall water loss and carbon dioxide uptake in forests under disturbance (Amiro et al., 2010; Hultine et al., 2010; Metsaranta et al., 2010). Reduced leaf area will also cause increased light availability to the understory and forest floor, thus enhancing temperature and soil respiration fluxes. Consequently, the overall H2O and CO2 budget of the entire forest ecosystem will depend on the changed microenvironment, speed of recovery of canopy foliage and species composition.
Conflict of Interest Statement
The author declares that the research was conducted in the absence of any commercial or financial relationships that could be construed as a potential conflict of interest.
Acknowledgments
The author would like to thank Drs H. Renninger and D. Vanderklein for comments and edits on the manuscript. This research was in part funded by Rutgers University Newark to the author and USDA joint venture agreement 10-JV-11242306-136.
References
Alder, N. N., Sperry, J. S., and Pockman, W. T. (1996). Root and stem xylem embolism, stomatal conductance, and leaf turgor in Acer grandidentatum populations along a soil moisture gradient. Oecologia 105, 293–301.
Amiro, B. D., Barr, A. G., Barr, J. G., Black, T. A., Bracho, R., Brown, M., Chen, J., Clark, K. L., Davis, K. J., Desai, A. R., Dore, S., Engel, V., Fuentes, J. D., Goldstein, A. H., Goulden, M. L., Kolb, T. E., Lavigne, M. B., Law, B. E., Margolis, H. A., Martin, T., McCaughey, J. H., Misson, L., Montes-Helu, M., Noormets, A., Randerson, J. T., Starr, G., and Xiao, J. (2010). Ecosystem carbon dioxide fluxes after disturbance in forests of North America. J. Geophys. Res. 115, G00K02.
Ayres, M. P., and Lombardero, M. J. (2000). Assessing the consequences of global change for forest disturbance from herbivores and pathogens. Sci. Total Environ. 262, 263–286.
Ball, J. T., Woodrow, I., and Berry, J. A. (1987). A model predicting stomatal conductance and its contribution to the control of photosynthesis under different environmental conditions. Prog. Photosynth. Res. 4, 221–224.
Čermák, J., Deml, M., and Penka, M. (1973). A new method of sap flow rate determination in trees. Biol. Plant. 15, 171–178.
Clark, K. L., Skowronski, N., and Hom, J. (2010). Invasive insects impact forest carbon dynamics. Glob. Change Biol. 16, 88–101.
Classen, A. T., Hart, S. C., Whitham, T. G., Cobb, N. S., and Koch, G. W. (2005). Insect infestations linked to shifts in microclimate: important climate change implications. Soil Sci. Soc. Am. J. 69, 2049–2057.
Clearwater, M. J., Meinzer, F. C., Andrade, J. L., Goldstein, G., and Holbrook, N. M. (1999). Potential errors in measurement of nonuniform sap flow using heat dissipation probes. Tree Physiol. 19, 681–687.
Cochard, H., Breda, N., and Granier, A. (1996). Whole tree hydraulic conductance and water loss regulation in Quercus during drought: evidence for stomatal control of embolism? Ann. For. Sci. 53, 197–206.
Cudmore, T. J., Björklund, N., Carroll, A. L., and Staffan Lindgren, B. (2010). Climate change and range expansion of an aggressive bark beetle: evidence of higher beetle reproduction in naïve host tree populations. J. Appl. Ecol. 47, 1036–1043.
Cunningham, S., Pullen, K., and Colloff, M. (2009). Whole-tree sap flow is substantially diminished by leaf herbivory. Oecologia 158, 633–640.
Dale, V. H., Joyce, L. A., McNulty, S., and Neilson, R. P. (2000). The interplay between climate change, forests, and disturbances. Sci. Total Environ. 262, 201–204.
Dale, V. H., Joyce, L. A., McNulty, S., Neilson, R. P., Ayres, M. P., Flannigan, M. D., Hanson, P. J., Irland, L. C., Lugo, A. E., Peterson, C. J., Simberloff, D., Swanson, F. J., Stocks, B. J., and Michael Wotton, B. (2001). Climate change and forest disturbances. Bioscience 51, 723–734.
Delaney, K. (2008). Injured and uninjured leaf photosynthetic responses after mechanical injury on Nerium oleander leaves, and Danaus plexippus herbivory on Asclepias curassavica leaves. Plant Ecol. 199, 187–200.
Ewers, B. E., Mackay, D. S., and Samanta, S. (2007). Interannual consistency in canopy stomatal conductance control of leaf water potential across seven tree species. Tree Physiol. 27, 11–24.
Ewers, B. E., and Oren, R. (2000). Analyses of assumptions and errors in the calculation of stomatal conductance from sap flux measurements. Tree Physiol. 20, 579–589.
Gálvez, D., and Tyree, M. (2009). Impact of simulated herbivory on water relations of aspen (Populus tremuloides) seedlings: the role of new tissue in the hydraulic conductivity recovery cycle. Oecologia 161, 665–671.
Granier, A., and Loustau, D. (1994). Measuring and modeling the transpiration of a maritime pine canopy from sap-flow data. Agric. For. Meteorol. 71, 61–81.
Heliasz, M., Johansson, T., Lindroth, A., Mölder, M., Mastepanov, M., Friborg, T., Callaghan, T. V., and Christensen, T. R. (2011). Quantification of C uptake in subarctic birch forest after setback by an extreme insect outbreak. Geophys. Res. Lett. 38, L01704.
Hultine, K. R., Nagler, P. L., Morino, K., Bush, S. E., Burtch, K. G., Dennison, P. E., Glenn, E. P., and Ehleringer, J. R. (2010). Sap flux-scaled transpiration by tamarisk (Tamarix spp.) before, during and after episodic defoliation by the saltcedar leaf beetle (Diorhabda carinulata). Agric. For. Meteorol. 150, 1467–1475.
Jönsson, A. M., Appelberg, G., Harding, S., and Barring, L. (2009). Spatio-temporal impact of climate change on the activity and voltinism of the spruce bark beetle, Ips typographus. Glob. Change Biol. 15, 486–499.
Köstner, B. M. M., Schulze, E. D., Kelliher, F. M., Hollinger, D. Y., Byers, J. N., Hunt, J. E., McSeveny, T. M., Meserth, R., and Weir, P. L. (1992). Transpiration and canopy conductance in a pristine broad-leaved forest of Nothofagus – an analysis of xylem sap flow and eddy-correlation measurements. Oecologia 91, 350–359.
Luque, S. S. (2000). The challenge to manage the biological integrity of nature reserves: a landscape ecology perspective. Int. J. Remote Sens. 21, 2613–2643.
Metsaranta, J. M., Kurz, W. A., Neilson, E. T., and Stinson, G. (2010). Implications of future disturbance regimes on the carbon balance of Canada’s managed forest (2010–2100). Tellus B Chem. Phys. Meteorol. 62, 719–728.
Oren, R., Phillips, N., Ewers, B. E., Pataki, D. E., and Megonigal, J. P. (1999a). Sap-flux-scaled transpiration responses to light, vapor pressure deficit, and leaf area reduction in a flooded Taxodium distichum forest. Tree Physiol. 19, 337–347.
Oren, R., Sperry, J. S., Katul, G. G., Pataki, D. E., Ewers, B. E., Phillips, N., and Schafer, K. V. R. (1999b). Survey and synthesis of intra- and interspecific variation in stomatal sensitivity to vapour pressure deficit. Plant Cell Environ. 22, 1515–1526.
Pataki, D. E., Oren, R., and Phillips, N. (1998). Responses of sap flux and stomatal conductance of Pinus taeda L. trees to stepwise reductions in leaf area. J. Exp. Bot. 49, 871–878.
Phillips, N., Oren, R., and Zimmermann, R. (1996). Radial patterns of xylem sap flow in non-, diffuse- and ring-porous tree species. Plant Cell Environ. 19, 983–990.
Régnière, J., Nealis, V., and Porter, K. (2009). Climate suitability and management of the gypsy moth invasion into Canada. Biol. Invasions 11, 135–148.
Rhodehamel, E. (1998). “Geology of the pine barrens of New Jersey,” in Pine Barrens: Ecosystem and Landscape, ed. R. Forman (New Brunswick, NJ: Rutgers University Press), 601.
Schäfer, K. V. R., Clark, K. L., Skowronski, N., and Hamerlynck, E. P. (2010). Impact of insect defoliation on forest carbon balance as assessed with a canopy assimilation model. Glob. Change Biol. 16, 546–560.
Schäfer, K. V. R., Oren, R., and Tenhunen, J. D. (2000). The effect of tree height on crown level stomatal conductance. Plant Cell Environ. 23, 365–375.
Schulze, E. D., Cermák, J., Matyssek, M., Penka, M., Zimmermann, R., Vasícek, F., Gries, W., and Kucera, J. (1985). Canopy transpiration and water fluxes in the xylem of the trunk of Larix and Picea trees – a comparison of xylem flow, porometer and cuvette measurements. Oecologia 66, 475–483.
Seidl, R., Rammer, W., Ger, D., and Lexer, M. J. (2008). Impact of bark beetle (Ips typographus L.) disturbance on timber production and carbon sequestration in different management strategies under climate change. Kidlington: Elsevier.
Skowronski, N., Clark, K., Nelson, R., Hom, J., and Patterson, M. (2007). Remotely sensed measurements of forest structure and fuel loads in the Pinelands of New Jersey. Remote Sens. Environ. 108, 123–129.
Sperry, J. S., Adler, F. R., Campbell, G. S., and Comstock, J. P. (1998). Limitation of plant water use by rhizosphere and xylem conductance: results from a model. Plant Cell Environ. 21, 347–359.
Sperry, J. S., Alder, N. N., and Eastlack, S. E. (1993). The effect of reduced hydraulic conductance on stomatal conductance and xylem cavitation. J. Exp. Bot. 44, 1075–1082.
Sperry, J. S., Meinzer, F. C., and McCulloh, K. A. (2008). Safety and efficiency conflicts in hydraulic architecture: scaling from tissues to trees. Plant Cell Environ. 31, 632–695.
Turnbull, T. L., Adams, M. A., and Warren, C. R. (2007). Increased photosynthesis following partial defoliation of field-grown Eucalyptus globulus seedlings is not caused by increased leaf nitrogen. Tree Physiol. 27, 1481–1492.
VanderKlein, D. W., and Reich, P. B. (1999). The effect of defoliation intensity and history on photosynthesis, growth and carbon reserves of two conifers with contrasting leaf lifespans and growth habits. New Phytol. 144, 121–132.
Wallin, K. F., Kolb, T. E., Skov, K. R., and Wagner, M. R. (2003). Effects of crown scorch on Ponderosa pine resistance to bark beetles in Northern Arizona. Environ. Entomol. 32, 652–661.
Keywords: defoliation, sap-flux, vapor pressure deficit, light, New Jersey Pine Barrens
Citation: Schäfer KVR (2011) Canopy stomatal conductance following drought, disturbance, and death in an upland oak/pine forest of the New Jersey Pine Barrens, USA. Front. Plant Sci. 2:15. doi: 10.3389/fpls.2011.00015
Received: 16 March 2011; Accepted: 03 May 2011;
Published online: 20 May 2011.
Edited by:
Ülo Niinemets, Estonian University of Life Sciences, EstoniaReviewed by:
Javier Vázquez-Piqué, University of Huelva, SpainKevin Simonin, University of Sydney, Australia
Copyright: © 2011 Schäfer. This is an open-access article subject to a non-exclusive license between the authors and Frontiers Media SA, which permits use, distribution and reproduction in other forums, provided the original authors and source are credited and other Frontiers conditions are complied with.
*Correspondence: Karina Vera Rosa Schäfer, Department of Biological Sciences, Rutgers University, 195 University Avenue, Newark, NJ 07102, USA. e-mail: karinavr@andromeda.rutgers.edu