Elucidating gene function and function evolution through comparison of co-expression networks of plants

- 1 Independent Research Group, Max-Planck-Institute of Molecular Plant Physiology, Potsdam, Germany
- 2 Department of Biomaterials, Max-Planck-Institute of Colloids and Interfaces, Potsdam, Germany
- 3 Institute of Biochemistry and Biology, University of Potsdam, Potsdam, Germany
Plant cell walls are complex composites largely consisting of carbohydrate-based polymers, and are generally divided into primary and secondary walls based on content and characteristics. Cellulose microfibrils constitute a major component of both primary and secondary cell walls and are synthesized at the plasma membrane by cellulose synthase (CESA) complexes. Several studies in Arabidopsis have demonstrated the power of co-expression analyses to identify new genes associated with secondary wall cellulose biosynthesis. However, across-species comparative co-expression analyses remain largely unexplored. Here, we compared co-expressed gene vicinity networks of primary and secondary wall CESAsin Arabidopsis, barley, rice, poplar, soybean, Medicago, and wheat, and identified gene families that are consistently co-regulated with cellulose biosynthesis. In addition to the expected polysaccharide acting enzymes, we also found many gene families associated with cytoskeleton, signaling, transcriptional regulation, oxidation, and protein degradation. Based on these analyses, we selected and biochemically analyzed T-DNA insertion lines corresponding to approximately twenty genes from gene families that re-occur in the co-expressed gene vicinity networks of secondary wall CESAs across the seven species. We developed a statistical pipeline using principal component analysis and optimal clustering based on silhouette width to analyze sugar profiles. One of the mutants, corresponding to a pinoresinol reductase gene, displayed disturbed xylem morphology and held lower levels of lignin molecules. We propose that this type of large-scale co-expression approach, coupled with statistical analysis of the cell wall contents, will be useful to facilitate rapid knowledge transfer across plant species.
Introduction
Plant cell walls constitute a cellular exoskeleton that molds the cell shape and protects the cell against environmental threats (Somerville et al., 2004; Liepman et al., 2010). The cell wall mainly holds carbohydrate-based polymers, such as cellulose, hemicelluloses, and pectins, but also polyphenolic macromolecules, or lignins, and various highly glycosylated proteins. Historically, cell walls have been divided into primary and secondary walls, largely depending on the wall function and on the structural contents (Carpita and McCann, 2000). While the primary wall in most higher plants holds cellulose, hemicelluloses, and pectins, the secondary wall is mainly composed of cellulose, xylans, and lignin.
The carbohydrate-based cell wall components are, with the exception of cellulose, synthesized as oligomeric structures in the Golgi, and are subsequently transported to the cell surface where they are incorporated into the growing cell wall matrix (Geisler et al., 2008). In essence, these oligomers are assembled by different glycosyltransferases, perhaps working as larger protein complexes during synthesis (Lerouxel et al., 2006; Scheller and Ulvskov, 2010). Cellulose, on the other hand, is synthesized at the plasma membrane by large cellulose synthase (CESA) complexes (Somerville, 2006; Mutwil et al., 2008a; Taylor, 2008). These complexes consist of three different, yet structurally related, CESA proteins. Consequently, the CESA-complex that is active during secondary wall formation consists of the three CESA proteins CESA 4, 7, and 8 (Turner and Somerville, 1997; Taylor et al., 2000), and the primary wall complex of CESA 1, 3, and 6-related CESA proteins (Arioli et al., 1998; Desprez et al., 2007; Persson et al., 2007a). At least the primary wall complexes are assumed to be guided by microtubules at the cell cortex (Paredez et al., 2006); however, the mechanism of this process still remains unclear. The absolute need for the three CESA proteins for a functional CESA-complex suggests that the corresponding genes may exhibit similar spatiotemporal expression. Indeed, large-scale co-expression analyses have confirmed such behavior (Brown et al., 2005; Persson et al., 2005). In addition, it was also shown that the three CESA genes, either the primary or secondary wall CESAs, could readily be used as baits to find other co-expressed genes associated with cell wall production. These studies revealed that several crucial genes for xylan and lignin synthesis were transcriptionally coordinated with the secondary wall CESAs (Brown et al., 2005; Persson et al., 2005). More recently, similar approaches have also been utilized for genes involved in the synthesis of the primary wall hemicellulose xyloglucan (Cocuron et al., 2007). This study showed that the CSLC4 gene in Arabidopsis, which is presumed to make the glucan backbone for the xyloglucan, was co-expressed with other genes that are associated with xyloglucan synthesis. Furthermore, a broader analysis of transcriptional coordination of cell wall-related genes in Arabidopsis revealed that members of some gene families tend to be co-expressed, e.g., different GH19 family members tend to be co-expressed with different CESA members (Mutwil et al., 2009).
To our knowledge, the possibilities of comparative co-expression analysis across species remain largely unexplored, with the exception of a recent study that explored similarities in co-expression networks between Arabidopsis and rice for xylan synthesis-related genes (Oikawa et al., 2010). By using PlaNet (Mutwil et al., 2011), we performed large-scale condition-independent comparisons (Mutwil et al., 2008b; Usadel et al., 2009) of primary and secondary cell wall-related CESA co-expression networks from seven different plant species to discover gene families that are consistently transcriptionally coordinated with cellulose synthesis across species. To identify new genes involved in secondary cell wall formation in Arabidopsis, we selected genes from gene families that are conserved in the co-expression networks of the secondary CESAs across the seven species and analyzed their mutant lines. We established a statistical pipeline based on biochemical characteristics of the cell wall and show that at least one of the analyzed mutants is deficient in the secondary wall-related polymer lignin.
Materials and Methods
Comparative Co-Expression Analysis
The respective primary and secondary CESA genes for Arabidopsis (253428_at, at4g32410, AtCESA1, and 246425_at, at5g17420, AtCESA7), poplar (PtpAffx.23691.1.S1_at, PtCESA1, and Ptp.3087.1.S1_at, PtCESA7), rice (Os.10183.1.S2_at, Os05g08370, OsCESA1, and Os.10206.1.S1_at, Os09g25490, OsCESA9), barley (Contig3478_at, aaf89964.1, HvCESA1, and Contig15116_at, bab67900.1, HvCESA5/7), medicago (Mtr.14653.1.S1_s_at, Medtr3g136720/Medtr7g099810, and Mtr.10615.1.S1_at, Medtr8g145000), soybean (Gma.10862.2.S1_x_at, Glyma04g07220, and GmaAffx.3712.1.S1_a, Glyma06g30860.1), and wheat (Ta.28561.1.S1_a, UniRef90_A2Y0X2, and Ta.4321.1.A1_at, UniRef90_A2WV32) were analyzed using the Network Comparer tool from PlaNet (http://aranet.mpimp-golm.mpg.de/aranet/NetworkComparer), which is based on the AraGenNet co-expression analysis platform (Mutwil et al., 2010). The tool classifies genes according to their PFAM (Protein family, Finn et al., 2010) annotation and compares gene vicinity networks two steps away (N = 2; Mutwil et al., 2010) from the query genes for re-occurring PFAMs.
Plant Material and Growth Conditions
Seeds for all plant-lines used in this study were obtained from the Nottingham Arabidopsis Stock Centre (NASC, http://arabidopsis.info). Mutants used for the neutral sugar analysis were all in Col-0 background. Homozygous mutants were obtained by genotyping using the T-DNA line specific primers and the respective left border primer of the T-DNA listed in supplementary Table S3 in Supplementary Material. Seedlings were first grown on MS medium containing 1% sucrose for 2 weeks. Then, plants were transferred to standard soil (Einheitserde GS90; Gebrüder Patzer, Sinntal-Jossa, Germany) and grown in a greenhouse under a 16 h light/8 h dark regime at temperatures 21°C (day) and 17°C (night).
Biochemical Cell Wall Analyses
For neutral sugar analysis, stems of more than ten different individual 9-week-old plants were pooled per sample and then ground in liquid nitrogen. The three replicates obtained from this plant material were then consecutively washed with 10 ml 70% ethanol, 10 ml methanol:chloroform (1:1, v:v) and 10 ml acetone. The resulting crude cell wall material was air-dried for 2 days. To extract the different cell wall components the material was fractionated. First, pectins were extracted by adding 1.5 ml CDTA (1,2-Diaminocyclohexane tetraacetic acid) and shaking the samples for 12 h at 4°C. After centrifugation for 5 min at 13000 rpm, the supernatant was transferred into a fresh 15 ml Falcon tube. This extraction was repeated twice and the pooled supernatants were dialysed using Spectra/Por dialysis tubes (MWCO: 3.5 kDa, Spectrum Laboratories, Rancho Dominguez, CA, USA) for 3 days at 4°C in double distilled water, which was exchanged every 12 h. With the resulting pellet, this whole procedure was repeated with Na2CO3 and then 4 M KOH. The remaining material after these three extractions was the insoluble fraction. All four fractions were dried in an Alpha 2–4 lyophilisator (Christ, Osterode, Germany). For the analysis of the neutral sugar composition, 1 mg cell wall material was transferred to screw-capped eppendorf tubes and 30 μg inositol was added as internal standard. After hydrolysis with 2 M trifluoroacetic acid (TFA), alditol acetates were analyzed as described in Neumetzler (2010), which is a modified version of the original protocol from Albersheim et al. (1967). Detection was performed with an Agilent 6890N GC System coupled with an Agilent 5973N Mass Selective Detector (Waldbronn, Germany). For analysis of cellulose in the crude cell wall material, Seaman hydrolysis (Selvendran et al., 1979) was performed of the pellet after trifluoroacetic acid hydrolysis. After this, the hexose content was determined with the anthrone assay described in Dische (1962).
Microscopic Analyses of Xylem Vessels
To determine the thickness of the cell wall in xylem cells, 0.5 cm long segments from the base of the main stem were fixed in a mixture of 2% paraformaldehyde and 2.5% glutaraldehyde on cacodylate buffer, pH 7.4 for 4 h at room temperature. The samples were then fixed with 2% OsO4 on the same buffer for 2 h, dehydrated in series of ethanol and propylene oxide and finally embedded in Spurr’s low viscosity epoxy resin (Spurr, 1969). The embedded stem segments were cut perpendicular to their longitudinal axes. Afterward, the surfaces of the created cross sections were diamond-polished down to 1 μm. The samples were then coated with a 5 nm gold–palladium layer and observed in a Jeol JSM-7500F field emission scanning electron microscope with an acceleration voltage of 5 kV using a secondary electron in-lens detector. The obtained images were analyzed using ImageJ (Rasband, 1997) by measuring the thickness of the cell wall in the middle of the edge of adjacent cells. For analysis of the disturbed xylem phenotype, 0.5 cm long pieces from the basal part of the main stem were embedded in paraffin as previously described (Weigel and Glazebrook, 2002) using an ASP300S embedding automat (Leica, Wetzlar, Germany). Then, 10 μm thin sections were prepared with a RM2265 rotary microtome (Leica, Wetzlar, Germany). Phoroglucinol-HCl staining was performed directly on the slides. Observations of the xylem cells were made with a BX61 (Olympus, Hamburg, Germany) microscope using a 20× objective. Imaging was carried out with a ColorView III digital camera (Olympus, Hamburg, Germany) controlled with the cell^P software from Olympus. Images were processed for publication using Adobe Photoshop CS2 (Adobe, Dublin, Ireland).
Lignin Measurements
The amount of lignins in selected mutants was analyzed with the thioglycolic-acid (TGA) assay as previously described (Campbell and Ellis, 1992). However, here, 2 mg of dry crude cell wall material was used and directly incubated with 750 μl water, 250 μl concentrated HCl, and 100 μl TGA.
Data Preprocessing
Seven data sets, each with three replicates, from 18 plant-lines were considered in the analysis. The first five data sets correspond to the mol percentage values for the crude cell wall material and the four different fractions for each of the following sugars: Rhamnose (Rha), Fucose (Fuc), Arabinose (Ara), Xylose (Xyl), Mannose (Man), Galactose (Gal), and Glucose (Glc). The sixth dataset comprises the weight percentage values for each of the following four fractions: CDTA, Na2CO3, KOH, and insoluble. Since different amounts of sugars could be hydrolyzed from each fraction, the dry weight percentages of the material extracted by the fractionation were normalized according to the total amount of sugars that could be measured on the GC–MS for that fraction. Finally, the last data set integrates the mol percentage values for the seven sugars of the four fractions (CDTA, Na2CO3, KOH, and insoluble) by normalizing each of them to the weight percentage values from the sixth dataset. Note that the values for Fuc and Ara in the insoluble fraction were not considered in the analysis (as they were below detection limit across all considered variables, i.e., plants). Each data set was represented by a matrix with rows corresponding to the mutants and the columns corresponding to the fractions/sugars, such that a row defines a profile of a mutant. Clustering and principal component analysis (PCA) were then performed on the mean percentage values from the three replicates, which were row-wise normalized (centered) to zero mean and unit variance.
Clustering
We applied the k-medoid clustering method, which is a more robust version of k-means (Theodoridis and Koutroumbas, 2006). We used the Euclidean distance as a similarity measure for mutant profiles. To determine the number of clusters k, we employed the silhouette validation method (Rousseeuw, 1987). For each mutant i, the silhouette width, s(i), is defined as follows: Let a(i) denote the average dissimilarity between i and all other mutants placed in the same cluster as mutant i. Let b(i) denote the smallest average dissimilarity of mutant i compared to the mutants in another cluster. Then
If s(i) is close to 1, it means that the mutant has been assigned an appropriate cluster. A value of 0 for s(i) implies that the mutant lies between clusters, while a value of −1 signifies misclassification. Using this method, each cluster could be represented by the average silhouette width of the mutants in the cluster. For a clustering with k clusters, one can then calculate the overall average of the silhouette widths of the k clusters. Larger overall average silhouette width indicates better clustering; therefore, the number of clusters with maximum overall average silhouette width was taken as the optimal number of clusters. The R programming package cluster was used to determine the optimal number of clusters with which k-medoid clustering was subsequently conducted.
PCA and Biplots
Principal component analysis is a standard technique for data reduction, from which useful summary biplots can be created. Each biplot allows a two-dimensional representation of the mutants based on their scores from the first two principle components (PCs). We combined the biplot with the clustering results from the k-medoids, by including ellipses around each cluster. The loadings for the variables (fractions/sugars) are represented in blue in the supplementary biplots. PCA was conducted by the R function princomp.
Results and Discussion
Conservation of Certain Co-Expressed Protein Families Across Species Using Primary and Secondary Wall Cesa Gene Vicinity Networks
Genes that are transcriptionally coordinated tend to be functionally related (Usadel et al., 2009). For example, many genes that are co-expressed with the secondary wall CESA genes in Arabidopsis are involved in secondary cell wall formation (Brown et al., 2005; Persson et al., 2005; Zhong et al., 2008). While these relationships now are obvious in Arabidopsis, no large-scale comparative studies have been performed to analyze such relationships in other species. To carry out such an analysis, we first created a co-expressed gene vicinity network for AtCESA7 using the AraGenNet platform (Mutwil et al., 2010), which includes most of the essential genes for secondary cell wall biosynthesis (Figure 1). This co-expression network contains the other two CESAs responsible for secondary wall cellulose AtCESA4 and AtCESA8 and many other genes that are involved in xylan production, including IRX8 (IRREGULAR XYLEM 8), IRX9, GUX1 (GLUCURONIC ACID SUBSTITUTION OF XYLAN 1) and the recently identified IRX15 (Peña et al., 2007; Persson et al., 2007b; Brown et al., 2009, 2011; Jensen et al., 2011; Mortimer et al., 2010), and tentatively in lignin synthesis, such as IRX12 (Brown et al., 2005). In addition, several transcription factors, such as SND1 (SECONDARY WALL-ASSOCIATED NAC DOMAIN 1), and SND2, MYB46, 85, and 103, and IRX11 (Brown et al., 2005; Zhong et al., 2007, 2008), which regulate different aspects of secondary cell wall formation are also transcriptionally coordinated with the secondary CESAs.
FIGURE 1
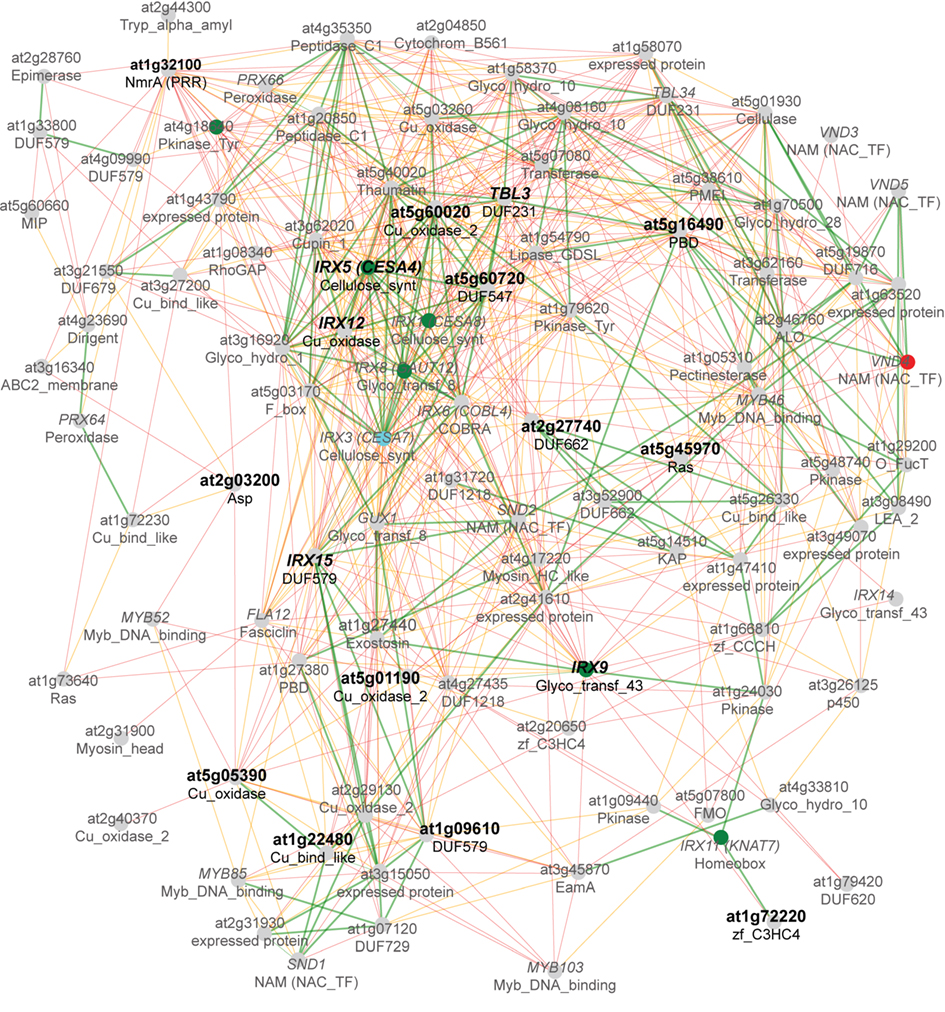
Figure 1. Co-expression gene vicinity network for AtCESA7 (turqois). Nodes indicate individual genes, and edges indicate whether two genes are co-expressed above a certain mutual rank. Red, green, and gray nodes indicate whether mutations in the gene cause embryophytic lethality (red), any biological phenotype (green), or if no mutant phenotype currently is available (gray) according to TAIR. Green, orange, and red edges indicate a mutual rank relationship 10 (green), 10 but 20 (orange), and 20 but 30 (red), respectively, for each connected gene pair. Most genes with acronyms have been associated with secondary cell wall production. The genes were associated to gene families according to PFAM (protein family) classification, and the respective PFAM is indicated below the gene name/AGI-code. Bold genes have been included in this study. The network was generated, and modified from AraGenNet (http://aranet.mpimp-golm.mpg.de/aranet; Mutwil et al., 2010).
The AtCESA7 co-expression network also displayed the corresponding PFAM (Finn et al., 2010) for each gene (Figure 1). Based on these PFAM associations, we have compared primary and secondary cellulose synthesis-related co-expression networks of seven species to investigate if those networks consistently include genes from certain PFAMs across species. We identified primary and secondary cell wall specific CESAs for barley, rice, poplar, Medicago, soybean, and wheat to create similar co-expression networks as for Arabidopsis. The secondary wall CESAs are normally expressed in roots and stems where large amounts of secondary walls are produced, while the primary wall CESAs tend to be more uniformly expressed across plant tissues and organs. Based on these assumptions we selected the closest homologs of the Arabidopsis primary wall-related CESA1 and the secondary wall-related CESA7 gene from the six other species, evaluated the expression profiles (Figure S1 in Supplementary Material), and validated the genes with previously published results (Tanaka et al., 2003; Burton et al., 2004; Kumar et al., 2009). First, we compared the co-expressed gene vicinity networks of the secondary CESAs from the seven species using the Network Comparer Tool from PlaNet (Mutwil et al., 2011). This analysis revealed that many gene families are conserved across species, because we found genes from the respective PFAM annotation in at least five (green nodes) or four (orange nodes) of the seven networks (Figure 2).
FIGURE 2
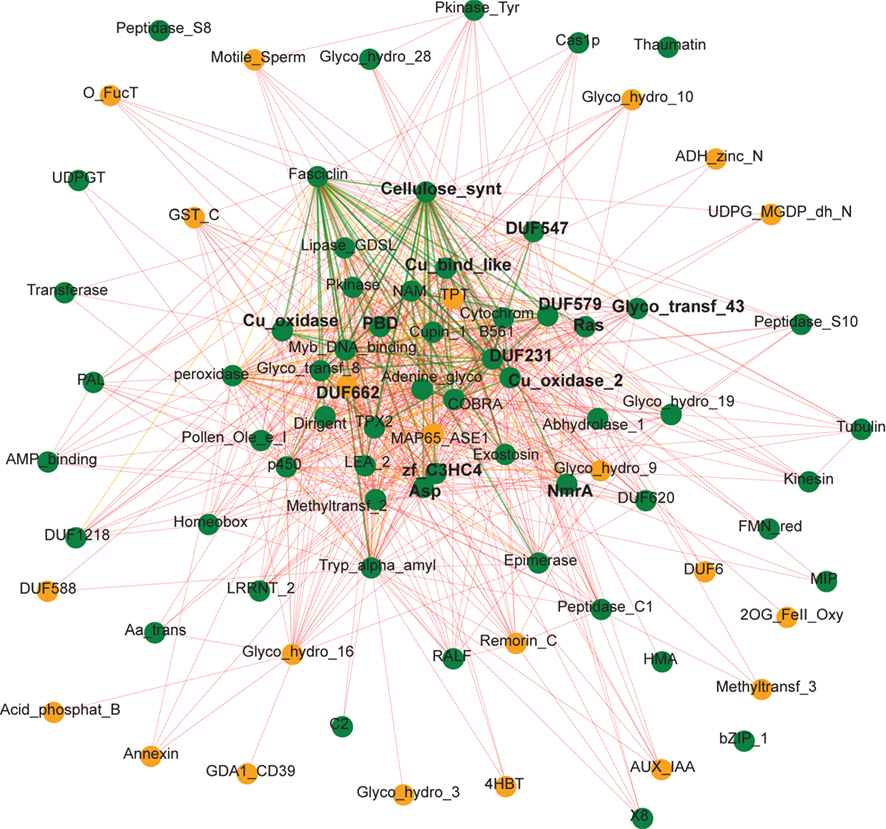
Figure 2. Consensus co-expression network of secondary cell wall genes from seven plant species. Gene vicinity co-expression networks of the Arabidopsis CESA7 homologs from barley, rice, poplar, medicago, soybean, and wheat were compared for re-occurring gene families (PFAMs). Nodes with their respective PFAM description indicate gene families that are enriched across species. Nodes and edges colored green, orange, and red represent gene families and co-expression relationships between them, that are present in at least five, four or two of the selected networks, respectively. For example, in at least five of the seven co-expression networks from the different species there is at least one gene belonging to the gene family DUF579 (green node in the upper right center). Bold PFAMs indicate gene families from which we selected genes for further analysis. This network was generated using the Network Comparer Tool from PlaNet (http://aranet.mpimp-golm.mpg.de/aranet/NetworkComparer; Mutwil et al., 2011), and red nodes were removed for clarity.
For a more comprehensive representation of conserved components in cellulose synthesis across species, we have extended the analysis of the secondary CESA genes and included also the co-expression networks of the primary cell wall-related CESAs from the seven species. Figure 3 shows only the highly conserved gene families that appear in at least eight of the 14 analyzed networks (for a complete list see supplementary Table S1 in Supplementary Material). The gene families were grouped into functional categories based on their PFAM description (PFAM version 24.0, http://pfam.sanger.ac.uk). Core components and gene families that were enriched in primary or secondary cell wall and monocots or dicots were defined based on the difference of occurrence in primary or secondary wall and monocot and dicot specific networks, respectively (Figure 3). We hypothesize that the enrichments of certain gene families might reflect the differences of cellulose biosynthesis between primary and secondary cell wall as well as between monocots and dicots. Interestingly, many genes known to be involved in cell wall synthesis in Arabidopsis had homologs in other species that are also transcriptionally coordinated with the respective CESA genes. For example, most co-expression networks contained Glycosyltransferase family 8 genes, for which IRX8/GAUT12 (GALACTURONOSYL TRANSFERASE 12) and GUX1 (Peña et al., 2007; Mortimer et al., 2010) have been identified in Arabidopsis, though their exact function is still unknown. Also, COBRA, a GPI-anchored protein important for anisotropic growth (Roudier et al., 2005), KORRIGAN, encoding for a endo-1,4-beta-D-glucanase (Glycosyl hydrolase family 9, Nicol et al., 1998), and CTL1, a chitinase-like protein (Glycosyl hydrolase family 19, Zhong et al., 2002), had homologs in most of the primary and secondary CESA co-expression networks of the seven species, underlining their importance in cellulose related cell wall synthesis. In addition, DUF231 family members were consistently co-expressed with the CESA genes across different species, and at least two DUF231-related gene products have recently been implicated in cellulose production (Bischoff et al., 2010).
FIGURE 3
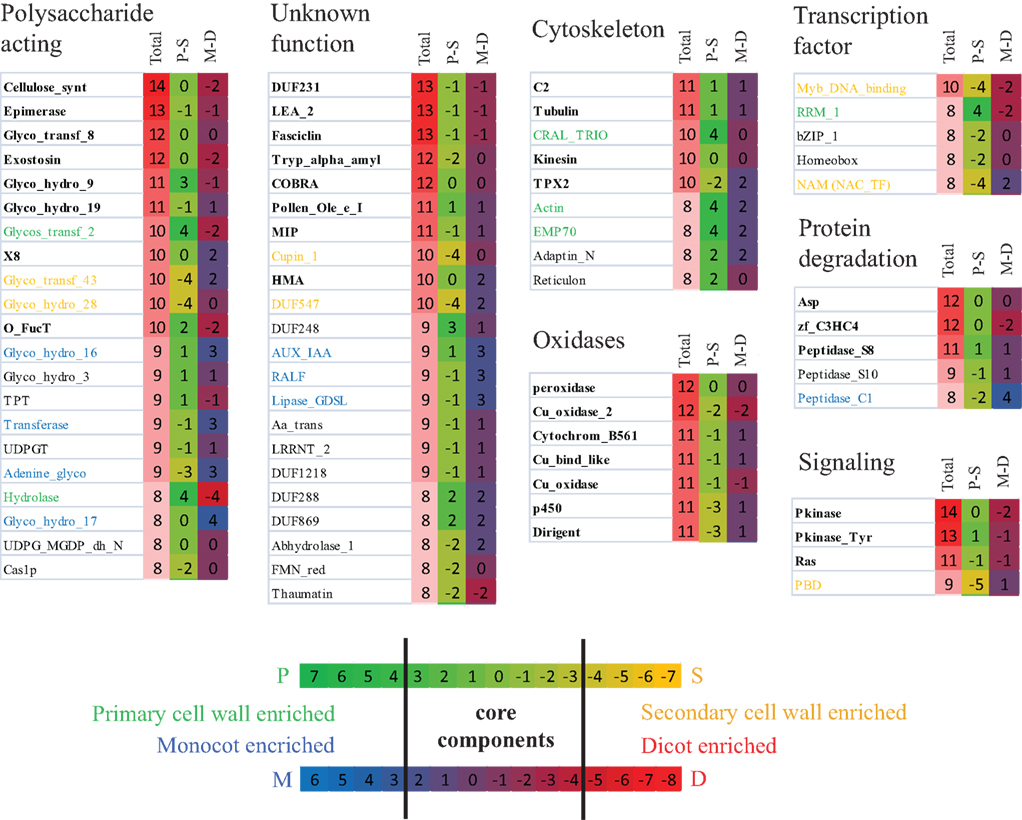
Figure 3. Analysis of primary and secondary cellulose biosynthesis networks in the seven species using Network Comparer. Seven primary cell wall and seven secondary CESA gene vicinity co-expression networks have been analyzed for enrichment of PFAMs. Total presence of at least one gene of the respective PFAM in the fourteen co-expression networks is indicated in the first column. The heatmaps in the second and third column represent enrichment of a gene family in primary (P) or secondary cell walls (S) and monocots (M) or dicots (D) based on the difference of occurrence of genes of the respective PFAM in the 14 co-expression networks. For example, the genes from the NAM family (Transcription factor section) are present in two primary (P) and six secondary (S) co-expression networks (Table S1 in Supplementary Material), which sums up to eight in total (first column), and the difference of P − S is −4 (second column). At the same time, genes from this NAM family are present in five monocot (M) and three dicot (D) co-expression networks resulting in a difference M − D of two (third column). Any PFAM was defined as enriched in primary or secondary cell walls and marked green or orange, if P − S ³ 4 or P − S £ −4, respectively. Enrichment for monocots or dicots, with corresponding PFAMs marked in blue and red, was defined as M − D ³ 3 or M − D £ −5, respectively, because eight dicot and only six monocot networks (corresponding to four dicot and three monocot species) were analyzed. Core components (marked in bold letters) were defined as gene families that were present in at least ten networks, without being enriched in monocots or dicots, nor primary or secondary cell wall biosynthesis.
Intriguingly, also transcription factors, oxidases, as well as tentative cytoskeletal components, protein degradation, and signaling related genes seem to be consistently co-expressed with the CESA genes. In particular, several MYB and NAC transcription factors, which are secondary cell wall specific according to our analysis, have been shown to be involved in secondary cell wall formation (e.g., MYB46, MYB83, SND1, SND2, Zhong et al., 2008). Oxidases, such as laccases (PFAM annotation: Cu_oxidase) and peroxidases were only slightly enriched in secondary cell wall co-expression networks, suggesting that in addition to their role in lignification of the secondary cell wall they might also have a function in primary cell wall biosynthesis. Furthermore, the recently identified cellulose synthase interacting protein (CSI) 1 (Gu et al., 2010) belongs to the C2 domain-containing family, which was highly enriched in the CESA vicinity networks. Although the exact function of CSI1 is still unclear, the conserved co-expression across species implies an important role in cellulose synthesis of this protein. Interestingly, actin and two other cytoskeleton related genes appear more primary cell wall specific, suggesting a more prominent role of these components during primary cell wall biosynthesis. To our surprise also several protein degradation and signaling components appeared in our analysis. For example, the highly conserved gene family Pkinase_Tyr comprises the THESEUS1 homolog FERONIA in Arabidopsis. Both receptor-like kinases are involved in control of growth regulation (Hématy and Höfte, 2008, Kessler et al., 2010), suggesting that their homologs might play a similar role in other species. The function of protein degradation in cell wall biosynthesis is unclear. However, given the importance of trafficking and recycling of the CESA-complex (Wightman and Turner, 2010), we hypothesize that these components might be involved in removing inhibited or defect CESA-complex subunits.
We conclude that many genes in the co-expression networks of primary and secondary CESA genes are conserved across species indicating that similar genetic modules for cellulose biosynthesis are present in higher plants. This demonstrates that cellulose synthesis-related knowledge obtained in the model species Arabidopsis is likely to be transferable to other species. However, using this comparative analysis we can also attempt to infer gene functions in Arabidopsis. For example, several glycosyl hydrolase families (GH3, GH16, GH17) are highly conserved in CESA co-regulated clusters across species, but do not have any corresponding homologs in the Arabidopsis co-expression networks (Table S1 in Supplementary Material). This might be due to the fact that only about 63% of the Arabidopsis genes are represented on the Affymetrix ATH1 chip and the probesets for the respective genes might be missing on the chip (e.g., At3g47040 for GH3, At4g13090 and At5g65730 for GH16, and At1g11820 for GH17 are not represented on the ATH1 chip). We hypothesize that members of these families, whose expression is not determined by microarrays, might actually be co-expressed with the primary or secondary CESA in Arabidopsis and could constitute functional homologs of the respective genes from the other species.
Identification of Putative Secondary Wall-Related Genes
Several studies have successfully employed the co-expression approach to identify new genes, which are associated with secondary wall cellulose synthesis (for example Brown et al., 2005; Persson et al., 2005). However, there are a large number of genes that are also closely co-expressed with the secondary CESAs, which have not been characterized in previous analyses (Figure 1). To identify new genes that are important for secondary wall biosynthesis we made use of the comparative analysis of secondary wall co-expression networks and selected genes from gene families that are conserved across species (highlighted PFAMs in Figure 2). We obtained homozygous T-DNA mutant lines corresponding to 17 genes that were used for further analyses (Table 1; Figure 1). To gain a broader overview on the cellulose synthesis-related gene families, these genes covered our previously defined categories “Unknown function” (i.e., DUF231, 547, 579, 662), “Protein degradation” (i.e. zf_C3HC4, Asp), “Signaling” (i.e., PBD and Ras) and “Oxidases” (i.e., Cu_oxidase, Cu_bind_like, Figure 3). Gene homology searches revealed that many of the genes also are part of larger gene families, perhaps suggesting functional redundancies in the absence of one homolog. It is also important to point out that several studies have been undertaken to identify irregular xylem (irx) mutants, and we therefore reasoned that while it is unlikely that any of the new mutant lines would exhibit strong defects in xylem morphology it appeared plausible that more subtle changes associated with the secondary cell wall, such as the sugar compositions, may be evident.
Cell Wall Analyses
To provide a statistical pipeline to assess similarities and differences of sugar profiles in mutant lines we developed a combined PCA with k-medoid clustering of sugar profiles. To elucidate whether this approach may reveal differences of known and unknown secondary wall mutants we harvested the lower part of stems and analyzed the sugar alditols using GC–MS, and the cellulose content using the anthrone assay. Figure 4 shows a subset of the sugar alditol estimates from crude cell wall material for wild-type, irx5, irx9, irx12, and three T-DNA lines affecting the genes At5g05390 (mutant number 14), At5g60020 (mutant number 16), and At1g32100 (mutant number 18; Table 1). The complete set of sugar alditol estimates is available in Table S2 in Supplementary Material, and the cellulose measurements in Figure S2 in Supplementary Material. As previously shown the irx9 had substantial reduction in xylose (Brown et al., 2005; Bauer et al., 2006), and the CESA4 deficient irx5 displayed about 60% reduction in cellulose as estimated from the crude cell wall material. On the other hand, the irx mutant irx12 displayed very minor changes in its sugar composition and cellulose content, similar to what Brown et al. (2005) reported.
FIGURE 4
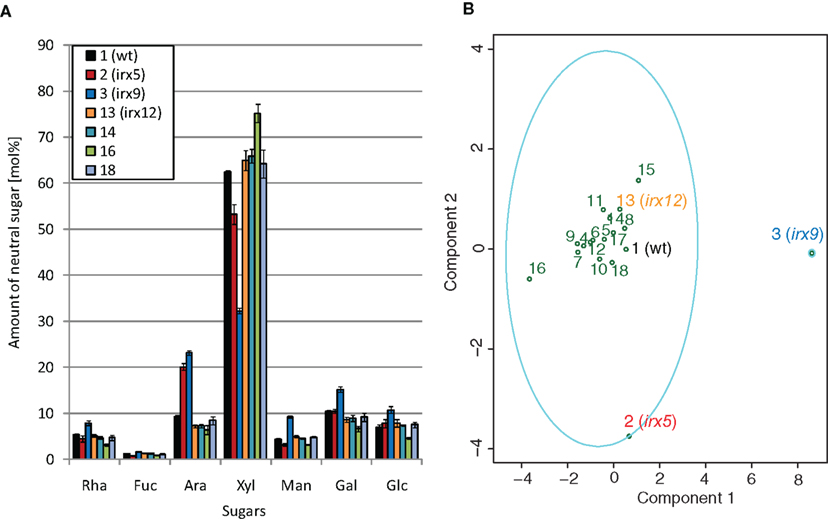
Figure 4. Principal component analysis and clustering of crude cell wall sugar estimates for the selected mutants. (A) GC–MS analysis of sugar alditols of crude cell wall material for indicated mutants. (B) Principal component analysis (PCA) of the mol% sugar values from the crude cell wall material. The first two components explain 93.12% of the variation. The loadings for the variables are displayed in supplementary Figure S3 in Supplementary Material. The ellipses indicate clustering of mutant sugar profiles based on the k-mediod algorithm. The number of clusters was estimated based on the silhouette width, i.e., the dissimilarity in sugar profiles as measured by the Euclidean distances between the profiles. Wild-type (black), and mutants affecting cellulose (irx5; red), xylan (irx9; blue), and potentially lignin (irx12; orange) are indicated in different colors.
TABLE 1
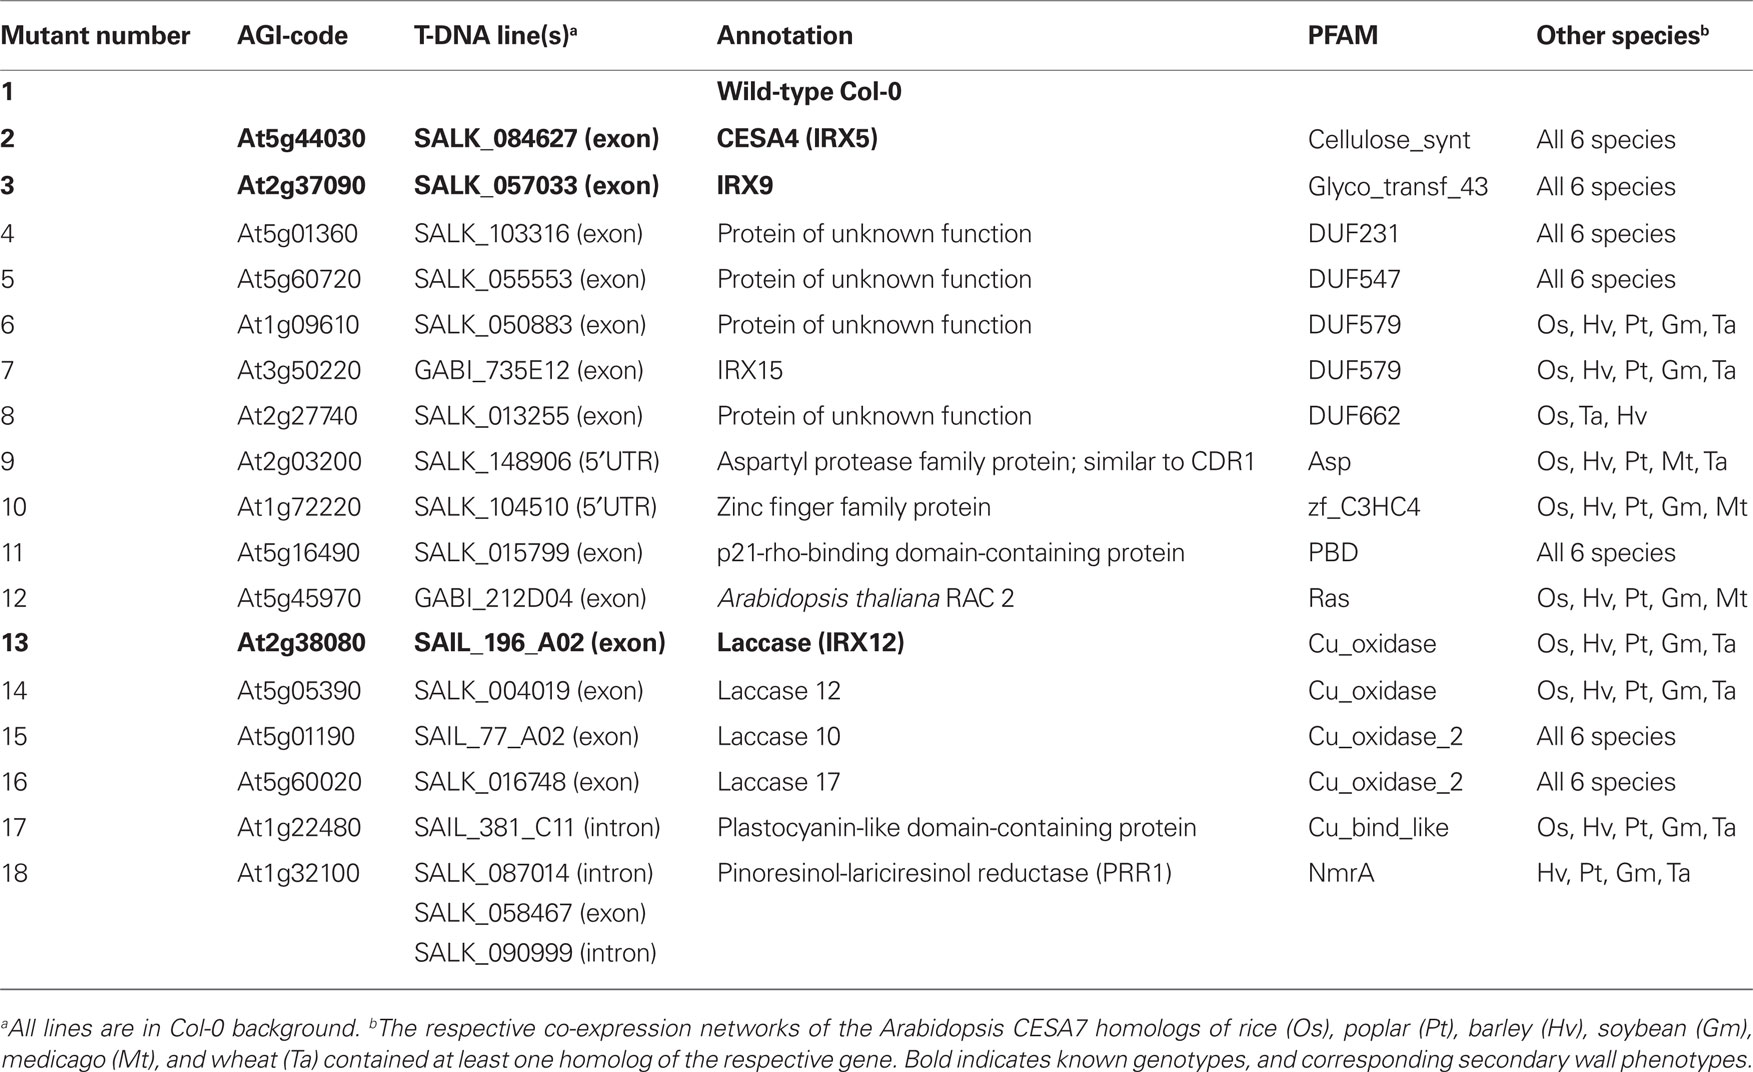
Table 1. T-DNA insertion information for selected genes, which are enriched in secondary cell wall co-expression networks across species.
To get a more conclusive picture of how the sugar profiles for the different mutants relate to each other we used the corresponding values of the profiles for the pipeline outlined above. The PCA explain the highest variation among the samples (Figure 4B), and should detect similar patterns in the sugar profiles for certain mutants. To manage the latter, we assessed whether the sugar profiles for certain mutants clustered together, i.e., we tried to find mutant sugar profiles that were similar to each other but dissimilar to the other mutant sugar profiles. We did this by using a k-means clustering derivative, referred to as k-medoid (Theodoridis and Koutroumbas, 2006). Choosing the right number of clusters is very important for the result of these clustering algorithms. To obtain a statistically reliable number of clusters we analyzed the sugar profiles using the silhouette validation method (Rousseeuw, 1987). This method estimates whether a certain mutant sugar profile should be classified as belonging to a distinct cluster. This is performed by first quantifying the average dissimilarity between one mutant sugar profile to other mutant sugar profiles in the same cluster, and then comparing this difference against the smallest dissimilarity between the one mutant sugar profile and mutant sugar profiles that are assigned to other clusters. The scores range between −1 and 1, where a value close to −1 means that the mutant should be assigned to another cluster, and a value close to 1 means that the mutant is correctly classified. The clustering with the highest average silhouette width for the sugar profiles from the crude cell wall material resulted in an optimal number of two clusters. As seen in Figure 4B, most of the mutant profiles were classified as belonging to one major cluster. However, at least one of the mutant profiles, corresponding to irx9, was retained in its own cluster, and the other severe irx mutant, irx5, deviated quite dramatically from the other sugar profiles in the larger cluster. These data showed that changes in the cell wall composition can be captured by the two methods, i.e., PCA and the clustering evaluation.
PCA and Clustering Analyses of Sugar Profiles Reveal Several Secondary Wall Mutant Classes
While the crude cell wall sugar measurements are informative for mutants with dramatic alterations in certain monosaccharides, it is relatively difficult to detect smaller changes associated with distinct polymers. To enrich for such small putative changes, we fractionated the crude cell walls into four fractions using CDTA, which mainly releases Ca2+-chelated polymers such as pectins, Na2CO3, which releases pectic polymers that are associated to other polymers by weak hydrogen-bonds, and 4 M KOH, which releases hemicellulosic polymers associated by stronger hydrogen-bonds to the remaining matrix. In addition, we analyzed the remaining pellet, which largely contains cellulosic polymers. Consistent with the supposed fractionation pattern we obtained relatively more pectin related monosaccharides, e.g., rhamnose, galactose, and arabinose, in the first two fractions, and mainly xylose in the third fraction (Table S2 in Supplementary Material). Similar to the analysis undertaken for the crude cell wall sugar profiles we performed PCA and silhouette width based clustering of the mutant sugar profiles for the different fractions (Figure 5). In the CDTA fraction we obtained two clusters, one with most of the mutants and one containing only irx5. Interestingly, irx12 mutant, and also mutant number 14, 16, and 18 were separated on the PCA plot. These three mutants correspond to two laccase genes and to a pinoresinol reductase (PRR1) gene, respectively (Table 1). It is important to note that both the IRX12 and the two laccase gene products are proposed to be associated with lignin synthesis, and that the gene product from the PRR1 has been shown to be involved in the synthesis of lignan (Nakatsubo et al., 2008). The main cause for these mutants to separate from the other mutants in the PCA plot appeared to be a relative changes in xylose and galactose (Figure S3 in Supplementary Material). A similar, but less clear, pattern was also seen in the Na2CO3 fraction where at least two of the laccases and the prr1 mutants are contained in a separate cluster from the wild-type mainly because of less arabinose in the mutants (Figure 5; Figure S3 in Supplementary Material). However, these changes were relatively small. It is important to note that the results obtained here are based on one T-DNA per mutant due to the extensive work load involved in generating the profiles from the fractionated material. We can therefore not rule out that the observed changes emanate from additional mutations in the T-DNA line backgrounds.
FIGURE 5
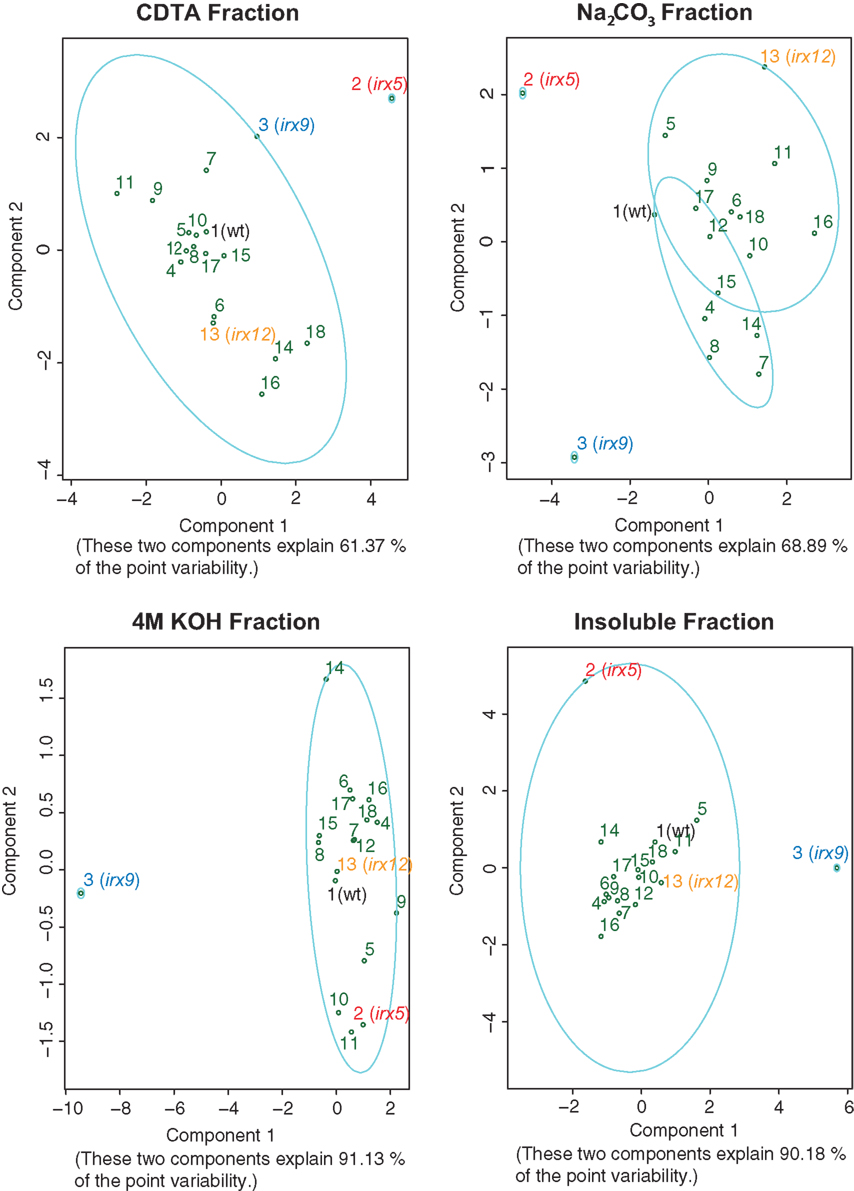
Figure 5. Principal component analysis and cluster analyses of sugar contents from fractionated cell wall material. Principal component analyses of the mol% sugar values in the different fractions for each mutant. The separation based on the scores from the first two principle components is displayed, and the explained variation of these components is indicated below each graph. The loadings for the variables are included in supplementary Figure S3 in Supplementary Material. The ellipses indicate clustering of mutants based on the k-mediod algorithm. The number of clusters was estimated based on the silhouette width, i.e., the dissimilarity in sugar profiles as measured by the Euclidean distances between the profiles. Wild-type (black), and mutants affecting cellulose (irx5; red), xylan (irx9; blue), and potentially lignin (irx12; orange) are indicated in different colors.
To merge the different sugar profiles from the four fractions into one estimate, we normalized the mol percentages of the mutants based on their amount of extractable material of the individual fractions and performed silhouette width-driven clustering on all the values for the four fractions. Hence, these estimates reflect the composition of the cell wall in a more detailed way than by only analyzing the neutral sugar composition in the crude cell wall material. The result in Figure 6 shows that three clusters were apparent, where irx9 solely occupied one cluster, and the other two clusters held the rest of the mutants.
FIGURE 6
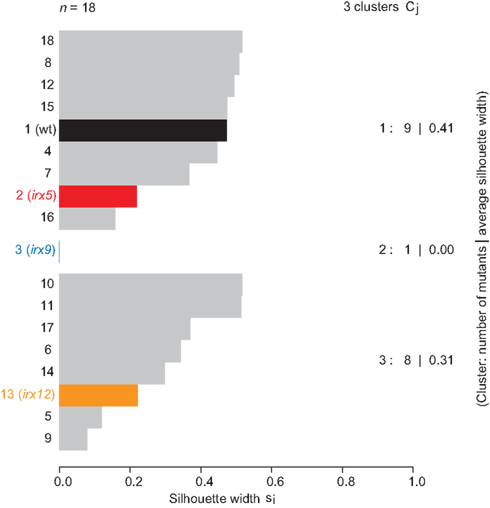
Figure 6. Clustering of combined sugar profiles from the four different cell wall fractions. Clustering summary of mutants based on the k-mediod algorithm. The number of clusters (3) was estimated based on the silhouette width, i.e., the dissimilarity in sugar profiles as measured by the Euclidean distances between the combined profiles. Wild-type (black), and mutants affecting cellulose (irx5; red), xylan (irx9; blue), and potentially lignin (irx12; orange) are indicated in different colors. The average silhoutte width was calculated to 0.34.
In summary, we propose that the combined sugar profiling and clustering analyses may be useful to classify mutants, a task that may be relatively difficult using the raw sugar alditol estimates.
A Pinoresinol Reductase is Associated with Secondary Wall Integrity
To investigate whether mutations in some of the genes resulted in weaker secondary cell walls, we generated hand-cut stem sections and stained these with Toluidine blue. As expected, none of the mutants showed any severe irx phenotype. This may be due to extensive genetic redundancy for some of the gene families. For example, At5g01360 (assigned to DUF231 pfam) is part of a gene family of over 40 genes (Bischoff et al., 2010), of which many have over-lapping expression pattern with At5g01360. One of these genes is At2g38320, which is co-expressed with the secondary wall CESA genes. However, some of the mutants appeared to have more disturbed xylem vessel shapes as compared to the wild-type. We selected one of these mutants, mutant number 18 or prr1, to analyze more in detail, and embedded basal mutant stem parts in paraffin and cut sections (10 μm) using a microtome. We subsequently stained these sections with either Toluidine blue or Phloroglucinol–HCl. The mutant stem displayed what appeared to be weakened secondary cell walls, with disturbed xylem vessel morphology (Figures 7A,B). Since deformed xylem vessels were observed in wild-type stems occasionally, the number of deformed xylem vessels was counted in three different mutant lines corresponding to the PRR1 gene and in the wild-type. Table 2 clearly shows that all of the three prr1 mutant lines contained about twice as many xylem vessels with disturbed shapes as wild-type sections. Several of these sections also indicated that the secondary walls were thinner in the mutants compared to wild-type. Since it is difficult to estimate cell wall thickness by using light microscopy we embedded basal stem parts in Spurr’s resin, created a plane surface perpendicular to the stem axis for detailed analysis by using a scanning electron microscope (Figure 7). The thickness of the secondary cell walls of the xylem related cells in one of the mutants and wild-type was measured. The results indicate that impairment of the PRR1 function results in thinner cell walls, and that this most likely affects the integrity of the wall.
FIGURE 7
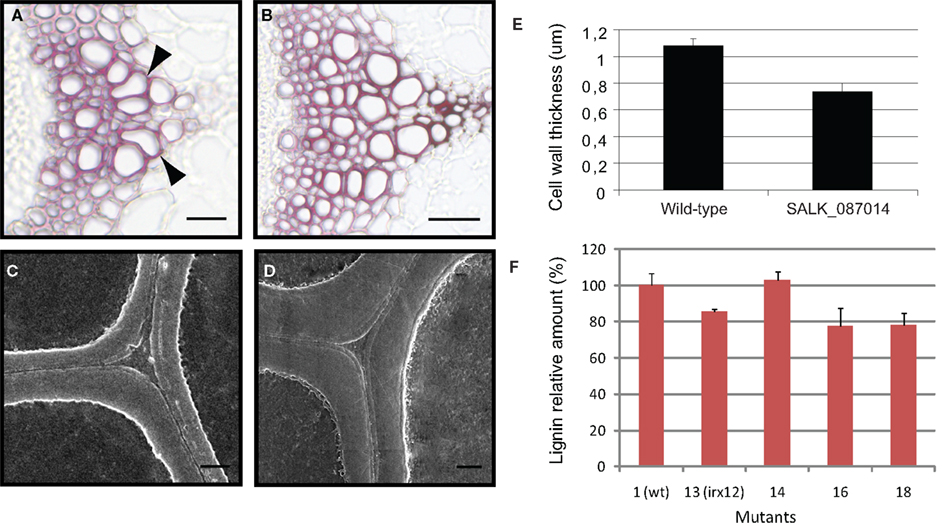
Figure 7. Mutations in PRR1 cause disturbed xylem shapes, thinner secondary cell walls and a decrease in lignin related structures. (A,B) Example of stem sections stained with phloroglucinol–HCl for SALK_087014 (A); affecting PRR1) and wild-type (B). Arrowheads indicate xylem vessels with disturbed morphology. Scale bars = 25 mm. (C,D) Secondary cell walls from stem sections using scanning electron microscopy from SALK_087014 (C) and wild-type (D). Scale bars = 1 mm. (E) Secondary cell wall width from wild-type (N = 687) and SALK_087014 (N = 585). Displayed are the means of three different stems per line. (F) Thioglycolic-acid analysis of lignin contents in different mutants, presumably affecting stem lignification.
TABLE 2
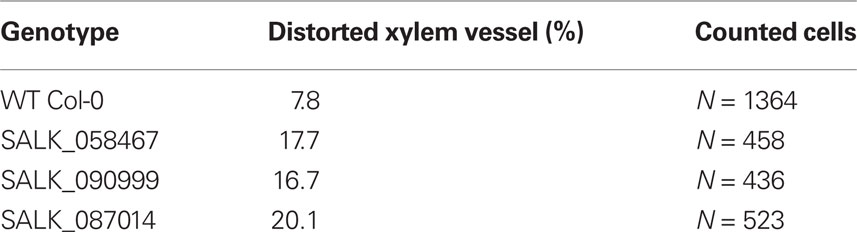
Table 2. Quantification of xylem vessels with disturbed shapes for prr1 (At1g32100).
The PRR1 can reduce pinoresinols to lariciresinols (Nakatsubo et al., 2008), and the latter can subsequently be converted into secoiso-lariciresinols. These structures are part of a larger family of molecules generally referred to as lignans, and may work as antioxidants and phytoestrogens (Pan et al., 2009). In addition, some of these structures have also been found in lignin through two-dimensional-NMR studies (Zhang et al., 2003). To investigate whether the prr1 mutants, and some of the laccase mutants, caused alterations in lignin related structures we measured the lignin content using the Thioglycolic-acid (TGA) assay (Campbell and Ellis, 1992). Using this method we found that the prr1, irx12, and the laccase mutant number 16 indeed held lower levels of lignin related structures, whereas the laccase mutant number 14 had similar levels as the wild-type control (Figure 7). It is important to note that these analyses only estimate the levels of lignin related structures, and do not reflect differences in the structure of the structures. Given that these mutants displayed similar trends for the sugar profiles in the CDTA fraction it is possible that defects in the lignin polymers affect pectin levels, or extractability.
Conclusion
The remarkable transcriptional coordination of the genes associated with secondary cell wall formation in Arabidopsis suggested that similar relationships would also be present in other plant species. Indeed, by comparing the co-expression networks of primary and secondary CESA genes from seven different plant species we find that many components in these networks are conserved across species. Based on sequence similarity and co-expression vicinities, we argue that their gene products are likely to perform similar functions in the different species, and thus that these comparative analyses may constitute an excellent tool to transfer knowledge obtained in Arabidopsis. We also developed a statistical pipeline of PCA and clustering analyses of cell wall sugar profiles that may be used to classify cell wall mutants. We propose that comparative co-expression analysis is a powerful approach to select and identify new genes involved in cell wall formation.
Conflict of Interest Statement
The authors declare that the research was conducted in the absence of any commercial or financial relationships that could be construed as a potential conflict of interest.
Acknowledgments
We would like to thank Federico Giorgifor help with the association of probe sets to pfams, and Susann Weichold and Annemarie Martins for assistance with electron microscopy, and Malgorzata Janczarska for technical help with the biochemical cell wall analyses. This work was supported by a fellowship to Colin Ruprecht from the IMPRS program at the MPI-MP. Marek Mutwil and Staffan Persson were supported by the MPG, Friederike Saxe was financed by the IMPRS program at the MPI-KGF, Michaela Eder was funded by CASPIC, and Zoran Nikoloski was supported by the GoFORSYS project funded by the German Federal Ministry of Education and Research, Grant No. 0313924.
Supplementary Material
The Supplementary Material for this article can be found online at http://www.frontiersin.org/plant_physiology/10.3389/fpls.2011.00023/abstract
References
Albersheim, P., Nevins, D. J., English, P. D., and Karr, A. (1967). A method for the analysis of sugars in plant cell-wall polysaccharides by gas-liquid chromatography (Acer pseudoplatanus tissue culture cells). Carbohydr. Res. 5, 340–345.
Arioli, T., Peng, L., Betzner, A. S., Burn, J., Wittke, W., Herth, W., Camilleri, C., Höfte, H., Plazinski, J., Birch, R., Cork, A., Glover, J., Redmond, J., and Williamson, R. E. (1998). Molecular analysis of cellulose biosynthesis in Arabidopsis. Science 279, 717–720.
Bauer, S., Vasu, P., Persson, S., Mort, A. J., and Somerville, C. R. (2006). Development and application of a suite of polysaccharide-degrading enzymes for analyzing plant cell walls. Proc. Natl. Acad. Sci. U.S.A. 103, 11417–11422.
Bischoff, V., Nita, S., Neumetzler, L., Schindelasch, D., Urbain, A., Eshed, R., Persson, S., Delmer, D., and Scheible, W. (2010). Trichome birefringence and its homolog AT5G01360 encode plant-specific DUF231 proteins required for cellulose biosynthesis in Arabidopsis. Plant Physiol. 153, 590–602.
Brown, D., Wightman, R., Zhang, Z., Gomez, L. D., Atanassov, I., Bukowski, J. P., Tryfona, T., McQueen-Mason, S. J., Dupree, P., and Turner, S. (2011). Arabidopsis genes IRREGULAR XYLEM (IRX15) and IRX15L encode DUF579-containing proteins that are essential for normal xylan deposition in the secondary cell wall. Plant J. 66, 401–413.
Brown, D. M., Zeef, L. A., Ellis, J., Goodacre, R., and Turner, S. R. (2005). Identification of novel genes in Arabidopsis involved in secondary cell wall formation using expression profiling and reverse genetics. Plant Cell 17, 2281–2295.
Brown, D. M., Zhang, Z., Stephens, E., Dupree, P., and Turner, S. R. (2009). Characterization of IRX10 and IRX10-like reveals an essential role in glucuronoxylan biosynthesis in Arabidopsis. Plant J. 57, 732–746.
Burton, R. A., Shirley, N. J., King, B. J., Harvey, A. J., and Fincher, G. B. (2004). The CesA gene family of barley. Quantitative analysis of transcripts reveals two groups of co-expressed genes. Plant Physiol. 134, 224–236.
Campbell, M. M., and Ellis, B. E. (1992). Fungal elicitor-mediated responses in pine cell-cultures. 1. Induction of phenylpropanoid metabolism. Planta 186, 409–417.
Carpita, N., and McCann, M. (2000). “The plant cell wall,” Biochemistry and Molecular Biology of Plants, eds B. Buchanan, W. Gruissem, and R. Jones (Rockville, MD: American Society of Plant Biologists), 52–108.
Cocuron, J. C., Lerouxel, O., Drakakaki, G., Alonso, A. P., Liepman, A. H., Keegstra, K., Raikhel, N., and Wilkerson, C. G. (2007). A gene from the cellulose synthase-like C family encodes a beta-1,4glucan synthase. Proc. Natl. Acad. Sci. U.S.A. 104, 8550–8555.
Desprez, T., Juraniec, M., Crowell, E. F., Jouy, H., Pochylova, Z., Parcy, F., Höfte, H., Gonneau, M., and Vernhettes, S. (2007). Organization of cellulose synthase complexes involved in primary cell wall synthesis in Arabidopsis thaliana. Proc. Natl. Acad. Sci. U.S.A. 104, 15572–15577.
Dische, Z. (1962). “Colour reactions of carbohydrates,” Methods in Carbohydrate Chemistry, Vol. 1, eds R. L. Whistler, and M. L. Wolfrom (New York, NY: Academic Press Inc.), 478–548.
Finn, R. D., Mistry, J., Tate, J., Coggill, P., Heger, A., Pollington, J. E., Gavin, O. L., Gunesekaran, P., Ceric, G., Forslund, K., Holm, L., Sonnhammer, E. L., Eddy, S. R., and Bateman, A. (2010). The Pfam protein families database. Nucleic Acids Res. 38, D211–D222.
Geisler, D. A., Sampathkumar, A., Mutwil, M., and Persson, S. (2008). Laying down the bricks: logistic aspects of cell wall biosynthesis. Curr. Opin. Plant Biol. 11, 647–652.
Gu, Y., Kaplinsky, N., Bringmann, M., Cobb, A., Carroll, A., Sampathkumar, A., Baskin, T. I., Persson, S., and Somerville, C. R. (2010). Identification of a cellulose synthase-associated protein required for cellulose biosynthesis. Proc. Natl. Acad. Sci. U S A. 107, 12866–12871.
Hématy, K., and Höfte, H. (2008). Novel receptor kinases involved in growth regulation. Curr. Opin. Plant Biol. 11, 321–328.
Jensen, J. K., Kim, H., Cocuron, J. C., Orler, R., Ralph, J., and Wilkerson, C. G. (2011). The DUF579 domain containing proteins IRX15 and IRX15-L affect xylan synthesis in Arabidopsis. Plant J. 66, 387–400.
Kessler, S. A., Shimosato-Asano, H., Keinath, N. F., Wuest, S. E., Ingram, G., Panstruga, R., and Grossniklaus, U. (2010). Conserved molecular components for pollen tube reception and fungal invasion. Science 330, 968–971.
Kumar, M., Thammannagowda, S., Bulone, V., Chiang, V., Han, K. H., Joshi, C. P., Mansfield, S. D., Mellerowicz, E., Sundberg, B., Teeri, T., and Ellis, B. E. (2009). An update on the nomenclature for the cellulose synthase genes in Populus. Trends Plant Sci. 14, 248–254.
Lerouxel, O., Cavalier, D. M., Liepman, A. H., and Keegstra, K. (2006). Biosynthesis of plant cell wall polysaccharides – a complex process. Curr. Opin. Plant Biol. 9, 621–630.
Liepman, A. H., Wightman, R., Geshi, N., Turner, S. R., and Scheller, H. V. (2010). Arabidopsis – a powerful model system for plant cell wall research. Plant J. 61, 1107–1121.
Mortimer, J. C., Miles, G. P., Brown, D. M., Zhang, Z., Segura, M. P., Weimar, T., Yu, X., Seffen, K. A., Stephens, E., Turner, S. R., and Dupree, P. (2010). Absence of branches from xylan in Arabidopsis gux mutants reveals potential for simplification of lignocellulosic biomass. Proc. Natl. Acad. Sci. U.S.A. 107, 17409–17414.
Mutwil, M., Debolt, S., and Persson, S. (2008a). Cellulose synthesis: a complex complex. Curr. Opin. Plant Biol. 11, 252–257.
Mutwil, M., Obro, J., Willats, W. G., and Persson, S. (2008b). GeneCAT-novel webtools that combine BLAST and co-expression analyses. Nucleic Acids Res. 36, W320–W326.
Mutwil, M., Klie, S., Tohge, T., Giorgi, F. M., Wilkins, O., Campbell, M. M., Fernie, A. R., Usadel, B., Nikoloski, Z., and Persson, S. (2011). PlaNet: combined sequence and expression comparisons across plant networks derived from seven species. Plant Cell. 23, 895–910.
Mutwil, M., Ruprecht, C., Giorgi, F. M., Bringmann, M., Usadel, B., and Persson, S. (2009). Transcriptional wiring of cell wall-related genes in Arabidopsis. Mol. Plant 2, 1015–1024.
Mutwil, M., Usadel, B., Schütte, M., Loraine, A., Ebenhöh, O., and Persson, S. (2010). Assembly of an interactive correlation network for the Arabidopsis genome using a novel heuristic clustering algorithm. Plant Physiol. 152, 29–43.
Nakatsubo, T., Mizutani, M., Suzuki, S., Hattori, T., and Umezawa, T. (2008). Characterization of Arabidopsis thaliana pinoresinol reductase, a new type of enzyme involved in lignan biosynthesis. J. Biol. Chem. 283, 15550–15557.
Neumetzler, L. (2010). Identification and Characterization of Arabidopsis Mutants Associated with Xyloglucan Metabolism. Berlin: Rhombos-Verlag, 33–35.
Nicol, F., His, I., Jauneau, A., Vernhettes, S., Canut, H., and Höfte, H. (1998). A plasma membrane-bound putative endo-1,4-beta-D-glucanase is required for normal wall assembly and cell elongation in Arabidopsis. EMBO J. 17, 5563–5576.
Oikawa, A., Joshi, H. J., Rennie, E. A., Ebert, B., Manisseri, C., Heazlewood, J. L., and Scheller, H. V. (2010). An integrative approach to the identification of Arabidopsis and rice genes involved in xylan and secondary wall development. PLoS ONE 5, e15481. doi: 10.1371/journal.pone.0015481
Pan, J. Y., Chen, S. L., Yang, M. H., Wu, J., Sinkkonen, J., and Zou, K. (2009). An update on lignans: natural products and synthesis. Nat. Prod. Rep. 26, 1251–1292.
Paredez, A. R., Somerville, C. R., and Ehrhardt, D. W. (2006). Visualization of cellulose synthase demonstrates functional association with microtubules. Science 312, 1491–1495.
Peña, M. J., Zhong, R., Zhou, G. K., Richardson, E. A., O’Neill, M. A., Darvill, A. G., York, W. S., and Ye, Z. H. (2007). Arabidopsis irregular xylem8 and irregular xylem9: implications for the complexity of glucuronoxylan biosynthesis. Plant Cell 19, 549–563.
Persson, S., Paredez, A., Carroll, A., Palsdottir, H., Doblin, M., Poindexter, P., Khitrov, N., Auer, M., and Somerville, C. R. (2007a). Genetic evidence for three unique components in primary cell-wall cellulose synthase complexes in Arabidopsis. Proc. Natl. Acad. Sci. U.S.A. 104, 15566–15571.
Persson, S., Caffall, K. H., Freshour, G., Hilley, M. T., Bauer, S., Poindexter, P., Hahn, M. G., Mohnen, D., and Somerville, C. (2007b). The Arabidopsis irregular xylem8 mutant is deficient in glucuronoxylan and homogalacturonan, which are essential for secondary cell wall integrity. Plant Cell 19, 237–255.
Persson, S., Wei, H., Milne, J., Page, G. P., and Somerville, C. R. (2005). Identification of genes required for cellulose synthesis by regression analysis of public microarray data sets. Proc. Natl. Acad. Sci. U.S.A. 102, 8633–8638.
Rasband, W. S. (1997). ImageJ. Bethesda, MD: U. S. National Institutes of Health. Available at: http://rsb.info.nih.gov/ij/
Roudier, F., Fernandez, A. G., Fujita, M., Himmelspach, R., Borner, G. H., Schindelman, G., Song, S., Baskin, T. I., Dupree, P., Wasteneys, G. O., and Benfey, P. N. (2005). COBRA, an Arabidopsis extracellular glycosyl-phosphatidyl inositol-anchored protein, specifically controls highly anisotropic expansion through its involvement in cellulose microfibril orientation. Plant Cell 17, 1749–1763.
Rousseeuw, P. J. (1987). Silhouettes: a graphical aid to the interpretation and validation of cluster analysis. J. Comput. Appl. Math. 20, 53–65.
Selvendran, R. R., Ring, S. G., and Dupont, M. S. (1979). Assessment of procedures used for analyzing dietary fiber and some recent developments. Chem. Ind. 225–230.
Somerville, C., Bauer, S., Brininstool, G., Facette, M., Hamann, T., Milne, J., Osborne, E., Paredez, A., Persson, S., Raab, T., Vorwerk, S., and Youngs, H. (2004). Toward a systems approach to understanding plant cell walls. Science 306, 2206–2211.
Spurr, A. R. (1969). A low viscosity epoxy resin embedding medium for electron microscopy. J. Ultrastruct. Res. 26, 31–43.
Tanaka, K., Murata, K., Yamazaki, M., Onosato, K., Miyao, A., and Hirochika, H. (2003). Three distinct rice cellulose synthase catalytic subunit genes required for cellulose synthesis in the secondary wall. Plant Physiol. 133, 73–83.
Taylor, N. G. (2008). Cellulose biosynthesis and deposition in higher plants. New Phytol. 178, 239–252.
Taylor, N. G., Laurie, S., and Turner, S. R. (2000). Multiple cellulose synthase catalytic subunits are required for cellulose synthesis in Arabidopsis. Plant Cell 12, 2529–2540.
Theodoridis, S., and Koutroumbas, K. (2006). Pattern Recognition, 3rd Edn. San Diego, CA: Academic Press, 635.
Turner, S. R., and Somerville, C. R. (1997). Collapsed xylem phenotype of Arabidopsis identifies mutants deficient in cellulose deposition in the secondary cell wall. Plant Cell 9, 689–701.
Usadel, B., Obayashi, T., Mutwil, M., Giorgi, F. M., Bassel, G. W., Tanimoto, M., Chow, A., Steinhauser, D., Persson, S., and Provart, N. J. (2009). Co-expression tools for plant biology: opportunities for hypothesis generation and caveats. Plant Cell Environ. 32, 1633–1651.
Weigel, D., and Glazebrook, J. (2002). Arabidopsis: A Laboratory Manual. New York: Cold Spring Habour Laboratory Press, 195–203.
Wightman, R., and Turner, S. (2010). Trafficking of the cellulose synthase complex in developing xylem vessels. Biochem. Soc. Trans. 38, 755–760.
Zhang, L., Henriksson, G., and Gellerstedt, G. (2003). The formation of beta-beta structures in lignin biosynthesis–are there two different pathways? Org. Biomol. Chem. 1, 3621–3624.
Zhong, R., Kays, S. J., Schroeder, B. P., and Ye, Z. (2002). Mutation of a chitinase-like gene causes ectopic deposition of lignin, aberrant cell shapes, and overproduction of ethylene. Plant Cell 14, 165–179.
Zhong, R., Lee, C., Zhou, J., McCarthy, R. L., and Ye, Z. H. (2008). A battery of transcription factors involved in the regulation of secondary cell wall biosynthesis in Arabidopsis. Plant Cell 20, 2763–2782.
Keywords: secondary cell wall, comparative co-expression analysis, Arabidopsis, cellulose
Citation: Ruprecht C, Mutwil M, Saxe F, Eder M, Nikoloski Z and Persson S (2011) Large-scale co-expression approach to dissect secondary cell wall formation across plant species. Front. Plant Sci. 2:23. doi: 10.3389/fpls.2011.00023
Received: 31 March 2011;
Accepted: 14 June 2011;
Published online: 01 July 2011.
Edited by:
Alisdair Fernie, Max Planck Institut for Plant Physiology, GermanyReviewed by:
Nicholas Provart, University of Toronto, CanadaJesper Harholt, University of Copenhagen, Denmark
Copyright: © 2011 Ruprecht, Mutwil, Saxe, Eder, Nikoloski and Persson. This is an open-access article subject to a non-exclusive license between the authors and Frontiers Media SA, which permits use, distribution and reproduction in other forums, provided the original authors and source are credited and other Frontiers conditions are complied with.
*Correspondence: Staffan Persson, Max-Planck-Institute of Molecular Plant Physiology, Am Muehlenberg 1, 14476 Potsdam, Germany. e-mail: persson@mpimp-golm.mpg.de