 Fumio Matsuda1,2 Ryo Nakabayashi1 Yuji Sawada1,3 Makoto Suzuki1 Masami Y. Hirai1,3 Shigehiko Kanaya1,4 Kazuki Saito1,5*
- 1 RIKEN Plant Science Center, Yokohama, Japan
- 2 Organization of Advanced Science and Technology, Kobe University, Kobe, Japan
- 3 Japan Science and Technology Agency, CREST, Kawaguchi, Japan
- 4 Graduate School of Information Science, Nara Institute of Science and Technology, Ikoma, Japan
- 5 Graduate School of Pharmaceutical Sciences, Chiba University, Chiba, Japan
A novel framework for automated elucidation of metabolite structures in liquid chromatography–mass spectrometer metabolome data was constructed by integrating databases. High-resolution tandem mass spectra data automatically acquired from each metabolite signal were used for database searches. Three distinct databases, KNApSAcK, ReSpect, and the PRIMe standard compound database, were employed for the structural elucidation. The outputs were retrieved using the CAS metabolite identifier for identification and putative annotation. A simple metabolite ontology system was also introduced to attain putative characterization of the metabolite signals. The automated method was applied for the metabolome data sets obtained from the rosette leaves of 20 Arabidopsis accessions. Phenotypic variations in novel Arabidopsis metabolites among these accessions could be investigated using this method.
Introduction
The ability to produce various secondary metabolites has evolved in plants for the purpose of self-defense, environmental adaptation, and interaction with other organisms. Because humans utilize phytochemicals as a rich resource for various purposes such as the production of pharmaceuticals, further understanding of the genetic background behind the diversity of secondary metabolites produced by plants will facilitate more intensive application of these compounds (Saito and Matsuda, 2010). Recent progress in gene sequencing has enabled generation of a large volume of data on genetic polymorphisms that is related to natural variations in phytochemicals (Clark et al., 2007; Ossowski et al., 2008; Zeller et al., 2008). Accordingly, it is expected that novel genes and functions of plant secondary metabolism as well as those involved in evolution could be investigated based on the association between genotypes and metabolic phenotypes (metabolotypes; Plantegenet et al., 2009; Weigel and Mott, 2009). Since the metabolotype data required for such analyses is both qualitative (structure of secondary metabolites) and quantitative (amount of metabolite), metabolic profiling analysis using liquid chromatography–tandem mass spectrometry (LC–MS) has been used to obtain comprehensive profiles of plant secondary metabolites (De Vos et al., 2007). While qualitative data describing hundreds of metabolite signals have routinely been acquired during analysis (Keurentjes et al., 2006), structural elucidation of the observed signals using LC–MS is still difficult (Moco et al., 2006; Bottcher et al., 2007; Iijima et al., 2008; Matsuda et al., 2010a).
The structure-related information available from LC–MS analysis includes the retention time, exact mass number, and tandem mass spectrum (MS/MS spectrum). The structure associated with each metabolite signal has been estimated by searching databases containing reference data using the information obtained from LC–MS analysis (Moco et al., 2007; Kind and Fiehn, 2010; Neumann and Bocker, 2010). The amount of information obtained from database searches varies among metabolite peaks; therefore, four levels of structural elucidation have been standardized by the metabolome standard initiative (MSI) as follows (Fiehn et al., 2007; Sumner et al., 2007): (1) Identified: a minimum of two independent data points relative to an authentic compound analyzed under identical experimental conditions. (2) Putatively annotated: without chemical reference standards, based on physicochemical properties and/or spectral similarity with public/commercial spectral libraries. (3) Putatively characterized: based on characteristic physicochemical properties of a chemical class of compounds, or spectral similarity to known compounds of a chemical class. (4) Unknown. Based on the standardized format, a framework for automated structural elucidation is required to explore the structural diversity of phytochemicals. However, several technical issues must be solved before database-assisted elucidation of metabolite structures (Kind and Fiehn, 2010; Neumann and Bocker, 2010). One bottleneck is represented by a shortage of standard compounds and their associated MS/MS spectra data. Owing to the poor availability of plant secondary metabolites, only a very low percentage of the observed metabolite signals can be assigned by comparison of the chromatographic behavior with chemical reference standards (Matsuda et al., 2010a). Although great effort has been put into construction of the MS/MS spectral databases (Moco et al., 2006; Wishart et al., 2007; Horai et al., 2010), further enrichment is required for structural elucidation of the wider range of metabolites. Another difficulty is the low reproducibility of the structure-related information. For instance, the fragment patterns in MS/MS spectra depend on the mass spectrometers and their operating conditions. The error derived from the analysis also exists in the high-resolution mass spectral data (Mihaleva et al., 2008; Matsuda et al., 2009b). Owing to these technical problems, elucidation of the structure associated with signals corresponding to metabolomes is time consuming, which has hampered the investigation of phytochemical diversity across plant species or ecotypes.
In this study, a novel framework for the automated elucidation of metabolite structures in LC–MS metabolome data was constructed by integrating three different databases. To overcome the aforementioned problems, the MS/MS spectra databases were enriched using literature reported information. Additionally, the high-resolution MS/MS spectra data were redundantly acquired from each metabolite signal to improve the quality of structure-related information that was used to search the databases. The outputs were retrieved using the CAS metabolite identifier for identification and putative annotation. A simple metabolite ontology system was also introduced to enable putative characterization of the metabolite signals. The automated method developed here was applied for metabolome data sets obtained from the rosette leaves of 20 Arabidopsis accessions, from which phenotypic variations in novel Arabidopsis metabolites among these accessions could be investigated.
Materials and Methods
Plant Materials
Seeds of 20 accessions of Arabidopsis thaliana, CS22676 Bay-0, CS22677 Bor-4, CS22678 Br-0, CS22679 Bur-0, CS22680 C24, CS22681 Col-0, CS22682 Cvi-0, CS22683 Est-1, CS22684 Fei-0, CS22685 Goettingen-7, CS22686 Ler-1, CS22687 NFA-8, CS22688 RRS-7, CS22689 RRS-10, CS22690 Sha, CS22691 Tamm-2, CS22692 Ts-1, CS22693 Tsu-1, CS22694 Van-0, and CS22695 Lov-5, were obtained from the ABRC. The seeds were soaked on MS agar plates and then incubated at 22°C under 16 h day and 8 h night conditions. At 18 days after germination, the aerial parts of the seedlings were harvested.
Metabolome Analysis Using LC-ESI-Q-Tof/MS
The collected sample tissues were weighed and stored at −80°C until analysis. The frozen tissues of independent plants were homogenized in five volumes of 80% aqueous methanol containing 0.1% acetic acid, 0.5 mg/l of lidocaine, and d-camphor sulfonic acid (Tokyo Kasei, Tokyo, Japan) using a mixer mill (MM 300, Retsch) with a zirconia bead for 6 min at 20 Hz. Next, the samples were centrifuged at 15,000 g for 10 min and filtered (Ultrafree-MC filter, 0.2 μm; Millipore, Bedford, MA, USA). The sample extracts were then applied to an HLB μElution plate (Waters, Milford, MA, USA) that had been equilibrated with 80% aqueous methanol containing 0.1% acetic acid. The eluates (3 μl) were subsequently subjected to metabolome analysis by LC coupled with electrospray quadrupole time-of-flight tandem MS using an Acquity BEH ODS column (LC-ESI-Q-Tof/MS, HPLC: Waters Acquity UPLC system; MS: Waters Q-Tof Premier). The metabolome analysis and data processing were conducted according to a previously described method (Matsuda et al., 2009c, 2010a). Briefly, the metabolome data were obtained in the negative ion mode (m/z 100–2,000; dwell time: 0.45 s; interscan delay: 0.05 s, centroid), from which a data matrix was generated with the aid of MetAlign (De Vos et al., 2007; Lommen, 2009). In order to reduce a redundancy of the data matrix, fragment ions were removed by a following procedure. A metabolite signal was removed from the matrix when there is another intense peak eluted at similar retention times [within the retention time threshold (<0.5 s)] with the highest correlation coefficient above the threshold value (>0.8). The analysis was conducted using five biological replicates of 20 accessions, from which a data matrix composed of 703 signals (peaks) was obtained (Table S1 in Supplementary Material). The number of signals would not reflect an exact number of detected metabolites due to the complex nature of the metabolome data.
To construct MS2T libraries, the extracts of five ecotypes were mixed and utilized for the MS2T data acquisition. The analyses were repeatedly conducted for four mixtures by previously described methods (Matsuda et al., 2009c). Each MS2T entry was assigned a unique accession code, such as ATH10n03690, in which ATH10n is the name of the library and 03690 is the entry number. All data obtained in this study are available at the PRIMe website1 (Akiyama et al., 2008).
Databases and Software
The ReSpect (RIKEN MS/MS spectra database for phytochemicals; 2011 January version), KNApSAcK (2010.12.24 version; Shinbo et al., 2006; Takahashi et al., 2008), and PRIMe standard compound database (2009 November version) were used in this study. The genetic polymorphism data from 20 Arabidopsis accessions were downloaded from the TAIR web site (Clark et al., 2007; Poole, 2007). All data processing procedures were conducted using the in-house script written with Perl. Structural elucidation work was performed in-batch search for all metabolite signals.
In the automated structural elucidation procedure, several thresholds were required to conduct the database searches. The thresholds used in this study are described in Figures 2 and 3. To search the MS/MS spectra, the similarity scores were determined by employing dot product method with mass tolerance at 0.5 Da (Stein and Scott, 1994). The two spectra were considered to be the similar when the similarity score was greater than 0.6. For hierarchical clustering analysis, log2-transformed Z-scored signal intensity data were processed using MEV version 4.4 (Saeed et al., 2003, 2006).
Results
Acquisition of Metabolome Data from 20 Arabidopsis Accessions
To investigate variations in the composition of secondary metabolites among Arabidopsis strains (accessions), metabolic profile data were obtained from the rosette leaves of 20 accessions of Arabidopsis by LC-ESI-Q-Tof/MS analysis (Matsuda et al., 2009c, 2010a). The 20 diverse accessions evaluated herein were previously selected by Clark et al. (2007) to investigate the genetic variations within the population of Arabidopsis. The analysis was conducted using five biological replicates of 20 accessions, from which a data matrix composed of 703 metabolite signals (peaks) was obtained (Table S1 in Supplementary Material). Here, the dataset was designed as AtMetExpress 20 Ecotypes and each metabolite signal was addressed by a unique ID, such as aen00884. Hierarchical clustering analysis of the dataset revealed that there were large variations in the metabolic profiles across 20 accessions, which should be derived from those genetic polymorphisms (Figure 1). To acquire information for structural elucidation of those metabolite signals, MS/MS spectra data were obtained from identical extracts by using the automated data acquisition methods described in Section “Materials and Methods.” Since the analyses were conducted repeatedly, multiple MS/MS spectra data were recorded for each metabolite signal (Matsuda et al., 2009c). Consequently, MS/MS spectral tag (MS2T) libraries containing 126,889 accessions were constructed (Table 1). Each MS2T entry was assigned a unique ID such as ATH67n06391. Based on the MS2T data, the structure of each metabolite signal was elucidated by searching the databases.
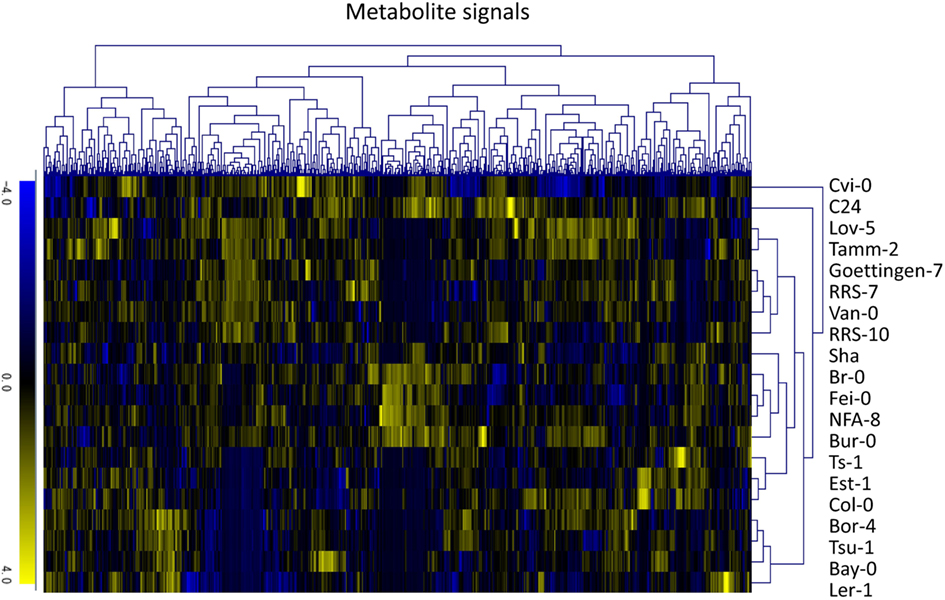
Figure 1. Hierarchical clustering analysis of metabolic profile data of the AtMetExpress 20 ecotype dataset. Log2-transformed and Z-scored signal intensity data were hierarchically classified using the average linkage clustering methods.
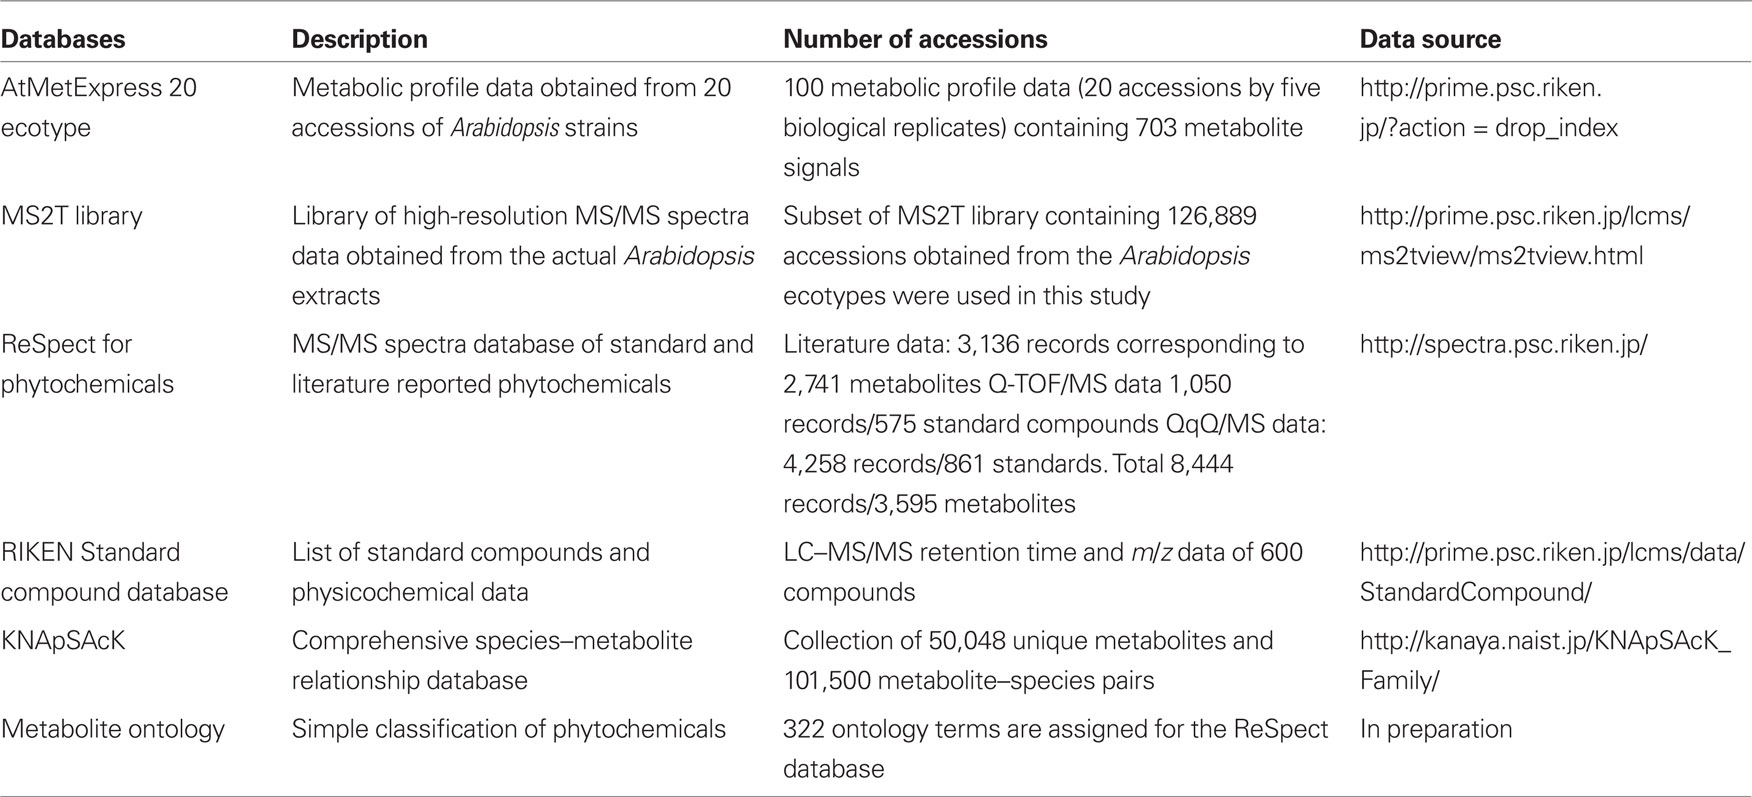
Table 1. List of databases and datasets used in this study.
Preparation of Standard Compound Databases and the Compound Ontology System
Three distinct databases, KNApSAcK, ReSpect, and the PRIMe standard compound database, were employed for the structural elucidation (Table 1). ReSpect is a new web data resource that incorporates records from existing literature as well as the MS/MS data from our standard compounds. This database contains 8,444 records corresponding to 3,595 metabolites. ReSpect is the first tool for annotation of phytochemicals that is based on downloadable MS/MS data resources and databases (Sawada et al., in preparation). KNApSAcK is a comprehensive species–metabolite relationship database developed by the Kanaya lab in NAIST (Shinbo et al., 2006; Takahashi et al., 2008). KNApSAcK contains the structural data of 50,048 metabolites and 101,500 metabolite–species pairs. In this study, KNApSAcK was used to elucidate molecular formulas of candidate metabolites from the high-resolution mass spectra data. The PRIMe standard compound database contains a retention time and m/z data of 600 authentic compounds acquired using an identical analytical method (Matsuda et al., 2009c). For the automated metabolite annotations, accessions in these databases were assigned with corresponding CAS identifiers.
Since CAS identifiers basically address a structurally confirmed metabolites (Matsuda et al., 2009a), the metabolite annotation procedure based on the identifier cannot deal with information describing partially characterized metabolites. For example, the metabolite structures were often estimated to be from a compound class such as “kaempferol glycoside” and “amino acid derivative” (Bottcher et al., 2007; Iijima et al., 2008; Matsuda et al., 2010a). In the case of gene annotation, each gene was tentatively annotated by gene ontology terms that were manually assigned or automatically estimated from the sequence similarities. Although detailed compound ontology systems and vocabularies have been developed using several databases such as CheBi and KEGG (Degtyarenko et al., 2008; Kanehisa et al., 2008; Matsuda et al., 2009a), a simple compound ontology system was newly introduced in this study to cover the wide range of phytochemicals. Here entries in the PRIMe databases were classified within three levels, ranging from basic (Class 1) to detailed (Class 3) with considering the basic skeleton and modified parts of metabolites (Table S2 in Supplementary Material). The ontology terms prepared in this study is not comprehensive, since the classification system was arbitrary prepared by manually curating the entries of ReSpect MS/MS spectra database for an assistance of structural elucidation of metabolome data. For instance, partially characterized metabolites could be classified as follows: kaempferol-3,7-dirhamnoside is a member of Class 1: flavonoid, Class 2: flavonol, and Class 3: kaempferol glycoside; tryptophan is a member of Class 1: amino acid and Class 2: tryptophan; and pinoresinol-dihexoside is a member of Class 1: phenylpropanoid, Class 2: lignan, and Class 3: pinoresinol glycoside.
These metabolite classifications have been assigned to all accessions in the ReSpect and PRIMe standard compound databases. A detailed classification study is currently in progress for KNApSAcK, and 60% of the accessions in this database have been assigned to Class 1 or 2.
Identification and Putative Annotation Using Cas Identifiers
Based on the MS2T libraries and reference databases, the metabolite signals in the AtMetExpress 20 ecotypes dataset were identified or putatively annotated using the following automated procedure. For the case of a metabolite signal assigned as aen00884 (Rt 3.82 and m/z 422), the MS2T library contains 19 MS2T accessions acquired from the identical metabolite signal with various spectral quality (Figure 2A). In other words, the metabolite signal was tagged with 19 accessions of corresponding MS2Ts. Each MS2T accession consists of the exact mass number of the precursor ion and MS/MS spectra data. Thus, MS/MS spectra data were submitted to the ReSpect database to identify metabolites producing similar MS/MS spectra. In the case of the MS2T accession, ATH67n06391, the MS/MS spectrum was similar to that of 13 compounds whose CAS numbers are obtained as search results (Figure 2B). Additionally, the exact mass number of the precursor ion was used to search the KNApSAcK database to find metabolites possessing a highly similar mass number, by which the CAS number of 1 metabolite was obtained. A common CAS number (499-30-9, 2-phenylglucolsinolate) observed in the outputs of both the ReSpect and KNApSAcK searches indicated that it is a candidate structure of the metabolite signal deduced from the MS2T data. To improve the search quality, the procedure was repeated for all 19 MS2T accessions, and the same results were observed for 11 MS2Ts. Since identical metabolites were elucidated using two distinct search methods with high reproducibility (>50%), it is likely that the metabolite signal was derived from 2-phenylethylglucosinolate or its structural isomers. Based on the MSI standard, the metabolite signal could be putatively annotated using the automated structure elucidation procedure (Figure 2D).
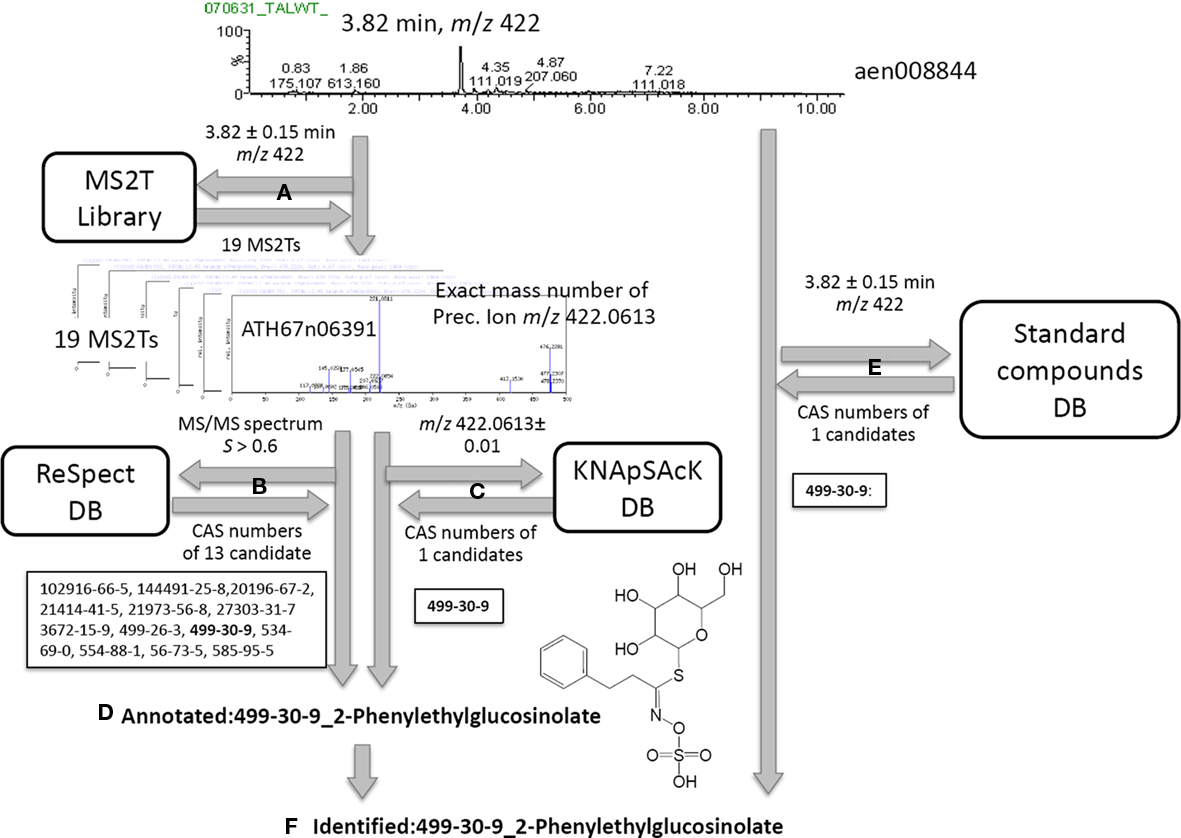
Figure 2. Procedure for peak identification and putative annotation using CAS identifiers. For the case of a metabolite signal, aen00884, the MS2T library contains 19 MS2T accessions acquired from the identical metabolite signal (A). MS/MS spectra data in MS2T were submitted to the ReSpect database (B). The exact mass number data of the precursor ion was used to search the KNApSAcK database (C). Since a common CAS number (499-30-9, 2-phenylglucolsinolate) in the outputs of both searches were observed for 11 MS2Ts, the metabolite signal was putatively annotated as 2-phenylethylglucosinolate (D). Since the authentic compound of 2-phenylethylglucosinolate,CAS 499-30-9, was also detected at a similar retention time and mass number, the metabolite signal was identified as 2-phenylethylglucosinolate (F).
Furthermore, an automated search of the PRIMe standard compound database revealed that the authentic compound of 2-phenylethylglucosinolate, CAS 499-30-9, was also detected at a similar retention time and mass number as the queried metabolite signal. Since three distinct pieces of information, including the MS/MS spectra, exact mass number, and chromatographic behavior, were matched to the identical metabolite, the metabolite signal was identified as 2-phenylethylglucosinolate (Figure 2F).
Among the 703 metabolite signals in the AtMetExpress 20 ecotype dataset, 25 and 106 peaks could be identified and putatively annotated, respectively, using the procedure described above (Table S1 in Supplementary Material). Additionally, comparison with the manually curated results produced in our previous study (Matsuda et al., 2010a) revealed no significant error among the 32 commonly annotated metabolite signals.
Processing of Putatively Characterized Metabolites
In addition to the identification and putative annotation using the CAS metabolite identifiers, putative characterization of the metabolite signals was conducted by introducing the metabolite ontology system. The procedure is explained using the metabolite signal described above as an example (peak ID: aen008844). For each MS2T accession tagged to the metabolite signal, MS/MS spectra data and the exact mass number were used for ReSpect (Figure 3A) and KNApSAcK (Figure 3B) searches. The compound ontology information instead of CAS identifiers was obtained as outputs in these procedures. The outputs of KNAsSAcK and ReSpect searches were compared to identify a common result, which is a compound ontology estimated from the MS2T accession. Repeated searching for 19 MS2T accessions of aen008844 resulted in 11 MS2Ts being identified as glucosinolate based on the Class 1 ontology. The Class 2 ontology benzylglucosinolate was not accepted, because the result was estimated from only 2 MS2T accessions. Using the procedure, the metabolite signal was successfully characterized as glucosinolate based on the Class 1 ontology (Figure 3C).
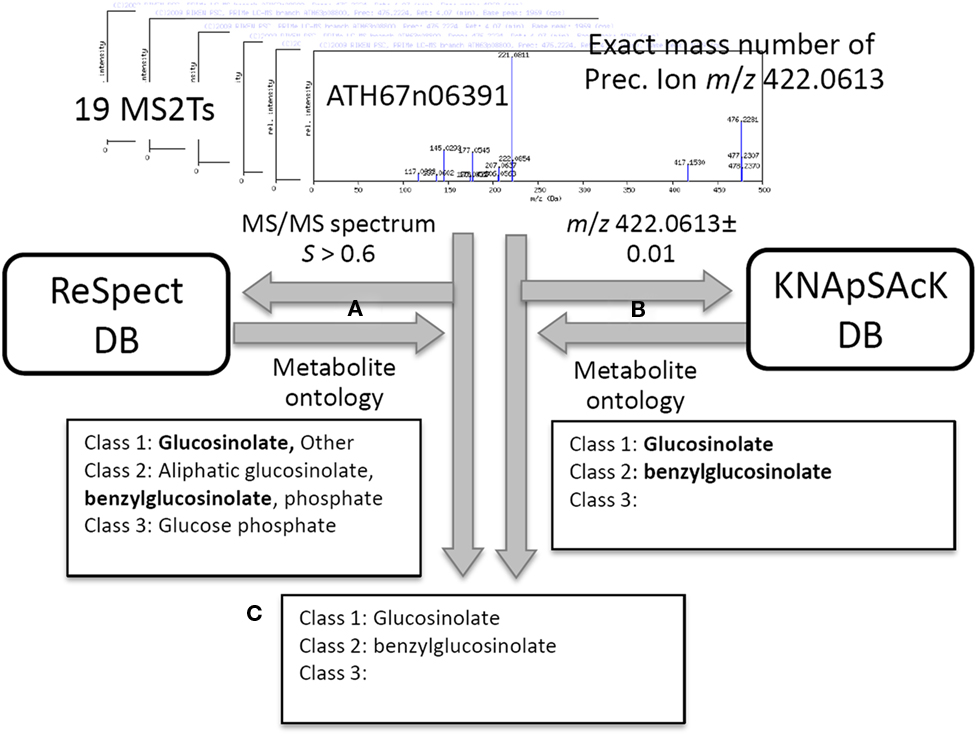
Figure 3. Procedure for putative characterization of metabolite signal using metabolite ontology. For 19 MS2T accessions tagged to the metabolite signal, aen008844, MS/MS spectra data and the exact mass number were used for ReSpect (A) and KNApSAcK (B) searches. The compound ontology information in KNAsSAcK and ReSpect searches were compared to identify a common result. Repeated searching for 19 MS2T accessions resulted in 11 MS2Ts being identified as glucosinolate based on the Class 1 ontology (C).
This procedure was conducted for all metabolite signals of the AtMetExpress 20 Ecotype dataset, and 188 among 703 metabolite signals were automatically characterized. In the case of Class 1 ontology, 1 alkaloids, 7 amino acids, 33 flavonoids, 68 glucosinolates, 47 phenylpropanoids, 4 terpenoids, and 28 other characterizations were assigned to the metabolome data (Table S2 in Supplementary Material).
Structural Elucidation of Metabolite Signals Using the Database Search Results
Based on the results obtained using the automated methods, the structures of the novel Arabidopsis metabolites were manually elucidated. Among the putatively characterized metabolite signals, the metabolite signal aen006966 (Rt 4.051 min and m/z 369) was putatively characterized as being in Class 1: phenylpropanoid. The MS/MS spectral data for ATH67n05643 (Figure 4A) indicated that the metabolite would be a coumarin hexoside based on the fragment pattern. An additional KNApSAcK search suggested that a plausible candidate of the metabolite is fraxin (CAS 524-32-1), although the position of glycosylation is unclear. Using a similar procedure, a metabolites putatively characterized as Class 1: phenylpropanoid (aen012096: Rt 3.848 min, m/z 501) were found to be malonyl-hexosyl-sinapate (Figure 4B).
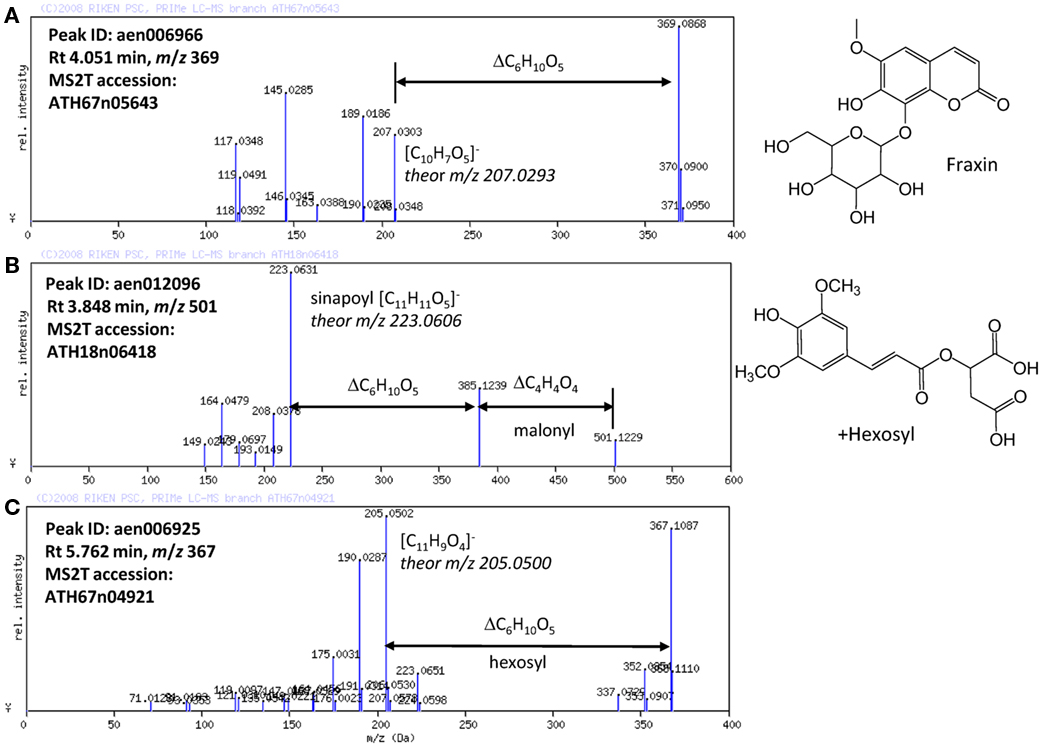
Figure 4. MS/MS spectra of putatively characterized metabolites. The predicted molecular formulas of key fragments, neutral losses, and elucidated structures of (A) putative fraxin, (B) hexosylsinapoylmalate, and (C) hexosyl-coumarin are shown in the figure.
Structural elucidation of the putative phenylpropanoid aen006925 (Rt 5.762, m/z 367) indicated that this metabolite is a hexoside of an unknown aglycon (Figure 4C). Because the molecular formula of the aglycone was deduced to be C11H9O4 (m/z 205.0502 obsd, m/z 205.0500 theor), the aglycone should be a methylated hydroxy-coumarin (according to the presence of four oxygen atoms, aglycone should contain at least two hydroxy-groups on the coumarin moiety), or dimethoxycoumarin. Thus, the compound aen006925 can be a glycoside (or C-glycoside) of these two aglycones, both of which are novel Arabidopsis metabolites. While strict structural elucidation must be conducted following the protocols accepted for natural product chemistry (Nakabayashi et al., 2009; Matsuda et al., 2010b), the results presented here demonstrate that a portion of the phytochemical diversity in Arabidopsis could be elucidated from MS/MS spectra via automated structural elucidation.
Phenotypic Variations across Arabidopsis Accessions
The structural elucidation based on the compound ontology information enabled us to deal with putatively characterized metabolite signals such as glucosinolates and flavonoids without strict metabolite identification or annotation. Here, the natural variations in accumulation levels among 20 Arabidopsis accessions were compared for metabolites belonging to lignan, amino acids, flavonoids, and glucosinolate (Figure 5). The metabolites assigned by lignan (Figure 5A) and amino acid (Figure 5B) were constitutively accumulated with small natural variations, suggesting that the production of those metabolites is essential for Arabidopsis (Matsuda et al., 2010a). Indeed, more than 10 genes encoding the dirigent protein for lignan biosynthesis are present in the Arabidopsis genome (Burlat et al., 2001; Davin and Lewis, 2005; Nakatsubo et al., 2008). This redundancy would contribute to the constitutive production of lignans, although the details regarding their physiological role in the growth of Arabidopsis remain unknown. In contrast, the metabolites identified as flavonoids (Figure 5C) and glucosinolates (Figure 5D) tended to show larger natural variations among the 20 accessions. These results suggest that the levels of flavonoids and glucosinolates in rosette leaves are controlled by genetic polymorphisms, which would contribute to the adaptation of each accession to local environments (Li et al., 2008; Bednarek and Osbourn, 2009; Janowitz et al., 2009; Sawada et al., 2009; Manzaneda et al., 2010; De Kraker and Gershenzon, 2011). To investigate the association between large variations in metabolic phenotypes and genetic polymorphisms, we considered the levels of 3-hydroxy-n-propylglucosinolate (aen007244) among 20 accessions. Despite significant production of Bor-4, Tsu-1, Bay-0, and Ler-1, the glucosinolate was not detected from other accessions, including Col-0 (Figure 6A). Single nucleotide polymorphisms (SNPs) that commonly occurred in Bor-4, Tsu-1, Bay-0, and Ler-1, as well as did not occurred in other accessions, were searched against the re-sequence data produced by Clark et al. (2007). The results revealed that 80 SNPs of 96 corresponding SNPs formed a linkage disequilibrium (LD) block along the long arm of chromosome 4 (Figure 6B). Among the 28 ORFs in the 11-kb region (from At4g02870 to At4g03090), there is an enzyme gene responsible for the last step of hydroxyalkylglucosinolate biosynthesis (AOP3, At4g03050). Although the biological meaning of the LD are unclear, the association between the natural variations in the 3-hydroxy-n-propylglucosinolate levels and genetic polymorphisms in the AOP3 gene has been reported (Kliebenstein et al., 2001; Wentzell et al., 2007).
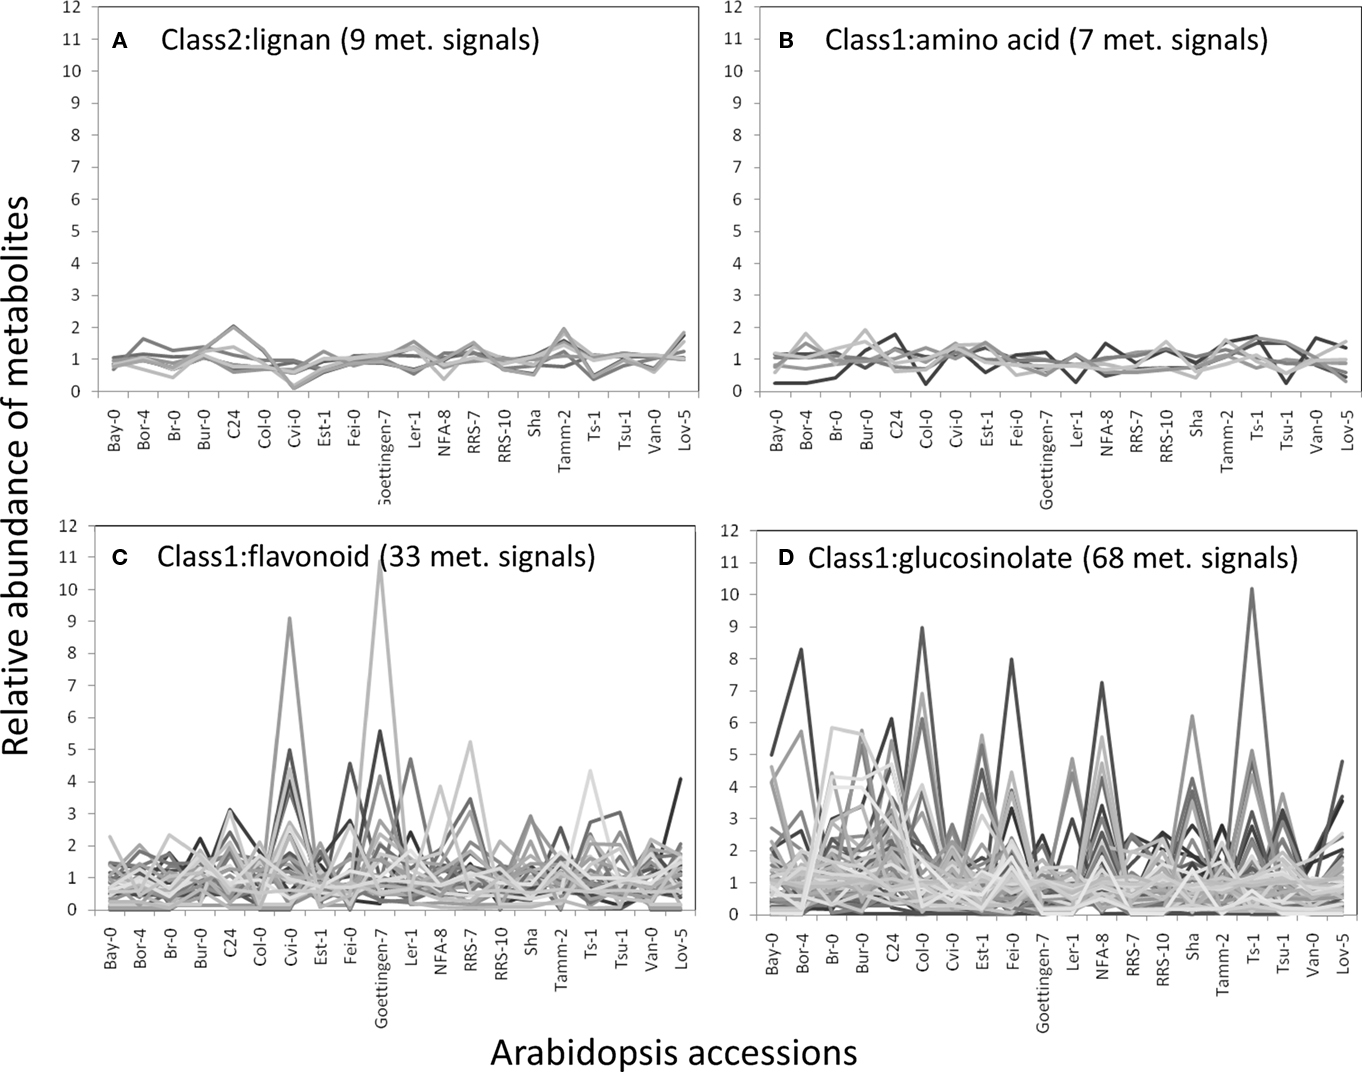
Figure 5. Natural variation in metabolite levels among 20 Arabidopsis accessions belonging to lignan (A), amino acid (B), flavonoid (C), and glucosinolate (D). The relative abundances of metabolites were determined by dividing each metabolite level by the average level.
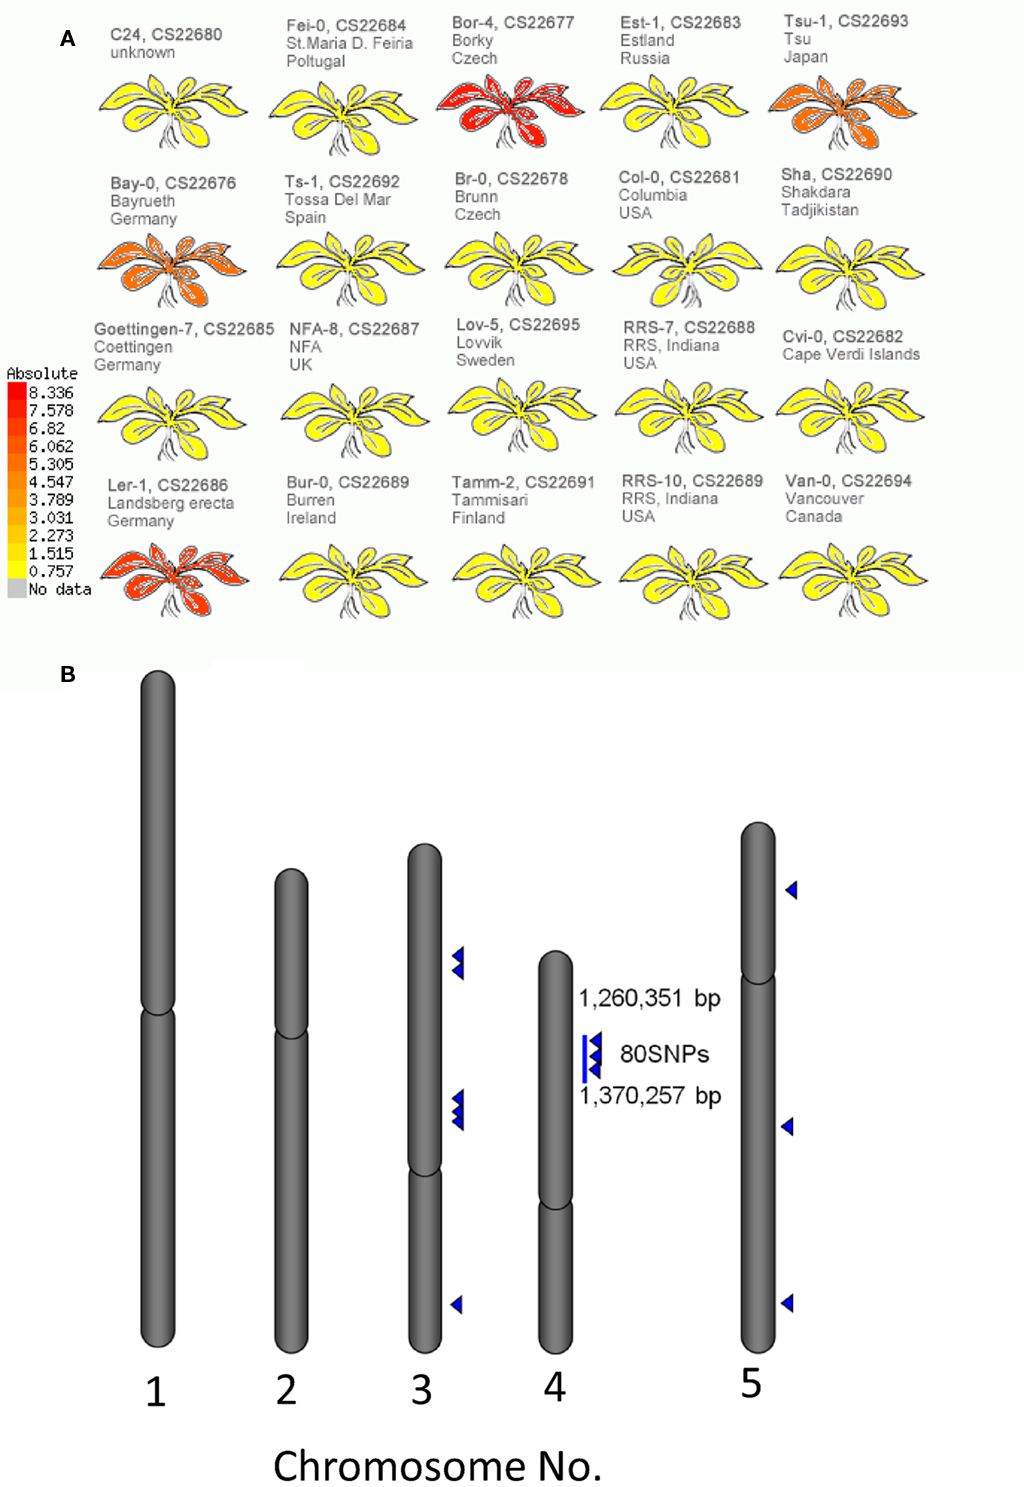
Figure 6. Association between levels of 3-hydroxy-n-propylglucosinolate and single nucleotide polymorphisms (SNPs) across 20 accessions of Arabidopsis. (A) Heat-map representation of 3-hydroxy-n-propylglucosinolate levels in each accession. (B) Positions of SNPs associated with 3-hydroxy-n-propylglucosinolate levels on the Arabidopsis genome. Blue triangles indicate positions of the SNPs.
Discussion
A framework for the automated structural elucidation of LC–MS metabolome data was developed to investigate the structural diversity of phytochemicals. Although the framework requires a large amount of structure-related information (MS2T library) and intensive searches of large databases (Figures 2 and 3), the processing of the AtMetExpress 20 ecotype dataset (Figure 1) demonstrated that the method is able to reasonably estimate metabolite structures. By referring to the automatically assigned information, the effort required for the manual curation of metabolome data could be drastically reduced (Figure 4), which accelerated the investigation of natural variations in the Arabidopsis secondary metabolites (Figures 5 and 6). These results demonstrated that the framework is effective for the structural elucidation of LC–MS metabolome data, although several technical improvements are required for more comprehensive annotation of the metabolites.
Since the MS/MS spectra database is one of the most important kernels in the framework (Figures 3 and 4), the search results are highly dependent on the database quality. For example, processing of the AtMetExpress 20 ecotype dataset failed to identify metabolites belonging to alkaloids and terpenoids, probably because the current version of ReSpect contains poor entries of those metabolites in contrast to the rich flavonoids and glucosinolates data2. This bias is derived from the available standard compounds and published MS/MS spectra data. However, the data dependency indicated that further enrichment of the MS/MS spectra database by the addition of alkaloids, terpenoids, and other phytochemicals could directly improve the results of the structural elucidation. To promote the integration and sharing of spectral data, all ReSpect contents were opened to the public from the PRIME Web site (Table 1).
Structures elucidated by an automated method should contain incorrect hits derived from errors in mass analyses, indicating that the false discovery rate (FDR) of large-scale search results must be evaluated (Matsuda et al., 2009b; Saito and Matsuda, 2010). In the case of the homology searches of gene sequences, the levels of FDR could be controlled using a probability-based searching algorithm such as BLAST (Altschul and Erickson, 1985). In this study, the cosine product (dot product) method was employed to search MS/MS spectra because it is robust enough to identify identical spectra (Stein and Scott, 1994). A drawback of this method is a FDR control since the similarity score is not based on probability. To reduce false positives, the output obtained from the ReSpect search was compared with that derived from KNApSAcK to identify common results (Figures 2 and 3). The cross-check strategy should reduce false-positive hits, but many metabolite signals were assigned with no structural information. In the case of the AtMetExpress 20 Ecotype dataset, 94% of 703 metabolite signals were tagged by at least one MS2T, and the metabolite structures could be somehow estimated for approximately 30% of the signals (Table S1 in Supplementary Material). Further development of a probability-based algorithm to determine the similarity between MS/MS spectra is required to increase the numbers of structurally elucidated metabolite signals while controlling FDR (Mylonas et al., 2009).
In the framework developed herein, putative characterization of the metabolite signal could be attained by introducing a new simple ontology system to cover the wider range of plant metabolites. Additionally, the performance of the ontology system was demonstrated for the AtMetExpress 20 ecotype datasets, which revealed the diversity of secondary metabolites in Arabidopsis based on structural elucidation using the putatively characterized information. The comparison of levels of putatively characterized metabolites revealed the genetic background of metabolotype variations, which would facilitate the analysis of these associations with genetic polymorphism and evolution.
Conflict of Interest Statement
The authors declare that the research was conducted in the absence of any commercial or financial relationships that could be construed as a potential conflict of interest.
Acknowledgments
We would like to thank Drs. K. Hanada, K. Akiyama, T. Sakurai, R. Niida, and A. Takahashi (RIKEN PSC) for their useful comments regarding this manuscript and their technical support. This work was partly supported by a grant from the Ministry of Agriculture, Forestry and Fisheries of Japan (Genomics for Agricultural Innovation, NVR-0005).
Supplementary Material
The Supplementary Material for this article can be found online at http://www.frontiersin.org/Plant_Physiology/10.3389/fpls.2011.00040/abstract/
Footnotes
References
Akiyama, K., Chikayama, E., Yuasa, H., Shimada, Y., Tohge, T., Shinozaki, K., Hirai, M. Y., Sakurai, T., Kikuchi, J., and Saito, K. (2008). PRIMe: a web site that assembles tools for metabolomics and transcriptomics. In Silico Biol. 8, 339–345.
Altschul, S. F., and Erickson, B. W. (1985). Significance of nucleotide sequence alignments: a method for random sequence permutation that preserves dinucleotide and codon usage. Mol. Biol. Evol. 2, 526–538.
Bednarek, P., and Osbourn, A. (2009). Plant-microbe interactions: chemical diversity in plant defense. Science 324, 746–748.
Bottcher, C., Roepenack-Lahaye, E. V., Willscher, E., Scheel, D., and Clemens, S. (2007). Evaluation of matrix effects in metabolite profiling based on capillary liquid chromatography electrospray ionization quadrupole time-of-flight mass spectrometry. Anal. Chem. 79, 1507–1513.
Burlat, V., Kwon, M., Davin, L. B., and Lewis, N. G. (2001). Dirigent proteins and dirigent sites in lignifying tissues. Phytochemistry 57, 883–897.
Clark, R. M., Schweikert, G., Toomajian, C., Ossowski, S., Zeller, G., Shinn, P., Warthmann, N., Hu, T. T., Fu, G., Hinds, D. A., Chen, H., Frazer, K. A., Huson, D. H., Scholkopf, B., Nordborg, M., Ratsch, G., Ecker, J. R., and Weigel, D. (2007). Common sequence polymorphisms shaping genetic diversity in Arabidopsis thaliana. Science 317, 338–342.
Davin, L. B., and Lewis, N. G. (2005). Lignin primary structures and dirigent sites. Curr. Opin. Biotechnol. 16, 407–415.
De Kraker, J. W., and Gershenzon, J. (2011). From amino acid to glucosinolate biosynthesis: protein sequence changes in the evolution of methylthioalkylmalate synthase in Arabidopsis. Plant Cell 23, 38–53.
De Vos, R. C., Moco, S., Lommen, A., Keurentjes, J. J., Bino, R. J., and Hall, R. D. (2007). Untargeted large-scale plant metabolomics using liquid chromatography coupled to mass spectrometry. Nat. Protoc. 2, 778–791.
Degtyarenko, K., De Matos, P., Ennis, M., Hastings, J., Zbinden, M., Mcnaught, A., Alcantara, R., Darsow, M., Guedj, M., and Ashburner, M. (2008). ChEBI: a database and ontology for chemical entities of biological interest. Nucleic Acids Res. 36, D344–350.
Fiehn, O., Robertson, D., Griffin, J., Werf, M. V. D., Nikolau, B., Morrison, N., Sumner, L. W., Goodacre, R., Hardy, N. W., Taylor, C., Fostel, J., Kristal, B., Kaddurah-Daouk, R., Mendes, P., Ommen, B. V., Lindon, J. C., and Sansone, S.-A. (2007). The metabolomics standards initiative (MSI). Metabolomics 3, 175–178.
Horai, H., Arita, M., Kanaya, S., Nihei, Y., Ikeda, T., Suwa, K., Ojima, Y., Tanaka, K., Tanaka, S., Aoshima, K., Oda, Y., Kakazu, Y., Kusano, M., Tohge, T., Matsuda, F., Sawada, Y., Hirai, M. Y., Nakanishi, H., Ikeda, K., Akimoto, N., Maoka, T., Takahashi, H., Ara, T., Sakurai, N., Suzuki, H., Shibata, D., Neumann, S., Iida, T., Tanaka, K., Funatsu, K., Matsuura, F., Soga, T., Taguchi, R., Saito, K., and Nishioka, T. (2010). MassBank: a public repository for sharing mass spectral data for life sciences. J. Mass Spectrom. 45, 703–714.
Iijima, Y., Nakamura, Y., Ogata, Y., Tanaka, K., Sakurai, N., Suda, K., Suzuki, T., Suzuki, H., Okazaki, K., Kitayama, M., Kanaya, S., Aoki, K., and Shibata, D. (2008). Metabolite annotations based on the integration of mass spectral information. Plant J. 54, 949–962.
Janowitz, T., Trompetter, I., and Piotrowski, M. (2009). Evolution of nitrilases in glucosinolate-containing plants. Phytochemistry 70, 1680–1686.
Kanehisa, M., Araki, M., Goto, S., Hattori, M., Hirakawa, M., Itoh, M., Katayama, T., Kawashima, S., Okuda, S., Tokimatsu, T., and Yamanishi, Y. (2008). KEGG for linking genomes to life and the environment. Nucleic Acids Res. 36, D480–D484.
Keurentjes, J. J., Fu, J., De Vos, C. H., Lommen, A., Hall, R. D., Bino, R. J., Van Der Plas, L. H., Jansen, R. C., Vreugdenhil, D., and Koornneef, M. (2006). The genetics of plant metabolism. Nat. Genet. 38, 842–849.
Kind, T., and Fiehn, O. (2010). Advances in structure elucidation of small molecules using mass spectrometry. Bioanal. Rev. 2, 23–60.
Kliebenstein, D. J., Lambrix, V. M., Reichelt, M., Gershenzon, J., and Mitchell-Olds, T. (2001). Gene duplication in the diversification of secondary metabolism: tandem 2-oxoglutarate-dependent dioxygenases control glucosinolate biosynthesis in Arabidopsis. Plant Cell 13, 681–693.
Li, J., Hansen, B. G., Ober, J. A., Kliebenstein, D. J., and Halkier, B. A. (2008). Subclade of flavin-monooxygenases involved in aliphatic glucosinolate biosynthesis. Plant Physiol. 148, 1721–1733.
Lommen, A. (2009). MetAlign: interface-driven, versatile metabolomics tool for hyphenated full-scan mass spectrometry data preprocessing. Anal. Chem. 81, 3079–3086.
Manzaneda, A. J., Prasad, K. V., and Mitchell-Olds, T. (2010). Variation and fitness costs for tolerance to different types of herbivore damage in Boechera stricta genotypes with contrasting glucosinolate structures. New Phytol. 188, 464–477.
Matsuda, F., Hirai, M. Y., Sasaki, E., Akiyama, K., Yonekura-Sakakibara, K., Provart, N. J., Sakurai, T., Shimada, Y., and Saito, K. (2010a). AtMetExpress development: a phytochemical atlas of Arabidopsis development. Plant Physiol. 152, 566–578.
Matsuda, F., Ishihara, A., Takanashi, K., Morino, K., Miyazawa, H., Wakasa, K., and Miyagawa, H. (2010b). Metabolic profiling analysis of genetically modified rice seedlings that overproduce tryptophan reveals the occurrence of its inter-tissue translocation. Plant Biotechnol. 27, 17–27.
Matsuda, F., Redestig, H., Sawada, Y., Shinbo, Y., Hirai, M. Y., Kanaya, S., and Saito, K. (2009a). Visualization of metabolite identifier information. Plant Biotechnol. 26, 479–483.
Matsuda, F., Shinbo, Y., Oikawa, A., Hira, M. Y., Fiehn, O., Kanaya, S., and Saito, K. (2009b). Assessment of metabolome annotation quality: a method for evaluating the false discovery rate of elemental composition searches. PLoS ONE 4, e7490. doi: 10.1371/journal.pone.0007490
Matsuda, F., Yonekura-Sakakibara, K., Niida, R., Kuromori, T., Shinozaki, K., and Saito, K. (2009c). MS/MS spectral tag (MS2T)-based annotation of non-targeted profile of plant secondary metabolites. Plant J. 57, 555–577.
Mihaleva, V. V., Vorst, O., Maliepaard, C., Verhoeven, H. A., Vos, R. C. H. D., Hall, R. D., and Ham, R. C. H. J. V. (2008). Accurate mass error correction in liquid chromatography time-of-flight mass spectrometry based metabolomics. Metabolomics 4, 171–182.
Moco, S., Bino, R. J., Vorst, O., Verhoeven, H. A., De Groot, J., Van Beek, T. A., Vervoort, J., and De Vos, C. H. (2006). A liquid chromatography-mass spectrometry-based metabolome database for tomato. Plant Physiol. 141, 1205–1218.
Moco, S., Bino, R. J., Vos, R. C. H. D., and Vervoort, J. (2007). Metabolomics technologies and metabolite identification. Trends Analyt. Chem. 26, 855–866.
Mylonas, R., Mauron, Y., Masselot, A., Binz, P. A., Budin, N., Fathi, M., Viette, V., Hochstrasser, D. F., and Lisacek, F. (2009). X-Rank: a robust algorithm for small molecule identification using tandem mass spectrometry. Anal. Chem. 81, 7604–7610.
Nakabayashi, R., Kusano, M., Kobayashi, M., Tohge, T., Yonekura-Sakakibara, K., Kogure, N., Yamazaki, M., Kitajima, M., Saito, K., and Takayama, H. (2009). Metabolomics-oriented isolation and structure elucidation of 37 compounds including two anthocyanins from Arabidopsis thaliana. Phytochemistry 70, 1017–1029.
Nakatsubo, T., Mizutani, M., Suzuki, S., Hattori, T., and Umezawa, T. (2008). Characterization of Arabidopsis thaliana pinoresinol reductase, a new type of enzyme involved in lignan biosynthesis. J. Biol. Chem. 283, 15550–15557.
Neumann, S., and Bocker, S. (2010). Computational mass spectrometry for metabolomics: identification of metabolites and small molecules. Anal. Bioanal. Chem. 398, 2779–2788.
Ossowski, S., Schneeberger, K., Clark, R. M., Lanz, C., Warthmann, N., and Weigel, D. (2008). Sequencing of natural strains of Arabidopsis thaliana with short reads. Genome Res. 18, 2024–2033.
Plantegenet, S., Weber, J., Goldstein, D. R., Zeller, G., Nussbaumer, C., Thomas, J., Weigel, D., Harshman, K., and Hardtke, C. S. (2009). Comprehensive analysis of Arabidopsis expression level polymorphisms with simple inheritance. Mol. Syst. Biol. 5, 242.
Saeed, A. I., Bhagabati, N. K., Braisted, J. C., Liang, W., Sharov, V., Howe, E. A., Li, J., Thiagarajan, M., White, J. A., and Quackenbush, J. (2006). TM4 microarray software suite. Meth. Enzymol. 411, 134–193.
Saeed, A. I., Sharov, V., White, J., Li, J., Liang, W., Bhagabati, N., Braisted, J., Klapa, M., Currier, T., Thiagarajan, M., Sturn, A., Snuffin, M., Rezantsev, A., Popov, D., Ryltsov, A., Kostukovich, E., Borisovsky, I., Liu, Z., Vinsavich, A., Trush, V., and Quackenbush, J. (2003). TM4: a free, open-source system for microarray data management and analysis. Biotechniques 34, 374–378.
Saito, K., and Matsuda, F. (2010). Metabolomics for functional genomics, systems biology, and biotechnology. Annu. Rev. Plant Biol. 61, 463–489.
Sawada, Y., Kuwahara, A., Nagano, M., Narisawa, T., Sakata, A., Saito, K., and Hirai, M. Y. (2009). Omics-based approaches to methionine side chain elongation in Arabidopsis: characterization of the genes encoding methylthioalkylmalate isomerase and methylthioalkylmalate dehydrogenase. Plant Cell Physiol. 50, 1181–1190.
Shinbo, Y., Nakamura, Y., Altaf-Ul-Amin, M., Asahi, H., Kurokawa, K., Arita, M., Saito, K., Ohta, D., Shibata, D., and Kanaya, S. (2006). “KNApSAcK: A comprehensive species-metabolite relationship database,” in Biotechnology in Agriculture and Forestry 57 Plant Metabolomics, eds K. Saito, R. A. Dixon, and L. Willmitzer (Berlin: Springer), 165–181.
Stein, S. E., and Scott, D. R. (1994). Optimization and testing of mass-spectral library search algorithms for compound identification. J. Am. Soc. Mass Spectrom. 5, 859–866.
Sumner, L. W., Amberg, A., Barrett, D., Beale, M. H., Beger, R., Daykin, C. A., Fan, T. W.-M., Fiehn, O., Goodacre, R., Griffin, J. L., Hankemeier, T., Hardy, N., Harnly, J., Higashi, R., Kopka, J., Lane, A. N., Lindon, J. C., Marriott, P., Nicholls, A. W., Reily, M. D., Thaden, J. J., and Viant, M. R. (2007). Proposed minimum reporting standards for chemical analysis. Metabolomics 3, 211–221.
Takahashi, H., Kai, K., Shinbo, Y., Tanaka, K., Ohta, D., Oshima, T., Altaf-Ul-Amin, M., Kurokawa, K., Ogasawara, N., and Kanaya, S. (2008). Metabolomics approach for determining growth-specific metabolites based on Fourier transform ion cyclotron resonance mass spectrometry. Anal. Bioanal. Chem. 391, 2769–2782.
Weigel, D., and Mott, R. (2009). The 1001 genomes project for Arabidopsis thaliana. Genome Biol. 10, 107.
Wentzell, A. M., Rowe, H. C., Hansen, B. G., Ticconi, C., Halkier, B. A., and Kliebenstein, D. J. (2007). Linking metabolic QTLs with network and cis-eQTLs controlling biosynthetic pathways. PLoS Genet. 3, e162. doi: 10.1371/journal.pgen.0030162
Wishart, D. S., Tzur, D., Knox, C., Eisner, R., Guo, A. C., Young, N., Cheng, D., Jewell, K., Arndt, D., Sawhney, S., Fung, C., Nikolai, L., Lewis, M., Coutouly, M. A., Forsythe, I., Tang, P., Shrivastava, S., Jeroncic, K., Stothard, P., Amegbey, G., Block, D., Hau, D. D., Wagner, J., Miniaci, J., Clements, M., Gebremedhin, M., Guo, N., Zhang, Y., Duggan, G. E., Macinnis, G. D., Weljie, A. M., Dowlatabadi, R., Bamforth, F., Clive, D., Greiner, R., Li, L., Marrie, T., Sykes, B. D., Vogel, H. J., and Querengesser, L. (2007). HMDB: the human metabolome database. Nucleic Acids Res. 35, D521–D526.
Keywords: metabolome analysis, liquid chromatography-mass spectrometry, structural elucidation, database searching, natural variations in secondary metabolite
Citation: Matsuda F, Nakabayashi R, Sawada Y, Suzuki M, Hirai MY, Kanaya S and Saito K (2011) Mass spectra-based framework for automated structural elucidation of metabolome data to explore phytochemical diversity. Front. Plant Sci. 2:40. doi: 10.3389/fpls.2011.00040
Received: 29 April 2011;
Accepted: 01 August 2011;
Published online: 22 August 2011.
Edited by:
Alisdair Fernie, Max Planck Institut for Plant Physiology, GermanyReviewed by:
Asaph Aharoni, Weizmann Institute of Science, IsraelTakayuki Tohge, Max Planck Institute of Molecular Plant Physiology, Germany
Copyright: © 2011 Matsuda, Nakabayashi, Sawada, Suzuki, Hirai, Kanaya and Saito. This is an open-access article subject to a non-exclusive license between the authors and Frontiers Media SA, which permits use, distribution and reproduction in other forums, provided the original authors and source are credited and other Frontiers conditions are complied with.
*Correspondence: Kazuki Saito, Metabolome Research Group, RIKEN Plant Science Center, Suehiro-cho, Tsurumi-ku, Yokohama 230-0045, Japan. e-mail: ksaito@psc.riken.jp