 Malgorzata Ryngajllo1 Liam Childs1 Marc Lohse1 Federico M. Giorgi1 Anja Lude1 Joachim Selbig2 Björn Usadel1*
- 1 Max Planck Institute of Molecular Plant Physiology, Potsdam, Germany
- 2 Department of Bioinformatics, Institute of Biochemistry and Biology, University of Potsdam, Potsdam, Germany
Despite the growing volume of experimentally validated knowledge about the subcellular localization of plant proteins, a well performing in silico prediction tool is still a necessity. Existing tools, which employ information derived from protein sequence alone, offer limited accuracy and/or rely on full sequence availability. We explored whether gene expression profiling data can be harnessed to enhance prediction performance. To achieve this, we trained several support vector machines to predict the subcellular localization of Arabidopsis thaliana proteins using sequence derived information, expression behavior, or a combination of these data and compared their predictive performance through a cross-validation test. We show that gene expression carries information about the subcellular localization not available in sequence information, yielding dramatic benefits for plastid localization prediction, and some notable improvements for other compartments such as the mitochondrion, the Golgi, and the plasma membrane. Based on these results, we constructed a novel subcellular localization prediction engine, SLocX, combining gene expression profiling data with protein sequence-based information. We then validated the results of this engine using an independent test set of annotated proteins and a transient expression of GFP fusion proteins. Here, we present the prediction framework and a website of predicted localizations for Arabidopsis. The relatively good accuracy of our prediction engine, even in cases where only partial protein sequence is available (e.g., in sequences lacking the N-terminal region), offers a promising opportunity for similar application to non-sequenced or poorly annotated plant species. Although the prediction scope of our method is currently limited by the availability of expression information on the ATH1 array, we believe that the advances in measuring gene expression technology will make our method applicable for all Arabidopsis proteins.
Introduction
In eukaryotic cells, the targeting of proteins to subcellular compartments is universally recognized to be important for proper protein function (Eisenhaber and Bork, 1998). In plants, several metabolic pathways either consist of enzymes residing in multiple compartments (e.g., the photorespiration pathway), or they occur in parallel in different compartments as is the case for the glycolysis. Therefore, detailed knowledge about protein localization is necessary to understand the plant metabolic network (Lunn, 2007). In addition, the presence of three compartments (nuclei, plastids, and mitochondria) harboring their own genetic information, makes a complex information flow necessary (for a recent overview see Pfannschmidt, 2010).
It is thus not surprising that many studies have focused on the experimental determination of protein subcellular localization in plants (Koroleva et al., 2005). Many of these have profited from the adoption of high-throughput proteomics (Schulze and Usadel, 2010; Wienkoop et al., 2010). These studies have revolutionized our understanding of the localization of proteins in organs (Baerenfaller et al., 2008) and individual subcellular compartments (van Wijk, 2004; Dunkley et al., 2006; Ito et al., 2010). In particular, the technique of organelle purification in combination with highly sensitive LC–MS/MS instruments has proven to be useful in providing a detailed experimental compendium of proteins localized in, e.g., the mitochondrion or the chloroplast (Heazlewood et al., 2004; Ferro et al., 2010). Several independent studies used relative protein concentration along density gradients (Dunkley et al., 2004, 2006) making use of statistical association methods similar to those for subcellular determination of metabolites (Gerhardt and Heldt, 1984; Krueger et al., 2011).
However, despite this avalanche of experimental data, experimentally determined subcellular information is only available for ca. 30% of all proteins for the well studied model organism Arabidopsis (SUBA database, Heazlewood et al., 2006; TAIR database, Rhee et al., 2003). Even in the case of the chloroplast, which is probably the most well studied organelle in terms of proteomics, only 30–60% of the estimated protein population has been found by proteomics methods (van Wijk and Baginsky, 2011). It has been suggested that this lack of information can be explained by temporal, spatial, or experimental condition specificity of protein accumulation, or even by simple technical limitations (van Wijk and Baginsky, 2011). Furthermore, one must keep in mind that no fractionation is perfect and that some proteins might thus be wrongly tagged as belonging to a certain compartment. In part, this can be overcome by trusting high-throughput experimental evidence only if proteins have been associated with a particular compartment by multiple independent studies. Indeed, by combining different data sets an improved assignment can be reached (Trotter et al., 2010). Unfortunately, no matter how many studies are combined, it is still possible that certain wrong assignments can result from systematic problems in separation techniques. Furthermore, although some subcellular localization studies have been conducted for crop plants (Majeran et al., 2005; von Zychlinski et al., 2005; Huang et al., 2009), proteomics cannot yet keep up with the growth of genomic data for multiple plant species.
Therefore, it is still necessary to be able to accurately predict the subcellular localization of proteins. Traditionally, this was done by identifying protein sequence motifs such as signal peptides or targeting signals (see Emanuelsson et al., 2007 for an overview of these methods). Indeed, the widely used TAIR database relies on such predictions made by TargetP which only uses the N-terminal sequence information containing the signal peptide (von Heijne et al., 1989) to decide whether a protein is to be targeted to the chloroplast, the mitochondrion, the secretory pathway, or another location (Emanuelsson et al., 2000). Other widely applied prediction tools screening for N-terminal targeting signals are Predotar (Small et al., 2004) and iPSORT (Bannai et al., 2002). Since these tools have different strengths and weaknesses, a selection was combined in a meta-predictor using a naive Bayes approach (Schwacke et al., 2007). Although a wide variety of such N-terminal prediction systems has been developed throughout the years, some methods are limited in accuracy and/or in the breadth of coverage of subcellular compartments. More importantly, these methods fail to make a valid prediction when a protein is targeted to its final compartment through non-classical mechanisms of protein sorting (Herman and Schmidt, 2004; Nickel and Seedorf, 2008; Wienkoop et al., 2010) or contains a non-conventional targeting sequence (Brix et al., 1999; Diekert et al., 1999). Moreover, these predictors cannot operate in cases where only a partial protein sequence is known as might often be the case in projects relying on EST data to study a non-model plant organism.
To overcome the limitations of N-terminal-based predictions, tools employing a diverse range of other protein features have been developed. Due to the complexity of extracting protein localization, machine learning techniques such as neural networks, hidden Markov models or support vector machines (SVM) have been applied. As SVMs have yielded very good results, SVM based prediction tools based on diverse and robust protein features have gained in popularity (Hua and Sun, 2001; Gardy and Brinkman, 2006). Initially, the main features that were considered were simply derived from the amino acid composition of the whole protein (Nishikawa et al., 1983). Since then, many additional features have been employed to enhance the predictive power which has resulted in the development of systems which apply hybrid approaches using very diverse protein features in combination (Garg et al., 2005; Cui et al., 2011). Among the popular methods, some are homology-based (Kaundal et al., 2010), and others identify subcellular localization of proteins from phylogenetic profiles (Marcotte et al., 2000; Blum et al., 2009). Obviously though, the latter methods do not work on species-specific proteins.
Based on the expected avalanche of transcript data from next generation sequencing for non-model plants (Severin et al., 2010; Zhang et al., 2010), the need to develop robust methods for the prediction of protein subcellular localization is becoming more pressing. As a case study, we developed a novel tool to predict the subcellular localization of Arabidopsis proteins integrating protein amino acid composition with expression profiling data.
Materials and Methods
Generation of a Working and an Independent Test Data Set
In order to construct a working data set, the GO Slim annotation was downloaded from the TAIR database1 (ATH_GO_GOSLIM_02_01_11). Experimentally confirmed subcellular localizations were extracted by selecting only those records containing the IDA (i.e., “inferred from direct assay”) evidence code. Afterward, all instances containing annotations for mitochondrion and plastid genome encoded proteins were removed from the data set. In cases where multiple splicing isoforms existed the “representative protein model” was downloaded from TAIR. In contrast to most previous approaches, proteins annotated to be localized in multiple localizations were retained. This yielded a total number of 6,188 unique protein identifiers having at least one experimentally confirmed subcellular localization. We further filtered this set based on available expression information yielding 5,429 unique proteins.
An independent test data set was created as follows: from all representative Arabidopsis proteins, those used to create the working data set were subtracted. Furthermore, all mitochondrion and plastid genome encoded proteins were removed giving a total number of 20,016 unique protein identifiers. From these, only proteins represented on the ATH1 chip where retained, yielding 13,104 proteins. For these proteins, the SUBA database was queried and 1,398 proteins with experimentally determined subcellular localization could be retrieved.
Predictions from State of the Art Predictors
Sequences of 1,398 proteins from the independent test data set were downloaded from TAIR database (TAIR10_pep_20110103_ representative_gene_model) and used to query: Predotar2, MultiLoc23 [MultiLoc2-HighRes (Plant) method], and AtSubP4 (“best hybrid” method). For the same proteins, predictions made by TargetP were downloaded from the TAIR database5.
Feature Set Generation
For the proteins in the working and in the independent test data set, sequence data was downloaded from the TAIR database (TAIR10_pep_20110103_representative_gene_model). For each protein the amino acid composition was calculated as the occurrence of each of the 20 amino acids in the sequence normalized to the protein length, as previously described in Garg et al. (2005). Additionally, for every protein in the working data set, its dipeptide and higher-order dipeptide composition was calculated (as in Garg et al., 2005). The dipeptide composition was calculated as the occurrence of two adjacent amino acids and pairs of amino acids separated by one, two, or three intervening residues normalized on the number of such dipeptides in the protein, yielding a total of 1,600 features.
The expression data set for Arabidopsis was the same as the one used in Giorgi et al. (2010). In brief, 3,707 Arabidopsis thaliana Affymetrix ATH1 (22,810 probe sets) microarray samples were obtained from the Gene Expression Omnibus database6 (Edgar et al., 2002). The microarrays were normalized using the RMA (Robust Multi-Array Average) technique. The original data was further processed by removing Arabidopsis Gene Identifiers which matched more than one probeset or where one probeset matched multiple genes. Due to this reduction and absence of probesets for some genes on the ATH1 array, this data set provided expression information only for 5,429 and 1,398 experimentally annotated proteins in the working and in the independent test data set respectively. Subsequently, the whole microarray data matrix was linearly scaled between values of 0 and 1 (Eq. A1 in Appendix) as previously reported to be beneficial for SVM (Hsu et al., 2008).
The rice expression data set consisted of all non-redundant Affymetrix Rice Genome microarrays deposited in ArrayExpress (Parkinson et al., 2009) and GEO (Barrett et al., 2011). After quality filtration (as in Mutwil et al., 2011) and normalization using RMA, 487 arrays were retained.
Feature Selection and Performance Measurement
Features were selected in a stepwise manner using F-score and Spearman’s correlation. The F-score (Eq. 1) is calculated as the ratio of the inter- and intra-group variation. Traits with a higher F-score have more separation between the positive and negative cases.
where,  ,
,  ,
,  , n+, and n− are the average of the positive data set, average of the negative data set, average of the whole data set, the total number of members of the positive dataset, and the total number of members of the negative data set for feature i, respectively. In each step, the feature with the next highest F-score was selected for addition to the set of selected features. The F-scores of the remaining features were then adjusted using the maximum Spearman’s correlation coefficient of all features in the selected set (Eq. 2).

where adjFscri, Fscri, and selected_ftrs are for feature i (ftri): the adjusted F-score, the F-score and the features selected in previous steps, respectively.
To assess the performance of the prediction engine and to compare it with existing state of the art predictors, three common performance measures were applied: the Matthew’s correlation coefficient, MCC (as in Matthews, 1975; Eq. 2 in Appendix), the sensitivity, SE (Eq. 3 in Appendix) and the precision (Eq. 4 in Appendix).
Prediction Engine Construction and Evaluation
The prediction engine constructed in this study is based on binary SVM classifiers. Each protein in the training data set of 5,429 proteins is characterized by a vector  (i = 1,…,5429) that represents the chosen combination of features, along with the positive label “compartment” or the negative label “not compartment.” The training of a classifier was conducted using a one-versus-rest (1-v-r SVM) strategy, where the nth SVM was trained with all the proteins in the nth class with a positive label and all other proteins with a negative label. The application of binary classifiers enabled training with proteins found in more than one compartment. The data was modeled by C-Support Vector Classification (as implemented in the libsvm library for python; Chang and Lin, 2011). The prediction engine construction and evaluation was performed on the entire working data set in two independent runs and using the same training procedure (Figure 1).
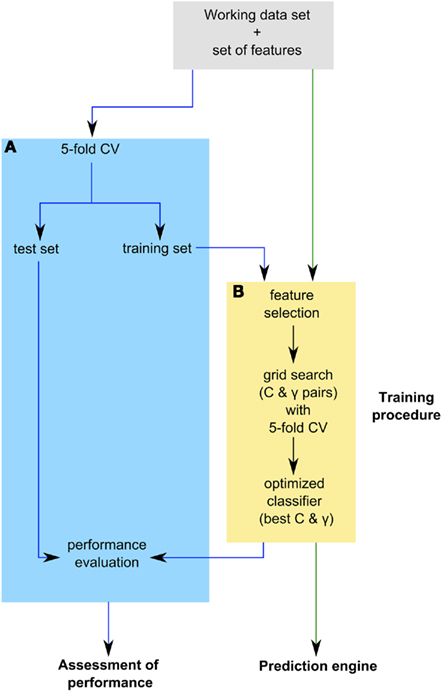
Figure 1. Outline of prediction engine construction and evaluation. The prediction engine was constructed and its performance was evaluated in two independent runs on the entire working data set, as indicated by the green and blue arrows respectively. (A) Assessment of prediction engine performance through fivefold cross-validation (CV) loop. In each fold of CV an optimized classifier is built on the training set and its performance is assessed on the test set. The resulting performance measure distribution of the optimized classifiers was used to assess the performance of the prediction engine. (B) The training procedure used during prediction engine construction and evaluation. The training of a classifier involved feature selection and estimation of the best Cost (C) and gamma (Γ) parameters using a grid search with fivefold CV loop. The best performing parameter pair was then used to train an optimized classifier.
The training procedure first involved feature selection, when applicable, and then training of the classifiers on the given data based on the chosen features. The underlying training algorithm uses a cost parameter (C) that penalizes errors. The kernel used was the radial basis function (RBF), which requires a gamma parameter (Γ) that determines the kernel bandwidth. To estimate the two parameters, we performed a grid search using fivefold cross-validation (CV) at each point in the grid to assess the performance of each parameter pair. The best performing parameter pair was then used to train an optimized classifier.
To assess the performance of the prediction engine, we used fivefold CV applying the training procedure described above to the training set of each fold and testing the resulting optimized classifier with the test set. The resulting performance measure distribution across five folds of CV is then used to estimate the performance of a prediction engine constructed using the applied training procedure (Figure 1). In both parameter estimation and performance evaluation, the proportion of positive and negative examples in the training and testing data sets was maintained.
Types of Predictors Tested
In total, six types of predictors were built to compare different sets of features (Table 1). To investigate the predictive power of sequence and expression features separately, predictors based on either amino acid sequence or expression features were built. To test whether expression data provides additional information about subcellular localization that is not available in sequence data alone, further predictors using a combination of amino acid composition and expression features were built and the performance compared to the earlier predictors. The features were selected by using the above described method. The top 20 features were used as the stopping criterion to facilitate a fair comparison between predictors built on sequence, expression data, and mixed feature predictors. A further three types of predictors were built based on the top 1,000 expression features, the top 1,000 mixture of expression and amino acid composition features and the top 1,000 mixture of expression, amino acid composition and dipeptide features. Each predictor was tested using the above prediction engine evaluation procedure.
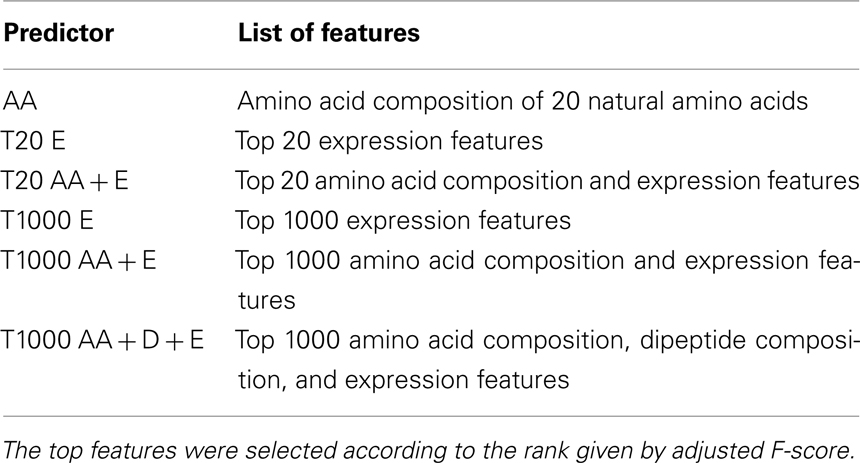
Table 1. Types of predictors tested and their underlying features.
The final predictor, which was compared with the state of the art predictors, was built using top 1,000 features selected from a mixture of amino acid composition information and expression data. We found this number of features to be sufficient for our classifiers, as addition of a higher amount of features did not result in a noticeable improvement (data not shown).
Category Enrichment Analysis
In order to search for enriched categories for the plastidial predictor, we tested for functional enrichment of the false negative and false positive set, using all “true” plastidial predictions and all proteins having an experimentally derived localization as backgrounds, respectively. The enrichment analysis was performed using the MapMan (Usadel et al., 2009) categories for TAIR9 and employing the online enrichment calculator based on Fisher’s exact test (Usadel et al., 2006).
Generation of Custom Vector and Protein–GFP Fusion Constructs
Two candidate genes, At1g16000.1 and At5g19540.1, whose subcellular localization was hitherto not experimentally determined (according to the SUBAII and TAIR database) were randomly selected. Our method predicted these to be localized in the mitochondrion and the plastid respectively. In order to validate our predictions, these two genes were cloned and the localization of their corresponding gene products investigated using protein–GFP fusions. Briefly, total RNA was isolated from entire Arabidopsis (Col-0) seedlings using the phenol–chloroform extraction method (as in Pant et al., 2009). Subsequently, the isolated RNA samples were digested with TURBO DNase (Ambion) and used as a template for reverse transcription using SuperScript®III Reverse Transcriptase Kit (Invitrogen) in the presence of the RNase inhibitor RNasion (Promega) as specified by the manufacturer. The coding sequence of the genes was amplified from this cDNA by PCR using Phusion DNA-Polymerase (Finnzymes). The primers used to obtain the final constructs are listed in Table 2. The pAM1 vector used for transient transformation was derived from pGreen0029 and pA7-GFP (Katrin Czempinski, Potsdam University, Germany) vectors. pGreen was digested at SmaI, Ecl136II, XhoI, SalI, EcoRI, and HindIII restriction sites, to remove multiple cloning sites. The pA7-GFP vector was digested at EcoRI and HindIII restriction sites and this cassette, bearing GFP(S65T) under an enhanced version of CAMV35S promotor, was further cloned into the digested, as described above, pGreen0029 and relegated to give the pAM1 vector. Each candidate gene was inserted into pAM1 vector in two orientations, with respect to GFP sequence. By inserting the genes into pAM1 at either XbaI/BamHI or Xho/NcoI restriction site, N- and C-terminal GFP fusion constructs were obtained. The resulting inserts were sequenced to confirm correctness of the constructs.
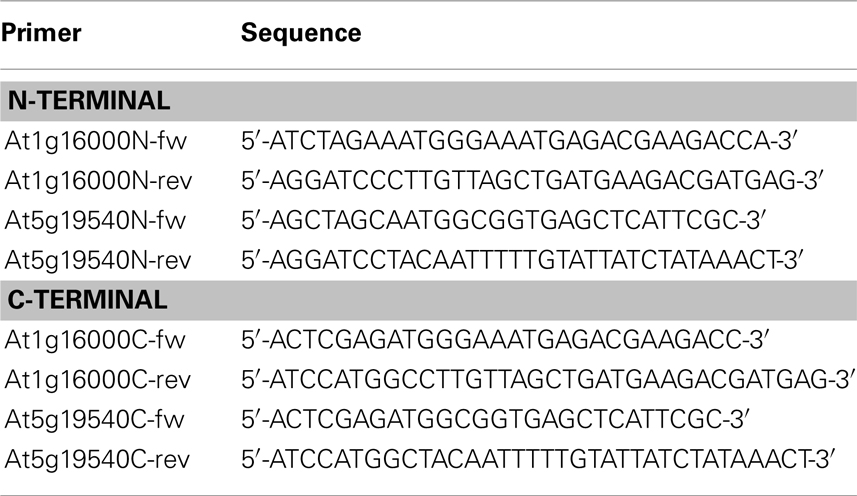
Table 2. Primers used for producing N-/C-terminal GFP fusion constructs together with their sequences.
Transient Expression in Tobacco
Five to 6-week-old tobacco protoplasts (cv. Petit havana) were generated and transformed via the polyethylene glycol-mediated (PEG) method adapted from Huang et al., 2002; Koop et al., 1996; Negrutiu et al., 1987. The transformed protoplasts were further incubated overnight in the dark. The protoplasts were transformed with the candidate gene–GFP constructs and control for the mitochondrion, pre101, and the plastid, TP101 (both controls, Renate Luhrs, personal communication) in parallel experiments. The protoplast cells, transformed with constructs and control for validation of At1g16000, were additionally stained with MitoTracker Orange (Invitrogen).
The transformed tobacco protoplasts were visualized 24 h after transformation using a confocal laser scanning microscope (TCS SP2/UV, Leica, Germany). The instrument was equipped with Argon and He/Ne lasers, and a 63× as well as a 20× planapo water objective. Two different filter settings were used: (i) for the GFP fluorescence excitation wave length: 488 nm, beam splitter: DD 488/568 (double dichroic, reflects at 488 and 568 nm), barrier filter: BP 530 (band pass, 515–545 nm); (ii) for the MitoTracker Orange, excitation wave length: 554 nm, beam splitter: DD 488/568, barrier filter: BP 590 (long pass > 590 nm). Autofluorescence of chlorophyll was detected at 580–600 nm. During image acquisition each line was scanned four times and averaged. Image analysis was performed with the Leica Confocal Software of TCS SP2 (version 2.61. build 1537).
Results and Discussion
Generation of a Novel Subcellular Prediction Engine
Many accurate subcellular localization predictors, including the one used by the TAIR database, rely on the targeting signal contained in the N-termini of proteins (Small et al., 2004; Emanuelsson et al., 2007). Therefore these predictors cannot estimate the correct subcellular localization if the N-terminus of proteins is absent. It had been shown, however, that the prediction of protein subcellular localization can be obtained by training a SVM employing the amino acid composition of a whole protein (Hua and Sun, 2001). Unfortunately, relying on amino acid composition alone has been shown to be insufficient for high accuracy predictions and consequently several predictors use additional information (Garg et al., 2005; Su et al., 2007; Blum et al., 2009; Kaundal et al., 2010).
We argue that in order to predict protein subcellular localization for plant species where no genome is available and thus full length transcript models are often lacking, one would need robust features that could be determined relatively quickly. It has previously been observed that Arabidopsis transcripts encoding for proteins localized in the plastid or in the mitochondrion are often highly correlated (Usadel et al., 2005, 2009; Cui et al., 2011) and that transcript accumulation in different experiments might therefore contain important information about protein localization.
To test whether expression data contained information about the subcellular localization, we extracted 3,707 slides from a compendium of Arabidopsis microarrays (Giorgi et al., 2010) and subjected them to principle component analysis (PCA). By using PCA we wanted to investigate whether a pattern in this expression data set exists, which would correlate with distribution of proteins in different subcellular localizations. The PCA revealed that over 80% of variance in the data could be explained by the first two principal components. Afterward, we projected the proteins in the coordinates of these two principle components and, to facilitate visual separation, we highlighted plastid proteins in green, leaving the proteins from the remaining compartments in black (Figure 2).
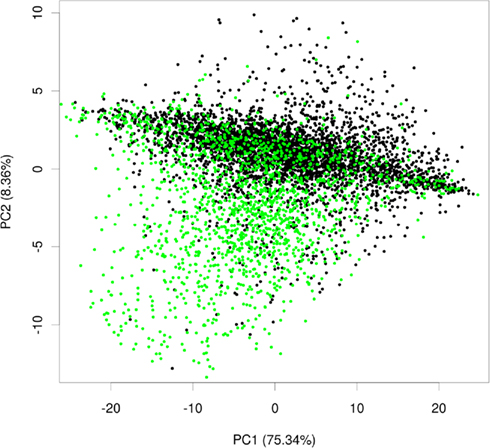
Figure 2. Principle component analysis plot of plastid and non-plastid proteins. Exemplary principal component plot showing plastid proteins in green and proteins from other compartments in black.
Within these projections most proteins lay on a somewhat diagonal line. However, it also became obvious that proteins separated off from this line by the second principal component tended to be enriched for plastid proteins (Figure 2). This observation indicated that expression data contains information that allows for a considerable degree of separation of plastid proteins from the background of proteins localized in the other compartments. We performed the same analysis for other compartments as well, but in no case did we see such a striking difference for the compartments for the first two principal components (Figure A1 in Appendix). Furthermore, we wanted to check if this separation is conserved across species, and investigated if rice transcript data would also contain information that makes its plastid proteins distinguishable. To examine this, we performed PCA with the expression information from 487 experiments that used rice microarrays. Afterward, we projected the entire data in the coordinates of the first two principal components and highlighted the proteins, which were experimentally found in either the etioplast (von Zychlinski et al., 2005) or in the mitochondrion (Huang et al., 2009) in green and blue respectively, leaving the remaining proteins in black (Figure A2 in Appendix). Here, we could also observe some degree of separation of plastid proteins (green) from other proteins (black). The separation from the rest of the proteins was much weaker for mitochondrial proteins (colored in blue), as in the case of Arabidopsis.
We therefore examined whether expression estimates could be combined with “traditional” data to predict the subcellular localization of plant proteins. To investigate this, we extracted only those proteins having an experimentally derived subcellular localization from the GO Slim annotation of the TAIR database. In total, this set comprised 6,188 proteins. After filtering for proteins, where we could find a unique probeset on the ATH1 chip, we were left with 5,429 proteins. These proteins were not evenly distributed between the different compartments. Here, as expected from the large organellar proteomics studies, a considerable portion was shown to be localized in the plastid or the mitochondrion (Figure 3A). Moreover, many proteins had been shown to be in the nucleus or the plasma membrane. Furthermore, for a significant proportion (24%) different experimentally determined localizations existed (Table A1 in Appendix). Dual localization has probably been best studied for the plastid and the mitochondrion and Morgante et al. (2009) have already shown more than 50 Arabidopsis proteins to have these dual localization signals. This is reflected in the fact that most proteins from the plastid which have a second experimentally determined localization were also found in the mitochondrion (Figure 3B). However, for several other compartments such as the plasma membrane and the vacuole this was rather surprising and might indicate ambiguities in the data set or false positives in proteomic studies (Figure 3B; Table A1 in Appendix).
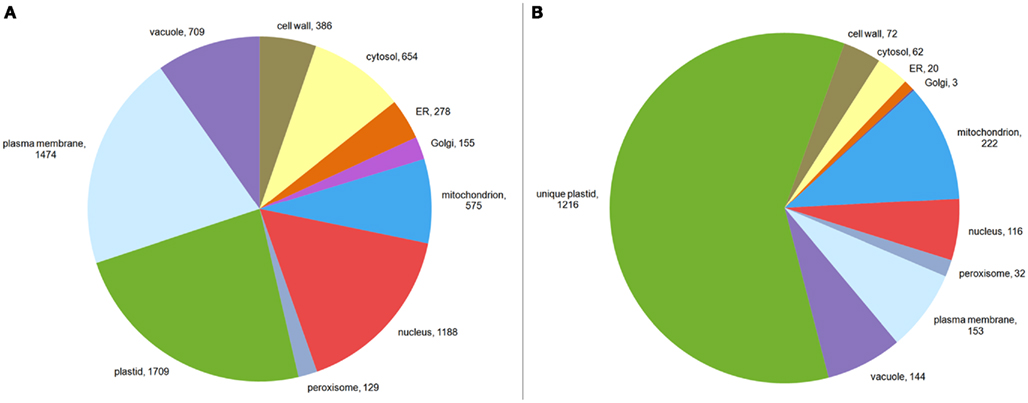
Figure 3. Composition of the training set. The composition of the training set is shown in (A). The size of each sector corresponds to all proteins in that compartment. Proteins localized to multiple compartments are counted toward each of their compartments. In (B) the data for plastid localized proteins from Table A1 in Appendix is visualized, showing proteins having annotations for the plastid only, as well as for the plastid and other compartments.
Nevertheless we used the full experimentally determined protein set to train SVMs for the following compartments: the vacuole, the peroxisome, the cytosol, the ER, the plastid, the mitochondrion, the Golgi apparatus, the nucleus, the plasma membrane and the cell wall. It has to be noted that the latter is not representing any compartment but a training was attempted due to good experimentally derived evidence. In each case, we trained one SVM using only amino acid composition, one using the top 20 features selected from expression data, one incorporating the top 20 features chosen from the amino acid composition and expression behavior, one incorporating the top 1,000 expression features, one incorporating the top 1,000 features chosen from a mixture of amino acid composition and expression features and a final SVM, where the top 1,000 features were chosen from amino acid and dipeptide composition and transcript expression. The SVMs trained with the top 1,000 mixed features were used to gauge whether additional features beyond the amino acid composition could improve the SVM performance. On the other hand, the SVMs incorporating the top 20 mixed features were chosen to assess whether the inclusion of relatively few of these data sets would already increase prediction performance. Additionally, we wanted to test how informative the expression information on its own is and to investigate this we constructed SVMs based solely on expression features. The whole data set comprising 5,429 values by 5,327 features was then subjected to a model training procedure and subsequent evaluation using CV. We have performed feature selection by using an F-score based approach to identify features providing a high predictive power for the SVM (Chen and Lin, 2006). CV was used in two cases: once to estimate the parameters used to train the SVMs, and once to provide an unbiased assessment of prediction accuracy.
After evaluation of the prediction performance of the different SVMs, it became obvious that leveraging the expression of the underlying transcripts did not strongly improve the prediction, as judged by the MCC, for the cell wall, the cytosol, or the ER (Figure 4, upper panel and Table 3). In any case, for these compartments we only obtained a very low MCC (below 0.4) and therefore decided that these compartments could not be predicted solely based on these simple features. For the vacuole and the peroxisome we saw a slight increase of the MCC, but it stayed below a value of 0.4 (Figure 4, upper panel) and the predictive power was therefore also deemed to be not acceptable. In the case of the nucleus we did not observe any improvement in predictive power when incorporating expression data either (Figure 4, lower panel). However, here the addition of dipeptide composition elevated the MCC to nearly 0.5. Finally in the case of the plasma membrane, the Golgi and the mitochondrion we achieved an improvement of the predictive power by incorporating expression data, reaching MCC values slightly above 0.4 in every case (Figure 4 lower panel). Strikingly, in accordance to the previous observations we saw a dramatic increase in MCC for the prediction of plastid proteins, where the MCC increased from below 0.4 to nearly 0.7 when about 1,000 array slides were incorporated (Table 3). Interestingly, when choosing as little as 20 features from the combined set of array slides and the amino acid composition the MCC rose to above 0.5 already, indicating that relatively few (targeted) expression arrays might be enough to significantly boost the predictive power for the plastid predictors.
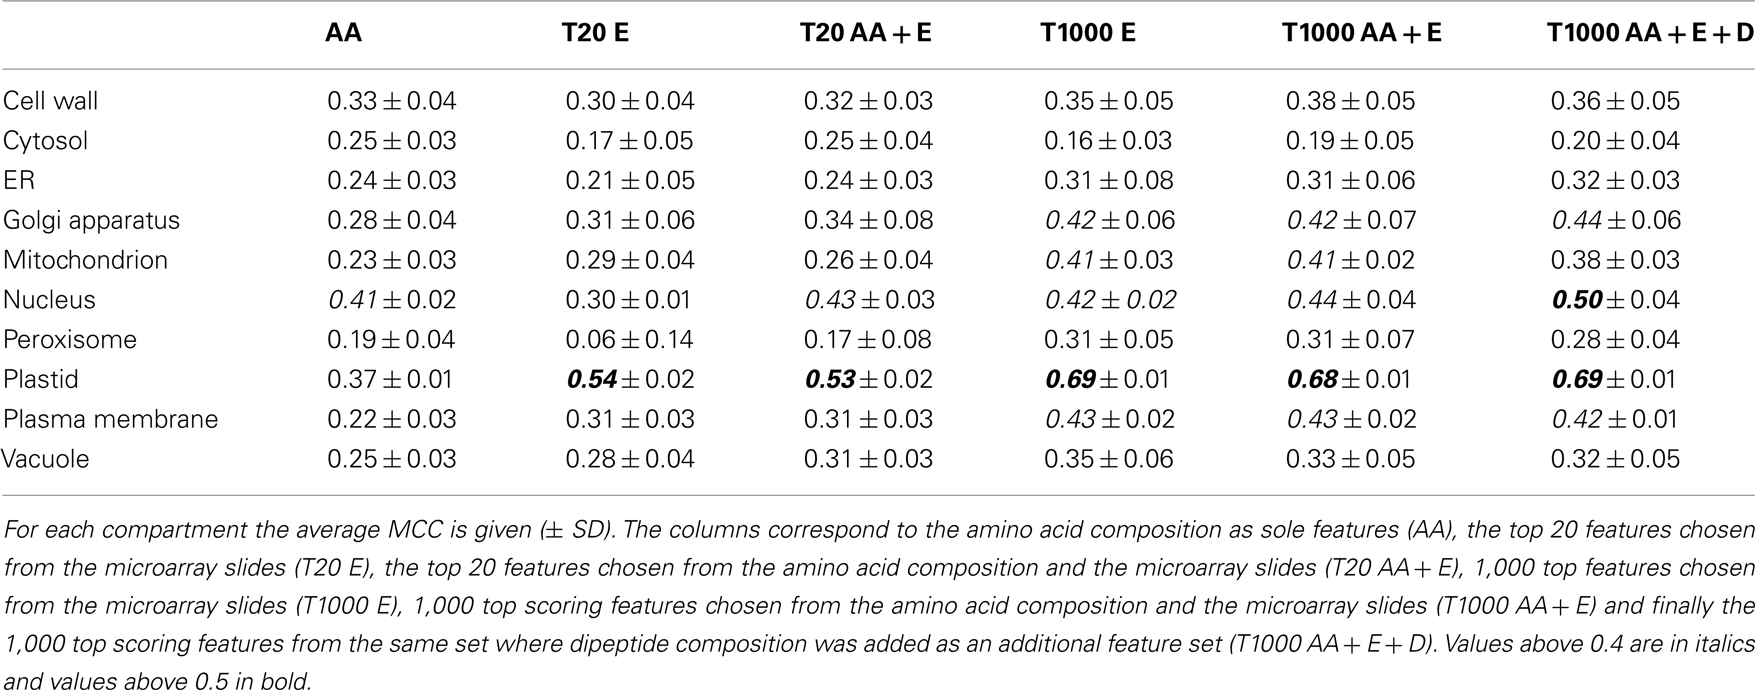
Table 3. Matthew’s correlation coefficient values obtained using different features.
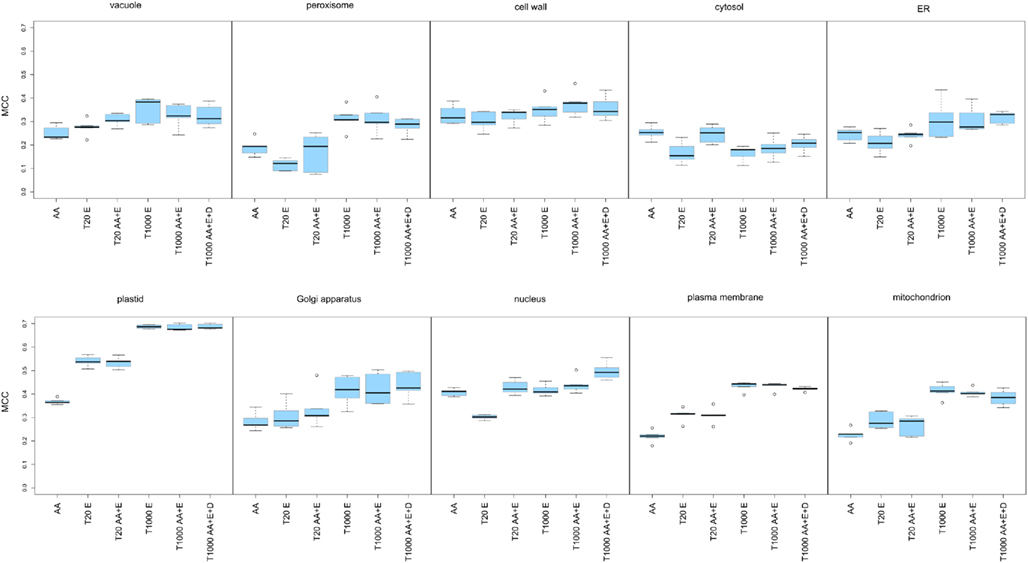
Figure 4. Matthew’s correlation coefficient plots presenting the performance of the predictors constructed for 10 subcellular compartments. The investigated compartments were: the vacuole, the peroxisome, the cell wall, the cytosol, the ER, the plastid, the Golgi apparatus, the nucleus, the plasma membrane, the mitochondrion. For each of the 10 compartments the prediction engines were built using: amino acid composition (AA), the top 20 expression features (T20 E), the top 20 mixed features selected from the amino acid composition and the expression data (T20 AA + E), the top 1,000 features selected from the expression features (T1000 E), the top 1,000 amino acid composition and expression features (T1000 AA + E) and the top 1,000 features selected from amino acid composition, dipeptide composition and expression data (T1000 AA + D + E). For each predictor the Matthews’ correlation coefficients from the 5 cross-validation loops are visualized as a box plot.
Finally, when analyzing the performance of the SVMs based solely on the top 20 expression features we could notice that for the peroxisome, the cytosol, the ER, and the nucleus, the expression information alone is less informative than amino acid composition. However, with the same number of array slides, the predictor performance for the vacuole, the plastid, the Golgi apparatus, the plasma membrane, and the mitochondrion was already as good as, or sometimes even better than for those based on amino acid composition alone. In fact, what we have found characteristic for almost all compartments, except the nucleus and the cytosol, is that the 1,000 top expression features seemed to overlap with the informative content of the protein sequence features (Figure 4), as the performance of predictors built on this data could not be further improved by incorporation of amino acid or dipeptide composition.
These results confirmed the initial findings from the PCA plots for the plastid. However, unlike in the PCA, we could show that expression profiling can provide useful information for half of the investigated compartments, albeit this improvement is not as dramatic as it is for the plastid. Furthermore, even the incorporation of relatively few expression sets increased the predictive power in the case of the plastid and for the plasma membrane (see Figure 4 lower panel). This would suggest that, if one were to use expression information from crop or exotic plant species, a limited RNASeq profiling data set might be enough to provide an additional level of information for protein subcellular localization prediction, at the very least for plastid proteins.
Importance of Individual Features for Plastidial Predictor as Judged by an Adjusted F-score
We next set out to assess which data is most useful for the prediction of plastid proteins. We therefore investigated the ranking of the F-scores which were used for feature selection in the SVM training steps. As expected in the case of the plastid, microarray slides were residing at the top of the list (Table A2 in Appendix). Interestingly, when assessing common themes amongst the microarrays providing most information about localization of plastid proteins, a set of microarrays studying a triose phosphate transporter mutant grown (Walters et al., 2004) under an 8-h light regime scored best. As even wild-type control arrays from this set were ranked amongst the most informative, it is likely that this might be rather due to the growth conditions and sampling time (2 h after light onset according to http://affymetrix. arabidopsis.info/narrays/experimentpage.pl?experimentid = 84) than the actual mutation, as many other top scoring arrays were from experiments investigating tissues grown under constant light (Schmid et al., 2005) or from the morning hours of carefully controlled diurnal cycles (Bläsing et al., 2005; Usadel et al., 2008). This might imply that one could tailor expression studies to be maximally beneficial for inferring protein subcellular localization, by choosing diurnal cycles or varying light intensities. This is not surprising, as many plastid proteins are obviously involved in light dependent processes and/or under the regulation of carbon status and react in response to either input. Consequently, when studying a carbon and light insensitive mutant, photosynthesis and plastid organization were the most significantly changed functional categories (Thum et al., 2008).
Overrepresented Categories
We next investigated whether we could detect any particular bias in the prediction accuracy for plastid localized genes. To investigate this, we used the proteins from our working data set and compared the set of false positives to all proteins contained in the working data set using the online MapMan enrichment tool (Usadel et al., 2006). In total, there were 23 false positive predictions, but we were not able to detect any meaningful enriched categories in this set (data not shown). Next we assessed the final false negative set which comprised 628 proteins for enriched categories by comparing it against the full set of 1,709 plastid proteins in the working data set. Interestingly, in this case we obtained many enriched categories pertaining to ribosomal proteins. However, it turned out that most of these were annotated as proteins constituting the eukaryotic ribosome. Furthermore, 10 proteins were classified as proteasome subunits. As in both cases plastid localization would be relatively unlikely, we concluded that these were either caused by experimental problems in high-throughput data sets or by a functional miss-annotation. We therefore revisited the underlying data by scrutinizing all 1,709 proteins from the plastid set manually without incorporating the novel predictions. We inferred subcellular localization based on experimental evidence and on textbook knowledge about processes and pathways. We further incorporated information about the occurrence of ribosomal subunits in cyanobacteria, algae, or bacteria derived from Interpro (Hunter et al., 2009) and by this checks we were indeed able to confirm the MapMan based annotations. We thus concluded that 68 proteins were most likely not contained in plastids. After correcting our working data set based on these manual improvements, we did not seem to grossly improve SVM performance indicating that our training resulted in a relatively robust model despite the incorporation of false positives.
That said, the inclusion of at least ca. 5% false positive proteins in the plastid set shows that despite growing experimental evidence about the subcellular localization of proteins, these data have to be treated with caution. This is in agreement with the fact that organelle purification is not perfect (van Wijk and Baginsky, 2011). Furthermore, this observation is meaningful as it shows that – at least in the case of this novel plastid predictor – it is possible to find potential experimental errors by using in silico approaches. This further underlines the necessity for highly precise prediction tools even for well studies model organisms like Arabidopsis. It is likely that future studies will thus rely on intersected sets for training and testing and potentially weigh various experimental studies differently by assessing between-lab concordance.
Comparison of Plastidial Predictors Performance Using an Independent Test Set
We next compared the performance of our best performing classifier for the plastid with other state of the art predictors that could assess localization for this compartment. We chose TargetP, as this is being used by the TAIR database, Predotar, MultiLoc2, and AtSubP, as the latter represents another tool based on SVMs, which was specifically developed to annotate the Arabidopsis proteome and has been shown to have an excellent performance (Kaundal et al., 2010). Predictions made by Predotar and TargetP are based solely on the analysis of the N-terminal end of the protein sequence. Therefore these two predictors are tailored to predict mainly plastid or mitochondrial proteins. AtSubP and MultiLoc2 are another class of predictors which go beyond analysis of protein sequence and incorporate additional information. AtSubP leverages entire protein sequence composition and order, together with homology information using PSI–BLAST, to discriminate between proteins destined for seven plant compartments. MultiLoc2, apart from exhaustively analyzing protein sequence, incorporates additional protein information in the form of phylogenetic profiles and Gene Ontology terms to provide predictions for 10 plant subcellular compartments.
When comparing the performance of our predictor with that of other predictors according to the values from their internal performance validation tests, it became obvious that our MCC value estimated from CV was relatively low. However, this might be explained by the inclusion of many more proteins in our working data set or the inclusion of proteins which are hard to classify. We therefore composed an independent test data set, by querying the SUBAII subcellular localization database for proteins whose localization was experimentally confirmed. As the SUBAII database is curating protein subcellular localization independently from TAIR, we were thus able to obtain evidence for proteins not contained in our working data set. In total, we were able to retrieve experimentally derived subcellular localization annotations for 1,398 unique proteins for which expression information existed as well. Of these, 187 were from the plastid.
The compared predictors were queried with all proteins from the independent test data set and those predicted to be localized in the plastid were then selected for benchmarking. The Predotar predictions labeled as “possibly plastid” were not included. We next re-calculated the performance, for our SLocX predictor and the other four predictors, based on the independent test data set. As expected the performance dropped for all the predictors. Whilst it cannot be excluded that the independent test data set contains proteins which are harder to classify explaining the drop in MCC, the most likely explanation would be an overly optimistic estimation of MCC which might result from biases in CV (Jiang et al., 2008; Zervakis et al., 2009). However, we could show that on this independent test data set our plastidial predictor performed slightly better than Predotar and MultiLoc2. Generally, these three predictors performed better than the other two predictors by scoring MCC values of 0.48, 0.47, and 0.46 respectively (Table 4). Although Predotar and MultiLoc2 outcompeted SLocX in sensitivity, it still showed a higher precision. Even though TargetP made more true positive predictions than any of the three top predictors in Table 4, they were accompanied by almost the same number of false positive predictions and this was reflected in its very low precision (0.51). Interestingly, it can be noticed that the sensitivity of AtSubP, which is the highest of all classifiers, came at the cost of low precision as it made much more false positive predictions than true positive predictions. The low precision of AtSubP was also reflected in its MCC value of 0.32, which was the lowest among all the compared predictors. Additionally, we checked how the performance of Predotar would change after inclusion of its low confidence, “possible plastid,” predictions. As expected, here we could observe a slight improvement in Predotar’s sensitivity at the cost of lower precision (data not shown).
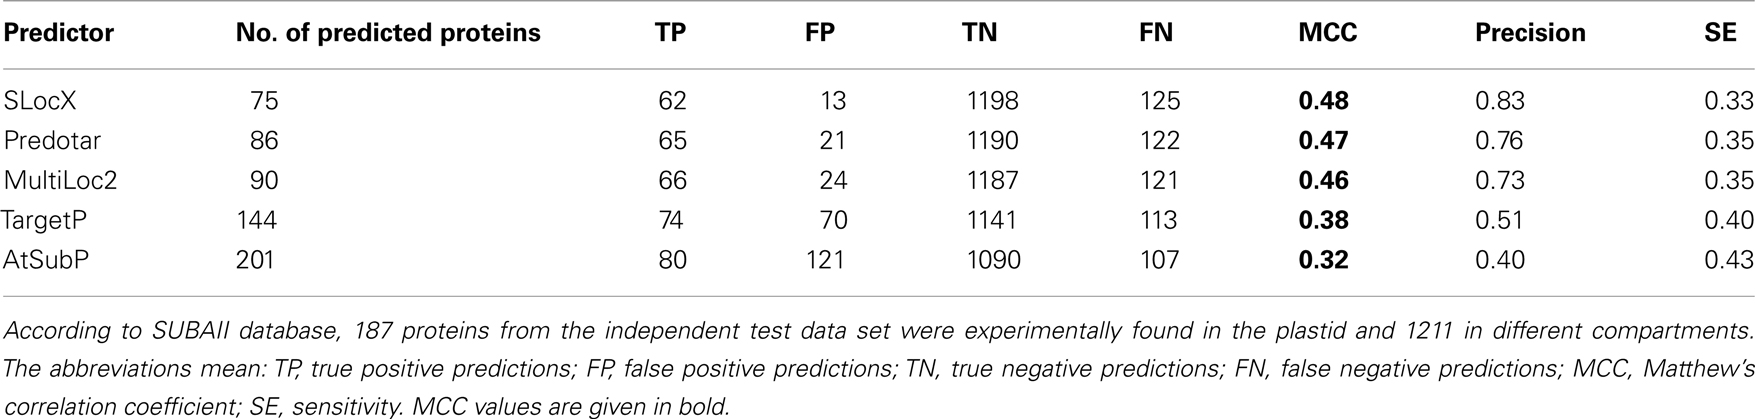
Table 4. Benchmarking of predictions from SLocX, Predotar, MultiLoc2, TargetP, and AtSubP on the independent test set of 1,398 proteins.
Given these differences, we investigated which proteins were correctly predicted by SLocX and the remaining classifiers and found these to have a relatively small overlap (data not shown). This might indicate that the protein sequence alone or enhanced with information derived from either homology, phylogenetic profiles, and GO annotations, does provide independent signals as compared to amino acid composition and expression data. Therefore, in the case of model species, where good gene models are known, it would thus likely make sense to combine such protein sequence-based prediction tools with the novel plastidial predictor.
Experimental Validation of Candidate Proteins Localization
As our results were comparing favorably to that of other prediction methods, we tried to validate two randomly chosen proteins by GFP fusions. The selected proteins were predicted by our method to be localized in the mitochondrion (At1g16000) and the plastid (At5g19540). We cloned the corresponding transcripts from seedling cDNA and transiently transformed tobacco leaf protoplasts. Each investigated protein was tagged with GFP either at its amino or carboxyl terminus. Tagging of the proteins in these two orientations was done to make sure that the observed localization was not due to the masking of a terminal signal peptide. We also queried publicly available prediction tools with the sequence of the investigated proteins.
The protein At1g16000 was predicted by our method to be located in the mitochondrion; however, both, Predotar and MitoProtII (Claros and Vincens, 1996) estimated the probability for an import of this protein into the mitochondrion at just 1 and 0.6% respectively. According to the specifications for interpretation of results of Predotar and MitoProtII, their predictions indicate that the protein is not localized in the mitochondrion. Furthermore, neither AtSubP nor TargetP were able to make any valid prediction for this protein whereas, MultiLoc2 predicted that this protein resides in the cytosol. The only prediction which overlapped with ours was the one made by Cui et al. (2011). After transforming the protoplasts with C-terminally tagged At1g16000 protein, we observed that the GFP signal overlaps with the cyan signal from MitoTracker (Figures 5D–F), which validates our prediction. This observation was additionally corroborated by the results obtained with the pre101(GFP) mitochondrial control (Figures 5A-C).
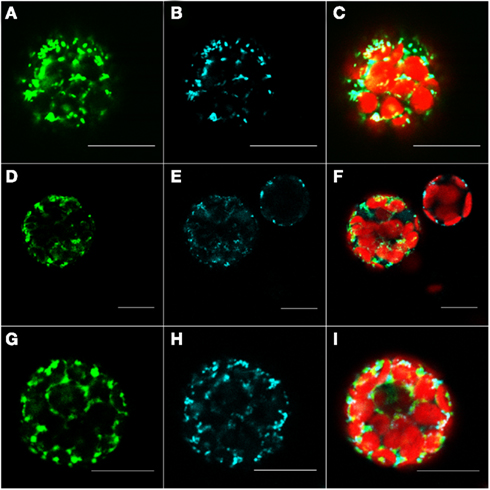
Figure 5. Fluorescent microscopy analysis of tobacco protoplast cells transformed with At1g16000–GFP construct. Protoplast cells transformed with control for the mitochondrion – pre101(GFP) (A–C), At1g16000 with C-terminally fused GFP (D–F), and At1g16000 with N-terminally fused GFP (G–I). Left panel – GFP (green fluorescence), middle panel – MitoTracker Orange (pseudo cyan fluorescence), right panel – channels overlay plus chlorophyll (red) autofluorescence. Bars in all pictures are 15 μm.
Interestingly enough, the cells expressing the N-terminally tagged version of this protein show a mitochondrial localization (Figures 5G–I). It came as a surprise to find both constructs in mitochondria, as it is known that proteins destined to this compartment usually contain an N-terminal mitochondrial transfer peptide (mTP) which should be blocked in case of the N-terminally tagged protein and therefore result in a different than mitochondrion localization. The reason for this behavior is unclear, but it might be explained by the presence of an alternative, not N-terminal, localization signal, which can reside inside of the protein sequence, as it was previously reported for a few mitochondrial proteins (Brix et al., 1999; Pfanner and Geissler, 2001). It could also be explained by the possibility that the available protein sequence is incomplete and its N-terminal part was wrongly assigned by gene prediction tools, thus making it impossible for the predictors based on N-terminal signal recognition to make a correct prediction. In order to exclude the possibility that At1g16000 is an incomplete gene model and to support the explanation that the observed localization was likely due to alternative localization signal, we filtered out the possible alternative starting sites and manually checked the 3,000-nucleotides upstream region of this gene. We found no putative N-terminal localization sequence (according to Predotar). The same result was achieved by checking for alternative starting codons in the first exon of this gene. The checked sequences are available in Table A3 in Appendix. It appears that only the prediction methods which are not entirely based on protein sequence, but also on expression information, as ours and of Cui et al. (2011), can make a correct prediction in such cases.
The second investigated protein, At5g19540, was predicted by our method to be localized in the plastid. In this case, Predotar, iPSORT and TargetP predicted that this protein contains a chloroplast transit peptide (cTP). Furthermore, the other prediction tools, such as MultiLoc2 and AtSubP also agreed with our verdict. The observed localization of C-terminally tagged At5g19540 protein indicated its localization to the plastid (Figures 6C,D). This observation was additionally validated by the results obtained with the TP101(GFP) plastidial control (Figures 6A,B).
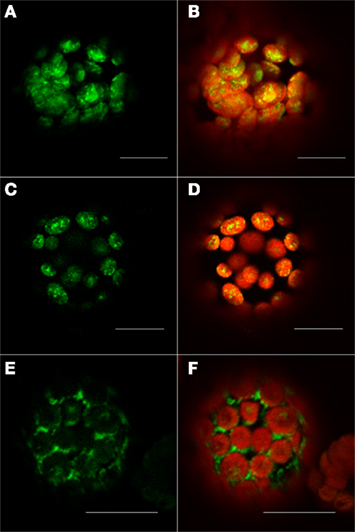
Figure 6. Fluorescent microscopy analysis of tobacco protoplast cells transformed with At5g19540–GFP construct. Protoplast cells transformed with control for the plastid – TP101(GFP) (A,B), At5g19540 with C-terminally fused GFP (C,D), and At5g19540 with N-terminally fused GFP (E,F). Left panel – GFP (green fluorescence), right panel – channels overlay plus chlorophyll (red) autofluorescence. Bars in all pictures are 15 μm.
As expected, the localization changed when the cells were transformed with an N-terminally GFP tagged protein. In this case our localization studies suggest a cytosolic location or a targeting to the endoplasmic reticulum (Figures 6E,F). This two observations together demonstrate that this protein indeed contains a transit peptide at its N-terminus, as predicted by Predotar and iPSORT, which was masked in case of the N-terminally tagged version of this protein resulting in its possible mislocalization in cytosol/ER.
Taken together these experimental confirmations show that our novel predictor performs well on unknown proteins, and is indeed able to either correctly classify truncated mitochondrial proteins or to detect alternative localization signals for mitochondrial proteins.
Limitations of the Method and Further Perspectives
Given the performance of the SVM based predictor using simple amino acid and expression information it will be possible to combine these predictions with those stemming from N-terminal predictors for well studied model plants to (i) improve predictive power and in the case of conflicting predictions to (ii) potentially identify non-classically targeted proteins. Although, such leveraging of expression information for subcellular localization prediction appears promising, there are some limitations. Firstly, we could show that the compartments which can benefit from this information would be primarily the plastid and, to some extent, the mitochondrion and the plasma membrane. However, the main limitation is the need to have expression data for the protein to be studied. Therefore, our predictor requires that a protein’s transcript must be represented on the ATH1 microarray. Generalizing this, repeating our methodology for other plant species would depend on the availability of data from experiments performed using microarrays designed for them. Moreover, it cannot be guaranteed that this would be as robust as for Arabidopsis and would depend of the quality of the microarrays, i.e., the number of transcripts that they measure. These limitations however, might no longer be a bottleneck of our methodology, since next generation sequencing can now provide expression measures for entire transcriptomes and this technique was already applied many times for Arabidopsis and other plant species (Jia et al., 2009; Eveland et al., 2010; Filichkin et al., 2010; Gilardoni et al., 2010; Zhang et al., 2010; Hsieh et al., 2011). As RNASeq projects can be used to infer (often incomplete) transcript and thus protein models at the same time, a prediction solely based on amino acid composition and expression information should be highly useful for these studies.
Website
In order to make the data available in a convenient form, we have set up a website of localizations predicted by SLocX. The website is available at the following URL: mapman.mpimp-golm.mpg.de/general/slocx/. Additional improvements will directly be incorporated into the database.
Conclusion
By leveraging gene expression information we could show that we can predict protein subcellular localization with a significantly higher accuracy than when using sequence data alone. Beyond simple CV and an independent test set, a subset of novel predictions was also shown to be correct using protein–GFP fusions.
Conflict of Interest Statement
The authors declare that the research was conducted in the absence of any commercial or financial relationships that could be construed as a potential conflict of interest.
Acknowledgments
We want to thank Dr. Sandra Tanz for making data from the SUBA II database available. We are very grateful to Yvonne Weber for technical assistance with protoplast transformation. We further acknowledge Anthony Bolger for meticulous correction of the manuscript. Also we want to thank Eugenia Maximova for assistance with microscopy. Furthermore we want to acknowledge Diana Pese for general technical support. Last but not the least, we would like to acknowledge Paulina Troc for useful discussions.
Footnotes
References
Baerenfaller, K., Grossmann, J., Grobei, M., Hull, R., Hirsch-Hoffmann, M., Yalovsky, S., Zimmermann, P., Grossniklaus, U., Gruissem, W., and Baginsky, S. (2008). Genome-scale proteomics reveals Arabidopsis thaliana gene models and proteome dynamics Science 320, 938–941.
Bannai, H., Tamada, Y., Maruyama, O., Nakai, K., and Miyano, S. (2002). Extensive feature detection of N-terminal protein sorting signals. Bioinformatics 18, 298–305.
Barrett, T., Troup, D., Wilhite, S., Ledoux, P., Evangelista, C., Kim, I., Tomashevsky, M., Marshall, K., Phillippy, K., Sherman, P., Muertter, R. N., Holko, M., Ayanbule, O., Yefanov, A., and Soboleva, A. (2011). NCBI GEO: archive for functional genomics data sets – 10 years on. Nucleic Acids Res. 39(Suppl. 1), :D1005.
Bläsing, O. E., Gibon, Y., Günther, M., Höhne, M., Morcuende, R., Osuna, D., Thimm, O., Usadel, B., Scheible, W. R., and Stitt, M. (2005). Sugars and circadian regulation make major contributions to the global regulation of diurnal gene expression in Arabidopsis. Plant Cell 17, 3257–3281.
Blum, T., Briesemeister, S., and Kohlbacher, O. (2009). MultiLoc 2: integrating phylogeny and Gene Ontology terms improves subcellular protein localization prediction. BMC Bioinformatics 10, 274. doi: 10.1186/1471-2105-10-274
Brix, J., Rüdiger, S., Bukau, B., Schneider-Mergener, J., and Pfanner, N. (1999). Distribution of binding sequences for the mitochondrial import receptors Tom20, Tom22, and Tom70 in a presequence-carrying preprotein and a non-cleavable preprotein. J. Biol. Chem. 274, 16522.
Chang, C., and Lin, C. (2011). LIBSVM: a library for support vector machines, ACM Transactions on Intelligent Systems and Technology (TIST), Taipei, 2, 27.
Chen, Y.-W., and Lin, C. J. (2006). “Combining SVMs with various feature selection strategies,” in Feature Extraction, Foundations and Applications, eds I. Guyon, S. Gunn, M. Nikravesh and L. Zadeh (Taipei: Springer), 315–324.
Claros, M. G., and Vincens, P. (1996). Computational method to predict mitochondrially imported proteins and their targeting sequences. Eur. J. Biochem. 241, 779–786.
Cui, J., Liu, J., Li, Y., and Shi, T. (2011). Integrative identification of Arabidopsis mitochondrial proteome and its function exploitation through protein interaction network. PLoS ONE 6, e16022. doi: 10.1371/journal.pone.0016022
Diekert, K., Kispal, G., Guiard, B., and Lill, R. (1999). An internal targeting signal directing proteins into the mitochondrial intermembrane space. Proc. Natl. Acad. Sci. U.S.A. 196, 11752–11757.
Dunkley, T., Hester, S., Shadforth, I., Runions, J., Weimar, T., Hanton, S., Griffin, J., Bessant, C., Brandizzi, F., Hawes, C., Watson, R. B., Dupree, P., and Lilley, K. S. (2006). Mapping the Arabidopsis organelle proteome. Proc. Natl. Acad. Sci. U.S.A. 103, 6518–6523.
Dunkley, T. P., Watson, R., Griffin, J. L., Dupree, P., and Lilley, K. S. (2004). Localization of organelle proteins by isotope tagging (LOPIT). Mol. Cell. Proteomics 3, 1128–1134.
Edgar, R., Domrachev, M., and Lash, A. (2002). Gene expression omnibus: NCBI gene expression and hybridization array data repository. Nucleic Acids Res. 30, 207.
Eisenhaber, F., and Bork, P. (1998). Wanted: subcellular localization of proteins based on sequence. Trends Cell Biol. 8, 169.
Emanuelsson, O., Brunak, S., von Heijne, G., and Nielsen, H. (2007). Locating proteins in the cell using TargetP, SignalP and related tools. Nat. Protoc. 2, 953–971.
Emanuelsson, O., Nielsen, H., Brunak, S., and von Heijne, G. (2000). Predicting subcellular localization of proteins based on their N-terminal amino acid sequence. J. Mol. Biol. 300, 1005–1016.
Eveland, A., Satoh-Nagasawa, N., Goldshmidt, A., Meyer, S., Beatty, M., Sakai, H., Ware, D., and Jackson, D. (2010). Digital gene expression signatures for maize development. Plant Physiol. 154, 1024–1039.
Ferro, M., Brugière, S., Salvi, D., Seigneurin-Berny, D., Court, M., Moyet, L., Ramus, C., Miras, S., Mellal, M., Le Gall, S., Kieffer-Jaquinod, S., Bruley, C., Garin, J., Joyard, J., Masselon, C., and Rolland, N. (2010). AT CHLORO, a comprehensive chloroplast proteome database with subplastidial localization and curated information on envelope proteins. Mol. Cell. Proteomics 9, 1063.
Filichkin, S., Priest, H., Givan, S., Shen, R., Bryant, D., Fox, S., Wong, W., and Mockler, T. (2010). Genome-wide mapping of alternative splicing in Arabidopsis thaliana. Genome Res. 20, 45–58.
Gardy, J., and Brinkman, F. (2006). Methods for predicting bacterial protein subcellular localization. Nat. Rev. Microbiol. 4, 741–751.
Garg, A., Bhasin, M., and Raghava, G. (2005). Support vector machine-based method for subcellular localization of human proteins using amino acid compositions, their order, and similarity search. J. Biol. Chem. 280, 14427–14432.
Gerhardt, R., and Heldt, H. W. (1984). Measurement of subcellular metabolite levels in leaves by fractionation of freeze-stopped material in nonaqueous media. Plant Physiol. 75, 542–547.
Gilardoni, P., Schuck, S., Jüngling, R., Rotter, B., Baldwin, I., and Bonaventure, G. (2010). SuperSAGE analysis of the Nicotiana attenuata transcriptome after fatty acid-amino acid elicitation (FAC): identification of early mediators of insect responses. BMC Plant Biol. 10, 66. doi: 10.1186/1471-2229-10-66
Giorgi, F., Bolger, A., Lohse, M., and Usadel, B. (2010). Algorithm-driven artifacts in median polish summarization of microarray data. BMC Bioinformatics 11, 553. doi: 10.1186/1471-2105-11-553
Heazlewood, J., Tonti-Filippini, J., Gout, A., Day, D., Whelan, J., and Millar, A. (2004). Experimental analysis of the Arabidopsis mitochondrial proteome highlights signaling and regulatory components, provides assessment of targeting prediction programs, and indicates plant-specific mitochondrial proteins. Plant Cell 16, 241–256.
Heazlewood, J., Verboom, R., Tonti-Filippini, J., Small, I., and Millar, A. (2006). SUBA: the Arabidopsis subcellular database. Nucleic acids res. 35(suppl 1), :D213.
Herman, E., and Schmidt, M. (2004). Endoplasmic reticulum to vacuole trafficking of endoplasmic reticulum bodies provides an alternate pathway for protein transfer to the vacuole. Plant Physiol. 136, 3440–3446.
Hsieh, T., Shin, J., Uzawa, R., Silva, P., Cohen, S., Bauer, M., Hashimoto, M., Kirkbride, R., Harada, J., Zilberman, D., and Fischera, R. L. (2011). Regulation of imprinted gene expression in Arabidopsis endosperm. Proc. Natl. Acad. Sci. U.S.A. 108, 1755–1762.
Hsu, C., Chang, C., and Lin, C. (2008). A practical guide to support vector classification. National Taiwan University, Taipei 106, Taiwan.
Hua, S., and Sun, Z. (2001). Support vector machine approach for protein subcellular localization prediction. Bioinformatics 17, 721–728.
Huang, F., Klaus, S., Herz, S., Zou, Z., Koop, H., and Golds, T. (2002). Efficient plastid transformation in tobacco using the aphA-6 gene and kanamycin selection. Mol. Genet. Genomics 268, 19–27.
Huang, S., Taylor, N. L., Narsai, R., Eubel, H., Whelan, J., and Millar, A. H. (2009). Experimental analysis of the rice mitochondrial proteome, its biogenesis, and heterogeneity. Plant Physiol. 149, 719–734.
Hunter, S., Apweiler, R., Attwood, T. K., Bairoch, A., Bateman, A., Binns, D., Bork, P., Das, U., Daugherty, L., Duquenne, L., Finn, R. D., Gough, J., Haft, D., Hulo, N., Kahn, D., Kelly, E., Laugraud, A., Letunic, I., Lonsdale, D., Lopez, R., Madera, M., Maslen, J., McAnulla, C., McDowall, J., Mistry, J., Mitchell, A., Mulder, N., Natale, D., Orengo, C., Quinn, A. F., Selengut, J. D., Sigrist, C. J., Thimma, M., Thomas, P. D., Valentin, F., Wilson, D., Wu, C. H., and Yeats, C. (2009). InterPro: the integrative protein signature database. Nucleic Acids Res. 37, D211–D215.
Ito, J., Batth, T., Petzold, C., Redding-Johanson, A., Mukhopadhyay, A., Verboom, R., Meyer, E., Millar, A., and Heazlewood, J. (2010). Analysis of the Arabidopsis cytosolic proteome highlights subcellular partitioning of central plant metabolism. J. Proteome Res. 10, 1571–1582.
Jia, Y.; Lisch, D., Ohtsu, K., Scanlon, M., Nettleton, D., and Schnable, P. (2009). Loss of RNA–dependent RNA polymerase 2 (RDR2) function causes widespread and unexpected changes in the expression of transposons, genes, and 24-nt small RNAs. PLoS Genet. 5, e1000737. doi: 10.1371/journal.pgen.1000737
Jiang, W., Varma, S., and Simon, R. (2008). Calculating confidence intervals for prediction error in microarray classification using resampling. Stat. Appl. Genet. Mol. Biol. 7, article 8.
Kaundal, R., Saini, R., and Zhao, P. (2010). Combining machine learning and homology-based approaches to accurately predict subcellular localization in Arabidopsis. Plant Physiol. 154, 36–54.
Koop, H., Steinmüller, K., Wagner, H., Rößler, C., Eibl, C., and Sacher, L. (1996). Integration of foreign sequences into the tobacco plastome via polyethylene glycol-mediated protoplast transformation. Planta 199, 193–201.
Koroleva, O. A., Tomlinson, M. L., Leader, D., Shaw, P., and Doonan, J. H. (2005). High-throughput protein localization in Arabidopsis using Agrobacterium-mediated transient expression of GFP-ORF fusions. Plant J. 41, 162–174.
Krueger, S., Giavalisco, P., Krall, L., Steinhauser, M. C., Bussis, D., Usadel, B., Flugge, U. I., Fernie, A. R., Willmitzer, L., and Steinhauser, D. (2011). A topological map of the compartmentalized Arabidopsis thaliana leaf metabolome. PLoS ONE 6, e17806. doi: 10.1371/journal.pone.0017806
Majeran, W., Cai, Y., Sun, Q., and van Wijk, K. J. (2005). Functional differentiation of bundle sheath and mesophyll maize chloroplasts determined by comparative proteomics. Plant Cell 17, 3111–3140.
Marcotte, E., Xenarios, I., Van Der Bliek, A., and Eisenberg, D. (2000). Localizing proteins in the cell from their phylogenetic profiles. Proc. Natl. Acad. Sci. U.S.A. 97, 12115.
Matthews, B. (1975). Comparison of the predicted and observed secondary structure of T4 phage lysozyme. Biochim. Biophys. Acta 405, 442–451.
Morgante, C. V., Rodrigues, R. A., Marbach, P. A., Borgonovi, C. M., Moura, D. S., and Silva-Filho, M. C. (2009). Conservation of dual-targeted proteins in Arabidopsis and rice points to a similar pattern of gene-family evolution. Mol. Genet. Genomics 281, 525–538.
Mutwil, M., Klie, S., Tohge, T., Giorgi, F., Wilkins, O., Campbell, M., Fernie, A., Usadel, B., Nikoloski, Z., and Persson, S. (2011). PlaNet: combined sequence and expression comparisons across plant networks derived from seven species. Plant Cell 23, 895.
Negrutiu, I., Shillito, R., Potrykus, I., Biasini, G., and Sala, F. (1987). Hybrid genes in the analysis of transformation conditions. Plant Mol. Biol. 8, 363–373.
Nickel, W., and Seedorf, M. (2008). Unconventional mechanisms of protein transport to the cell surface of eukaryotic cells. Annu. Rev. Cell Dev. Biol. 24, 287–308.
Nishikawa, K., Kubota, Y., and Ooi, T. (1983). Classification of proteins into groups based on amino acid composition and other characters. I. Angular distribution. J. Biochem. 94, 981–995.
Pant, B., Musialak-Lange, M., Nuc, P., May, P., Buhtz, A., Kehr, J., Walther, D., and Scheible, W. (2009). Identification of nutrient-responsive Arabidopsis and rapeseed microRNAs by comprehensive real-time polymerase chain reaction profiling and small RNA sequencing. Plant Physiol. 150, 1541–1555.
Parkinson, H., Kapushesky, M., Kolesnikov, N., Rustici, G., Shojatalab, M., Abeygunawardena, N., Berube, H., Dylag, M., Emam, I., Farne, A., Holloway, E., Lukk, M., Malone, J., Mani, R., Pilicheva, E., Rayner, T. F., Rezwan, F., Sharma, A., Williams, E., Bradley, X. Z., Adamusiak, T., Brandizi, M., Burdett, T., Coulson, R., Krestyaninova, M., Kurnosov, P., Maguire, E., Neogi, S. G., Rocca-Serra, P., Sansone, S. A., Sklyar, N., Zhao, M., Sarkans, U., and Brazma, A. (2009). ArrayExpress update – from an archive of functional genomics experiments to the atlas of gene expression. Nucleic Acids Res. 37(Suppl. 1), :D868.
Pfanner, N., and Geissler, A. (2001). Versatility of the mitochondrial protein import machinery. Nat. Rev. Mol. Cell Biol. 2, 339–349.
Pfannschmidt, T. (2010). Plastidial retrograde signaling – a true “plastid factor” or just metabolite signatures? Trends Plant Sci. 15, 427–435.
Rhee, S., Beavis, W., Berardini, T., Chen, G., Dixon, D., Doyle, A., Garcia-Hernandez, M., Huala, E., Lander, G., Montoya, M., Miller, N., Mueller, L. A., Mundodi, S., Reiser, L., Tacklind, J., Weems, D. C., Wu, Y., Xu, I., Yoo, D., Yoon, J., and Zhang, P. (2003). The Arabidopsis information resource (TAIR): a model organism database providing a centralized, curated gateway to Arabidopsis biology, research materials and community. Nucleic Acids Res. 31, 224–228.
Schmid, M., Davison, T. S., Henz, S. R., Pape, U. J., Demar, M., Vingron, M., Schölkopf, B., Weigel, D., and Lohmann, J. U. (2005). A gene expression map of Arabidopsis thaliana development. Nat. Genet. 37, 501–506.
Schulze, W., and Usadel, B. (2010). Quantitation in mass-spectrometry-based proteomics. Annu. Rev. Plant Biol. 61, 491–516.
Schwacke, R., Fischer, K., Ketelsen, B., Krupinska, K., and Krause, K. (2007). Comparative survey of plastid and mitochondrial targeting properties of transcription factors in Arabidopsis and rice. Mol. Genet. Genomics 277, 631–646.
Severin, A. J., Woody, J. L., Bolon, Y. T., Joseph, B., Diers, B. W., Farmer, A. D., Muehlbauer, G. J., Nelson, R. T., Grant, D., Specht, J. E., Graham, M. A., Cannon, S. B., May, G. D., Vance, C. P., and Shoemaker, R. C. (2010). RNA-Seq atlas of glycine max: a guide to the soybean transcriptome. BMC Plant Biol. 10, 160. doi: 10.1186/1471-2229-10-160
Small, I., Peeters, N., Legeai, F., and Lurin, C. (2004). Predotar: a tool for rapidly screening proteomes for N-terminal targeting sequences. Proteomics 4, 1581–1590.
Su, E., Chiu, H., Lo, A., Hwang, J., Sung, T., and Hsu, W. (2007). Protein subcellular localization prediction based on compartment-specific features and structure conservation. BMC Bioinformatics 8, 330. doi: 10.1186/1471-2105-8-330
Thum, K. E., Shin, M. J., Gutiérrez, R. A., Mukherjee, I., Katari, M. S., Nero, D., Shasha, D., and Coruzzi, G. M. (2008). An integrated genetic, genomic and systems approach defines gene networks regulated by the interaction of light and carbon signaling pathways in Arabidopsis. BMC Syst. Biol. 2, 31. doi: 10.1186/1752-0509-2-31
Trotter, M. W., Sadowski, P. G., Dunkley, T. P., Groen, A. J., and Lilley, K. S. (2010). Improved sub-cellular resolution via simultaneous analysis of organelle proteomics data across varied experimental conditions. Proteomics 10, 4213–4219.
Usadel, B., Blasing, O. E., Gibon, Y., Retzlaff, K., Hohne, M., Gunther, M., and Stitt, M. (2008). Global transcript levels respond to small changes of the carbon status during a progressive exhaustion of carbohydrates in Arabidopsis rosettes. Plant Physiol. 146, 1834–1861.
Usadel, B., Nagel, A., Steinhauser, D., Gibon, Y., Blaesing, O. E., Redestig, H., Sreenivasulu, N., Krall, L., Hannah, M. A., Poree, F., Fernie, A. R., and Stitt, M. (2006). PageMan an interactive ontology tool to generate, display, and annotate overview graphs for profiling experiments. BMC Bioinformatics 18, 535. doi: 10.1186/1471-2105-7-535
Usadel, B., Nagel, A., Thimm, O., Redestig, H., Blaesing, O. E., Palacios-Rojas, N., Selbig, J., Hannemann, J., Piques, M. C., Steinhauser, D., Scheible, W. R., Gibon, Y., Morcuende, R., Weicht, D., Meyer, S., and Stitt, M. (2005). Extension of the visualization tool MapMan to allow statistical analysis of arrays, display of corresponding genes, and comparison with known responses. Plant Physiol. 138, 1195–1204.
Usadel, B., Poree, F., Nagel, A., Lohse, M., Czedik-Eysenberg, A., and Stitt, M. (2009). A guide to using MapMan to visualize and compare Omics data in plants: a case study in the crop species, Maize. Plant Cell Environ. 32, 1211–1229
van Wijk, K. J., and Baginsky, S. (2011). Plastid proteomics in higher plants: current state and future goals. Plant Physiol. 155, 1578–1588.
von Heijne, G., Steppuhn, J., and Herrmann, R. G. (1989). Domain structure of mitochondrial and chloroplast targeting peptides. Eur. J. Biochem. 180, 535–545.
von Zychlinski, A., Kleffmann, T., Krishnamurthy, N., Sjölander, K., Baginsky, S., and Gruissem, W. (2005). Proteome analysis of the rice etioplast: metabolic and regulatory networks and novel protein functions. Mol. Cell Proteomics 4, 1072–1084.
Walters, R. G., Ibrahim, D. G., Horton, P., and Kruger, N. J. (2004). A mutant of Arabidopsis lacking the triose-phosphate/phosphate translocator reveals metabolic regulation of starch breakdown in the light. Plant Physiol. 135, 891–906.
Wienkoop, S., Baginsky, S., and Weckwerth, W. (2010). Arabidopsis thaliana as a model organism for plant proteome research. J. Proteomics 73, 2239–2248.
Zervakis, M., Blazadonakis, M. E., Tsiliki, G., Danilatou, V., Tsiknakis, M., and Kafetzopoulos, D. (2009). Outcome prediction based on microarray analysis: a critical perspective on methods. BMC Bioinformatics 10, 53. doi: 10.1186/1471-2105-10-53
Zhang, G., Guo, G., Hu, X., Zhang, Y., Li, Q., Li, R., Zhuang, R., Lu, Z., He, Z., Fang, X., Chen, L., Tian, W., Tao, Y., Kristiansen, K., Zhang, X., Li, S., Yang, H., Wang, J., and Wang, J. (2010). Deep RNA sequencing at single base-pair resolution reveals high complexity of the rice transcriptome. Genome Res. 20, 646–654.
Appendix
The formula used to linearly scale the microarray data between values of 0 and 1. V, Vmin, and Vmax are, respectively, the value to be scaled, the smallest, and the largest value in the expression data set.

The formula used to calculate Matthews’ correlation coefficient (MCC). Where, the true positive (TP) predictions is the total number of correctly predicted proteins which are localized in a particular compartment, the true negative (TN) predictions is the total number of proteins correctly predicted not to be localized in a particular compartment, the false positive (FP) predictions is the total number of proteins incorrectly predicted to be localized in a particular compartment, the false negative (FN) predictions is the total number of proteins incorrectly predicted not to be localized in a given compartment.
The formula used to calculate sensitivity (SE).

The formula used to calculate precision.

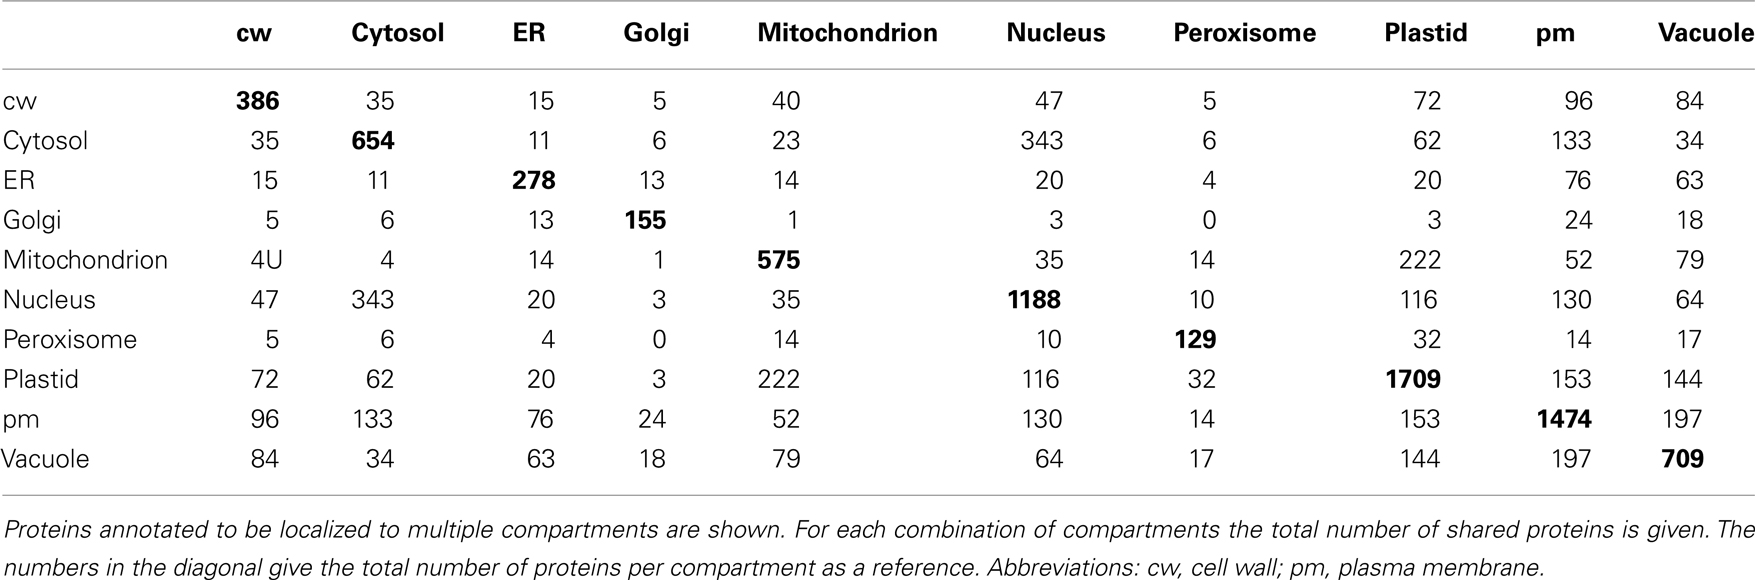
Table A1. Overlap between localizations for proteins representing 10 compartments.
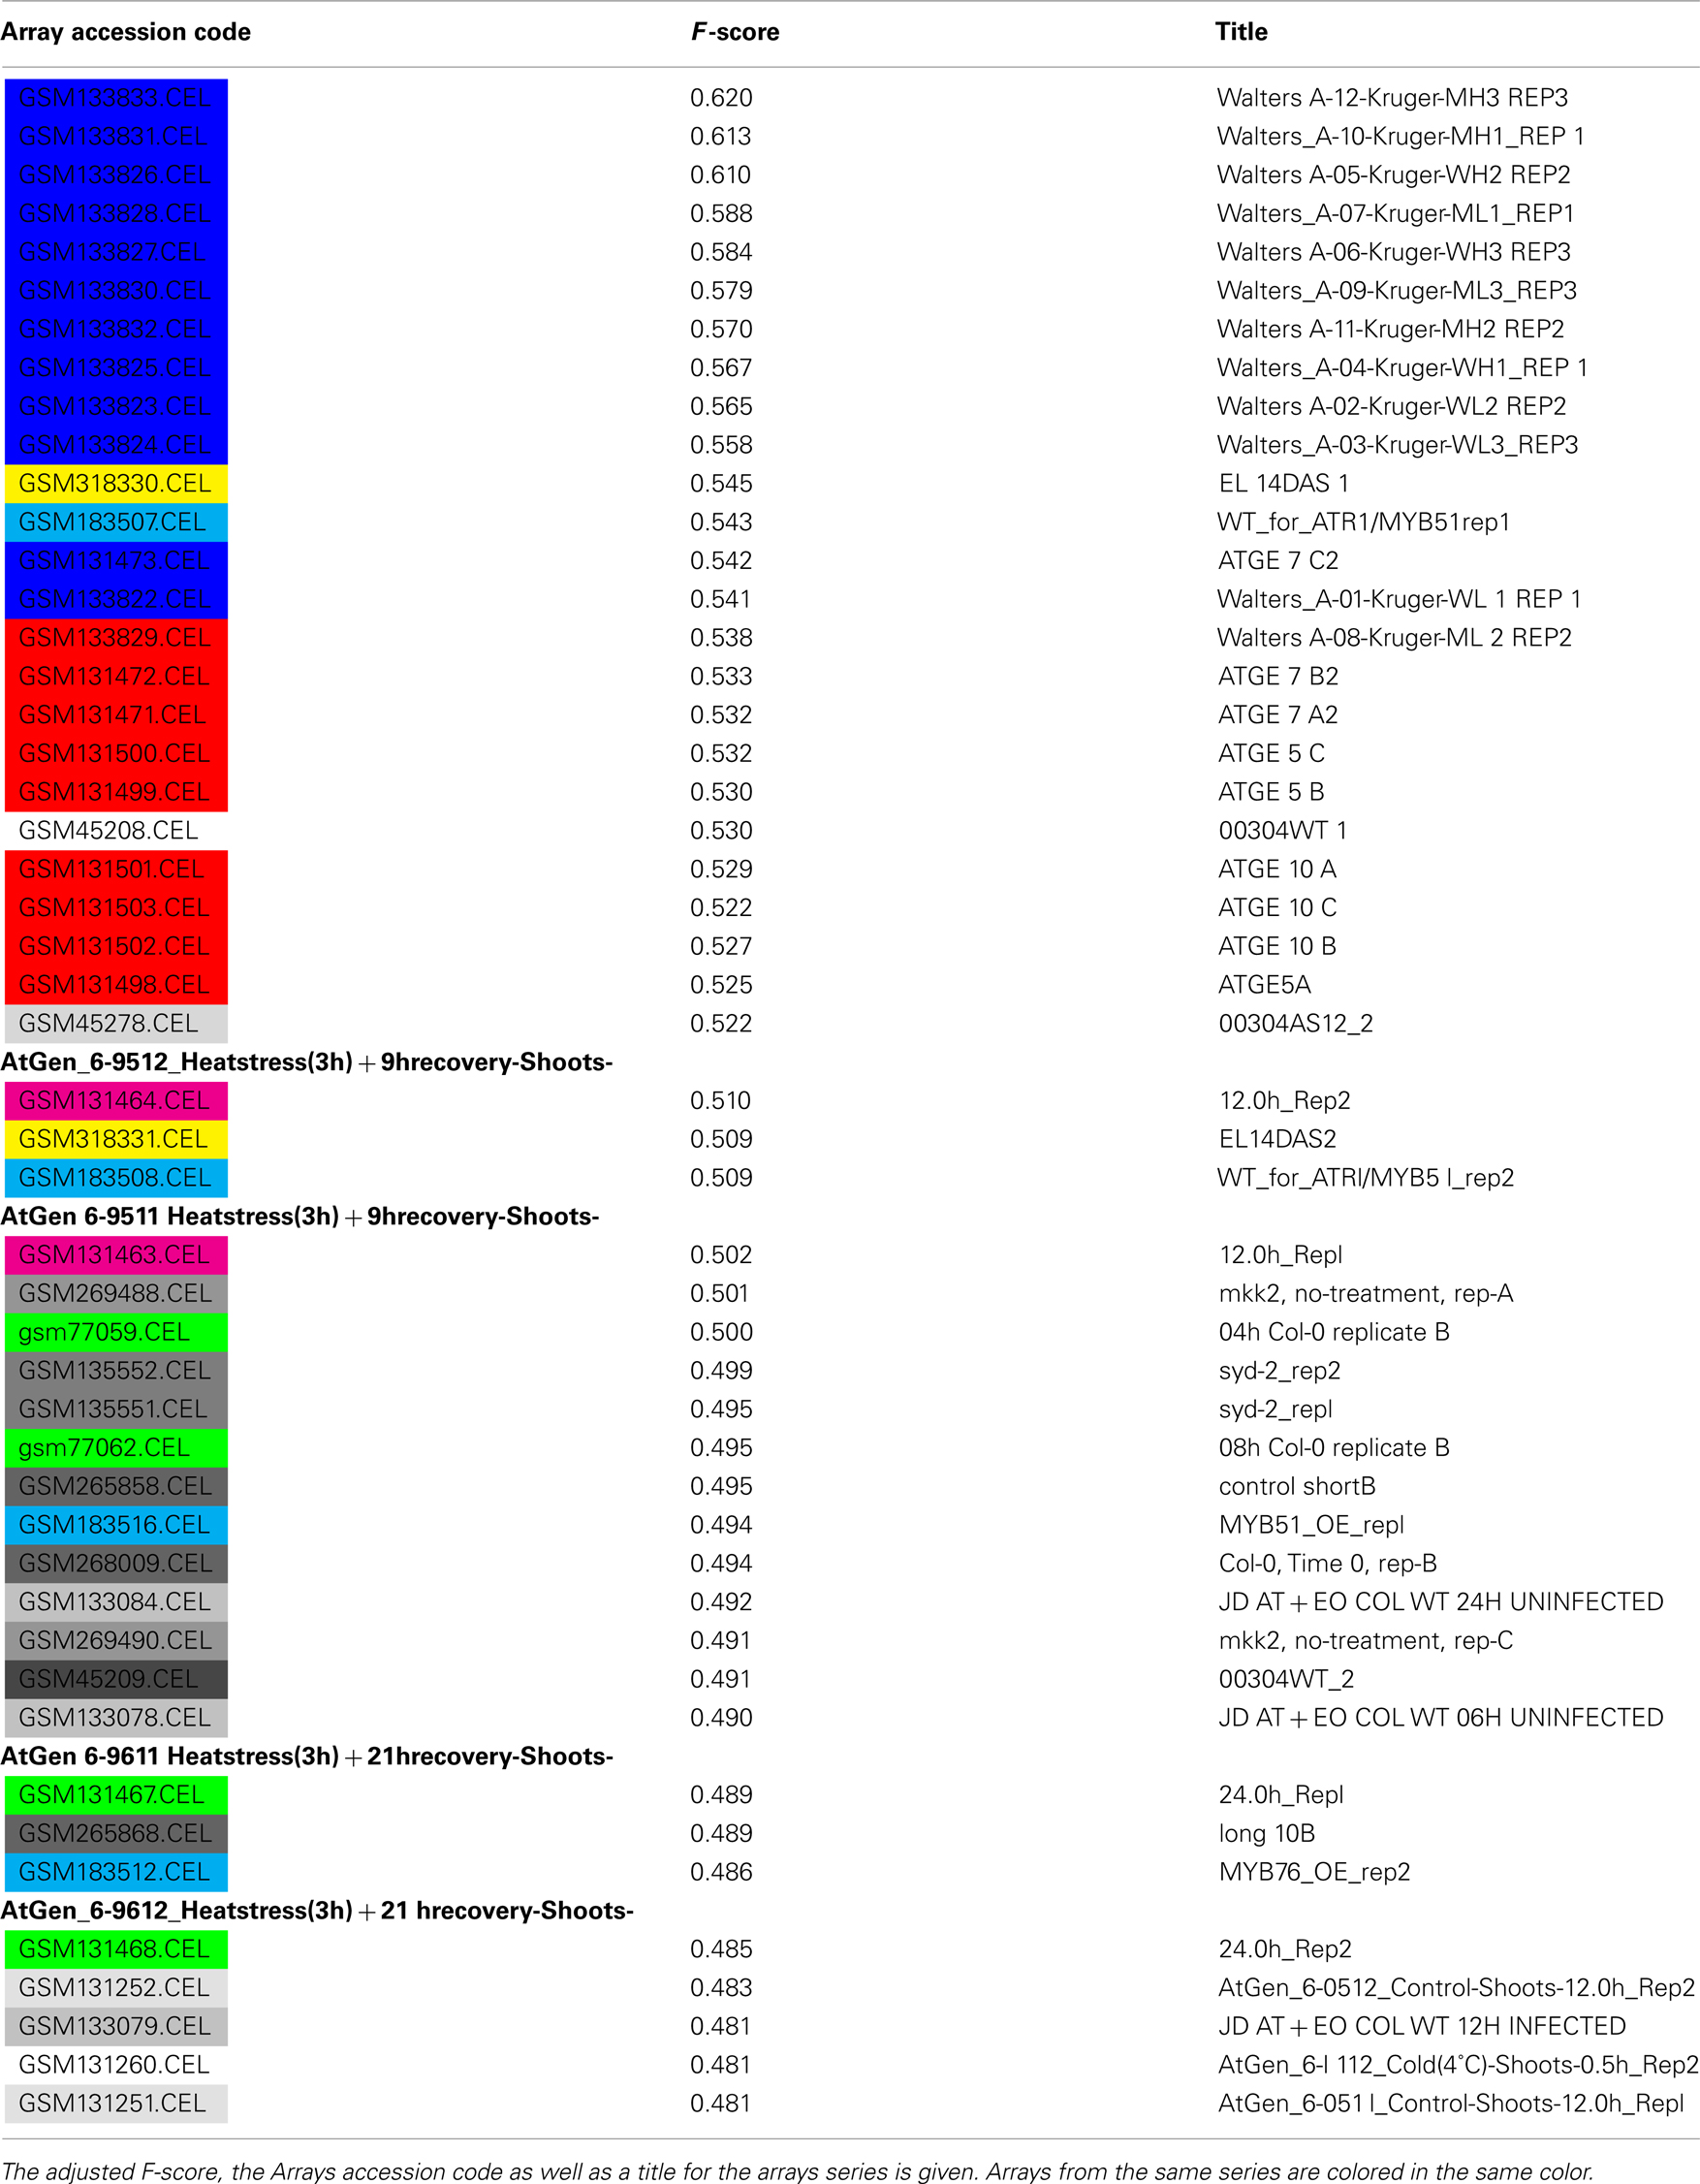
Table A2. Top Scoring Arrays for the plastid.
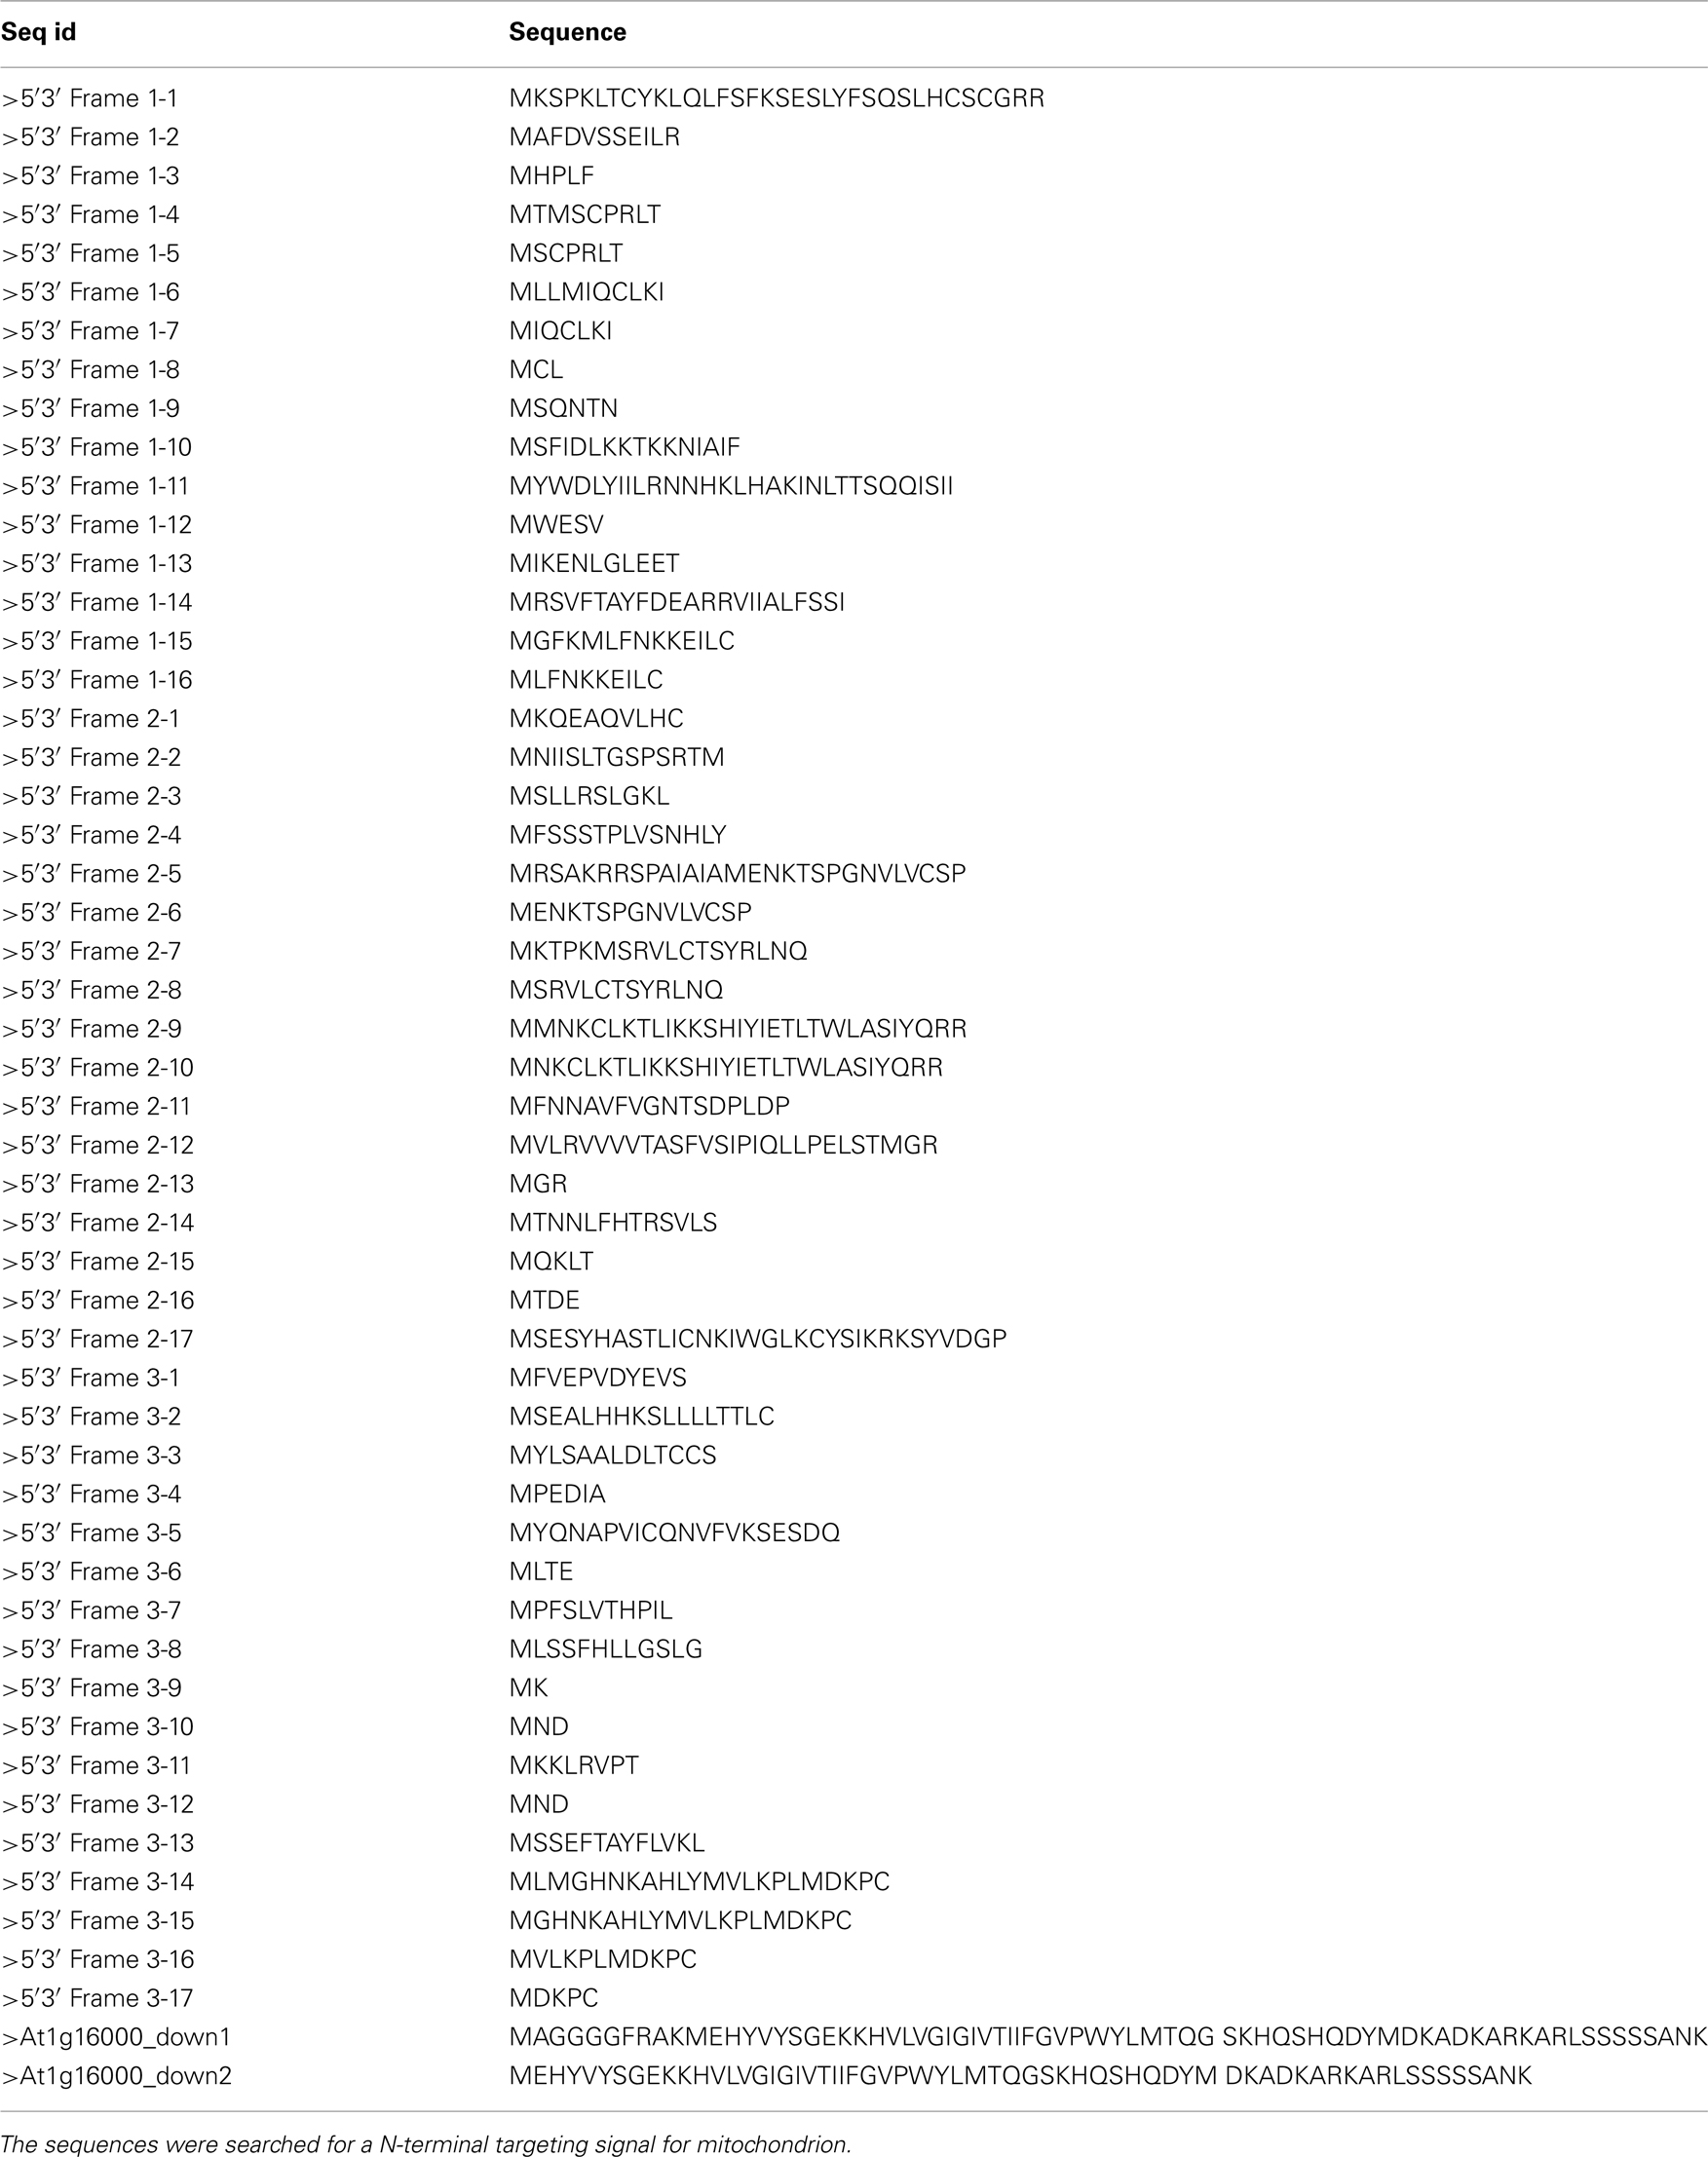
Table A3. Sequences of upstream and downstream regions of At1g1600.
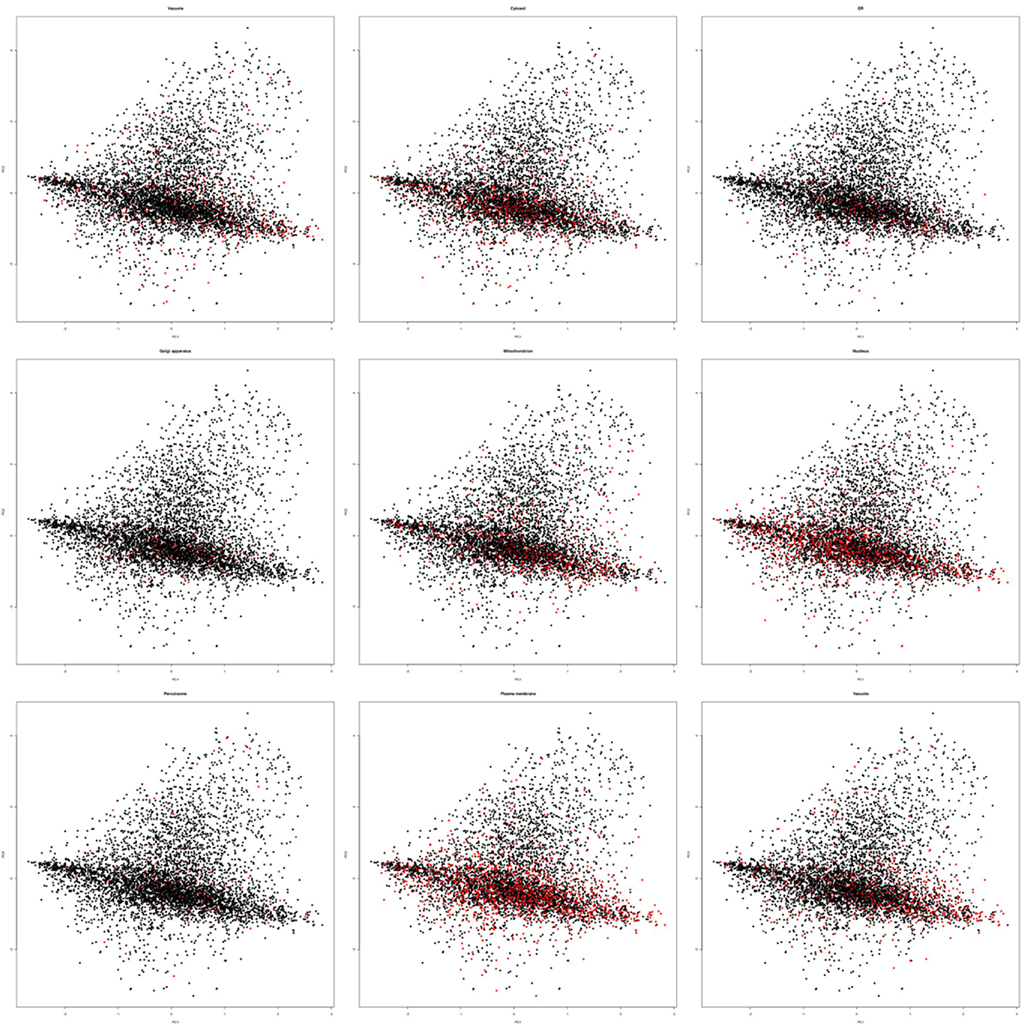
Figure A1. Principle component analysis plots for all compartments. Exemplary principal component plots showing proteins belonging to a compartment in red and all other proteins in black. In each case 500 array slides were randomly sampled for the PCA plots and displayed exactly as in Figure 1.
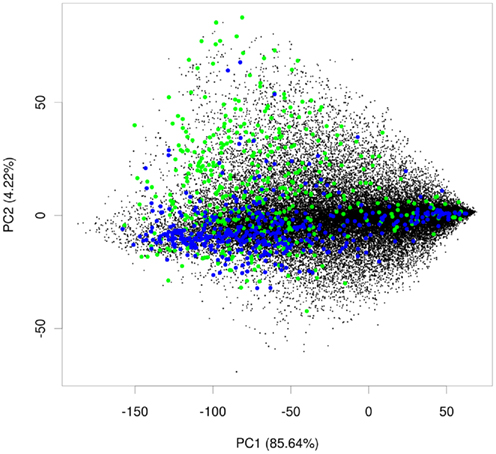
Figure A2. PCA plot for rice. Principal component analysis plot showing plastid proteins in green, mitochondrial proteins in blue, and proteins from other compartments in black.
Keywords: subcellular localization, support vector machine, prediction, gene expression
Citation: Ryngajllo M, Childs L, Lohse M, Giorgi FM, Lude A, Selbig J and Usadel B (2011) SLocX: predicting subcellular localization of Arabidopsis proteins leveraging gene expression data. Front. Plant Sci. 2:43. doi: 10.3389/fpls.2011.00043
Received: 18 May 2011; Accepted: 12 August 2011;
Published online: 12 September 2011.
Edited by:
Alisdair Fernie, Max Planck Institute for Plant Physiology, GermanyReviewed by:
Joshua L. Heazlewood, Lawrence Berkeley National Laboratory, USARainer Schwacke, University of Tromsø, Norway
Copyright: © 2011 Ryngajllo, Childs, Lohse, Giorgi, Lude, Selbig and Usadel. This is an open-access article subject to a non-exclusive license between the authors and Frontiers Media SA, which permits use, distribution and reproduction in other forums, provided the original authors and source are credited and other Frontiers conditions are complied with.
*Correspondence: Björn Usadel, Max Planck Institute of Molecular Plant Physiology, Am Muehlenberg 1, Golm, 14476 Potsdam, Germany. e-mail: usadel@mpmip-golm.mpg.de