 Alexandra Maier1‡ Holger Fahnenstich2†‡ Susanne von Caemmerer3 Martin K. M. Engqvist2‡ Andreas P. M. Weber4 Ulf-Ingo Flügge2 Veronica G. Maurino1*
- 1 Entwicklungs- und Molekularbiologie der Pflanzen, Heinrich-Heine-Universität, Düsseldorf, Germany
- 2 Botanisches Institut, Biozentrum Köln, Universität zu Köln, Cologne, Germany
- 3 Molecular Plant Physiology Group, Research School of Biology, Australian National University, Canberra, ACT, Australia
- 4 Institut für Biochemie der Pflanzen, Heinrich-Heine-Universität, Düsseldorf, Germany
The photorespiratory pathway helps illuminated C3-plants under conditions of limited CO2 availability by effectively exporting reducing equivalents in form of glycolate out of the chloroplast and regenerating glycerate-3-P as substrate for RubisCO. On the other hand, this pathway is considered as probably futile because previously assimilated CO2 is released in mitochondria. Consequently, a lot of effort has been made to reduce this CO2 loss either by reducing fluxes via engineering RubisCO or circumventing mitochondrial CO2 release by the introduction of new enzyme activities. Here we present an approach following the latter route, introducing a complete glycolate catabolic cycle in chloroplasts of Arabidopsis thaliana comprising glycolate oxidase (GO), malate synthase (MS), and catalase (CAT). Results from plants bearing both GO and MS activities have already been reported (Fahnenstich et al., 2008). This previous work showed that the H2O2 produced by GO had strongly negative effects. These effects can be prevented by introducing a plastidial catalase activity, as reported here. Transgenic lines bearing all three transgenic enzyme activities were identified and some with higher CAT activity showed higher dry weight, higher photosynthetic rates, and changes in glycine/serine ratio compared to the wild type. This indicates that the fine-tuning of transgenic enzyme activities in the chloroplasts seems crucial and strongly suggests that the approach is valid and that it is possible to improve the growth of A. thaliana by introducing a synthetic glycolate oxidative cycle into chloroplasts.
Introduction
Photosynthetic CO2 assimilation in C3-plants is limited by environmental parameters including temperature, CO2, and water availability. Much of this limitation can be attributed to the catalytic properties of ribulose 1,5-bisphosphate carboxylase/oxygenase (RubisCO). Both atmospheric O2 and O2 produced by photosystem II compete with CO2 for binding to the active site of RubisCO. The oxygenation of ribulose 1,5-bisphosphate (RuBP) yields only one molecule of glycerate 3-P, and the remaining two carbons form glycolate 2-P. This glycolate 2-P is the initial substrate of the C2-oxidative photosynthetic cycle (the photorespiratory cycle), leading to the loss of already fixed CO2 (for review see, Maurino and Peterhansel, 2010).
The primary function of the photorespiratory cycle is to salvage glycolate 2-P (Figure 1). In this pathway, two molecules of glycolate 2-P are metabolized to form one molecule each of glycerate 3-P and CO2. These carbon compounds are used for the regeneration of RuBP via the Calvin–Benson cycle (the C3-reductive photosynthetic cycle) without net synthesis of triose phosphates (Douce and Neuburger, 1999; Wingler et al., 2000).
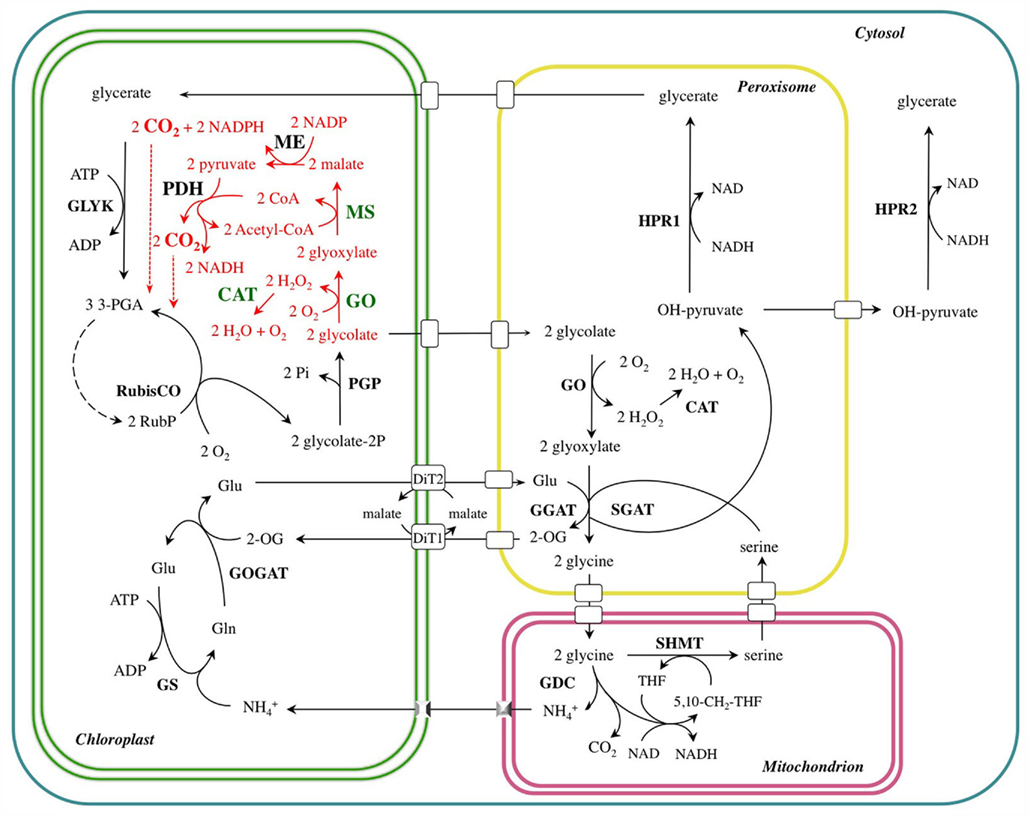
Figure 1. The photorespiratory carbon and nitrogen cycle (black) of a C3-plant short-circuited by the novel glycolate catabolic pathway (red). The transgenic enzymes introduced into A. thaliana chloroplasts are highlighted in green. DiT1, dicarboxylate translocator 1; DiT2, dicarboxylate translocator 2; CAT, catalase; GDC, glycine decarboxylase; GGAT: glutamate–glyoxylate aminotransferase; GLYK, glycerate kinase; GO, glycolate oxidase; GOGAT, glutamate–oxoglutarate aminotransferase; GS, glutamine synthetase; HPR, hydroxypyruvate reductase; ME, NADP-malic enzyme; MS, malate synthase; PDH, pyruvate dehydrogenase; PGP, phosphoglycolate phosphatase; SGAT, serine–glutamate aminotransferase; SHMT, serine hydroxymethyl transferase.
The photorespiratory pathway takes place in four distinct cellular compartments, namely chloroplasts, peroxisomes, mitochondria (the site of the release of CO2 and  ), and the cytosol. The pathway involves numerous enzymatic reactions and transport processes (Figure 1). The photorespiratory pathway relies on the close integration of carbon and nitrogen metabolism in the leaf, because
  is released at the same rate as CO2 (Keys et al., 1978). Since nitrogen is a more valuable resource than carbon, the re-assimilation of photorespired
  is essential for maintaining the nitrogen status in C3-plants (Leegood et al., 1995). Ammonia released in the matrix of mitochondria during the course of glycine oxidation diffuses to the chloroplast. Here, it is used by glutamine synthetase (GS) catalyzing the ATP-dependent conversion of glutamate to glutamine. Ferredoxin-dependent glutamate synthase (GOGAT), exclusively located to the chloroplasts of mesophyll cells, catalyzes the conversion of glutamine and 2-oxoglutarate to two molecules of glutamate (Figure 1).
Several ways to increase the carboxylase activity of RubisCO by enhancing the actual concentration of CO2 at its site of action have evolved. Examples are the CO2 concentrating mechanisms of cyanobacteria and algae (Bagder and Price, 2003; Giordano et al., 2005) or the photosynthetic cycle of C4-plants (Hatch, 1987). The latter provides a CO2 pump, which leads to an increased CO2/O2 ratio at the site of RubisCO and thus results in a decreased oxygenase activity. In C3-plants, RubisCO operates in vivo at about 25% of its Vmax, while it is believed to operate at or close to its Vmax in C4-plants (Hatch, 1987). Moreover, the specific activities of RubisCO are higher in C4-plants as compared to C3-plants; hence, less RubisCO protein is required to achieve high rates of photosynthesis in C4-plants. Due to the fact that the biosynthesis of RubisCO consumes large quantities of nitrogen (20–30% of total leaf N in C3-plants, but only 6% in C4-plants), C4-plants have greater photosynthetic nitrogen use efficiency than C3-plants (Sage et al., 1987). Attempts have been made to transfer the advantages of C4-photosynthesis, such as high photosynthetic capacity, rapid growth, and increased nitrogen- and water-use efficiencies, into C3-plants by overexpression of C4-cycle enzymes (Ishimaru et al., 1997; Häusler et al., 2001; Matsuoka et al., 2001). In potato and tobacco, Häusler et al. (2001) have shown an attenuation of photorespiration; however, this was accompanied by changes in the expression of endogenous enzymes and contents of UV-protectants. Recently, Kebeish et al. (2007) introduced the E. coli glycolate catabolic pathway (glycolate dehydrogenase, glyoxylate carboligase, and tartronic semialdehyde reductase) into Arabidopsis thaliana chloroplasts to convert glycolate into glycerate. These plants showed enhanced biomass production. Surprisingly, similar results were obtained when only the gene coding for glycolate dehydrogenase, the first enzyme of the pathway, was introduced.
In previous work we produced A. thaliana plants with a functional chloroplastic glycolate catabolic cycle (GO–MS plants, Fahnenstich et al., 2008). In this pathway, glycolate formed due to the oxygenase activity of RubisCO is converted into glyoxylate inside the chloroplasts by glycolate oxidase (GO), with the production of hydrogen peroxide (H2O2) as a side product. In the following step, malate synthase (MS) generates malate by condensing acetyl-CoA with glyoxylate. Malate is further decarboxylated to pyruvate by the chloroplastic NADP-malic enzyme (NADP-ME), with the concomitant reduction of NADP to NADPH. In the final step of the pathway, chloroplastic pyruvate dehydrogenase (PDH) converts pyruvate into acetyl-CoA, yielding NADH and another molecule of CO2. As a result of this cycle, one molecule of glycolate is converted by oxidation into two molecules of CO2, and reducing power in the form of NADPH and NADH is produced. GO–MS plants were smaller than wild type but bigger than the parental GO lines (Fahnenstich et al., 2008). They presented pale-green rosettes at moderate photon fluxes and oxidative stress under higher photon fluxes due to accumulation H2O2 (Fahnenstich et al., 2008).
To promote the detoxification of excess H2O2 produced as a consequence of the GO activity the E. coli catalase gene (CAT) was co-expressed and targeted to the chloroplasts of GO–MS plants (Figure 1; Maurino and Flügge, 2009). As a result of this pathway, glycolate is partially recycled within the chloroplast and accumulation of H2O2 should be avoided. Furthermore, C and N losses through the photorespiratory pathway should be also reduced. We present the generation and analysis of transgenic A. thaliana plants harboring the glycolate catabolic cycle and catalase in chloroplasts. We show that in this transgenic approach an increased metabolization of glycolate and H2O2 in the chloroplast leads to enhanced CO2 fixation and growth improvement.
Materials and Methods
Construction of a Binary Vector to Express Catalase in Chloroplasts
The genomic sequence of E. coli catalase (KatE; M55161) was amplified using Platinum Pfx DNA polymerase (Invitrogen, Karlsruhe, Germany) and cloned into pCR-Blunt II-TOPO (Invitrogen). The following primer combination was used: KatE fow1 (5′-ACACCGGTCGCAACATAACGAAAAGAACCCA-3′) and KatE rev1 (5′-ACGTCGACTCAGGCAGGAATTTTGTCAATCT-3′). The primers introduced unique AgeI and SalI sites at the 5′ and 3′ ends of KatE, respectively. To target KatE to the chloroplast, a fragment containing the tomato-RubisCO-small subunit (rbcS3C; X66072) promoter (715 bp) and transit peptide (172 bp) was amplified by PCR using genomic DNA and the following primers: rbcS3C fow1 (5′-ACGAGCTCATCCAGAATTGGCGTTGGATTA-3′) and rbcS3C rev (5′-AGCAACGGTGGAAGAGTCAGTTGCAACCGGTAT-3′). The primers were designed to introduce unique SacI and AgeI sites at the 5′ and 3′ ends, respectively. The fragment obtained was inserted upstream of the KatE coding region. All plasmid constructs were sequenced to exclude any possible mutation that could be created by the polymerase action.
To direct the expression in A. thaliana, the DNA encoding the plastidic precursor KatE was cloned into a modified version of the binary vector pGreenII (Fahnenstich et al., 2007), using the tomato-rbcS3C promoter to direct the expression and the selection marker gene nosBAR (BASTA resistance). The resulting plasmid was called rbcS3C:KatE.
Transformation of A. thaliana and Selection of Transformants
The binary vector rbcS3C:KatE was electroporated into Agrobacterium tumefaciens GV3101 bearing the helper plasmid pSoup. This was then used to transform A. thaliana plants (Columbia ecotype, Col-0) via vacuum infiltration (Bechtold et al., 1993). Transformed seeds were selected for BASTA resistance. Plants containing the transgenes were allowed to self-pollinate. Transgenic lines were subjected to two more rounds of selection, at which point they were homozygous for the insertion. The genomic insertion of the KatE construct was confirmed by PCR as well as enzymatic activity assays.
Production of GMK Transformants
Glycolate oxidase–MS lines were produced in our previous work by transformation of GO (line 5, GO5) with the vector rbcS3C:MS (Fahnenstich et al., 2008). Lines containing all three genes (GMK lines) were produced by re-transformation of GO–MS (line 6, GO–MS6) with the vector rbcS3C:KatE. In all cases, the lines were selected taking advantage of the different resistance markers. Selection was corroborated by PCR, Southern blot and determination of enzymatic activities.
Plant Growth Conditions
Plants were grown in pots containing three parts of soil (Gebr. Patzer KG, Sinntal-Jossa) and one part of vermiculite (Basalt Feuerfest, Linz). They were grown under an 8 h-light/16 h-dark regime (short-day conditions) at photosynthetically active photon flux densities (PPFD) of 100 or, alternatively, 600 μmol quanta m−2 s−1 (normal and high light intensities for Arabidopsis, respectively) and 22°C day/18°C night temperatures. For the assays at non-photorespiratory conditions, plants were grown in a chamber with a CO2 concentration of 2000 ± 200 ppm at a PPFD of 100 μmol quanta m−2 s−1.
Extraction of RNA and RT-PCR Analysis
To analyze the expression of the transgenes, total RNA from 100 mg of leaf tissue was isolated using the TRIzol reagent (Gibco-BRL). RNA was converted into first strand cDNA using the SuperScriptII Reverse Transcriptase (Invitrogen). PCR reactions were conducted in a final volume of 10 μl using 0.5 μl of the transcribed product and Taq DNA polymerase (Qiagen). PCR was conducted using primer pairs PGM fow (5′-TAGGTACCCAATCAACAATGACGTCGACCTAC-3′) and GO rev1 (5′-TGGGACACTCCACGTCCTTAGTCTAGACTAGTA-3′), rbcS3C fow2 (5′-ATGGCTTCTTCAGTAATGTCCTCAGCAGCT-3′) and MS rev1 (5′-CACATAGGCATACATCATCCCAGGTGAGTCGACGTT-3′), and rbcS3C fow2 and KatE rev1 (5′-ACGTCGACTCAGGCAGGAATTTTGTCAATCT-3′) to amplify the GO (1.3 kb), MS (1.8 kb), and KatE (2.4 kb) full-length cDNA fragments, respectively. As control, the actin2 gene was amplified. The primers used were Aktin2S for (5′-TGTACGCCAGTGGTCCTACAACC-3′) and Aktin2B rev (5′-GAAGCAAGAATGGAACCACCG-3′). PCR products were resolved on a 1.0% (w/v) agarose gel.
Chloroplast Isolation, Preparation of Extracts, and Enzymatic Measurements
Intact chloroplasts were isolated as described by Kunst et al. (1988). Pelleted chloroplasts were resuspended in the corresponding extraction buffer (see below) and used directly for the enzymatic measurements. Alternatively, leaf material was homogenized in the presence of liquid N2 and resuspended in extraction buffer consisting of 50 mM KH2PO4, pH 7.0, 1% (v/v) polyvinylpyrrolidone (PVP)-40 and 0.1% (v/v) Triton X-100. Catalase activity was determined in 50 mM KH2PO4, pH 7.0 as described by Havir and McHale (1987). The reaction was started by the addition of 10 mM H2O2 and followed at 240 nm at 25°C. One unit is defined as the amount of enzyme catalyzing the decomposition of 1 μmol H2O2 per minute, calculated from the extinction coefficient for H2O2 at 240 nm of 43.6 M−1 cm−1. The catalase activity measurements were normalized to the glyceraldehyde-3-phosphate dehydrogenase activity, which was determined in chloroplast extracts as previously described (Ferri et al., 1978). GO and MS activities were measured as described by Fahnenstich et al. (2008).
Metabolite Contents and Qualitative Assay of Starch Content
For metabolite analysis, whole rosettes from 5-week-old plants were collected in the middle of the light period and immediately frozen in liquid nitrogen. Three independent biological replicates were used. The tissues were ground in a mortar, and a 50-mg fresh weight aliquot was extracted using the procedure described by Lee and Fiehn (2008). Ribitol was used as an internal standard for data normalization. For GC-EI-TOF analysis, samples were processed and analyzed according to Lee and Fiehn (2008). Starch accumulation was determined by the iodine staining method (Caspar et al., 1986).
Elemental Analysis and δ13C Determination
For elemental and stable isotope analysis, leaves from 5-week-old wild type and GMK3 plants were ground into a fine powder and lyophilized. This was followed by analysis using an Isoprime 100 isotope ratio mass spectrometer coupled to an Elementar elemental analyzer (ISOTOPE cube; Elementar Analysensysteme) following the manufacturer’s recommendations. The calibration for δ13C measurements followed the two-point method described by Coplen et al. (2006).
Analysis of Leaf Pigments
For pigment analysis, leaves from 5-week-old wild type and GMK3 plants were frozen in liquid N2 and stored at −80°C. Pigments were extracted with acetone and quantified by reverse-phase HPLC (Färber et al., 1997). Chlorophyll a and b content were quantified spectrophotometrically according to Porra et al. (1989) after extraction from frozen leaf disks with 80% acetone.
Protein Determination and Polyacrylamide Gel Electrophoresis
Protein extracts were prepared from leaves of 4-week-old plants by grinding leaf material in liquid nitrogen and resuspending it in 100 mM Tris–HCl, pH 7.5, 5 mM MgCl2, 2 mM EDTA, 10% (v/v) glycerol, and 10 mM 2-mercaptoethanol, in the presence of a protease inhibitor cocktail (Sigma-Aldrich, St Louis, USA). The homogenates were clarified by centrifugation at 4°C and protein concentration was determined according to the method of Bradford (1976) using Roti-Quant solution (Carl Roth GmbH & Co. KG, Karlsruhe, Germany). The supernatants (20 μg protein) were separated by 12.5% SDS-PAGE (Laemmli, 1970) and visualized by staining with Coomassie Brilliant Blue.
CO2 Assimilation Rate Chlorophyll and Fluorescence Parameters
Gas exchange measurements were made on leaves of plants grown in Canberra. Plants and two LI-6400 (Li-Cor, Lincoln, NE, USA) were placed inside a controlled environment cabinet (TRIL-1175, Thermoline Scientific Equipment, Smithfield, NSW, Australia) with fluorescent lighting and a temperature of 25°C. Input gasses (N2 and O2) were mixed using mass flow controllers (OMEGA Engineering, Inc., Stamford, CT, USA). Gas exchange measurements were made at an irradiance of 1000 μmol quanta m−2 s−1, leaf temperature 25°C, and a leaf to air vapor pressure of approximately 10 mbar. At first, CO2 assimilation rate was measured for approximately 30 min at an ambient CO2 partial pressure of approximately 348 μbar and 21% O2. Then CO2 partial pressures were lowered stepwise and the compensation pointed (γ) estimated from the slope of the CO2 response curve of CO2 assimilation. Measurements at low CO2 partial pressures were repeated at 5, 15, 2, 7, 10, and 30% O2. The FV/FM index was calculated as previously described in Fahnenstich et al. (2008).
Biochemical Measurements
Following gas exchange, duplicate samples (0.5 cm2) of leaf were taken from the sampling area and immediately frozen in liquid nitrogen and stored at −80°C. RubisCO content in each sample was measured by the [14C]carboxyarabinitol-P2 binding assay procedure according to Ruuska et al. (1998). Dry mass of leaves was measured after 48 h at 80°C.
Determination of Leaf Thickness and Light Microscopy
For the determination of leaf thickness sections of 5-week-old leaves of wild type and GMK3 plants were used. Leaf sections were fixed for 3 h in 2.5% glutaraldehyde (v/v), 100 mM NaPi, pH 7.2, and washed three times with 100 mM NaPi. The samples were dehydrated in standard ethanol series and incubated two times during 10 min in acetone 100% (v/v). Then they were transferred to acetone:araldite 1:1 (v/v) and incubated for 16 h. Acetone was evaporated and samples were embedded into fresh araldite during 3 h and polymerized in araldite for 24 h at 65°C. Cross sections of 2 μm thickness were cut with a rotation Reichert OM U2 microtome and attached to gelatine-coated microscope slides. For light microscopy the sections were stained with an aqueous solution of 0.05% of toluidine blue O in 0.1 M NaPi, pH 6.8. Sections were analyzed using a Nikon eclipse E800 microscope equipped with a digital camera (ky-F1030, JVC, Japan). Leaf thickness was determined between the central and both outer lateral veins using the program Diskus (Hilgers). At least 80 sections, belonging to leaves of six different plants were analyzed.
Statistical Analysis
Significance was determined according to the two-sided Student’s t-test using the Excel computer program (Microsoft Corp.).
Results
Co-Expression of Glycolate Oxidase, Malate Synthase, and Catalase in A. thaliana Chloroplasts
We have previously shown that the expression of GO in chloroplasts promotes the intra-organellar oxidation of glycolate to glyoxylate with concomitant production of H2O2 (Fahnenstich et al., 2008). Homozygous GO plants are characterized by a reduced rosette diameter, reduced fresh weight, and yellowish leaves. A representative GO line containing only one transgene insertion (GO5, Fahnenstich et al., 2008), displaying a 30% higher GO activity compared to the wild type (Figure 2A), was later transformed with a plasmid encoding MS, which was post-translationally directed to the chloroplasts (Fahnenstich et al., 2008). All resulting GO–MS lines had an intermediate size between the GO and the wild type plants (Fahnenstich et al., 2008; Figure 3A). The GO–MS plants showed the GO phenotype when exposed to stress conditions. However, the glyoxylate levels were similar to that of the wild type (Fahnenstich et al., 2008), indicating that MS was able to further metabolize glyoxylate.
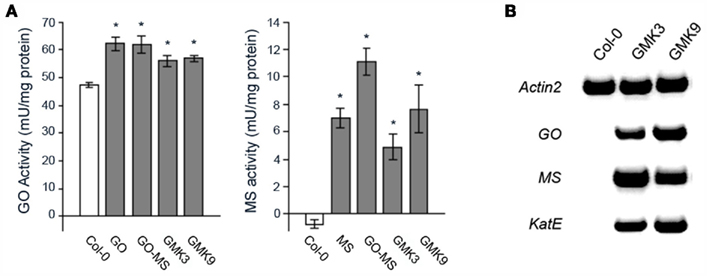
Figure 2. (A) Glycolate oxidase (GO-) and malate synthase (MS-) activity in rosettes of transgenic and wild type plants. The values presented are the means ± SE of at least 8 plants each. Asterisks indicate significant differences to the wild type values (Student’s t-test P < 0.05). (B) Expression of the transgenes in the GMK lines assessed by RT-PCR. RNA was extracted and reversed transcribed as described in Section “Materials and Methods.” Full-length GO (1.3 kb), MS (1.8 kb), and KatE (2.4 kb) cDNA fragments were amplified by 32 cycles. As loading control Actin 2 was amplified by 29 cycles.
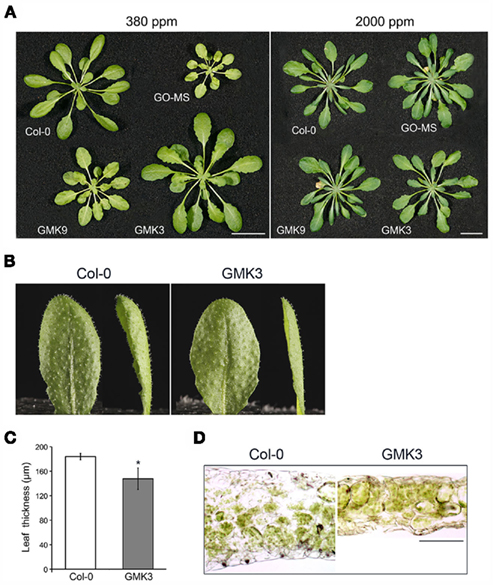
Figure 3. (A) Growth characteristics of 5-week-old transgenic and wild type (Col-O) plants grown in short-day conditions at ambient (380 ppm) and high CO2 (2000 ppm) concentrations. Bar: 1 cm. (B) Leaves of wild type and GMK3 plants. (C) Leaf thickness was measured from transverse leaf sections prepared from leaves of plants grown in SD at a PFD of 100 μmol m−2 s−1. Error bars indicate the SE (n = 80 sections from at least six individual plants). The asterisk (*) indicates significant differences between the values of wild type and GMK3 plants calculated by the Student’s t-test (P < 0.05). (D) Light microscopy of leaf cross sections of wild type and GMK3 plants cut manually. Bar: 100 μm.
Here, to promote the detoxification of excess H2O2 produced by the GO activity as demonstrated in our previous work (Fahnenstich et al., 2008), E. coli catalase (KatE) was expressed and targeted to the plastids of a representative GO–MS line containing only one MS transgene insertion (GO–MS2, Fahnenstich et al., 2008). Independent lines bearing all transgenes (GMK lines) were selected by BASTA resistance. Those lines containing catalase activities higher than the wild type were subjected to two additional rounds of screening to obtain non-segregating T3 lines. The first homozygous generation of some lines (e.g., GMK1 and GMK3) showed bigger rosettes than the wild type and expressed all the transgenes as analyzed by RT-PCR (not shown). However, further generations of line GMK1 were as big as the wild type and sometimes showed yellowish leaves. RT-PCR analysis of these further generations of GMK1 confirmed that this line had a very low expression of the catalase transgene, probably due to silencing effects. Due to this, lines GMK3 and GMK9 were selected for further analysis. Chloroplast preparations from leaves of 5-week-old GMK3 and GMK9 plants showed 71 ± 14 and 17 ± 7% higher catalase activity than that measured in wild type controls, indicating that the novel catalase activity was correctly localized to plastids and that GMK3 possessed four-time higher activity than GMK9. Southern blot analysis indicated that line GMK3 contained only one KatE transgene insertion, while GMK9 contained three insertions (not shown). RT-PCR analysis showed that these GMK lines harbored and expressed all the transgenes (Figure 2B). Measurements of activity indicated that the expressed proteins were active and that GMK3 and GMK9 plants presented similar GO and MS activities (Figure 2A). In comparison to the parental GO and GO–MS plants, GO and MS activities in GMK plants were lower most probably due to lower expression of the transgene after the nine generations the plants had to be grown to obtain triple homozygous transgenes. To exclude any phenotypic alteration caused by the single transgene expression, MS and KatE were also expressed in the wild type background. In both cases, lines with MS or catalase activities similar to those found in the GMK lines were obtained (not shown).
Characterization of GMK Lines
Phenotypic characterization
GMK3 plants showed a statistically significant increase in rosette biomass with respect to wild type (Table 1). Conversely, GMK9 rosettes were bigger than the parental GO–MS plants but still smaller than the wild type in short-day conditions of growth (Figure 3A). GMK3 plants were bigger than wild type (Figure 3A), showing higher number of leaves and an increase in the rosette dry and fresh weights of 36 and 28%, respectively, compared to the wild type (Table 1). Interestingly, leaves of GMK3 were flatter and thinner than the wild type (Figures 3B–D). Negligible phenotypical differences were observed when all lines were grown under non-photorespiratory conditions (2000 ppm CO2; Figure 3A; Table 1), where the inhibition of the oxygenase activity of RubisCO led to a reduced production of glycolate inside the chloroplast. As all lines entered senescence after 7 weeks under high CO2 concentration to compare the growth characteristics under different CO2 concentrations, images of the plants were therefore taken after 5 weeks of growth (Figure 3A). Control lines overexpressing single MS and KatE behaved like the wild type under all experimental conditions (not shown).
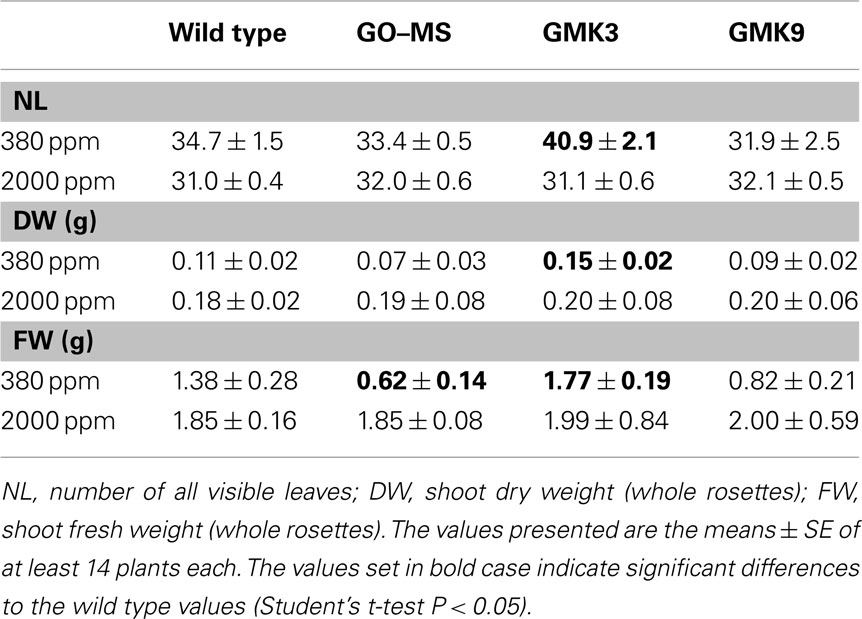
Table 1. Growth parameters of 7-week-old transgenic and wild type plants grown in short days at 100 μmol quanta m− 2 s− 1 at ambient (380 ppm) or at high CO2 (2000 ppm) concentrations.
Starch accumulation and metabolite pool sizes
To evaluate the impact of the introduction of the glycolate catabolic cycle into chloroplasts of A. thaliana on primary metabolism, starch accumulation and metabolite pool sizes were analyzed in rosette leaves of transgenic plants.
Starch accumulation after 6 h in the light was determined by iodine staining in leaves of plants from the different genotypes grown under moderate light intensity. The GO–MS transformants accumulated less transitory starch than the wild type, while the GMK3 plants accumulated starch like the wild type (Figure 4A). Similar levels of starch accumulation were observed in all lines when grown at high CO2 concentrations (Figure 4B). Interestingly, when the lines were grown under moderate light intensity and then transferred to high light intensity (600 μmol quanta m−2 s−2) for 7 days, the GMK3 plants accumulated starch like the wild type, whereas the GO–MS and GMK9 transgenic lines had lost this capacity (Figure 4C). In line with these results, GO–MS and GMK9 lines showed intense yellowing and oxidative lesions (Figure 4D), indicating that after long-term exposure to high light, GMK9 plants developed the GO phenotype (Fahnenstich et al., 2008); this was most probably due to an increased accumulation of H2O2 compared to GMK3 plants, which contained a higher catalase activity in the chloroplasts.
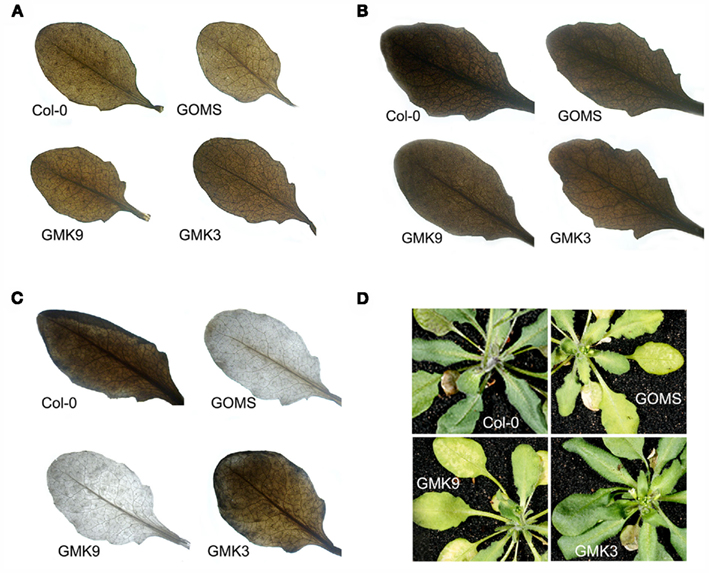
Figure 4. Accumulation of starch by the iodine staining method in leaves of transgenic and wild type plants after 6 h in the light period. (A) Six-week-old plants grown at 100 μmol quanta m−2 s−1 and 380 ppm. (B) Six-week-old plants grown at 100 μmol quanta m−2 s−1 and 2000 ppm. (C) Plants grown during 6 weeks as in (A) and transferred for 7 days at 600 μmol quanta m−2 s−1 during the light period. Photographs were taken at the end of this treatment. (D) Phenotype of the plants treated as in (C).
We then evaluated the capacity of GMK3 plants to accumulate end products of photosynthesis, by determining the corresponding metabolite pool sizes after 6 h in the light by GC–MS analysis. The GMK3 plants showed sucrose, glucose, and fructose levels similar to that of the wild type (Table 2). Other sugars showed no significant differences with respect to the wild type except for the sugar alcohol glycerol, which was decreased in GMK3 plants (Table 2).
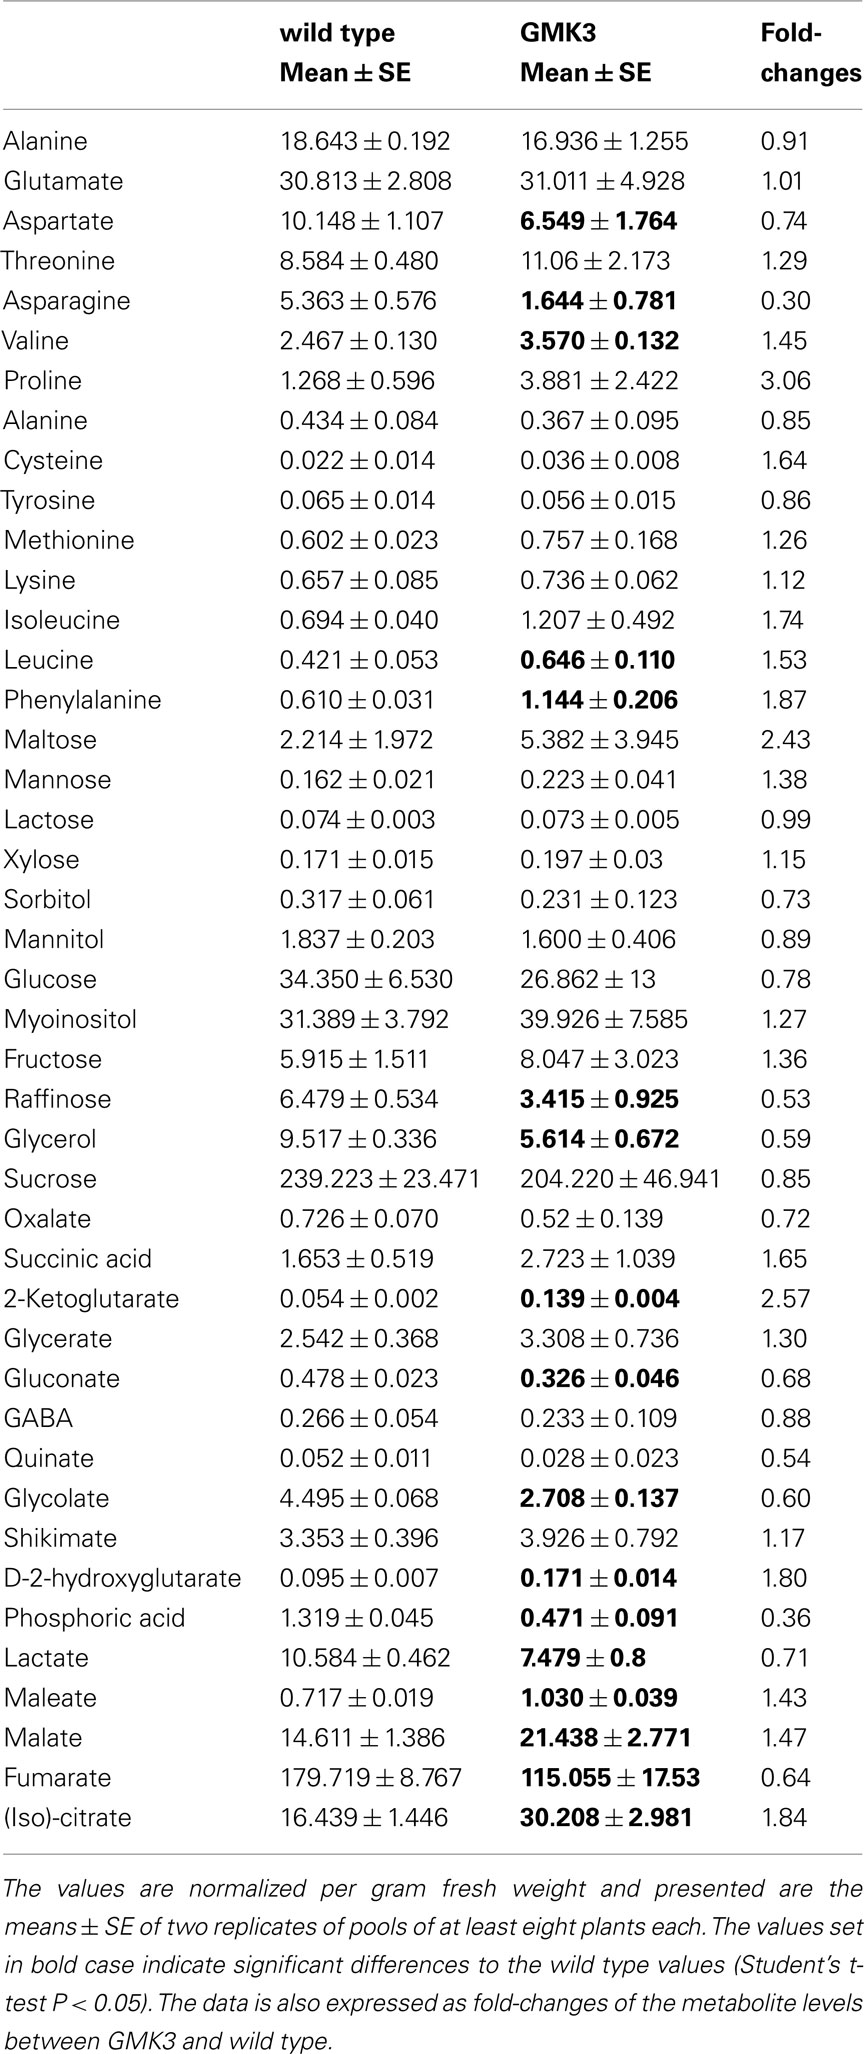
Table 2. Relative metabolite levels (to the internal standard ribitol) measured by GC–MS of whole rosette leaves harvested after 6 h in the light period from plants grown at 100 μmol quanta m− 2 s− 1.
Moreover, the GMK3 plants presented significantly lower levels of asparagine, gluconate, glycolate, lactate, and maleate, as well as significantly higher levels of threonine, valine, leucine, phenylalanine, (iso)citrate, succinate, malate, 2-ketoglutarate, and D-2-hydroxyglutarate (Table 2).
Elemental Analysis
Elemental analysis showed that GMK3 plants have similar carbon to nitrogen ratios (6.22 ± 0.29) as the wild type (5.97 ± 0.06), indicating that the transgenic plants can balance nitrogen and amino acid metabolism. In accordance with these findings, no differences in the amount of RubisCO or other major protein bands were observed between leaf crude extracts of GMK3 and wild type plants as evaluated by SDS-PAGE (Figure 5A).
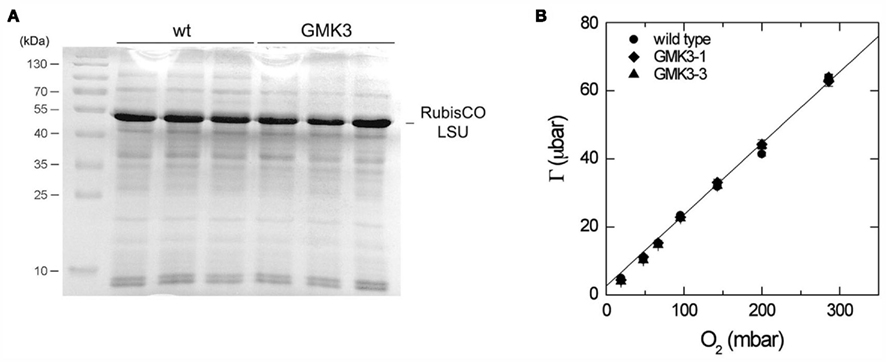
Figure 5. (A) SDS-PAGE stained with Coomassie brilliant blue of crude extracts of three different wild type and GMK3 plants. The same amount of protein (20 μg) was loaded per lane. The band corresponding to the RubisCO large subunit (LSU) is indicated on the right and molecular mass markers are shown on the left. (B) CO2 compensation point, Γ, as a function of O2 partial pressure for wild type and two GMK3 mutants. Measurements were made at a leaf temperature of 25°C and an irradiance of 1000 μmol quanta m−2 s−1. The line is the relationship between Γ and O2 predicted by the model of Farquhar et al. (1980), assuming that 0.5 mol of CO2 are released in the photorespiratory cycle per RubisCO oxygenation and using the kinetic constants for RubisCO from Table 2.3, von Caemmerer (2000; Γ = 0.2096*O2 + 2.62). The slope and intercepts for the regressions of wild type, GMK3-1, and GMK3-3 are given in Table 3.
Pigment Analysis
In accordance with the fact that GMK3 leaves are flatter and thinner than wild type leaves, the chlorophyll content per area and fresh weight of GMK3 plants was reduced relative to the wild type, whereas the chlorophyll a/b ratio was similar (Tables 3 and 4). Determination of other pigment levels by HPLC indicated significantly lower levels of neoxanthin, lutein and β-carotene, while the violaxanthin level was close to the wild type (Table 4).
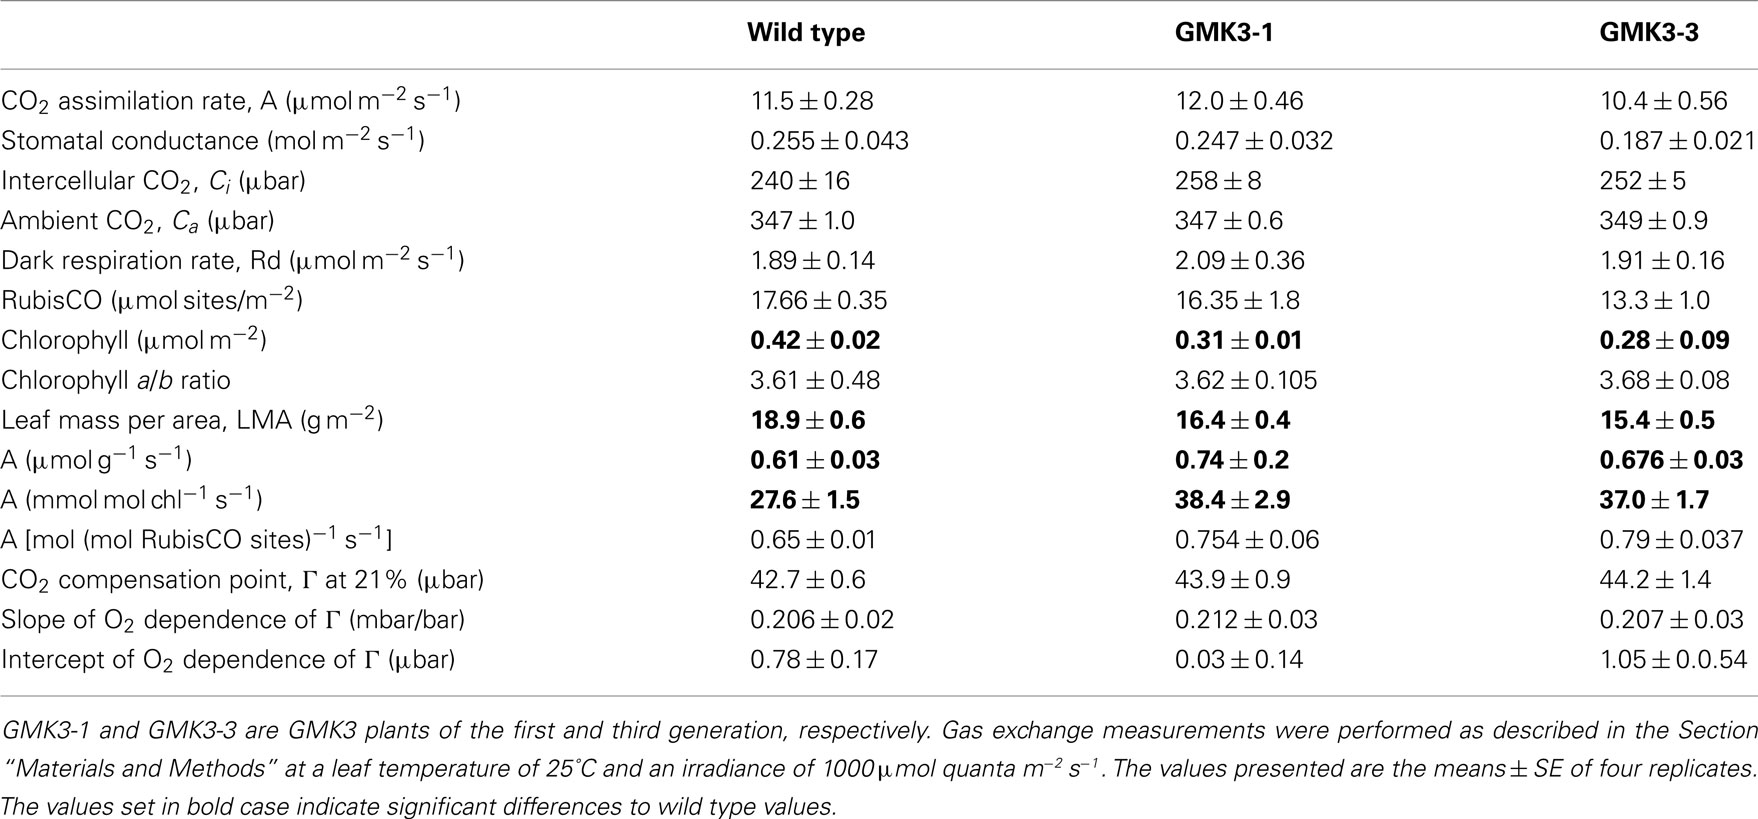
Table 3. Photosynthetic performance of wild type and transgenic plants.
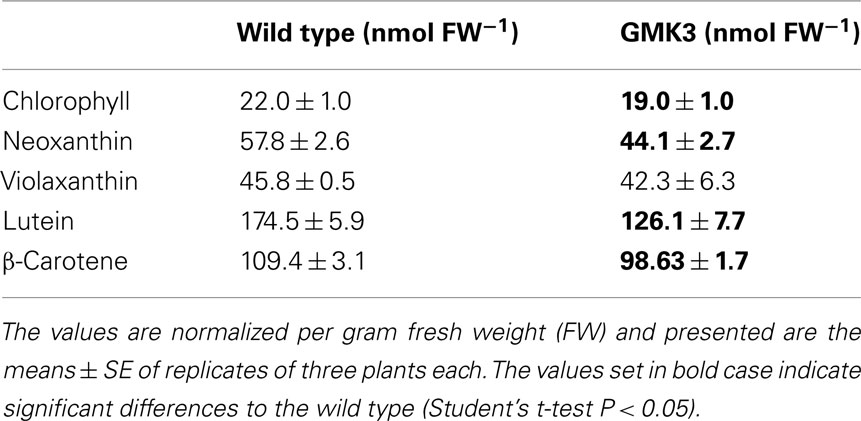
Table 4. Pigment composition of wild type and GMK3 rosette leaves determined by reverse-phase HPLC.
Leaf Carbon Isotope Discrimination
Biologically significant variations in natural δ13C content among plants are attributed to different diffusivity of 13CO2 and 12CO2 (∼4.4% fractionation), a preference of RubisCO for 12CO2 (∼27–29%; Farquhar et al., 1989), and photorespiration (∼1%; Gillon and Griffiths, 1997; Igamberdiev et al., 2004). Plants with different CO2 concentrating mechanisms (C3, C3–C4, and C4-plants) can be distinguished by the carbon isotope composition of their dry matter (O’Leary, 1981). C4-plants show less negative δ13C values than C3–C4 intermediates, while intermediates show less negative δ13C values than C3-plants. Analyzing dried leaf material, we found carbon isotope ratios of GMK3 and wild type plants (δ13C) of −38.34 ± 0.31 and −38.77 ± 0.18, respectively. Thus, discrimination of 13CO2 and 12CO2 was very similar between GMK3 and wild type under our experimental conditions.
Reduced Flux Through the Photorespiratory Pathway in GMK3 Plants
Relative glycine and serine levels were determined by GC–MS and the Gly/Ser ratio was calculated as an indicator of flux through the photorespiratory pathway. This analysis was performed in plants grown under low light conditions (30 μmol quanta m−2 s−1) to minimize photorespiration, as well as in plants exposed to photorespiratory conditions (high light of 600 μmol quanta m−2 s−1). As shown in Table 4, GMK3 plants presented lower relative glycine contents than the wild type under photorespiratory conditions. In the case of serine, the GMK3 plants showed lower relative levels than the wild type under both conditions (Table 5). The Gly/Ser ratio of GMK3 plants was significantly lower than that of the wild type under photorespiratory conditions, while it was enhanced under non-photorespiratory conditions (Table 5). After exposing the plants to high light, the Gly/Ser ratio of the wild type increased about 150-fold compared to low light conditions, due to a huge accumulation of glycine (Table 5). This increase in the Gly/Ser ratio was only of 13-fold in the case of GMK3 plants (Table 5) due to a much lower increase in glycine levels in high light, indicating decreased flux through the photorespiratory pathway in these plants. Finally, no differences in the Gly/Ser ratio were observed between the lines when grown at high CO2 concentrations (not shown).
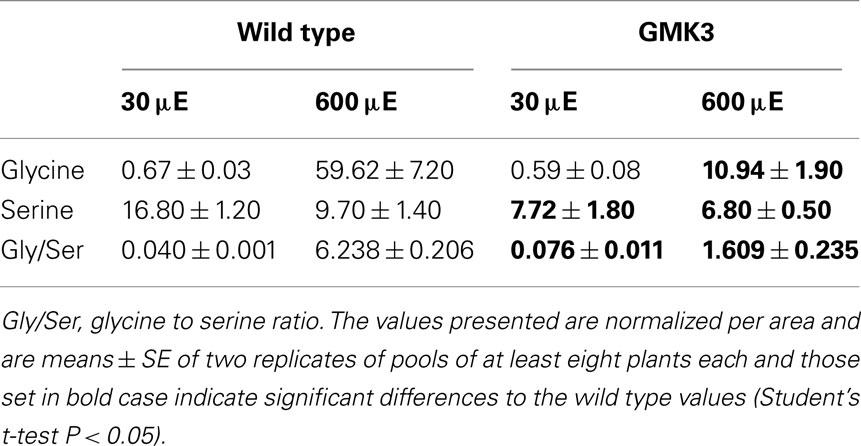
Table 5. Glycine and serine levels (relative to the internal standard molecule) measured by GC–MS of whole rosette leaves harvested after 6 h in the light period from plants grown at 30 μmol quanta m− 2 s− 1 (30 μE; non-photorespiratory conditions) and after transferring the plants for 6 h under 600 μmol quanta m− 2 s− 1 (600 μE; photorespiratory conditions).
Enhanced CO2 Assimilation in GMK3 Plants
Instantaneous photosynthetic rate measurements (A, μmol m−2 s−1) were performed on both wild type and GMK3 plants. Table 3 shows that the assimilation of CO2 in the GMK3 plants (determined at 1,000 μmol quanta m−2 s−1) was significantly higher than the wild type on both dry weight and chlorophyll basis. On a RubisCO activity basis, the GMK3 plants showed a trend to higher assimilation rates (Table 3). There were no statistically significant deviations of the compensation point and its O2 dependence between the genotypes (Table 3; Figure 5B).
The FV/FM ratio indicated that the maximum quantum efficiency of photosystem II was not affected in any of the genotypes grown under normal conditions (not shown). On the other hand, when the plants were exposed to high light for 6 h, no differences in the FV/FM ratio was observed in the GMK lines compared to wild type (GMK3, 0.68 ± 0.02; GMK9, 0.65 ± 0.05; wt, 0.70 ± 0.03), while GO–MS plants showed strong photoinhibition (0.55 ± 0.01). It is worth mentioning that after long-term exposure to high light, the FV/FM ratio of the GMK9 plants decreased (0.52 ± 0.01); this reduction indicates that, although with delay, GMK9 plants also suffer from photoinhibition. These observations correlate with the fact that after long-term high light exposure, GMK9 plants developed oxidative lesions and did not accumulate starch (Figure 4).
Discussion
A glycolate catabolic cycle was established in the C3-model plant A. thaliana in which glycolate is completely oxidized within the chloroplast to two molecules of CO2. The H2O2 produced by GO is detoxified to water and oxygen. As a consequence, a portion of the glycolate formed in the oxygenation of RuBP by RubisCO was diverted from the photorespiratory pathway (Table 5). Because this engineered pathway is localized to chloroplasts, CO2 released as a product of the pathway can directly be refixed. Additionally, the engineered pathway has the advantage compared to photorespiration that no ammonia is released in any of its enzymatic steps. Thus, less re-assimilation of ammonia would be required, resulting in a potential improvement in the plant nitrogen use efficiency. Additionally, the energy cost of the GMK pathway is lower than “normal” photorespiration (Table 6).
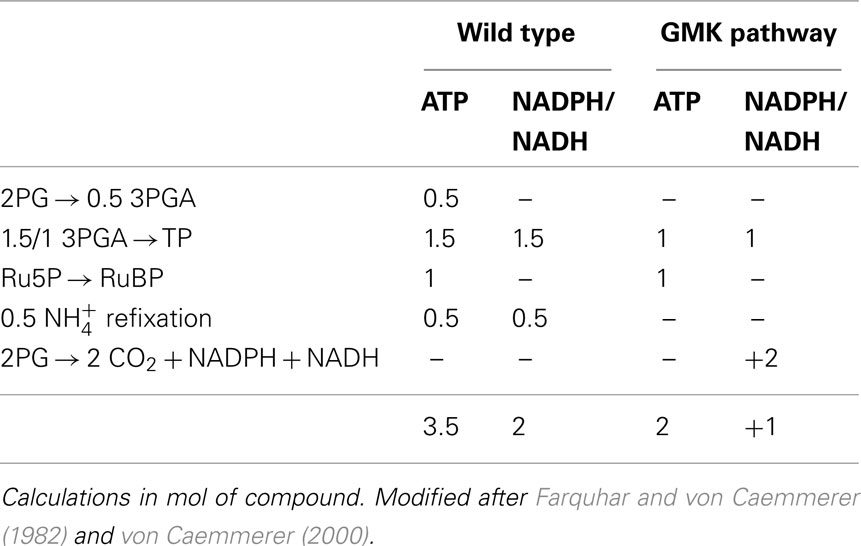
Table 6. ATP and NADPH/NADH consumption of the photosynthetic carbon reduction and photorespiratory cycle in the wild type and GMK plants with the assumption that each oxygenation reaction would lead to complete oxidation of 2PG through the GMK cycle.
A major obstacle during the establishment of the approach presented here was the accumulation of H2O2 inside the plastids as a result of the GO activity. Our previous work (Fahnenstich et al., 2008) showed that GO–MS plants grew better than the GO parental lines, but still presented a similar extent of oxidative stress in response to high light. This observation suggested that the noxious effects of H2O2 accumulation could mask the benefits of the intraplastidic glycolate catabolic pathway. Moreover, glyoxylate levels in GO–MS plants were similar to the wild type, indicating that this metabolite is further metabolized by the action of MS (Fahnenstich et al., 2008). It could be argued that the increased biomass accumulation in GO–MS plants relative to GO plants was the result of the elimination of damaging effects caused by glyoxylate accumulation in GO plants. However, Kebeish et al. (2007) clearly showed that solely the overexpression of the bacterial glycolate dehydrogenase in chloroplasts of A. thaliana produced plants with enhanced biomass even though glyoxylate accumulates in this organelle. In the approach presented here, the expression of catalase inside the plastids proved necessary to circumvent the negative effects of H2O2 accumulation in chloroplasts. Plants expressing catalase targeted to plastids in addition to GO–MS expression (GMK3 and GMK9) accumulated more biomass than the parental lines, and GMK3 presented growth improvement with regards to wild type.
No phenotypical differences were observed when the lines were grown under high CO2 concentration, a condition in which photorespiration is not active. Under photorespiratory conditions the Gly/Ser ratio in GMK3 plants was lower than that of the wild type, and the Gly and Ser contents were strongly reduced (Table 4). This indicates that glycolate formed in the chloroplasts by the oxygenase activity of RubisCO is metabolized by the introduced GO activity in GMK plants. Moreover, the reversal of the phenotype by high CO2 clearly indicates that the phenotypical changes observed in both GMK3 and GMK9 plants under normal ambient conditions are related to the functional transgenic pathway and not to a positional effect of the catalase transgen.
The GO–MS and GMK9 lines presented yellowing and oxidative lesions after transfer to high light intensities, a feature that was not observed in the wild type and GMK3 plants. Thus, the benefits of the new pathway observed in GMK3 are masked in other lines (e.g., GMK9). An inverse relationship could be seen between the extent of the GO phenotype and catalase activities measured in isolated chloroplasts of the GMK lines, as preparations from leaves of GMK3 plants showed higher catalase activity than those prepared from GMK9 plants. We assume that growth improvement in the GMK plants depends on fine-tuning the interplay of overexpressed enzymes and the endogenous antioxidant machinery to reduce the accumulation of H2O2 in plastids. It is interesting to note that no differences in the growth parameters between wild type and GMK3 plants were observed under long-day conditions. Similar results were observed by overexpressing the bacterial glycolate pathway (Kebeish et al., 2007; Peterhänsel, personal communication), raising the question as to whether an interaction between glycolate metabolism and day-length might exist.
The differential metabolome in the GMK3 plants pointed toward increased synthesis of amino acids derived from PEP. In addition, TCA cycle intermediates, except for fumarate, were more abundant in the GMK3 plants, also suggesting an enhanced entry of pyruvate to the cycle. It is possible that the observed enhanced C assimilation causes higher 3-P glycerate levels and subsequently more PEP, pyruvate, and oxalacetate, which in turn are allocated to the production of their derived amino acids.
Although the GMK3 plants have thinner leaves with respect to the wild type, they showed a 36 and 28% increase in total rosette dry and fresh weight, respectively, which is attributed not only to the increased rosette diameter but also to a significantly increased number of leaves. Moreover, the GMK3 plants displayed a higher carbon assimilation rate per unit leaf area as well as per chlorophyll content. The above-mentioned GLD plants containing the complete E. coli glycolate catabolic pathway also showed increased photosynthesis and biomass (Kebeish et al., 2007). However, this phenotype was also observed in plants expressing only the first enzyme of the pathway, glycolate dehydrogenase. Interestingly, the GLD plants also presented flatter and thinner leaves (Kebeish et al., 2007; Peterhänsel, personal communication). Thus, the altered leaf ultrastructure observed also in our work might be a consequence of signals emanating from the altered metabolic status. The precise cause of this change in morphology in the GMK3 and GLD plants cannot be deduced from the results of the present work and is a matter for future investigations.
The CO2 compensation point (γ) and its O2 dependence have long been recognized as a diagnostic tool to distinguish between, C3, C4, and C3–C4 intermediate photosynthetic pathways (Holaday and Chollet, 1983; Ku et al., 1991). Changes in the slope of the O2 dependence have also been recorded for one of the photorespiratory mutants of A. thaliana (Cousins et al., 2008). In C3 species, the intercept at zero O2 depends on the ratio of mitochondrial respiration to maximal RubisCO activity. This ratio can thus lead to lower or greater γ for an individual. For example, differences in that ratio have been shown to explain increases in Γ with leaf age (Azcon-Bieto et al., 1981). The slope of the O2 dependence is primarily determined by RubisCO’s specificity and the ratio of CO2 released per RubisCO oxygenation (von Caemmerer, 2000). According to the pathway in Figure 1, the expectation is that 2 mol of CO2 are released per RubisCO oxygenation if all the glycolate is processed by the new pathway rather than the usual 0.5 mol per RubisCO oxygenation. The fact that there is no difference in the O2 dependence of Γ between the wild type and the GMK3 mutants suggests that perhaps a low amount of glycolate is processed by the newly introduced pathway. It is also possible that some of the expected increase in the slope could be compensated by the increased chloroplast CO2 concentration. In the photorespiratory bypass mutant GLD, where the ratio of CO2 released per RubisCO oxygenation was unchanged, also no significant deviation of Γ from the wild type value was observed but a decrease in Γ* was recorded (Kebeish et al., 2007). These mutants also had thinner leaves and the difference is most easily explained by a change in the ratio of respiratory CO2 release to the conductance for CO2 diffusion within the leaf (von Caemmerer, 2000).
The results of our work, in agreement with that of Kebeish et al. (2007), indicated that it is possible to improve the growth of the C3-plant A. thaliana by diverting part of the glycolate away from the photorespiratory pathway and metabolizing it in the chloroplasts. Future work should be directed toward developing optimized versions of these basic approaches (e.g., find a suitable glycolate dehydrogenase that would not produce H2O2 to substitute GO and catalase) to introduce the glycolate catabolic cycle into plants with agronomical importance, such as rice, wheat, or rapeseed.
Conflict of Interest Statement
The authors declare that the research was conducted in the absence of any commercial or financial relationships that could be construed as a potential conflict of interest.
Acknowledgments
We are grateful to Christoph Peterhänsel for helpful discussions and sharing unpublished data. We thank Ulrike Hebbeker, Claudia Nothelle, Katrin Weber, Dorin Engelaender, Stefanie Schulze, Ferdi Grawe, and Siegfried Werth for excellent technical assistance. Financial support was provided by the Deutsche Forschungsgemeinschaft through grant MA2779/4-1 to Veronica G. Maurino and MA2779/7-1 to Veronica G. Maurino and Ulf-Ingo Flügge and WE2231/8-1 to Andreas P. M. Weber as part of the German Photorespiration Research Network Promics (FOR 1186).
References
Azcon-Bieto, J., Farquhar, G. D., and Caballero, A. (1981). Effects of temperature, oxygen concentration, leaf age and seasonal-variations on the CO2 compensation point of Lolium perenne L – comparison with a mathematical-model including non-photorespiratory CO2 production in the light. Planta 152, 497–504.
Bagder, M. R., and Price, G. D. (2003). CO2 concentrating mechanisms in cyanobacteria: molecular components, their diversity and evolution. J. Exp. Bot. 54, 609–622.
Bechtold, N., Ellis, J., and Pelletier, G. (1993). In planta Agrobacterium-mediated gene transfer by infiltration of adult Arabidopsis thaliana plants. C.R. Acad. Sci. 316, 1194–1199.
Bradford, M. M. (1976). A rapid and sensitive method for the quantitation of microgram quantities of protein utilizing the principle of protein-dye binding. Anal. Biochem. 72, 248–254.
Caspar, T., Huber, S. C., and Somerville, C. (1986). Alterations in growth, photosynthesis and respiration in a starchless mutant of Arabidopsis thaliana (L.) Heynh deficient in chloroplast phosphoglucomutase activity. Plant Physiol. 79, 1–7.
Coplen, T. B., Brand, W. A., Gehre, M., Gröning, M., Meijer, H. A., Toman, B., and Verkouteren, R. M. (2006). New guidelines for delta13C measurements. Anal. Chem. 78, 2439–2441.
Cousins, A. B., Pracharoenwattana, I., Zhou, W. X., Smith, S. M., and Badger, M. R. (2008). Peroxisomal malate dehydrogenase is not essential for photorespiration in Arabidopsis but its absence causes an increase in the stoichiometry of photorespiratory CO2 release. Plant Physiol. 148, 786–795.
Douce, R., and Neuburger, M. (1999). Biochemical dissection of photorespiration. Curr. Opin. Plant Biol. 2, 214–222.
Fahnenstich, H., Saigo, M., Niessen, M., Zanor, M. I., Andreo, C. S., Ferni, A. R., Drincovich, M. F., Flügge, U. I., and Maurino, V. G. (2007). Alteration of organic acid metabolism in Arabidopsis thaliana overexpressing the maize C4-NADP-malic enzyme causes accelerated senescence during extended darkness. Plant Physiol. 145, 640–652.
Fahnenstich, H., Scarpeci, T. E., Valle, E. M., Flügge, U. I., and Maurino, V. G. (2008). Generation of H2O2 in chloroplasts of Arabidopsis thaliana overexpressing glycolate oxidase as an inducible system to study oxidative stress. Plant Physiol. 148, 719–729.
Färber, A., Young, A. J., Ruban, A. V., Horton, P., and Jahns, P. (1997). Dynamics of xanthophyll-cycle activity in different antenna subcomplexes in the photosynthetic membranes of higher plants: the relationship between zeaxanthin conversion and nonphotochemical fluorescence quenching. Plant Physiol. 115, 1609–1618.
Farquhar, G. D., Ehleringer, J. R., and Hubick, K. T. (1989). Carbon isotope discrimination and photosynthesis. Annu. Rev. Plant Physiol. Plant Mol. Biol. 40, 503–537.
Farquhar, G. D., and von Caemmerer, S. (1982). “Modelling of photosynthetic response to environmental conditions,” in (Szerk.): Physiological Plant Ecology II. Water Relations and Carbon Assimilation. Encyclopedia of Plant Physiology, Vol. 12B, eds O. L. Lange, P. S. Nobel, C. B. Osmond, and H. Ziegler (Berlin: Springer-Verlag), 549–587.
Farquhar, G. D., von Caemmerer, S., and Berry, J. A. (1980). A biochemical-model of photosynthetic CO2 assimilation in leaves of C3 species. Planta 149, 78–90.
Ferri, G., Comerio, G., Ladarola, P., Zapponi, M. C., and Speranza, M. L. (1978). Subunit structure and activity of glyceraldehyde-3-phosphate dehydrogenase from spinach chloroplasts. Biochim. Biophys. Acta 522, 19–31.
Gillon, J. S., and Griffiths, H. (1997). The influence of (photo)respiration on carbon isotope discrimination in plants. Plant Cell Environ. 20, 1217–1230.
Giordano, M., Beardall, J., and Raven, J. A. (2005). CO2 concentrating mechanisms in algae: mechanisms, environmental modulation and evolution. Annu. Rev. Plant Biol. 56, 99–131.
Hatch, M. D. (1987). C4 photosynthesis: a unique bend of modified biochemistry, anatomy and ultrastructure. Biochim. Biophys. Acta 895, 8–16.
Häusler, R. E., Rademacher, T., Li, J., Lipka, V., Fischer, K. L., Schubert, S., Kreuzaler, F., and Hirsch, H. J. (2001). Single and double overexpression of C4-cycle genes had differential effects on the pattern of endogenous enzymes, attenuation of photorespiration and on contents of UV protectants in transgenic potato and tobacco plants. J. Exp. Bot. 52, 1785–1803.
Havir, E., and McHale, N. (1987). Biochemical and developmental characterization of multiple forms of catalase in tobacco leaves. Plant Physiol. 84, 450–455.
Holaday, A. S., and Chollet, R. (1983). Photosynthetic/photorespiratory carbon metabolism in the C3-C4 intermediate species, Moricandia arvensis and Panicum milioides. Plant Physiol. 73, 740–745.
Igamberdiev, A. U., Mikkelsen, T., Ambus, P., Bauwe, H., Lea, P., and Gardeström, P. (2004). Photorespiration contributes to stomatal regulation and carbon isotope fractionation: a study with barley, potato and Arabidopsis plant deficient in glycine decarboxylase. Photosyn. Res. 81, 139–152.
Ishimaru, K., Ichikawa, H., Matsuoka, M., and Oshugi, R. (1997). Analysis of a C4 pyruvate, orthophosphate dikinase expressed in C3 transgenic Arabidopsis plants. Plant Sci. 129, 57–64.
Kebeish, R., Niessen, N., Thiruveedhi, K., Bari, R., Hirsch, J. H., Rosenkranz, R., Stäbler, N., Schönfeld, B., Kreuzaler, F., and Peterhänsel, C. (2007). Chloroplastic photorespiratory bypass increases photosynthesis and biomass production in Arabidopsis thaliana. Nat. Biotechnol. 25, 593–599.
Keys, A. J., Bird, I. F., Cornelius, M. J., Lea, P. J., Wallsgrove, R. M., and Miflin, B. J. (1978). Photorespiratory nitrogen cycle. Nature 275, 741–743.
Ku, M. S. B., Wu, J. R., Dai, Z. Y., Scott, R. A., Chu, C., and Edwards, G. E. (1991). Photosynthetic and photorespiratory characteristics of Flaveria species. Plant Physiol. 96, 518–528.
Kunst, L., Browse, J., and Somerville, C. (1988). Altered regulation of lipid biosynthesis in a mutant of Arabidopsis deficient in chloroplast glycerol-3-phosphate acyltransferase activity. Proc. Natl. Acad. Sci. U.S.A. 85, 4143–4147.
Laemmli, U. K. (1970). Cleavage of structural proteins during the assembly of the head of bacteriophage T4. Nature 227, 680–685.
Lee, D. Y., and Fiehn, O. (2008). High quality metabolomic data for Chlamydomonas reinhardtii. Plant Methods 4, 7.
Leegood, R. C., Lea, P. J., Adcok, M. D., and Häusler, R. E. (1995). The regulation and control of photorespiration. J. Exp. Bot. 46, 1397–1414.
Matsuoka, M., Furbank, R. T., Fukayama, H., and Miyao, M. (2001). Molecular engineering of C4 photosynthesis. Annu. Rev. Plant Physiol. Plant Mol. Biol. 52, 297–314.
Maurino, V. G., and Flügge, U. I. (2009). Means for improving agrobiological traits in a plant by providing a plant cell comprising in its chloroplasts enzymatic activities for converting glycolate into malate. Appln. No. WO2009103782.
Maurino, V. G., and Peterhansel, C. (2010). Photorespiration: current status and approaches for metabolic engineering. Curr. Opin. Plant Biol. 13, 248–255.
Porra, R. J., Thompson, W. A., and Kriedmann, P. E. (1989). Determination of accurate extinction coefficients and simultaneous equations for assaying chlorophyll a and b extracted with four different solvents: verification of the concentration of chlorophyll standards by atomic absorption spectroscopy. Biochim. Biophys. Acta 975, 384–394.
Ruuska, S. A., Andrews, T. J., Badger, M. R., Hudson, G. S., Laisk, A., Price, G. D., and von Caemmerer, S. (1998). The interplay between limiting processes in C3 photosynthesis studied by rapid-response gas exchange using transgenic tobacco impaired in photosynthesis. Aust. J. Plant Physiol. 25, 859–870.
Sage, R. F., Pearcy, R. W., and Seemann, J. R. (1987). The nitrogen use efficiency of C3 and C4 plants. Plant Physiol. 85, 355–359.
Keywords: photorespiration, glycolate, chloroplast
Citation: Maier A, Fahnenstich H, von Caemmerer S, Engqvist MKM, Weber APM, Flügge U-I and Maurino VG (2012) Transgenic introduction of a glycolate oxidative cycle into A. thaliana chloroplasts leads to growth improvement. Front. Plant Sci. 3:38. doi: 10.3389/fpls.2012.00038
Received: 14 November 2011; Accepted: 15 February 2012;
Published online: 28 February 2012.
Edited by:
Burkhard Schulz, Purdue University, USAReviewed by:
Michael Gutensohn, Purdue University, USAUener Kolukisaoglu, University of Tuebingen, Germany
Copyright: © 2012 Maier, Fahnenstich, von Caemmerer, Engqvist, Weber, Flügge and Maurino. This is an open-access article distributed under the terms of the Creative Commons Attribution Non Commercial License, which permits non-commercial use, distribution, and reproduction in other forums, provided the original authors and source are credited.
*Correspondence: Veronica G. Maurino, Entwicklungs- und Molekularbiologie der Pflanzen, Heinrich-Heine-Universität, Universitätsstraße 1, 40225 Düsseldorf, Germany. e-mail: veronica.maurino@uni-duesseldorf.de
†Present address: Holger Fahnenstich, Metanomics GmbH, Tegeler Weg 33, 10589 Berlin, Germany; Martin K. M. Engqvist, Division of Chemistry and Chemical Engineering, California Institute of Technology, Mail Code 210-41, Pasadena, CA 91125, USA.
‡Alexandra Maier and Holger Fahnenstich have contributed equally to this work.