
- Department of Biological Sciences, Rutgers University, Newark, NJ, USA
Sap flow measurements have become integral in many physiological and ecological investigations. A number of methods are used to estimate sap flow rates in trees, but probably the most popular is the thermal dissipation (TD) method because of its affordability, relatively low power consumption, and ease of use. However, there have been questions about the use of this method in ring-porous species and whether individual species and site calibrations are needed. We made concurrent measurements of sap flow rates using TD sensors and the tissue heat balance (THB) method in two oak species (Quercus prinus Willd. and Quercus velutina Lam.) and one pine (Pinus echinata Mill.). We also made concurrent measurements of sap flow rates using both 1 and 2-cm long TD sensors in both oak species. We found that both the TD and THB systems tended to match well in the pine individual, but sap flow rates were underestimated by 2-cm long TD sensors in five individuals of the two ring-porous oak species. Underestimations of 20–35% occurred in Q. prinus even when a “Clearwater” correction was applied to account for the shallowness of the sapwood depth relative to the sensor length and flow rates were underestimated by up to 50% in Q. velutina. Two centimeter long TD sensors also underestimated flow rates compared with 1-cm long sensors in Q. prinus, but only at large flow rates. When 2-cm long sensor data in Q. prinus were scaled using the regression with 1-cm long data, daily flow rates matched well with the rates measured by the THB system. Daily plot level transpiration estimated using TD sap flow rates and scaled 1 cm sensor data averaged about 15% lower than those estimated by the THB method. Therefore, these results suggest that 1-cm long sensors are appropriate in species with shallow sapwood, however more corrections may be necessary in ring-porous species.
Introduction
Methods for measuring sap flow in trees have led to physiological discoveries at the individual level as well as better estimates of water use at the stand level. At the organismal level, data on sap flow have helped estimate whole tree hydraulic conductances (Domec et al., 2010, p. 1941; Wullschleger et al., 1998, p. 1662), usage of stored water by trees (Phillips et al., 1997; Goldstein et al., 1998; Meinzer et al., 2004), evidence of night-time transpiration (Daley and Phillips, 2006; Moore et al., 2008; Oishi et al., 2008), hydraulic limitations in tall trees (Schäfer et al., 2000; Barnard and Ryan, 2003; Magnani et al., 2008), and patterns of water use throughout the day and throughout the growing season (Granier, 1987; Granier et al., 2000). Likewise, to separate the physical and biological controls on water flow rates in forests, it is essential to incorporate sap flow measurements into the repertoire of ecological measurements in ecosystem studies (Köstner et al., 1998; Asbjornsen et al., 2011). Sap flow rates measured in representative individuals can be scaled up to estimate stand transpiration throughout the growing season (Goulden and Field, 1994) as well as stand carbon assimilation rates (Schäfer et al., 2003, 2010). Sap flow measurements also perform well in locations that have complex terrain, variable topography, or in constrained areas where eddy covariance is not well suited (Wilson et al., 2001). Various methods have been put forth to continuously measure sap flow rates in trees including heat application with infrared imaging (Tributsch et al., 2006; Helfter et al., 2007), geophysical methods (Al Hagrey, 2007), and magnetic resonance imaging techniques (Homan et al., 2007). But, by far, the most common techniques involve using heat as a tracer for sap flow (Daum, 1967 and reviewed by Smith and Allen, 1996) including the use of heat pulse (Marshall, 1958; Swanson and Whitfield, 1981) and heat ratios (Burgess et al., 1998), thermal dissipation (TD) probes (Granier, 1987) and the tissue heat balance (THB, Cermák et al., 1973, 2004), and stem heat balance (Sakuratani, 1981; Baker and van Bavel, 1987) techniques.
Many studies employ the TD method because of its ease of use, affordability, and predictable power consumption (Köstner et al., 1996, 1998; Smith and Allen, 1996; Wullschleger et al., 1998) when compared with the other heat tracer techniques. The TD method has been shown to match well with various independent methods for measuring water use in trees including values obtained by the Penman–Monteith equation (Granier, 1987), porometry measurements on the leaves (Zhang et al., 1997), measurements of above- and below-canopy evaporation (Diawara et al., 1991), whole tree gas exchange chambers (Goulden and Field, 1994), and gravimetric water loss methods (Granier et al., 1994; McCulloh et al., 2007). However, caution needs to be taken when interpreting signals from TD sensors due to possible night-time recharge and/or transpiration (Lu et al., 2004; Oishi et al., 2008), variability in flow rates across the sensor length (Wullschleger et al., 1998; Clearwater et al., 1999; Lu et al., 2004), or sensors being partially located in non-conducting tissue (Clearwater et al., 1999; Lu et al., 2004; Taneda and Sperry, 2008; Bush et al., 2010; Hultine et al., 2010). The latter is most commonly encountered in ring-porous tree species where the earlywood vessels of the most newly formed growth ring perform the majority of the transport. Clearwater et al. (1999) developed a correction for this situation, however it cannot be used when the proportion of non-conducting tissue greatly exceeds that of the conducting tissue along the sensor length (Bush et al., 2010). Recently, researchers who have calibrated TD sensors in ring-porous species and some diffuse porous species have reported new coefficients for the multiplier (i.e., 119 in the original equation) that are twice as large (Hultine et al., 2010) to almost an order of magnitude larger (Taneda and Sperry, 2008), to two orders of magnitude larger (Bush et al., 2010).
These recent calibrations of TD sensors in ring-porous species call into question the applicability of the original calibration in these species as well as previous studies in ring-porous species that have used the original calibration. These laboratory calibrations give the advantage of a controlled environment, but they involve destructive sampling of large trees (which may not be feasible) or the use of branches (Bush et al., 2010). Likewise, if positive pressure is used in laboratory calibrations, the driving force for water flow will differ from the negative pressures that trees experience to move water against gravity and the frictional resistance of the conduits. Therefore, another validation of TD sensors in the trunks of ring-porous species under natural conditions is necessary. The use of the THB method to calibrate TD sensors gives the advantage of providing an in situ relationship under natural ranges of flow rates and transpirational driving forces. This is especially important in the oak-dominated forests of the New Jersey Pine Barrens because its sandy soils mean that trees grow very slowly and therefore have very shallow sapwood depths which are problematic to TD sensors. The THB method has also been shown to match well with transpiration rates from willow trees (Salix viminalis L.) measured using an open-top ventilated chamber with an infrared gas analyzer (Cienciala and Lindroth, 1995) and in two conifer species [Larix sp. and Picea abies ((L.)H.Karst.)] where transpiration rates were estimated using porometer measurements of leaves (Schulze et al., 1985). Likewise, since the THB method integrates sap flow across a radial profile (Cermák et al., 2004) it was found to be appropriate even when flow occurred in one third of the radial heater depth (Tatarinov et al., 2005), a situation that is common in ring-porous species.
Therefore, our objective is to measure sap flow rates using both TD and THB sensors in the same trees and compare the results to determine the validity of the original Granier calibration in ring-porous oaks of the New Jersey Pine Barrens. Because the THB method calculates sap flow rates based on an energy balance of a specified volume of wood tissue and the specific heat of water, it requires no calibration (Lundblad et al., 2001). This contrasts with the TD method in which flow is based on an empirical equation. Lundblad et al. (2001) and Cermák et al. (2004) suggest that it is appropriate to use the THB method in new calibrations of the TD method. It is recognized that neither method can be considered to be free from error or bias, however a cross-validation is still valuable with THB as a base measurement because it is based on physical properties of energy balance as well as being an in situ method of calibration. This research is important because different estimates of tree and stand transpiration rates (depending on the measurement technique) will have different implications for land and water management strategies. Specifically, comparison of both sap flow techniques in slow-growing, ring-porous species like the oak-dominated forests of the New Jersey Atlantic Coastal region will inform ecohydrologic studies in similar regions where ring-porous species dominate and have proven difficult to estimate sap flow rates accurately with the TD method.
Materials and Methods
Study Site
This study was conducted at the Rutgers University Pinelands Research Station, located in Pemberton Township in the Pine Barrens of southern New Jersey, USA (N 39°55′0′′, W 74°36′0′′) during the growing season of 2009 (from 15 May to 1 October) and 2010 (from 26 June to 24 August) when the majority of sensors were functional. Mean annual temperature is 11.5°C, with an annual precipitation of 1123 (SE = 182) mm. During 2010, the site experienced a severe drought with soil moisture contents falling to as low as 2.6%. Droughts in this region are exacerbated by the fact that the soil is a sandy podzol (Rhodehamel, 1998) with low nutrient content and field capacity. The study area is relatively flat with a mean elevation of 33 m a.s.l. The dominant tree species are Quercus prinus Willd. (chestnut oak), Quercus velutina Lam. (black oak), and Quercus coccinia Münchh. (scarlet oak), with scattered Pinus rigida Mill. (pitch pine), and Pinus echinata Mill. (shortleaf pine). Less abundant oaks at the site include Quercus stellata Wangenh. (post oak), and Quercus alba L. (white oak). The understory is comprised of Gaylussacia baccata (Wangenh.) K. Koch (black huckleberry) and Vaccinium spp. (Clark et al., 2010).
Sap Flow Measurements
In order to compare both sap flow methods, the THB method (Cermák et al., 1973) and the TD method (Granier, 1987), trees were chosen that were representative of the species and size distribution of the stand and large enough to host both sap flow systems. Therefore, both systems were installed in four mature individuals of Q. prinus, two Q. velutina, and one P. rigida (Table 1). Azimuthal locations and years of sensor operation are described in Table 1.
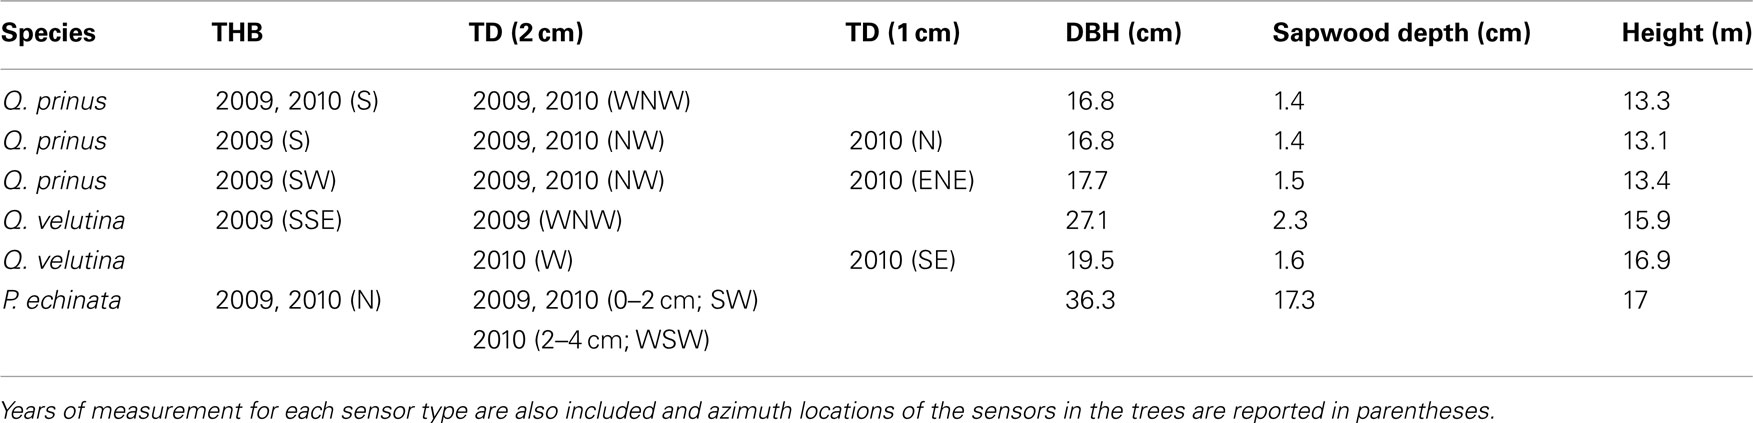
Table 1. Biometric data for trees receiving tissue heat balance (THB) and thermal dissipation (TD) sensors.
Tissue heat balance sensors consisted of three heated electrodes that are 4 cm long and receive between 40 and 200 mA of current and one unheated electrode. The power supplied to the system varies in relation to the sap flow rate to keep the temperature difference between the heated and reference electrodes at 1°C (EMS Brno; Brno, Czech Republic). THB electrodes were inserted at a height of between 1.3 and 1.5 m above the ground. To install the electrodes, some of the bark was removed and the bark/phloem thickness determined using a gauge supplied with the system (EMS Brno; Brno, Czech Republic). Next, the electrodes were hammered into the trunk using an insertion tool supplied with the system and making sure that the insulation on the electrodes covered the phloem and bark layer. Electrodes were installed to a depth that encompassed the entire sapwood of the Quercus individuals. In the Pinus individual, the THB sensors were inserted ∼3.5 cm deep covering most of the sapwood depth. Reflective polyethylene foam covers provided by the manufacturer (EMS Brno; Brno, Czech Republic) were then placed over the electrodes to prevent temperature fluctuations from sunflecks. Power (P in Watts) being applied to electrodes was recorded every 30 s and 30 min averages were stored in a system data logger (Model P4.2, EMS Brno; Brno, Czech Republic). Sap flow rates were calculated using the following equation:
where Q is the sap flow rate in kg h−1 cm−1 stem circumference, cw is the specific heat of water (J kg−1 K−1), d is the circumferential distance being covered by the electrodes (cm), δT (K) is the temperature difference between heated and unheated electrodes and Z/Cw represents the heat loss from the system determined under the zero flow (night-time) conditions where it is assumed that no sap is flowing and therefore any heat lost from the system is due to conduction through the wood tissue. Data from the data logger were converted to sap flow (kg h−1) using system software (Mini32 version 4.1.5.0; EMS Brno; Brno, Czech Republic), scaled up to the tree level by multiplying half-hourly values by the stem circumference (minus bark and phloem) and then integrating to yield daily values (kg day−1).
Individuals that received the THB system were also given 2-cm long, TD sensors (Granier, 1987). In 2010, two Q. prinus individuals and one Q. velutina were also fitted with 1-cm long TD sensors to compare sensor lengths (Table 1). Data from both the 2 and 1-cm TD sensors for the Q. velutina individual was also included for the beginning of the 2011 growing season (May 1st to June 10th). Azimuthal locations of sensors are reported in Table 1. The Pinus individual also received a sensor at a depth of 2–4 cm at the beginning of the 2010 growing season to test for radial patterns in sap flow (Phillips et al., 1996). TD sensors consist of a pair of hypodermic needles each containing a copper-constantan thermocouple. One of the sensors in the pair is also equipped with a constantan heating wire wrapped around the needle to which a constant power of 0.2 W (0.1 W for 1-cm long sensors) was applied. After the bark and phloem were removed, both needles of the sensor pair were inserted radially into the boles of the trees at about 1.3 m above ground. The upper, heated sensor was placed about 10 cm above the unheated, reference sensor, and placed in an aluminum tube with heat conductivity paste to enhance heat transfer between the sapwood and the probes. An aluminum bread pan was placed over each sensor pair to reduce temperature gradients from solar radiation. The TD technique estimates sap flow rates by measuring the temperature difference between the heated and reference sensors. Water flowing past the heated sensor dissipates some of the heat and decreases the temperature difference between the sensors. A time of zero flow and maximal temperature difference acts as a “baseline” for the data and usually occurs around predawn. Sensors were attached to a Campbell Scientific CR3000 data logger and AM16/32A multiplexer (Logan, UT, USA) and data was logged every 30 s with averages stored every 30 min. Raw data were converted to sap flow rates (Js; kg m−2 s−1) using Granier’s original calibration equation:
where ΔTmax is the temperature difference between probes when no water is flowing and ΔT is the temperature difference when sap flow is occurring. To confirm that ΔTmax values were chosen when sap flow was zero, we used the constraints developed by Oishi et al. (2008). Specifically, ΔTmax values were chosen when VPD <0.05 kPa over a 2-h period to avoid times of nocturnal transpiration and ΔT values were stable over a 2-h period to avoid times of nocturnal recharge. We also performed a correction in the oak species to account for the fact that the sensors were longer than the sapwood depth (Clearwater et al., 1999) as follows:
where SD is the sapwood depth (cm) and LS is the sensor length (cm). Sapwood depths (reported in Table 1) for each of the Quercus study individuals were estimated by coring 12 representative Quercus individuals varying in size and species throughout the stand and visually identifying the transition from sapwood to heartwood as the color change from wet to dry wood. We then developed a relationship (r2 = 0.60, p < 0.0001) between DBH and sapwood depth as follows:
These Quercus individuals grow very slowly, therefore this depth represents several growth rings. The sapwood depth of the Pinus individual was estimated using a tree core of that individual and visually identifying the sapwood depth via a color change between wet and dry wood.
To compare data with the THB system, sap flow data from the TD system needed to be scaled up from a per unit area basis to the entire bole area by multiplying by the sapwood area (m2). Data were then scaled to daily flow rates (kg day−1). Likewise, to compare both systems more broadly, plot level estimates of transpiration were calculated using either the THB or TD sap flow data for all trees greater than 2 cm dbh in a 3014-m2 plot area. To begin, the dbh and species of all trees >2.5 cm dbh within the plots were recorded. Only 2009 data were included since the THB system did not have a large enough sample size in 2010. All sensored individuals were included in the analysis (not only trees that contained both systems) which yielded seven Q. prinus, nine Q. velutina, three Q. coccinia, and one P. echinata individuals where TD sap flow was measured and four Q. prinus, one Q. velutina, and one P. echinata where THB sap flow was measured. Averages of sap flow in Q. prinus and Q. velutina were used to estimate flow rates in Q. alba, Q. stellata, and Q. coccinia for the THB system. The Clearwater correction was applied to all Quercus sp. and, in addition, the Q. prinus 2-cm TD data were rescaled with the equation from the 1-cm data from 2010. Average sap flows for each species were multiplied by the sapwood area of each species, divided by the plot area and scaled up to daily values to yield transpiration values in mm day−1.
Results
Daily sap flow rates in Q. prinus ranged from 1.4 to 34.2 kg day−1 during 2009 and from 1.0 to 14.4 kg day−1 in 2010 using TD sensors and from 1.2 to 29.2 kg day−1 in 2009 and from 1.2 to 16.2 kg day−1 in 2010 using THB sensors (Figure 1). In Q. velutina, daily sap flow rates ranged from 1.3 to 28.2 kg day−1 during 2009 and from 1.0 to 18.3 kg day−1 in 2010 using TD sensors and from 2.2 to 41.6 kg day−1 in 2009 using THB sensors (Figure 2). In P. echinata, daily sap flow rates ranged from <1 to 100.4 kg day−1 during 2009 and from <1 to 108.1 kg day−1 in 2010 using TD sensors and from <1 to 117.9 kg day−1 in 2009 and from <1 to 109.5 kg day−1 in 2010 using THB sensors (Figure 3).
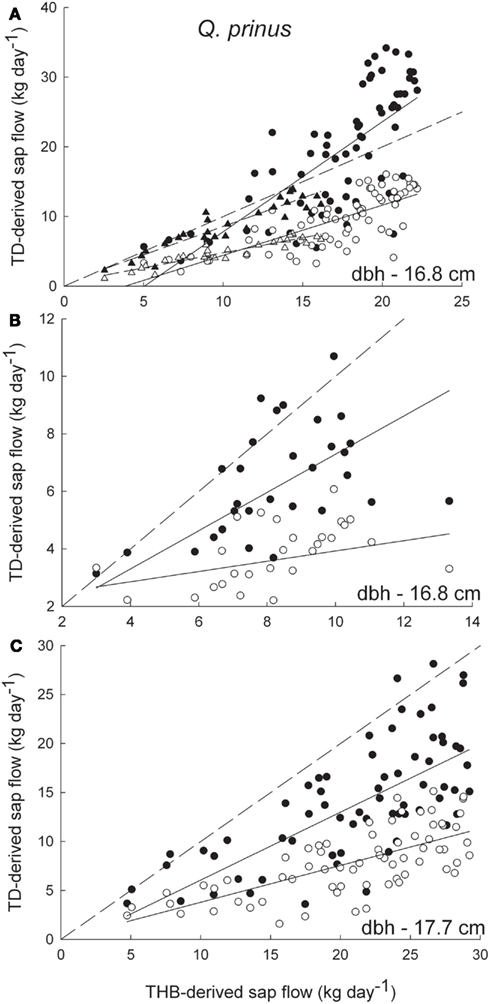
Figure 1. Sap flow rates (kg day-1) for Q. prinus derived from the tissue heat balance (THB) system and thermal dissipation (TD) system using 2-cm long sensors for (A) a 16.8-cm dbh individual, (B) a 16.8-cm dbh individual, and (C) a 17.7-cm dbh individual. Open symbols denote sap flow rates derived from the original Granier equation and closed symbols are sap flow rates with the Clearwater correction applied. Circles denote flow rates measured in 2009 and triangles (A) denote flow rates measured in 2010. The dashed lines are the one to one lines for each graph. The solid lines are the best fit regressions for (A) 2009 uncorrected data (y = 0.72x − 2.7, r2 = 0.57), 2009 Clearwater-corrected data (y = 1.58x − 7.9, r2 = 0.54), 2010 uncorrected data (y = 0.43x + 0.48, r2 = 0.87), 2010 Clearwater-corrected data (y = 0.82x + 0.42, r2 = 0.86), (B) 2009 uncorrected data (y = 0.18x + 2.1, r2 = 0.12) and 2009 Clearwater-corrected data (y = 0.66x + 0.65, r2 = 0.43), and (C) 2009 uncorrected data (y = 0.38x + 0.04, r2 = 0.48) and 2009 Clearwater-corrected data (y = 0.69x − 0.87, r2 = 0.46).
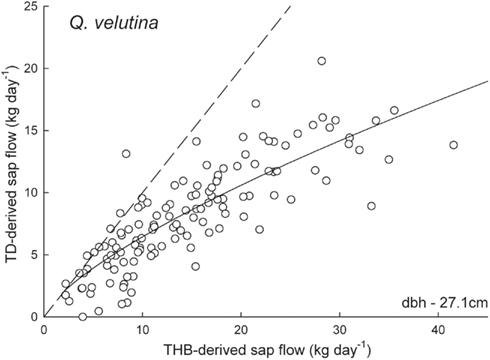
Figure 2. Sap flow rates (kg day-1) derived from the tissue heat balance (THB) system and thermal dissipation (TD) system using 2-cm long sensors in a 27.1-cm dbh Q. velutina individual. The dashed line is the one to one line and the solid line is the best fit regression (y = 1.24 × x0.72, r2 = 0.71). Sapwood depth was calculated to be over 2 cm therefore original 2-cm length sensor data are shown.
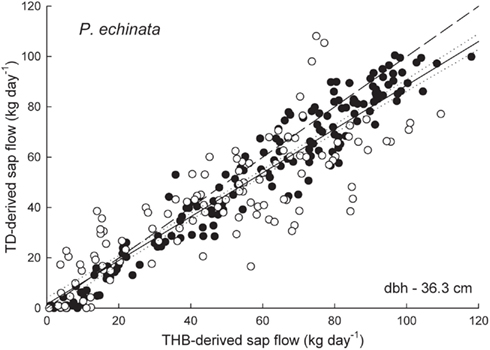
Figure 3. Sap flow rates (kg day-1) derived from the tissue heat balance (THB) system and thermal dissipation (TD) system using 2-cm long sensors in a 36.3-cm dbh Pinus echinata. TD flow rates were corrected for radial variation by comparing data between 0–2 and 2–4-cm depth sensors. The closed circles denote data from 2009 and the open circles denote data from 2010. The dashed line is the one to one line, the dotted lines are 95% confidence intervals around the best fit solid line (y = 0.87x + 1.57, r2 = 0.85).
Two centimeter long TD sensors tended to underestimate sap flow rates in the two oak species (Q. prinus and Q. velutina) compared with the THB system (Figures 1 and 2). In Q. prinus, TD data with no Clearwater correction were between 30 and 80% lower than data from the THB system. Clearwater-corrected data more closely matched the THB data, but still underestimated flow rates by 20–35% (Figures 1A–C). In one Q. prinus individual, Clearwater-corrected TD flow rates measured in 2009 were higher than those measured by the THB method (Figure 1A) but were more similar to the trends of the other Q. prinus individuals in 2010. In Q. velutina, the 2-cm long TD sensors tended to underestimate flow rates compared to the THB method, with increasing underestimation (of up to 50%) at higher flow rates (Figure 2). Since this individual was calculated to have a sapwood depth that approximately equaled the TD sensor length (Table 1), no Clearwater correction was applied to the data.
In P. echinata, sap flow rates measured by the 2- to 4-cm depth sensor were about 0.6 times that of the outer 0- to 2-cm TD sensor. With this radial correction applied to the data, sap flow rates measured with TD sensors matched fairly well with those measured using the THB system with the fitted regression for the 2009 and 2010 data falling just slightly below the one to one line (Figure 3). Average underestimations of the TD system compared with the THB system were about 9% (SE = 0.03).
In Q. prinus, sap flow rates measured with 2-cm long TD sensors matched those measured with 1-cm long sensors at low flow rates but were underestimated at higher flow rates (Figure 4A). Applying the Clearwater correction to the 2-cm sensor data caused a slight overestimation of the data compared with the 1-cm sensor data, however data were still underestimated at the highest sap flow rates (Figure 4A). On the other hand, in Q. velutina, 1-cm TD sensors consistently underestimated sap flow rates compared with the 2-cm sensors with even larger differences occurring when the Clearwater correction was applied to the 2-cm sensor data (Figure 4B). Using the equation fitted to the uncorrected Q. prinus data in Figure 4A, 2-cm TD data were rescaled to the 1-cm sensor data and compared to trees that were also equipped with the THB system (Figure 5). With this 1-cm sensor correction, the 2-cm TD are no longer consistently underestimating sap flow rates relative to the THB data. The one to one line between the THB and TD data tends to fall near or within the 95% confidence intervals of the best fit regression however there is a large amount of scatter in the relationship (Figure 5).
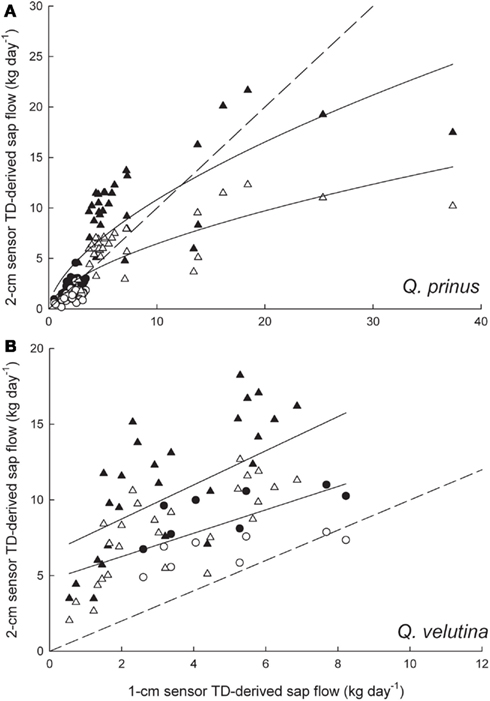
Figure 4. Comparison of sap flow rates measured with 1 and 2-cm long thermal dissipation (TD) sensors in (A) two Q. prinus individuals (circles – 16.8 cm dbh, triangles 17.7 cm dbh individual) and (B) a 19.5-cm dbh Q. velutina individual (circles – 2010 data, triangles – 2011 data). Open symbols denote sap flow rates derived from the original Granier equation and closed symbols are sap flow rates with the Clearwater correction applied to the 2-cm long sensor data. The dashed lines are the one to one lines and the solid lines are the best fits for (A) uncorrected data (y = 1.65 × x0.59, r2 = 0.63) and Clearwater-corrected data (y = 2.65 × x0.61, r2 = 0.65) and (B) uncorrected data (y = 0.77x + 4.7, r2 = 0.34) and Clearwater-corrected data (y = 1.13x + 6.5, r2 = 0.34).
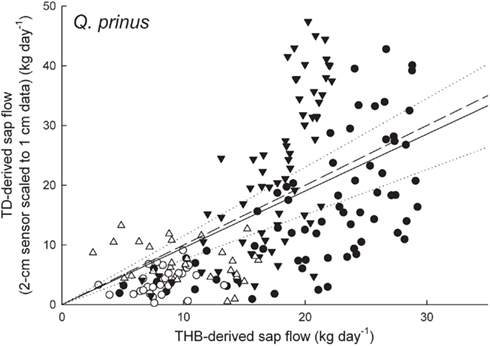
Figure 5. Quercus prinus daily sap flow rates (kg day-1) derived from the tissue heat balance (THB) system compared with rates derived from 2-cm long thermal dissipation (TD) sensors (no Clearwater correction applied) that were scaled using data from 1-cm long TD sensors (Figure 4). The closed circles denote data from a 17.7-cm dbh individual, open circles denote data from a 16.8-cm dbh individual and the triangles denote data from a 16.8-cm dbh individual measured in 2009 (closed) and 2010 (open). The dashed line is the one to one line, the solid line is the best fit regression(y = 1.15x − 3.83, r2 = 0.41) to the data and the dotted lines are the 95% confidence intervals around the linear regression.
When plot level transpiration rates were estimated for 2009 using either the TD sap flow data or the THB sap flow data values estimated from TD data tended to match values estimated from THB at low flow rates but were underestimated at higher fluxes (Figure 6). Likewise, underestimations were larger when the Clearwater correction was applied than when 2-cm TD sensors were corrected with 1 cm data (Figure 6). The average underestimation of Clearwater-corrected TD data was about 24% (SE = 0.02) and about 15% (SE = 0.02) when 2-cm TD sensor data were corrected with the 1-cm sensor equation.
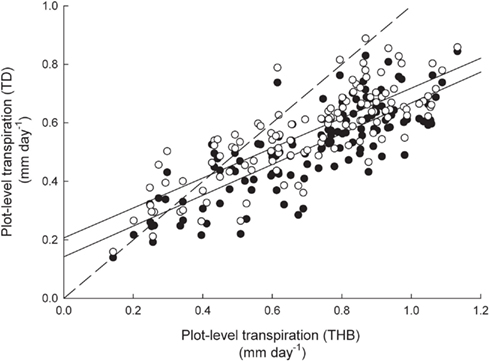
Figure 6. Plot level estimates of daily transpiration (mm day-1) for 2009 derived from tissue heat balance (THB) sap flow data vs. estimates derived from thermal dissipation (TD) sap flow data. Closed circles denote TD data with the Clearwater correction applied to all Quercus sp. and open circles denote TD data where Q. prinus 2-cm long sensors are corrected with 1-cm data regression (Figure 4A) and all other Quercus sp. received the Clearwater correction. The dashed line is the one to one line, and the solid lines are the best fit regressions for the Clearwater-corrected TD data (y = 0.66x + 0.13, r2 = 0.43) and the 1-cm corrected TD data (y = 0.66x + 0.18, r2 = 0.44).
Discussion
We found that sap flow rates in two Quercus sp. tended to be underestimated by the TD system compared to the THB system. The sap flow rates we found in the oak species using the THB method were between 1 and 5 kg h−1, which matched well with water absorption and heat pulse velocity rates measured in oaks (1.5–2 kg h−1; Granier et al., 1994) as well as rates measured using heat field deformation (2–4 kg h−1; Poyatos et al., 2007). The Clearwater correction brought values closer to those measured by the THB system in Q. prinus, but values still averaged 20–35% lower. Two centimeter long TD sensors also underestimated flow rates relative to 1-cm long TD sensors in Q. prinus, more so at higher flow rates. When 2-cm TD data were rescaled with data from the 1-cm long sensors, sap flow rates were no longer underestimated at high flow rates relative to the THB system. There is significant scatter in the relationship (Figure 5), but this may be a product of the inherent within- and between-tree variability in sap flow which has been shown to vary by about 30% around the mean in the oaks at this site (unpublished data). Some variability may also be attributed to the estimation of sapwood depth in the oak species. Determining the actual conducting area in these species is difficult without dye ascents and destructive sampling (Clearwater et al., 1999; Bush et al., 2010). Likewise, the true conducting area in ring-porous species may be changing both diurnally and throughout the season as the large earlywood vessels cavitate and refill (Taneda and Sperry, 2008; Christman et al., 2012). Therefore, one advantage of the THB system in ring-porous species is that accurate sapwood depths are not required as long as the estimated sapwood depth is covered by the sensors.
As long as a sufficient sample sizes are measured, sap flow rates measured with 1-cm long TD sensors should yield similar results as data measured with the THB system in Q. prinus (Figure 5). On the other hand, in Q. velutina, the 2-cm long TD sensor measured consistently higher flow rates than 1-cm long sensor, although in the range of flow rates measured by these sensors, Q. prinus also showed similar values between the two sensor lengths. In a Q. velutina individual, TD sensors also measured lower flow rates than the THB system, with the underestimation increasing at higher flow rates. A 1-cm long TD sensor in Q. velutina may measure higher flow rates than a 2-cm long sensor when fluxes are greater (20–40 kg day−1) and these may match more closely with values measured by the THB system. Unfortunately, data were not available in this study to test this relationship. Other studies have found that heat dissipation sensors underestimate sap flow rates relative to other independent measures of flow in both ring-porous and diffuse porous angiosperm species (Montague and Kjelgren, 2006; Steppe et al., 2010). Comparing sap flow rates measured with TD sensors with gravimetric water loss in four angiosperm species (Pyrus calleryana Decne., Quercus robur L., Populus deltoides Bartram ex. Marsh., and Liquidambar styraciflua L.), Montague and Kjelgren (2006) found that water loss rates were underestimated by about 45% by the TD method. However, 3-cm long sensors were used, and even though a correction was applied to account for the portion of the sensor in non-conductive wood, in these small diameter trees, the portion of conducting wood may have been significantly smaller than the sensor length. Likewise, in laboratory-measured stem segments of Fagus grandifolia Ehrh., Steppe et al. (2010) found that three methods that use heat as a tracer for sap flow, heat pulse velocity, the TD method, and heat field deformation, all underestimated sap flux densities compared with gravimetric measurements, with TD having the highest underestimation (60%).
As has been pointed out by several other authors, not only will TD sensors underestimate flow rates if a portion of the sensor is located in non-conducting wood but also if very high flow rates are concentrated along a fairly small portion of the sensor length (Clearwater et al., 1999; Lu et al., 2004). We found evidence for this in Q. prinus with 1-cm long TD sensors measuring higher flow rates than 2-cm long sensors under high flow conditions. On the other hand, the THB method is better able to deal with uneven flow rates across the sensor length (Tatarinov et al., 2005), possibly because it is designed to maintain a constant temperature in the measurement zone and adds additional energy in response to very high flow rates. This contrasts with the TD system, which maintains a constant power output and its measurement ability may therefore become “saturated” at very high flow rates. Shorter sensors distribute very localized flow rates across a larger portion of the sensor length and may be a good strategy to deal with small sapwood depths in trees (Clearwater et al., 1999; Lu et al., 2004). Another novel strategy proposed by Lu et al. (2004) to deal with small sapwood depths involves inserting the TD probes tangentially, instead of radially, into the sapwood. However, to our knowledge, this methodology has never been performed in the field.
Although the TD system tended to underestimate flows in the Quercus sp. compared to the THB system, both systems matched fairly well in the Pinus sp. Although we only had access to one Pinus individual for comparison, sap flow rates were underestimated slightly by the TD system, but only at very large flow rates. This may be a result of the radial correction factor we used, which was calculated as a step-wise decrease in flow from the outer sensor to the inner sensor. However, in reality, flow rates decrease non-linearly across the radial profile, being maximal just inside the most newly formed sapwood, then decreasing to the heartwood boundary (Ford et al., 2004). Other studies have found that sap flow rates measured with the THB system and 2-cm long TD sensors with a radial correction applied matched well in two conifer species, Scots pine (Pinus sylvestris L.; Granier et al., 1996; Köstner et al., 1996) and Norway spruce [P. abies (L.) H. Karst; Köstner et al., 1998] and in a tropical diffuse porous species, Gliricidia sepium [(Jacq.) Kunth ex. Walp.; Tournebize and Boistard, 1998]. However, Lundblad et al. (2001) also compared the THB system and 2-cm long TD sensors installed at 0–2 and 2–4 cm depths in Scots pine and Norway spruce trees and found that sap flow rates measured by the TD system were up to 50% lower than the THB system at high flow rates.
Differences between sap flows measured with the TD and THB system may be due to azimuthal variation in sap flow around the circumference of trees. Although Schäfer et al. (2002) report no significant differences between sap flow rates measured on the north and south side of Pinus taeda trees, other studies have found azimuthal differences in sap flow rates ranging from 65% (Tateishi et al., 2008) to over 100% (Tsuruta et al., 2010) within a given individual. In our study, the THB system tended to be located on the southern side of trees and the TD system on the western and northern side of trees. However, studies have found that variability in sap flow with azimuthal position tends to be random with no predictable pattern for the cardinal direction with the most flow (Fernández et al., 2006; Liu et al., 2008; Tsuruta et al., 2010). For example Liu et al. (2008) measured sap flow in Acacia mangium (Willd.) in each cardinal direction (N, S, E, W) using TD sensors and found that, in each tree, a different cardinal direction had the greatest flow rates. Loustau et al. (1998) found that sap flow rates varied widely with azimuth in maritime pines (Pinus pinaster Ait.) when measured at breast height, but showed little azimuthal variation when measured at the base of the live crown. Both the lack of azimuthal variation at the base of the live crown and the fact that no given cardinal direction has consistently the greatest sap flow rates suggests that light environment is not driving the differences in sap flow with azimuth (Tsuruta et al., 2010). However, several studies suggest that differences in hydraulic properties around the trunk largely explain the differences in sap flow rates with azimuthal location (Loustau et al., 1998; Tateishi et al., 2008; Tsuruta et al., 2010). These differences in hydraulic properties should be random around the circumference of the trunk and therefore would not explain why our TD sensors are consistently underestimating sap flow rates relative to the THB.
There is also some discussion in the literature about whether the TD method should be calibrated for each individual species in which it is used (Smith and Allen, 1996; Bush et al., 2010; Steppe et al., 2010) or whether Granier’s original calibration is universal (Lu et al., 2004). Individual species calibrations may be necessary because Granier’s original empirical calibration is not based on physical principles (Steppe et al., 2010). It has also been suggested that new calibrations should be performed for any system based on the heat dissipation methodology that deviates from the original heating power and probe design (Lu et al., 2004). This includes the use of shorter probes, however McCulloh et al. (2007) found that variable depth, 1-cm long probes (James et al., 2002) used with the original Granier equation matched well with gravimetric measures of water loss. Having different calibration equations for individual species detracts from the simplicity and ease of use of the TD system and may limit repeatability and comparability. We found that using shorter sensor lengths in oaks with the original calibration equation resulted in differences in sap flow of about 15% when compared with the THB system. This degree of variation may be tolerable for stand level estimates of water use or other broader scale applications and is on par with the variation in other measurement methods like eddy covariance (Rana and Katerji, 2000; Wilson et al., 2001; Oren et al., 2006). In instances where more fine-scale sap flow measurements are necessary, individual calibrations may need to be performed.
Conclusion
The ability to continuously measure sap flow rates in trees has led to great advances in tree physiological research and a greater understanding of ecological processes. Although every sap flow monitoring system has its limitations, as long as the proper considerations are taken into account, these systems can yield valid and valuable results. Likewise, through an adequate sampling either within an individual or within a plot (depending on the goals of the research), underestimations and overestimations made by individual sensors can average out to an appropriate estimate of water use at the plot level. Our plot level comparisons were within 15% of one another with underestimation of the TD system compared to the THB system attributed to underestimation in the Pinus individual (about 9%, SE = 0.03) as well as underestimations of flow in the Quercus individuals. This research is especially important in ecosystems dominated by ring-porous species (including oaks) because the error associated with various methods of measuring sap flow is much different from ecosystems that are dominated by conifer or diffuse porous species. Therefore, while the THB and TD methods remain powerful tools to study water use in trees, their applications should periodically be reviewed in species with differing wood types to ensure that they provide the most accurate estimates of sap flow both for individual studies as well as models that use these data.
Conflict of Interest Statement
The authors declare that the research was conducted in the absence of any commercial or financial relationships that could be construed as a potential conflict of interest.
Acknowledgments
The authors thank R. Tripathee, S. Wadhwa and M. Papadakis for field experimental maintenance and Rutgers University Newark start-up funds to K. Schäfer for funding this research as well as the USDA joint venture agreement 10-JV-11242306-136. The authors would also like to thank Dr. D. Vanderklein for comments on an earlier draft of the manuscript.
References
Al Hagrey, S. A. (2007). Geophysical imaging of root-zone, trunk, and moisture heterogeneity. J. Exp. Bot. 58, 839–854.
Asbjornsen, H., Goldsmith, G. R., Alvarado-Barrientos, M. S., Rebel, K., Van Osch, F. P., Rietkerk, M., Chen, J., Gotsch, S., Tobón, C., Geissert, D. R., Gómez-Tagle, A., Vache, K., and Dawson, T. E. (2011). Ecohydrological advances and applications in plant-water relations research: a review. J. Plant Ecol. 4, 3–22.
Baker, J. M., and van Bavel, C. H. M. (1987). Measurement of mass flow of water in the stems of herbaceous plants. Plant Cell Environ. 10, 777–782.
Barnard, H. R., and Ryan, M. G. (2003). A test of the hydraulic limitation hypothesis in fast-growing Eucalyptus saligna. Plant Cell Environ. 26, 1235–1245.
Burgess, S. S. O., Adams, M. A., Turner, N. C., and Ong, C. K. (1998). The redistribution of soil water by tree root systems. Oecologia 115, 306–311.
Bush, S. E., Hultine, K. R., Sperry, J. S., and Ehleringer, J. R. (2010). Calibration of thermal dissipation sap flow probes for ring- and diffuse-porous trees. Tree Physiol. 30, 1545–1554.
Cermák, J., Deml, M., and Penka, M. (1973). A new method of sap flow rate determination in trees. Biol. Plant 15, 171–178.
Cermák, J., Kucera, J., and Nadezhdina, N. (2004). Sap flow measurements with some thermodynamic methods, flow integration within trees and scaling up from sample trees to entire forest stands. Trees (Berl. West) 18, 529–546.
Christman, M., Sperry, J. S., and Smith, D. D. (2012). Rare pits, large vessels and extreme vulnerability to cavitation in a ring-porous tree species. New Phytol. 193, 713–720.
Cienciala, E., and Lindroth, A. (1995). Gas-exchange and sap flow measurements of willow trees in short-rotation forests. I. Transpiration and sap flow. Trees (Berl. West) 9, 289–294.
Clark, K. L., Skowronski, N., and Hom, J. (2010). Invasive insects impact forest carbon dynamics. Glob. Chang. Biol. 16, 88–101.
Clearwater, M. J., Meinzer, F. C., Andrade, J. L., Goldstein, G., and Holbrook, N. M. (1999). Potential errors in measurement of nonuniform sap flow using heat dissipation probes. Tree Physiol. 19, 681–687.
Daley, M. J., and Phillips, N. G. (2006). Interspecific variation in nighttime transpiration and stomatal conductance in a mixed New England deciduous forest. Tree Physiol. 26, 411–419.
Diawara, A., Loustau, D., and Berbigier, P. (1991). Comparison of two methods for estimating the evaporation of a Pinus pinaster (Ait.) stand: sap flow and energy balance with sensible heat flux measurements by an eddy covariance method. Agric. For. Meteorol. 54, 49–66.
Domec, J. C., Schäfer, K., Oren, R., Kim, H. S., and McCarthy, H. (2010). Variable conductivity and embolism in roots and branches of four contrasting tree species and their impacts on whole-plant hydraulic performance under future atmospheric CO2 concentrations. Tree Physiol. 30, 1001–1015.
Fernández, J. E., Durán, P. J., Palomo, M. J., Diaz-Espejo, A., Chamorro, V., and Girón, I. F. (2006). Calibration of sap flow estimated by the compensation heat pulse method in olive, plum and orange trees: relationships with xylem anatomy. Tree Physiol. 26, 719–728.
Ford, C. R., McGuire, M. A., Mitchell, R. J., and Teskey, R. O. (2004). Assessing variation in the radial profile of sap flux density in Pinus species and its effect on daily water use. Tree Physiol. 24, 241–249.
Goldstein, G., Andrade, J. L., Meinzer, F. C., Holbrook, N. M., Cavelier, J., Jackson, P., and Celis, A. (1998). Stem water storage and diurnal patterns of water use in tropical forest canopy trees. Plant Cell Environ. 21, 397–406.
Goulden, M. L., and Field, C. B. (1994). Three methods for monitoring the gas exchange of individual tree canopies: ventilated-chamber, sap-flow and Penman-Monteith measurements on evergreen oaks. Funct. Ecol. 8, 125–135.
Granier, A. (1987). Evaluation of transpiration in a Douglas-fir stand by means of sap flow measurements. Tree Physiol. 3, 309–320.
Granier, A., Anfodillo, T., Sabatti, M., Cochard, H., Dreyer, E., Tomasi, M., Valentini, R., and Bréda, N. (1994). Axial and radial water flow in the trunks of oak trees: a quantitative and qualitative analysis. Tree Physiol. 14, 1383–1396.
Granier, A., Biron, P., Köstner, B., Gay, L. W., and Najjar, G. (1996). Comparisons of xylem sap flow and water vapour flux at the stand level and derivation of canopy conductance for Scots pine. Theor. Appl. Climatol. 53, 115–122.
Granier, A., Biron, P., and Lemoine, D. (2000). Water balance, transpiration and canopy conductance in two beech stands. Agric. For. Meteorol. 100, 291–308.
Helfter, C., Shephard, J. D., Martínez-Vilalta, J., Mencuccini, M., and Hand, D. P. (2007). A noninvasive optical system for the measurement of xylem and phloem sap flow in woody plants of small stem size. Tree Physiol. 27, 169–179.
Homan, N. M., Windt, C. W., Vergeldt, F. J., Gerkema, E., and Van As, H. (2007). 0.7 and 3 T MRI and sap flow in intact trees: xylem and phloem in action. Appl. Magn. Reson. 32, 157–170.
Hultine, K. R., Nagler, P. L., Morino, K., Bush, S. E., Burtch, K. G., Dennison, P. E., Glenn, E. P., and Ehleringer, J. R. (2010). Sap flux-scaled transpiration by tamarisk (Tamarix spp.) before, during and after episodic defoliation by the saltcedar leaf beetle (Diorhabda carinulata). Agric. For. Meteorol. 150, 1467–1475.
James, S. A., Clearwater, M. J., Meinzer, F. C., and Goldstein, G. (2002). Heat dissipation sensors of variable length for the measurement of sap flow in trees with deep sapwood. Tree Physiol. 22, 1–7.
Köstner, B., Biron, P., Siegwolf, R., and Granier, A. (1996). Estimates of water vapor flux and canopy conductance of Scots pine at the tree level utilizing different xylem sap flow methods. Theor. Appl. Climatol. 53, 105–113.
Köstner, B., Granier, A., and Cermák, J. (1998). Sapflow measurements in forest stands: methods and uncertainties. Ann. Sci. For. 55, 13–27.
Liu, X., Zhao, P., Rao, X., Ma, L., Cai, X., and Zeng, X. (2008). Response of canopy stomatal conductance of Acacia mangium forest to environmental driving factors. Front. For. China 3:64–71. doi:10.1007/s11461-008-0001-3
Loustau, D., Domec, J. C., and Bosc, A. (1998). Interpreting the variations in xylem sap flux density within the trunk of maritime pine (Pinus pinaster Ait.): application of a model for calculating water flows at tree and stand levels. Ann. For. Sci. 55, 29–46.
Lu, P., Urban, L., and Zhao, P. (2004). Granier’s thermal dissipation probe (TDP) method for measuring sap flow in trees: theory and practice. Acta Bot. Sin. 46, 631–646.
Lundblad, M., Lagergren, F., and Lindroth, A. (2001). Evaluation of heat balance and heat dissipation methods for sapflow measurements in pine and spruce. Ann. For. Sci. 58, 625–638.
Magnani, F., Bensada, A., Cinnirella, S., Ripullone, F., and Borghetti, M. (2008). Hydraulic limitations and water-use efficiency in Pinus pinaster along a chronosequence. Can. J. For. Res. 38, 73–81.
Marshall, D. C. (1958). Measurment of sap flow in conifers by heat transport. Plant Physiol. 33, 385–396.
McCulloh, K. A., Winter, K., Meinzer, F. C., Garcia, M., Aranda, J., and Lachenbruch, B. (2007). A comparison of daily water use estimates derived from constant-heat sap-flow probe values and gravimetric measurements in pot-grown saplings. Tree Physiol. 27, 1355–1360.
Meinzer, F. C., James, S. A., and Goldstein, G. (2004). Dynamics of transpiration, sap flow and use of stored water in tropical forest canopy trees. Tree Physiol. 24, 901–909.
Montague, T., and Kjelgren, R. (2006). Use of thermal dissipation probes to estimate water loss of containerized landscape trees. J. Environ. Hortic. 24, 95–104.
Moore, G. W., Cleverly, J. R., and Owens, M. K. (2008). Nocturnal transpiration in riparian Tamarix thickets authenticated by sap flux, eddy covariance and leaf gas exchange measurements. Tree Physiol. 28, 521–528.
Oishi, A. C., Oren, R., and Stoy, P. C. (2008). Estimating components of forest evapotranspiration: a footprint approach for scaling sap flux measurements. Agric. For. Meteorol. 148, 1719–1732.
Oren, R., Hsieh, C. I., Stoy, P., Albertson, J., McCarthy, H. R., Harrell, P., and Katul, G. G. (2006). Estimating the uncertainty in annual net ecosystem carbon exchange: spatial variation in turbulent fluxes and sampling errors in eddy-covariance measurements. Glob. Chang. Biol. 12, 883–896.
Phillips, N., Nagchaudhuri, A., Oren, R., and Katul, G. (1997). Time constant for water transport in loblolly pine trees estimated from time series of evaporative demand and stem sapflow. Trees (Berl. West) 11, 412–419.
Phillips, N., Oren, R., and Zimmermann, R. (1996). Radial patterns of xylem sap flow in non-, diffuse- and ring-porous tree species. Plant Cell Environ. 19, 983–990.
Poyatos, R., Cermák, J., and Llorens, P. (2007). Variation in the radial patterns of sap flux density in pubescent oak (Quercus pubescens) and its implications for tree and stand transpiration measurements. Tree Physiol. 27, 537–548.
Rana, G., and Katerji, N. (2000). Measurement and estimation of actual evapotranspiration in the field under Mediterranean climate: a review. Eur. J. Agron. 13, 125–153.
Rhodehamel, E. (1998). “Geology of the Pine Barrens of New Jersey,” in Pine Barrens: Ecosystem and Landscape, ed. R. Forman (New Brunswick: Rutgers University Press), 601.
Sakuratani, T. (1981). A heat balance method for measuring water flux in the stem of intact plants. J. Agric. Meteorol. 37, 9–17.
Schäfer, K. V. R., Clark, K. L., Skowronski, N., and Hamerlynck, E. P. (2010). Impact of insect defoliation on forest carbon balance as assessed with a canopy assimilation model. Glob. Chang. Biol. 16, 546–560.
Schäfer, K. V. R., Oren, R., Ellsworth, D. S., Lai, C. T., Herrick, J. D., Finzi, A. C., Richter, D. D., and Katul, G. G. (2003). Exposure to an enriched CO2 atmosphere alters carbon assimilation and allocation in a pine forest ecosystem. Glob. Chang. Biol. 9, 1378–1400.
Schäfer, K. V. R., Oren, R., Lai, C. T., and Katul, G. G. (2002). Hydrologic balance in an intact temperate forest ecosystem under ambient and elevated atmospheric CO2 concentration. Glob. Chang. Biol. 8, 895–911.
Schäfer, K. V. R., Oren, R., and Tenhunen, J. D. (2000). The effect of tree height on crown level stomatal conductance. Plant Cell Environ. 23, 365–375.
Schulze, E. D., Cermák, J., Matyssek, R., Penka, M., Zimmermann, R., Vasícek, F., Gries, W., and Kucera, J. (1985). Canopy transpiration and water fluxes in the xylem of the trunk of Larix and Picea trees – a comparison of xylem flow, porometer and cuvette measurements. Oecologia 66, 475–483.
Smith, D. M., and Allen, S. J. (1996). Measurement of sap flow in plant stems. J. Exp. Bot. 47, 1833–1844.
Steppe, K., De Pauw, D. J. W., Doody, T. M., and Teskey, R. O. (2010). A comparison of sap flux density using thermal dissipation, heat pulse velocity and heat field deformation methods. Agric. For. Meteorol. 150, 1046–1056.
Swanson, R. H., and Whitfield, D. W. A. (1981). A numerical analysis of heat pulse velocity theory and practice. J. Exp. Bot. 32, 221–239.
Taneda, H., and Sperry, J. S. (2008). A case-study of water transport in co-occurring ring- versus diffuse-porous trees: contrasts in water-status, conducting capacity, cavitation and vessel refilling. Tree Physiol. 28, 1641–1651.
Tatarinov, F. A., Kucera, J., and Cienciala, E. (2005). The analysis of physical background of tree sap flow measurement based on thermal methods. Meas. Sci. Technol. 16, 1157–1169.
Tateishi, M., Kumagai, T., Utsumi, Y., Umebayashi, T., Shiiba, Y., Inoue, K., Kaji, K., Cho, K., and Otsuki, K. (2008). Spatial variations in xylem sap flux density in evergreen oak trees with radial-porous wood: comparisons with anatomical observations. Trees (Berl. West) 22, 23–30.
Tournebize, R., and Boistard, S. (1998). Comparison of two sap flow methods for the estimation of tree transpiration. Ann. Sci. For. 55, 707–713.
Tributsch, H., Nadezhdina, N., and Cermák, J. (2006). Infrared images of heat fields around a linear heater in tree trunks: what can be learned about sap flow measurement? Ann. For. Sci. 63, 653–660.
Tsuruta, K., Kume, T., Komatsu, H., Higashi, N., Umebayashi, T., Kumagai, T., and Otsuki, K. (2010). Azimuthal variations of sap flux density within Japanese cypress xylem trunks and their effects on tree transpiration estimates. J. For. Res. 15, 398–403.
Wilson, K. B., Hanson, P. J., Mulholland, P. J., Baldocchi, D. D., and Wullschleger, S. D. (2001). A comparison of methods for determining forest evapotranspiration and its components: sap-flow, soil water budget, eddy covariance and catchment water balance. Agric. For. Meteorol. 106, 153–168.
Wullschleger, S. D., Meinzer, F. C., and Vertessy, R. A. (1998). A review of whole-plant water use studies in trees. Tree Physiol. 18, 499–512.
Keywords: granier calibration, Quercus, Pinus, sap flux, thermal dissipation, tissue heat balance
Citation: Renninger HJ and Schäfer KVR (2012) Comparison of tissue heat balance- and thermal dissipation-derived sap flow measurements in ring-porous oaks and a pine. Front. Plant Sci. 3:103. doi: 10.3389/fpls.2012.00103
Received: 05 March 2012; Paper pending published: 29 March 2012;
Accepted: 02 May 2012; Published online: 21 May 2012.
Edited by:
Ülo Niinemets, Estonian University of Life Sciences, EstoniaReviewed by:
Aurora Gaxiola, P. Universidad Católica de Chile, ChileJan Cermak, Mendel University in Brno, Czech Republic
Copyright: © 2012 Renninger and Schäfer. This is an open-access article distributed under the terms of the Creative Commons Attribution Non Commercial License, which permits non-commercial use, distribution, and reproduction in other forums, provided the original authors and source are credited.
*Correspondence: Heidi J. Renninger, Department of Biological Sciences, Rutgers University, 195 University Avenue, Newark, NJ 07102, USA. e-mail: hrenninger@gmail.com