
- 1 Tsukuba Division, Mitsubishi Space Software Co., Ltd, Tsukuba, Japan
- 2 Plant Genetics Laboratory, National Institute of Genetics, Mishima, Japan
- 3 Department of Life Science and Informatics, Maebashi Institute of Technology, Maebashi, Japan
- 4 National Institute of Crop Science, National Agriculture and Food Research Organization, Tsukuba, Japan
The Soybean Proteome Database (SPD) was created to provide a data repository for functional analyses of soybean responses to flooding stress, thought to be a major constraint for establishment and production of this plant. Since the last publication of the SPD, we thoroughly enhanced the contents of database, particularly protein samples and their annotations from several organelles. The current release contains 23 reference maps of soybean (Glycine max cv. Enrei) proteins collected from several organs, tissues, and organelles including the maps for plasma membrane, cell wall, chloroplast, and mitochondrion, which were analyzed by two-dimensional polyacrylamide gels. Furthermore, the proteins analyzed with gel-free proteomics technique have been added and are available online. In addition to protein fluctuations under flooding, those of salt and drought stress have been included in the current release. A case analysis employing a portion of those newly released data was conducted, and the results will be shown. An ‘omics table has also been provided to reveal relationships among mRNAs, proteins, and metabolites with a unified temporal-profile tag in order to facilitate retrieval of the data based on the temporal profiles. An intuitive user interface based on dynamic HTML enables users to browse the network as well as the profiles of the multiple “omes” in an integrated fashion. The SPD is available at: http://proteome.dc.affrc.go.jp/Soybean/
Introduction
One of the most advantageous uses of proteomic technology is the direct determination of biologically reacting proteins within a living organism. While numbers of entire genome sequences of legumes have been revealed (Sato et al., 2008; Schmutz et al., 2010; Young et al., 2011; Katayose et al., 2012), proteomic approaches provide the advantage of direct identification and measurement of protein molecules. This advantage lets us overcome the difficulties associated with inconsistencies between proteomes and genomes, which result from one gene translated into multiple protein products by alternative splicing or post-translational modifications or expression is spatiotemporally regulated. Therefore, proteome analysis linked to genome sequence information will be very useful for functional genomics in order to define the function of their associated genes from another aspect.
Legumes are important as food for maintenance of human health and as crops for sustainable agriculture. Particularly, the agricultural legume soybean has been one of the most important crops in many countries. For this crop plant, flooding stress is one of the natural conditions that exhibit a severe negative influence on the productivity of arable farmland (Komatsu et al., 2012). Climate model forecasts have predicted that global surface temperature will be raised and will bring a drastic change in rainfall pattern and threat to plant vegetation worldwide (Groisman et al., 2005). Of the 70% lost in yield potential due to imbalances in physiochemical environments, about 16% has been calculated to be lost due to flooding (Boyer, 1982). Development of cultivars that are more resistant to adverse growing conditions in terms of both yield and quality are needed. Besides flooding stress, there have been other external stresses affecting agricultural production, like salt stress and drought stress. For future functional analysis of soybean, comprehensive data of agricultural conditions should be provided to the scientific community for soybean research.
With the aim of building the comprehensive platform for future soybean proteomics, we developed the Soybean Proteome Database (SPD, Sakata et al., 2009), which consists of the proteome data collected from plants in flooding stress conditions. The SPD focuses on the seedling stage, 0–7 days after sowing, of Glycine max cv. Enrei, and includes multiple levels of biological data, transcriptome and metabolome in addition to the proteome. Such integrated “omes” are coordinated as temporal profiles in which each element differentially expressed under flooding stress is compared to a control condition. Also, the data from different “omes” are associated with each other based on manual annotations. These features discriminate the SPD from other soybean databases, the Proteomics of Oilseeds (Hajduch et al., 2005) which stores data of seed filling stage from Glycine max cv. Maverick, and SoyKB (Joshi et al., 2012) which stores multiple “omes” including temporal expression profiles of proteins from Glycine max cv. Williams 82. In the past few years, the SPD has been enhanced with additional sampling conditions from several organs, tissues, and subcellular compartments including maps based on two-dimensional polyacrylamide gels (2-DE) for plasma membrane (PM; Komatsu et al., 2009), cell wall (CW; Komatsu et al., 2010), chloroplast (Ahsan et al., 2010), and the mitochondrion (Komatsu et al., 2011). Furthermore, proteins analyzed with gel-free proteomics technique have also been added. Here we will briefly introduce the recent updates and latest enhancements of our publicly available database. In addition, we will showcase an analysis of “comparative proteomics” with datasets comprising organs and subcellular compartments.
Materials and Methods
The conventional materials and methods of this work are based on those of our previous works (Sakata et al., 2009). Newly employed materials and methods are as described below.
Stress Treatments
To perform stress specific experiments, soybean (Glycine max cv. Enrei) seedlings under various abiotic stresses for 2–7 days were used and the roots, hypocotyls, and leaves were collected. Abiotic stresses included flooding stress (complete submergence in water; Komatsu et al., 2009), drought (withholding water; Mohammadi et al., 2012), and salinity (40 mM NaCl; Sobhanian et al., 2010). Three independent biological experiments were performed for each condition.
Gel-Based and Gel-Free Proteomics
To analyze stress responsive proteins and subcellular proteins, gel-based and gel-free proteomics techniques have been employed. Subcellular compartments were purified and proteins were extracted from soybean seedlings. Extracted proteins were separated by 2-DE, stained with Coomassie brilliant blue. Protein spots were excised from 2-DE gels, and reduced with dithiothreitol and alkylated with iodoacetamide. For gel-free proteomics, extracted proteins were directly reduced with dithiothreitol and alkylated with iodoacetamide. Alkylated proteins were digested with trypsin, and resulting tryptic peptides were acidified with formic acid. Peptides were desalted using a C18-pipette tip, and subjected to nano-liquid chromatography mass spectrometry. The proteins were identified using the Mascot search engine against database (Komatsu et al., 2009).
Web Interface
The major composition of the SPD has been 2-DE data (Figure 1A, http://proteome.dc.affrc.go.jp/cgi-bin/2d/2d.cgi), developed with the Make2D-DB II environment (Mostaguir et al., 2003). The database can be searched in any of the following ways: (1) By selecting a spot on one of the 2-DE reference maps. The SPD contains properties of proteins identified in tissues and organelles on 2-DE reference maps. The spots in these 2-DE maps are clickable and each of them is linked to properties for each protein. (2) By “accession number,” “description,” or “spot identifier” using the accession number, description, or spot ID. The SPD can be searched using protein names as keywords. (3) By pI (isoelectric point) and Mw (molecular weight) of each protein. The SPD can also be searched with a range of pI and Mw. (4) By “graphical web interface.” All of the 2-DE reference maps can be displayed in a window and selected.
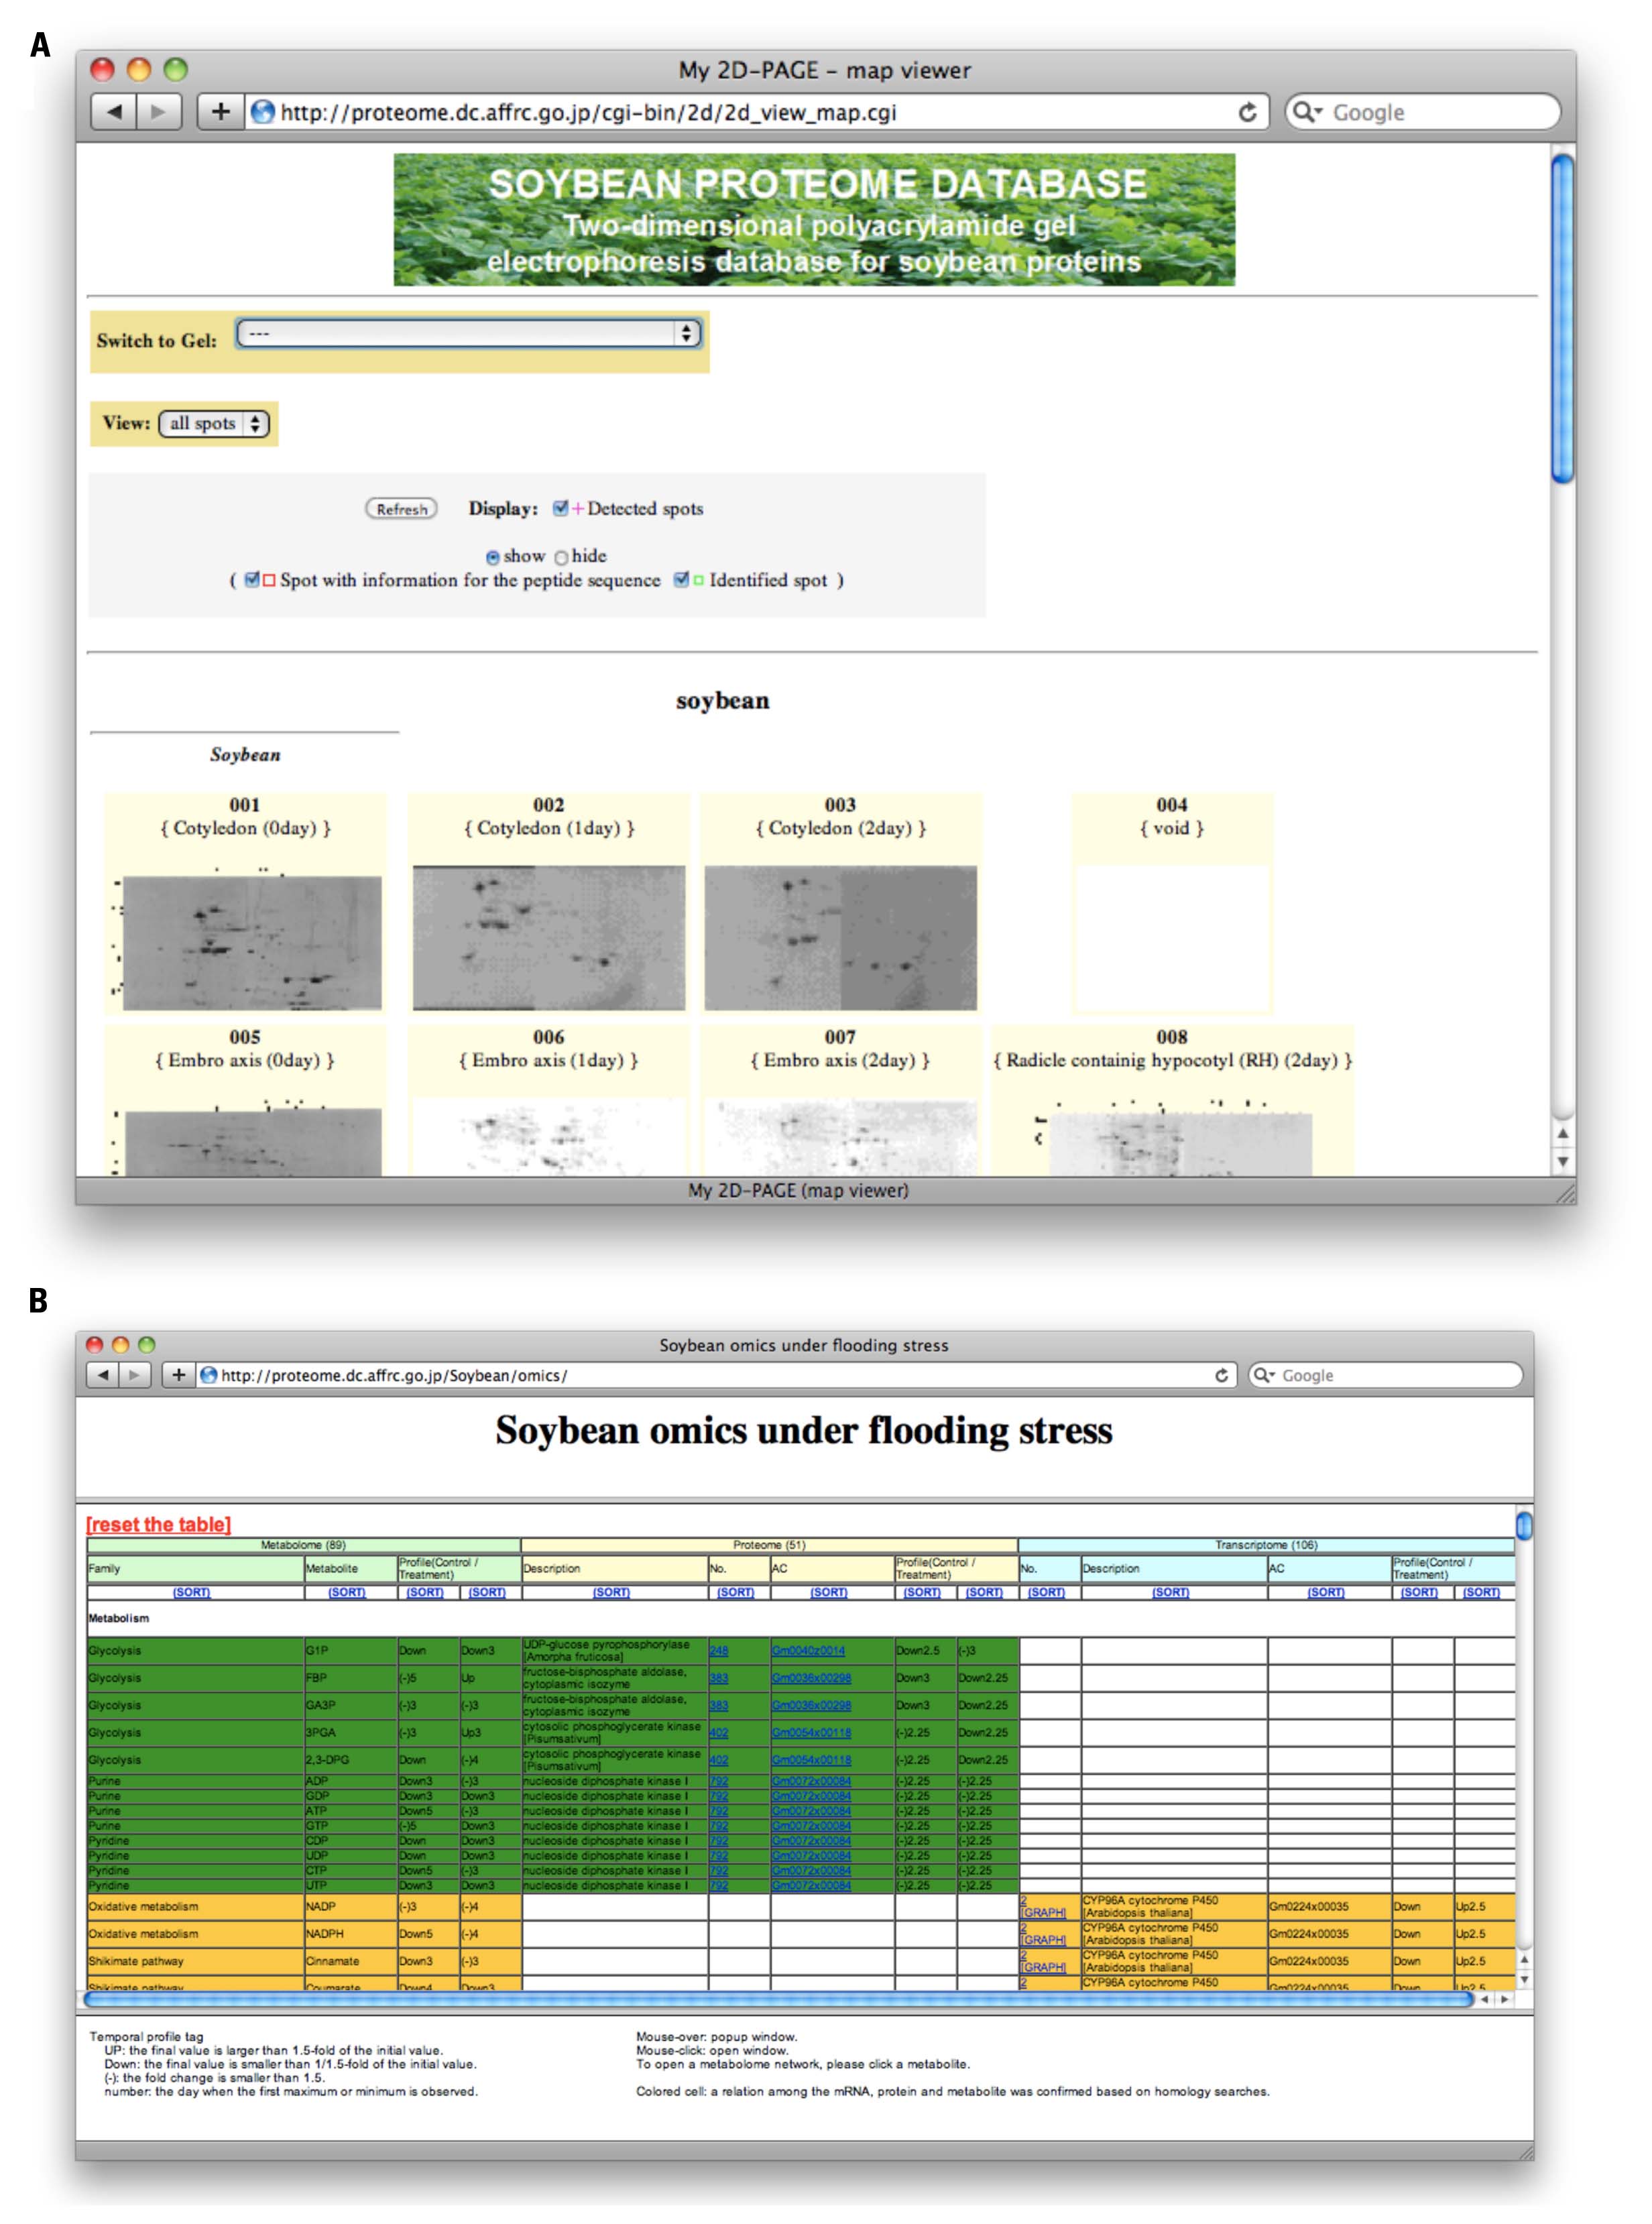
FIGURE 1. Web presentation of Soybean Proteome Database (SPD). (A) Overview of 2-DE maps (http://proteome.dc.affrc.go.jp/cgi-bin/2d/2d_view_map.cgi). Particular gel maps can be selected and properties of proteins on the map can be retrieved from database. (B) The ‘omics table (http://proteome.dc.affrc.go.jp/Soybean/omics/). Resource information of transcripts, proteins, and metabolites can be accessed in a unified manner. Corresponding counterparts are shown in a row.
The omics table (Figure 1B, http://proteome.dc.affrc.go.jp/Soybean/omics/) implemented with a dynamic Hyper Text Markup Language (HTML) interface and pop-up enabled temporal profiles, has been provided in order to indicate significant relationships across the mRNAs, proteins, and metabolites indicated by the shared color of each cell. With the dynamic interface, the pop-up function will be performed on the client side once the data has been downloaded. This contributes to seamless navigation process with the clients’ web browser. An HTML page for the metabolome has been linked with diagrams of the metabolomic network on which varying metabolites under flooding stress are positioned. These diagrams can be resized using a mouse and browser functionality. The data linked to the ‘omics table can be retrieved through mRNAs, proteins, and metabolites on the table, and temporal expression profiles are linked to each element. A set of colored cells in the table means the elements have a significant relationship across different “omes” such as a protein translated from the corresponding mRNA, and the mRNA presumed to encode the enzyme, as well as associated substrates and metabolites.
The top page (http://proteome.dc.affrc.go.jp/Soybean/) has links to experimental protocols, a document outlining the current status of proteomics, references, proteomics tools, and so on. The newly included proteomics datasets (comparative proteomics data, and Gel-free proteomics data, see Newly Released Proteome Data) are also linked from the top of the page.
Newly Released Proteome Data
Proteome Data Under Flooding Stress
Newly determined reference maps based on 2-DE of soybean proteins have been added to the “2-DE presentation.” These datasets were produced under conditions of flooding stress; the total number of the maps is 23 (as of March 2012). They comprise proteins from several organs, tissues, and subcellular compartments including the maps for PM, CW, chloroplast, and mitochondria. Make 2D-DB II software has been employed for data management and visualization of the map images (see Materials and Methods).
Comparative Proteomics Data for Drought, Salt, and Flooding Stress
The current version of SPD includes newly implemented comparative proteomic features comprising the collection of differentially expressed proteins and their properties. Formatted HTML tables of the proteins sampled under three conditions (drought, salt, and flooding) and in three organs (leaf, hypocotyl, and root), consequently nine tables are available in the current release. A total of about 300 protein’ properties including accession number, pI, Mw, and fold change of the protein during the course of the stress, have been included in these tables.
Gel-Free Proteomics Data
One more brand-new feature of SPD, gel-free proteomics, has also been provided in a formatted HTML table. It consists of more than 100 identified proteins that quantitatively fluctuated under flooding stress in root tips of soybean seedlings. These proteins were specifically identified using gel-free proteomics technique.
Proteins Identified in Different Organs and Subcellular Compartments
Here we present a case analysis that illustrated the utility of SPD using comparative proteomic data and the newly released datasets. Our 2-DE analyses detected 3,399 and 2,019 proteins from seven organs and four subcellular compartments, respectively. Each of the detected protein spots was evaluated and selected as an “identified protein.” The designation occurred whether the spot was identified as a known protein or if its sequence was determined by Edman sequencing or if it comprised unidentified spectra determined by MS. We identified 210 non-redundant proteins from the seven organs and 145 non-redundant proteins from the four subcellular compartments. We focused on the identified proteins as representative of proteins expressed in the corresponding organs and subcellular compartments, and investigated proteins commonly identified across organs and/or subcellular compartments (Figure 2). In the clustering results, the Cot and EA samples split together to form a branch, likely due to both samples being extracted from seeds. This result suggests existence of proteins commonly expressed across organs at this stage of seed development. The root, hypocotyl, and leaf samples are also split to form a branch; these samples were extracted from 7 days after sowing. This result suggests existence of proteins commonly expressed across organs at this developmental stage. The PM and CW samples clustered and suggests the existence of proteins expressed across the adjacent subcellular compartments being shared in the PM and CW.
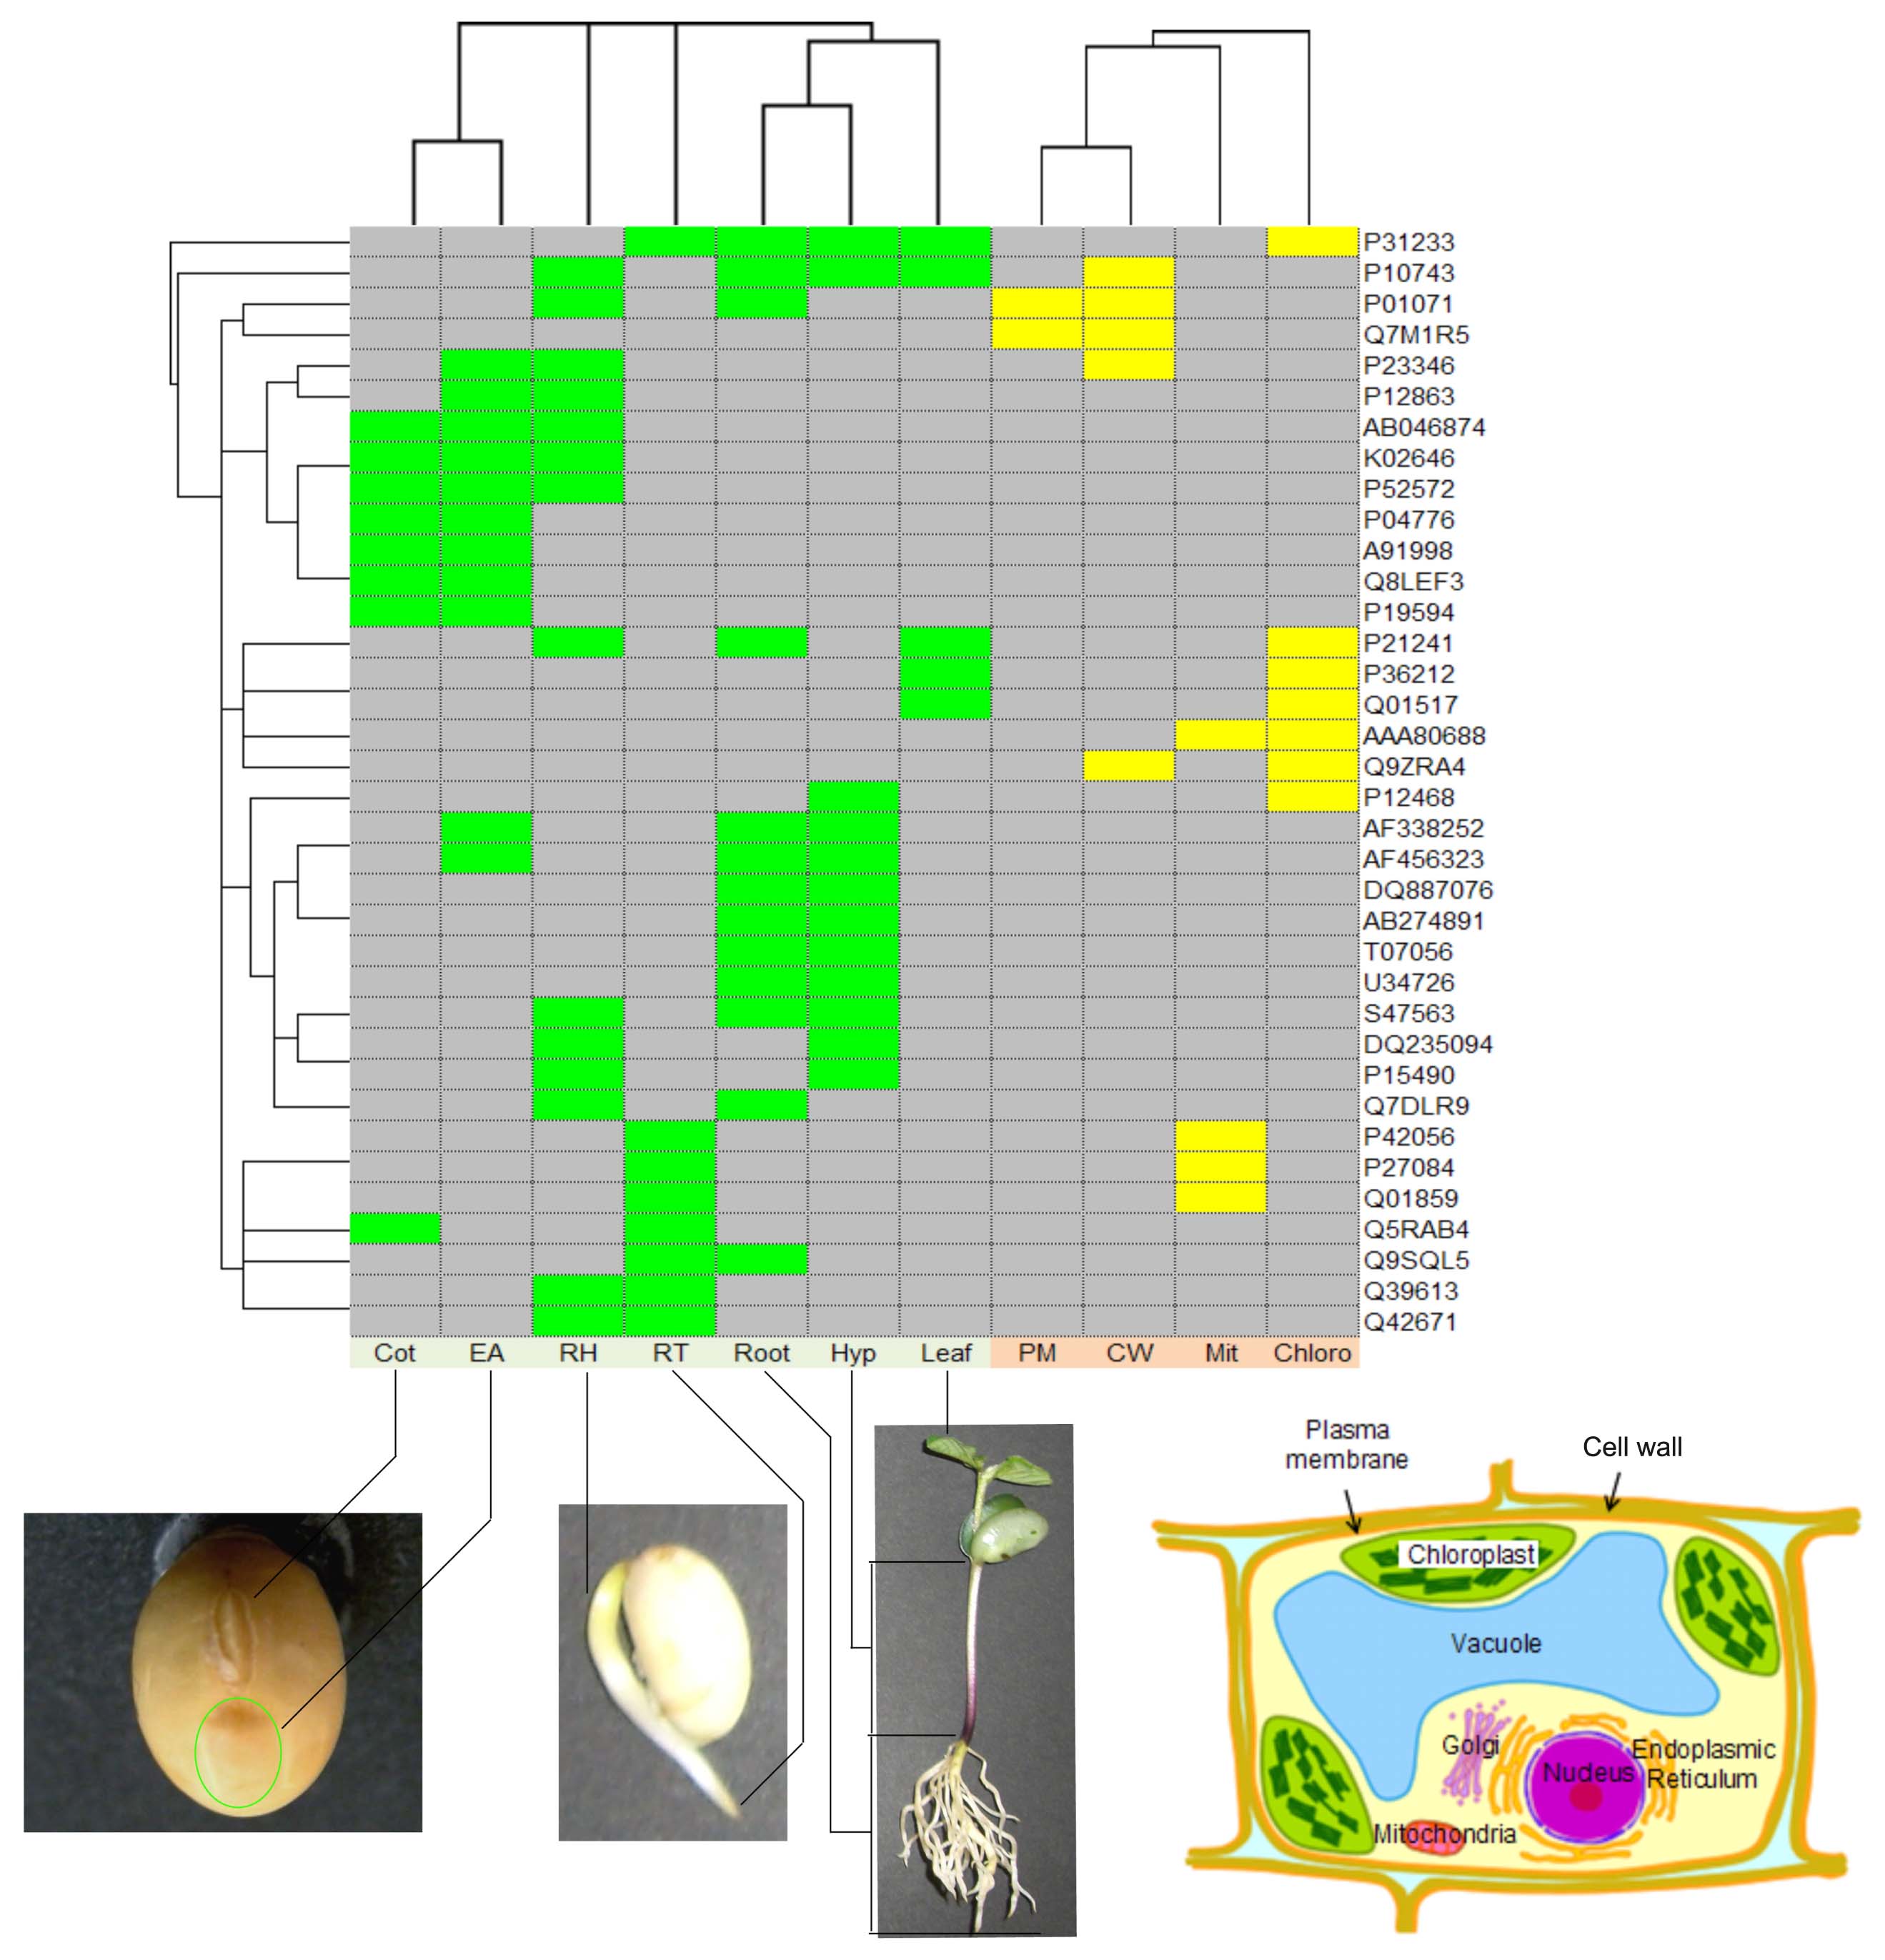
FIGURE 2. Clustering results for 36 proteins identified in more than one organ and/or subcellular compartment. Accession numbers for the proteins are indicated on the right-hand side. Colored boxes indicate an identified protein found in the organ (green) or a subcellular compartment (yellow). Samples from seven organs, Cot (cotyledon), EA (embryonic axis), RH (radicle plus hypocotyl), RT (root tip), Root, Hyp (hypocotyls), and Leaf, and four subcellular compartments, PM (plasma membrane), CW (cell wall), Mit (mitochondrion), and Chloro (chloroplast), were investigated. The samples of Cot, EA, RH, RT, Root, Hyp, and Leaf were extracted 0, 0, 2, 3, 7, 7, and 7 days after seedling emergence, respectively. The samples comprising PM, CW, Mit, and Chloro were extracted 3, 4, 4, and 7 days after seedling emergence, respectively. Clustering was conducted based on the identification of corresponding proteins, as identified (1) or not-identified (0), separately for organs and subcellular compartments. Hierarchical clustering was performed using Gene Cluster 3.0 (de Hoon et al., 2004) with Euclidean distance and centroid linkage method. The resulting clusters were visualized using JAVA TREEVIEW (Saldanha, 2004).
We further investigated the 210 proteins identified in the organ samples. The numbers of proteins identified in common between 4, 3, 2, and 1 organs was 2, 7, 18, and 183, respectively. We further examined the relationship between the 27 proteins expressed in two or more organs and the remaining 183 proteins expressed in only one organ: (i) assume random expression of 30,000 proteins (~ the number of genes in a higher plant) and calculate the probability (p) that a protein expresses in an organ: p = 486/30,000 = 0.0162. Here the number of expressed proteins is assumed to be equal to the number of detected proteins described in the previous paragraph, and the average number of detected proteins in an organ was 486 (maximum: 847, minimum: 173); (ii) calculate the probability (Pk) that a protein expresses in k out of seven organs: Pk = Combination (7,k) × pk × (1 - p)7-k; (iii) calculate the probability (Pk>0) that a protein expresses in one or more organs: Pk>0 = 1 - P0; (iv) calculate the probability (P(1)) that a protein expresses only in one organ among proteins expressed in one or more organs: P(1) = P1/Pk>0; (v) calculate the probability that 183 proteins expressed only in one organ and the 27 proteins express in more than one organ: Combination (210,27) × P(1)183 × (1 - P(1))27 = 2.8e - 6. The small p-value (2.8e - 6) suggests that proteins do not express at random but specifically in a given organ.
The above investigation also shows that the probability that a protein randomly expresses in three or more organs is 1 - P0 - P1 - P2 = 1.4e - 4, which is nearly 1/800 of the probability that it expresses in one or more organ, 1 - P0 = 0.108. Thus, the proteins identified in three organs, AB046874 (Glycine max mRNA for allergen Gly m Bd 28K partial cds), AF338252 (Glycine max BiP-isoform), AF456323 (Glycine max cyclophilin), K02646 (Soybean glycinin subunit), P21241 (RuBisCo subunit binding-protein beta subunit), P52572 (probable peroxiredoxin, EC 1.11.1.15) and S47563 (nucleoside-diphosphate kinase), and identified in four organs, P10743 (Stem 31 kDa glycoprotein precursor) and P31233 (20 kDa chaperonin, chloroplast), are suggested to be significantly represented in these organs.
Future Perspective on Soybean Proteomics
The latest status of the SPD, which is our comprehensive data repository for soybean proteomics has been highlighted here. As we have already mentioned, the most advantageous point of proteomic technique is that it is a straightforward quantitative methodology to determine the working molecules in an organism. From that viewpoint, proteomic approaches are still invaluable in the next-generation genome sequencing era. Thus, proteomics, together with genomics (including NGS transcriptomics) will constitute future ‘omic studies. Our ‘omics table also demonstrates that metabolomics might be one further aspect in future ‘omics.
Coupling proteomic analyses with genomic and other omics analyses would contribute to give a deeper insight into soybean biology and help the future production of soybean, an important global crop. We believe that this approach could be applied to other legumes, and other agricultural plants. Collectively, these objectives would aim at developing better future by alleviating the shortage of world food.
Conflict of Interest Statement
The authors declare that the research was conducted in the absence of any commercial or financial relationships that could be construed as a potential conflict of interest.
Acknowledgments
This work was supported by grants from the National Agriculture and Food Research Organization, Japan. This database was constructed using Virtual Laboratory System in Agriculture, Forestry and Fisheries Research Information Technology Center, MAFF, Japan. The authors thank Dr. Y. Nanjo and Dr. M. Z. Nouri for their kind support of the research. We also thank Dr. N. Ahsan, Mr. Y. Kobayashi, Mr. T. Wada, Mr. A. Yamamoto, Dr. H. Sobhanian, and Mr. P. P. Mohammadi for providing the 2-DE pattern of subcellular proteins. The authors also thank Ms. N. Sasaki for the clustering analysis.
References
Ahsan, N., Nanjo, Y., Sawada, H., Ko- hno, Y., and Komatsu, S. (2010). Ozone stress-induced proteomic cha- nges in leaf total soluble and chloroplast proteins of soybean reveal that carbon allocation is involved in adaptation in the early developmental stage. Proteomics 10, 2605–2619.
de Hoon, M. J. L., Imoto, S., Nolan, J., and Miyano, S. (2004). Open source clustering software. Bioinformatics 20, 1453–1454.
Groisman, P. Y., Knigh, R. W., Easterling, D. R., Karl, T. R., Heger, G. C., and Razuvaev, V. N. (2005). Trends in intense precipitation in the climate record. J. Clim. 18, 1326–1350.
Hajduch, M., Ganapathy, A., Stein, J. W., and Thelen, J. J. (2005). A systematic proteomic study of seed filling in soybean. Establishment of high-resolution two-dimensional reference maps, expression profiles, and an interactive proteome database. Plant Physiol. 137, 1397–1419.
Joshi, T., Patil, K., Fitzpatrick, M. R., Franklin, L. D., Yao, Q., Cook, J. R., Wang, Z., Libault, M., Brechenmacher, L., Valliyodan, B., Wu, X., Cheng, J., Stacey, G., Nguyen, H. T., and Xu, D. (2012). Soybean Knowledge Base (SoyKB): a web resource for soybean translational genomics. BMC Genomics 13(Suppl. 1), S15. doi:10.1186/1471-2164-13-S1-S15
Katayose, Y., Kanamori, H., Shimomura, M., Ohyanagi, H., Ikawa, H., Minami, H., Shibata, M., Ito, T., Kurita, K., Ito, K., Tsubokura, Y., Kaga, A., Wu, J., Matsumoto, T., Harada, K., and Sasaki, T. (2012). DaizuBase, an integrated soybean genome database including BAC-based physical maps. Breed. Sci. 61, 661–664.
Komatsu, S., Hiraga, S., and Yanagawa, Y. (2012). Proteomics techniques for the development of flood tolerant crops. J. Proteome Res. 11, 68–78.
Komatsu, S., Kobayashi, Y., Nishizawa, K., Nanjo, Y., and Furukawa, K. (2010). Comparative proteomics analysis of differentially expressed proteins in soybean cell wall during flooding stress. Amino Acids 39, 1435–1449.
Komatsu, S., Wada, T., Abaléa, Y., Nouri, M. Z., Nanjo, Y., Nakayama, N., Shimamura, S., Yamamoto, R., Nakamura, T., and Furukawa, K. (2009). Analysis of plasma membrane proteome in soybean and application to flooding stress response. J. Proteome Res. 8, 4487–4499.
Komatsu, S., Yamamoto, A., Nakamura, T., Nouri, M. Z., Nanjo, Y., Nishizawa, K., and Furukawa, K. (2011). Comprehensive analysis of mitochondria in roots and hypocotyls of soybean under flooding stress using proteomics and metabolomics techniques. J. Proteome Res. 10, 3993–4004.
Mohammadi, P. P., Moieni, A., Hiraga, S., and Komatsu, S. (2012). Organ-specific proteomic analysis of drought-stressed soybean seedlings. J. Proteomics 75, 1906–1923.
Mostaguir, K., Hoogland, C., Binz, P.-A., and Appel, R. D. (2003). The Make 2D-DB II package: conversion of federated two-dimensional gel electrophoresis databases into a relational format and interconnection of distributed databases. Proteomics 3, 1441–1444.
Sakata, K., Ohyanagi, H., Nobori, H., Nakamura, T., Hashiguchi, A., Nanjo, Y., Mikami, Y., Yunokawa, H., and Komatsu, S. (2009). Soybean proteome database: a data resource for plant differential omics. J. Proteome Res. 8, 3539–3548.
Saldanha, A. J. (2004). Java Treeview – extensible visualization of microarray data. Bioinformatics 20, 3246–3248.
Sato, S., Nakamura, Y., Kaneko, T., Asamizu, E., Kato, T., Nakao, M., Sasamoto, S., Watanabe, A., Ono, A., Kawashima, K., Fujishiro, T., Katoh, M., Kohara, M., Kishida, Y., Minami, C., Nakayama, S., Nakazaki, N., Shimizu, Y., Shinpo, S., Takahashi, C., Wada, T., Yamada, M., Ohmido, N., Hayashi, M., Fukui, K., Baba, T., Nakamichi, T., Mori, H., and Tabata, S. (2008). Genome structure of the legume, Lotus japonicus. DNA Res. 15, 227–239.
Schmutz, J., Cannon, S. B., Schlueter, J., Ma, J., Mitros, T., Nelson, W., Hyten, D. L., Song, Q., Thelen, J. J., Cheng, J., Xu, D., Hellsten, U., May, G. D., Yu, Y., Sakurai, T., Umezawa, T., Bhattacharyya, M. K., Sandhu, D., Valliyodan, B., Lindquist, E., Peto, M., Grant, D., Shu, S., Goodstein, D., Barry, K., Futrell-Griggs, M., Abernathy, B., Du, J., Tian, Z., Zhu, L., Gill, N., Joshi, T., Libault, M., Sethuraman, A., Zhang, X. C., Shinozaki, K., Nguyen, H. T., Wing, R. A., Cregan, P., Specht, J., Grimwood, J., Rokhsar, D., Stacey, G., Shoemaker, R. C., and Jackson, S. A. (2010). Genome sequence of the palaeopolyploid soybean. Nature 463, 178–183.
Sobhanian, H., Razavizadeh, R., Nanjo, Y., Ehsanpour, A. A., Jazii, F. R., Motamed, N., and Komatsu, S. (2010). Proteome analysis of soybean leaves, hypocotyls and roots under salt stress. Proteome Sci. 8, 19.
Young, N. D., Debellé, F., Oldroyd, G. E., Geurts, R., Cannon, S. B., Udvardi, M. K., Benedito, V. A., Mayer, K. F., Gouzy, J., Schoof, H., Van de Peer, Y., Proost, S., Cook, D. R., Meyers, B. C., Spannagl, M., Cheung, F., De Mita, S., Krishnakumar, V., Gundlach, H., Zhou, S., Mudge, J., Bharti, A. K., Murray, J. D., Naoumkina, M. A., Rosen, B., Silverstein, K. A., Tang, H., Rombauts, S., Zhao, P. X., Zhou, P., Barbe, V., Bardou, P., Bechner, M., Bellec, A., Berger, A., Bergès, H., Bidwell, S., Bisseling, T., Choisne, N., Couloux, A., Denny, R., Deshpande, S., Dai, X., Doyle, J. J., Dudez, A. M., Farmer, A. D., Fouteau, S., Franken, C., Gibelin, C., Gish, J., Goldstein, S., González, A. J., Green, P. J., Hallab, A., Hartog, M., Hua, A., Humphray, S. J., Jeong, D. H., Jing, Y., Jöcker, A., Kenton, S. M., Kim, D. J., Klee, K., Lai, H., Lang, C., Lin, S., Macmil, S. L., Magdelenat, G., Matthews, L., McCorrison, J., Monaghan, E. L., Mun, J. H., Najar, F. Z., Nicholson, C., Noirot, C., O’Bleness, M., Paule, C. R., Poulain, J., Prion, F., Qin, B., Qu, C., Retzel, E. F., Riddle, C., Sallet, E., Samain, S., Samson, N., Sanders, I., Saurat, O., Scarpelli, C., Schiex, T., Segurens, B., Severin, A. J., Sherrier, D. J., Shi, R., Sims, S., Singer, S. R., Sinharoy, S., Sterck, L., Viollet, A., Wang, B. B., Wang, K., Wang, M., Wang, X., Warfsmann, J., Weissenbach, J., White, D. D., White, J. D., Wiley, G. B., Wincker, P., Xing, Y., Yang, L., Yao, Z., Ying, F., Zhai, J., Zhou, L., Zuber, A., Dénarié, J., Dixon, R. A., May, G. D., Schwartz, D. C., Rogers, J., Quétier, F., Town, C. D., and Roe, B. A. (2011). The Medicago genome provides insight into the evolution of rhizobial symbioses. Nature 480, 520–524.
Keywords: soybean, Glycine max cv. Enrei, database, proteomics, 2-DE (two-dimensional polyacrylamide gels electrophoresis), gel-free proteomics technique
Citation: Ohyanagi H, Sakata K and Komatsu S (2012) Soybean Proteome Database 2012: update on the comprehensive data repository for soybean proteomics. Front. Plant Sci. 3:110. doi:10.3389/fpls.2012.00110
Received: 29 March 2012; Accepted: 07 May 2012;
Published online: 30 May 2012.
Edited by:
Joshua L. Heazlewood, Lawrence Berkeley National Laboratory, USAReviewed by:
Martin Hajduch, Slovak Academy of Sciences, SlovakiaShaobai Huang, The University of Western Australia, Australia
Copyright: © 2012 Ohyanagi, Sakata and Komatsu. This is an open-access article distributed under the terms of the Creative Commons Attribution Non Commercial License, which permits non-commercial use, distribution, and reproduction in other forums, provided the original authors and source are credited.
*Correspondence: Setsuko Komatsu, National Institute of Crop Science, National Agriculture and Food Research Organization, Tsukuba 305-8518, Japan. e-mail: skomatsu@affrc.go.jp