 Jin Chen1,2* Sylvie Lalonde1 Petr Obrdlik3 Azam Noorani Vatani1 Saman A. Parsa1 Cristina Vilarino4 Jose Luis Revuelta4 Wolf B. Frommer1 Seung Y. Rhee1*
- 1 Department of Plant Biology, Carnegie Institution for Science, Stanford, CA, USA
- 2 MSU-DOE Plant Research Laboratory, Computer Science and Engineering Department, Michigan State University, East Lansing, MI, USA
- 3 IonGate Biosciences GmbH, Frankfurt, Germany
- 4 Departamento de Microbiología y Genética, Instituto de Biología Funcional y Genomica, Universidad de Salamanca-Consejo Superior de Investigaciones Científicas, Salamanca, Spain
High-throughput data are a double-edged sword; for the benefit of large amount of data, there is an associated cost of noise. To increase reliability and scalability of high-throughput protein interaction data generation, we tested the efficacy of classification to enrich potential protein–protein interactions. We applied this method to identify interactions among Arabidopsis membrane proteins enriched in transporters. We validated our method with multiple retests. Classification improved the quality of the ensuing interaction network and was effective in reducing the search space and increasing true positive rate. The final network of 541 interactions among 239 proteins (of which 179 are transporters) is the first protein interaction network enriched in membrane transporters reported for any organism. This network has similar topological attributes to other published protein interaction networks. It also extends and fills gaps in currently available biological networks in plants and allows building a number of hypotheses about processes and mechanisms involving signal-transduction and transport systems.
Introduction
Membrane proteins play an essential role in fundamental biological processes including signaling, homeostasis, nutrient acquisition, and metabolism. Despite their importance, we know little about the functions of most membrane proteins. For example, transporters constitute a large functional class in any organism, making up ∼4% of eukaryotic and ∼9% of prokaryotic genomes on average (Ren and Paulsen, 2005). Furthermore, genes known to cause disease in human are enriched in transporters. Over 9% of characterized disease genes are transporters (Jimenez-Sanchez et al., 2001) whereas only 3% of the human genome are annotated as transporters (Ren et al., 2007; p-value <0.0001, Chi-square test with Yates correction). However, we know the functions of only a small portion of predicted transporters. For example, in Arabidopsis, over 1200 proteins have been classified as transporters (Ren et al., 2007), but only 267 transporters have been characterized experimentally (Lamesch et al., 2012). It has been difficult to systematically elucidate the function of transport systems using traditional genetic and biochemical approaches (Barbier-Brygoo et al., 2001). Identifying physical partners of transporters could provide a framework from which to generate strategies and test hypotheses relating to the function, mechanism, and regulation of transport systems.
Yeast two hybrid (Y2H) systems have been used successfully to identify interactions between soluble proteins in plants (Arabidopsis Interactome Mapping Consortium, 2011; Mukhtar et al., 2011). To systematically elucidate a map of membrane protein interactions, mating-based split ubiquitin system (mbSUS) was developed (Obrdlik et al., 2004; Miller et al., 2005). The split ubiquitin system is similar to the classical Y2H as it uses yeast as a heterologous system and has a similar read-out, but it specifically allows the detection of interactions of full-length membrane proteins. The concept of mbSUS relies on the release of a transcription factor (TF) from a membrane protein if it interacts with another membrane (or soluble) protein. Similar to other detection systems based on the reconstitution of two halves of a protein, mbSUS uses a ubiquitin split into two halves: The N-terminal domain of ubiquitin (Nub) can reconstitute a functional ubiquitin when co-expressed with its other, C-terminal half (Cub; Johnsson and Varshavsky, 1994). Nub mutants such as NubG with a reduced affinity to Cub reconstitute the full-length ubiquitin only when brought into vicinity via interaction between two fusion partners. The use of a mutated Nub and Cub to test for physical interaction between two fused proteins is the basis of mbSUS.
The mbSUS has been used successfully to analyze interactions among 705 integral membrane proteins in yeast in 2005 (Miller et al., 2005). Plant mbSUS was developed and used to test interactions of translocon complex at the outer chloroplast membrane (Rahim et al., 2009). Recently, mbSUS was successfully used to screen for potential interactions among 490 Arabidopsis membrane and signaling proteins (Lalonde et al., 2010). However, the currently available membrane interaction networks for Arabidopsis covers only a small portion of the genome.
The sheer number of interactions to test and a high level of noise hamper the generation of genome-wide physical interaction networks. For Arabidopsis, given its full set of 8000 membrane proteins (Lalonde et al., 2010), we have to test about 32 million pairs to identify the genome-wide membrane interaction network. In addition, previous studies indicate that physical interaction networks across all genomes are sparse (August and Papachristodoulou, 2009) and that the number of interactions grows linearly as the number of proteins grows in a network (Streinu and Theran, 2009). These facts suggest that if interactions among all possible pairs are tested, most of the tests should result in negative interactions.
Similar to the interaction networks reconstructed with other high-throughput techniques, mbSUS-based interaction networks also have high levels of background noise (Fields, 2005; Vlasblom and Wodak, 2009). To improve the quality of the network, several strategies have been used to eliminate false positives. First, expression of the Cub-PLV (protA-LexA-VP16 peptide) fusion can be fine-tuned by using a methionine-repressible promoter and titrated using different methionine concentrations in the medium. Second, 3-aminotriazole or Nub affinity mutants (Raquet et al., 2001) can be used to optimize the selection conditions for eliminating auto-activators and clones showing high expression. Third, the information content of mbSUS screens could be improved by determining growth curves quantitatively by measuring optical density of the cultures. While the output may not necessarily reflect the kinetics of the underlying interaction, the quantitative data may help reduce artifacts and improve standardization over multiple assays performed over the data collection period (Lalonde et al., 2008).
The large number of assays that need to be performed to determine the whole complement of potential protein interactions constrains the scalability of mbSUS. In this paper, we present a system that combines computational and empirical approaches to efficiently detect high quality Arabidopsis membrane interactions by minimizing the overall search space initially, followed by maximizing the number of interaction assays.
To minimize the search space, we used classification models to remove those interactions that are likely to be false positive. Classification models, such as Bayesian networks, have been applied successfully to predict genome-wide protein–protein interactions (Jansen et al., 2003). In a classification model, functional features are weighted and combined. At given levels of sensitivity, classification predictions could be even more accurate than the existing high-throughput experimental data sets (Jansen et al., 2003). However, classification models often suffer from noisy training data (Bi and Zhang, 2004). Therefore, we used an ensemble of four types of classification models (decision tree, logistic regression, Bayesian network, and support vector machine, SVM) to identify false positives and leave all the potentially true positive interactions to a more rigorous interaction testing. For the decision tree model, we used AD-tree (Freund and Mason, 1999), which combines decision trees with boosting that generates classification rules that are usually smaller in size and thus easier to interpret. These classification rules yield a natural measure of classification confidence, which can be used to improve the accuracy. Logistic regression (le Cessie and van Houwelingen, 1992) is a statistical model for predicting the probability of occurrence of an event by fitting data to a logistic curve. It is a generalized linear model used for binomial regression and is used extensively in the biological sciences. Bayesian network learning has various search algorithms and quality measures. We used K2 (Cooper and Dietterich, 1992), which uses a Bayesian score to rank different structures and a greedy search algorithm to maximize the score. Finally, SVM (Cortes and Vapnik, 1995) is a set of supervised learning methods that recognize patterns from data, and is used for classification and regression analysis. Intuitively, an SVM model is a representation of the training data as points in space, mapped in a way that the training data belonging to different categories are divided by a gap that is as wide as possible. Testing data are then mapped onto that same space and predicted to belong to a category based on which side of the gap they fall on. We used sequential minimal optimization (SMO), an algorithm for training an SVM classifier (Keerthi et al., 2001).
Our system has three steps (Figure 1). First, mbSUS is applied to all protein pairs using two replicates (PRIMARY-NET). In this step, most of the false positive and true negative interactions are filtered out using a statistical analysis. Second, classification methods are applied to detect and filter false positives from PRIMARY-NET, resulting in DRAFT-NET. Third, several assays of mbSUS are applied with multiple replicates under different conditions (in our study, 48 tests for each protein pair). This approach resulted in a high quality interaction network called FINAL-NET with 541 (532 unique) interactions between 239 proteins. Topological and functional network characteristics show that our method is promising in terms of scalability and accuracy.

Figure 1. Overall framework of our protein interaction assay system, which has three steps. (1) First mbSUS testing; (2) Bioinformatics to effectively remove false positive interactions; (3) Second mbSUS testing. PRIMARY-NET = statistically positive (FDR <0.05) interactions from step 1, GOLD-NET = high-confidence interactions from step 1, LIT-NET = literature-curated interactions, RAND PPIs = randomly selected interactions from non-significant interactions in step 1, DRAFT-NET = classified as positive from step 2, NEGATIVE = classified as negative from step 2, NOT-SIG = randomly selected interactions from step 1 that were retested in step 3, FINAL-NET = tested positive in step 3.
Materials and Methods
First mbSUS Interaction Assays
Strains and vectors
We used the following yeast strains and pSUgate vectors, which have been described previously (Obrdlik et al., 2004): THY.AP4 (MATa ura3 leu2 lexA::lacZ::trp1 lexA::HIS3 lexA::ADE2) and THY.AP5 (MATα URA3 leu2 trp1 his3 loxP::ade2), and the pSUgate vectors pMetYCgate, pXNgate21, pNXgate32, and pNubWT-2. The materials are available from the Arabidopsis Biological Resource Center1.
Cloning into pSUgate vectors and interaction screens
Arabidopsis open reading frames (ORFs; Table S1 in Supplementary Material) were amplified from the first strand DNA with TripleMaster DNA polymerase using gene specific primers (acaagtttgtacaaaaaagcaggctctccaaccaccATGX19-25-5′ ORF) and (tccgccaccaccaaccactttgtacaagaaagctgggtaX19-25-3′ strand ORF without stop). Purified PCR products were cloned by in vivo recombination in yeast (Fusco et al., 1999). For NubG fusions, pXNgate21 was cleaved with EcoRI/SmaI and used for co-transformation of THY.AP5 with the PCR products encoding the ORFs. Transformation was performed in microplates. Transformants were selected on synthetic complete media (SC) lacking tryptophan (Trp) and uracil (Ura). For Cub-PLV-fusions pMetYCgate was cleaved with PstI/HindIII and used for co-transformation of THY.AP4 with the PCR products encoding the ORFs. Transformants were selected on SC lacking leucine (Leu). Several clones from each THY.AP5 and THY.AP4 transformation were incubated in appropriate SC media with or without G418. Stationary cultures that grew without G418 were harvested, their plasmids isolated and amplified in E. coli DH10, and their inserts sequence-verified. Clones from each THY.AP5 and THY.AP4 transformation were mixed, and these pools were incubated in appropriate SC media with or without G418. Stationary cultures that grew without G418 were used for subsequent interaction assays.
Microplate-based screening for interaction
To assay the interactions between NubG-fusion and Cub-PLV-fusion proteins, we used a mating–based screening assay. The NubG library, comprising 412 constructs, was arrayed in five 96-well microtiter plates filled with liquid SC-trp medium (130 μl/well) using an automatic microplate dispenser (QFill2, Genetix, Boston, MA, USA). Positive (pNubWT-2 yeast transformant), negative (empty NubG vector yeast transformant), and blank (no yeast cells) controls were also included at selected wells in the arrayed library. After 2-days of growth at 28°C, the NubG library was pinned onto solid YPD OmniTray plates (Nunc, Rochester, NY, USA) in a 96-spot format using a 96-pin replicator and OmniTray copier (Nunc, Rochester, NY, USA). Each of the 147 MetYCub constructs to be assayed was grown individually in 10 ml of SC-leu liquid media for 2 days at 28°C, poured on an OmniTray plate and pinned onto the YPD Omnitray plates containing the spotted NubG library to allow the formation of diploids between each of the clones of the NubG library (mating type alpha) and the individual MetYCub clone (mating type a). After 10–12 h of growth, the YPD Omnitray plates were first replica-pinned to sterile water-filled 96-well microtiter plates and then replicated to SC-leu-ura-trp 96-well microtiter plates to select the diploids.
Interactions among protein pairs in the diploids were initially monitored by measuring the ability to grow in SC medium lacking histidine as a consequence of induction of the HIS3 reporter. The diploid library was tested in duplicate containing 0 or 250 μM methionine to modulate the expression of the Cub-ORF fusion protein. Growth rates were quantitatively determined for each of the diploids by measuring the OD595 after 3, 4, and 5 days of incubation using a microplate reader (Bio-Rad model 550, Hercules, CA, USA). After the statistical analysis of the growth curves, diploids that showed an OD595 >0.2 after 3, 4, or 5 days of incubation were considered as positive interaction pairs and selected for further analyses.
Statistical Determination of False Positive Protein Interaction
Optical density values were normalized within in each plate, and for each Nub clone across the plates. The median and inter-quartile range of the optical density were taken as a robust measure of the average and dispersion, respectively. These were used to calculate z-scores, and raw p-values were obtained from the standard normal distribution. For each protein pair under each methionine treatment, a false discovery rate (FDR) value that took into account all of the 52310 concurrent hypotheses was then calculated using the Bonferroni correction (Strassburger and Bretz, 2008). Interaction pairs with FDR values of less than 0.05 were selected for the PRIMARY-NET.
Typically an FDR threshold of 0.05 is used to identify positive interactions in high-throughput interaction studies (Verhoeven et al., 2005; Hesselberth et al., 2009). However, with this classical yet arbitrary threshold, PRIMARY-NET might still have significant numbers of false positives (∼100). The edge-node ratio (5.13) is significantly higher than any known interaction networks, e.g., Saccharomyces cerevisiae (3.26), Drosophila melanogaster (3.08), and Caenorhabditis elegans (1.54; data obtained from BIND; Bader et al., 2003), suggesting that the false positives in the data might affect the topology of the network. Therefore, we reasoned that a more stringent FDR threshold should be applied to filter out more false positive interactions.
To determine the FDR threshold that maximally separates true and false positive interactions, we defined a reference network called REF-NET that is more reliable than PRIMARY-NET as follows. First, we reasoned that REF-NET should be much smaller than PRIMARY-NET. We defined an interaction with FDR values smaller than 0.05 under both high and low methionine conditions to belong to REF-NET. After determining the REF-NET, we gradually reduced the FDR thresholds from 0.05 to 0 for both REF-NET and PRIMARY-NET until their rates of reduction in the number of interactions became indistinguishable. We reasoned that with the decreasing FDR threshold, if the two networks had similar false positive rates, their rates of reduction in the total number of interactions should also be similar. The largest FDR value at which the rates first became indistinguishable was chosen as the FDR threshold. Figure S1 in Supplementary Material shows that from FDR value 10−4 the network sizes started to change similarly. Therefore, by setting the FDR threshold at 10−4, we split PRIMARY-NET to SIG-NET (significant network) and NSE-NET (non-significant network). We then applied different strategies on SIG-NET and NSE-NET to further detect false positive interactions using classification models.
Classification Models
Generation of training sets
To train a classification model, we used a set of training data that included known interactions (positive training data) and a set of protein pairs that are not likely to physically interact (negative training data). To compose the positive training data, we first included 1831 interactions between 1048 Arabidopsis proteins curated from the literature, BIND (Bader et al., 2003), and IntAct (Kerrien et al., 2007) databases (Table S2 in Supplementary Material). Since most of the curated interactions were found to occur between soluble proteins, we also added 97 interactions detected in the first mbSUS with FDR values smaller than 10−8 and were positive in both methionine concentrations (all 4 tests) to the positive training set (GOLD-NET, Table S3 in Supplementary Material). We randomly sampled 10 interactions for individual tests and treated the rest 87 interactions as part of positive training data. In summary, we composed the positive training set with 1831 interactions from the literature and 97 interactions from the first mbSUS. We cross-validated the models using 10 randomly sampled interactions from GOLD-NET. The negative training set was composed of randomly selected pairs between the 412 Nubs and 147 Cubs that were tested, and whose FDR values were greater than or equal to 0.05. A total of 100 independent negative training sets were generated, in which each set had the same number of interactions as the positive training set.
Feature collection and selection
Based on the guilt-by-association rule, an interaction is likely if both of the proteins are involved in the same biological process, and an interaction is unlikely if the proteins are involved in different processes. Hence we collected biological characteristics of the proteins to compose the feature space of the classification models. First, topology analysis of protein interaction networks shows that true interactions fit the pattern of a small-world network while false interactions are distributed randomly in the network (Bork et al., 2004). Therefore, we reasoned that the local cohesiveness for each interaction could be used to distinguish true and false positive interactions. We used topological measures that determine overlap between two sets of data in our classification model. Given a protein interaction interaction (a, b) with proteins a and b, let A be the set of neighbors of protein a and B be the set of neighbors of protein b. We then calculated the overlap between A and B using the above topological measures. Interaction (a, b) was deemed more likely if A and B had a higher overlap. We used several overlap measures in this study: Jaccard index, meet/min, geometric, hyper-geometric, and Czekanowski–Dice distance (Brun et al., 2003; Tan et al., 2005). The first four measures determine the extent of overlap between two data sets whereas Czekanowski–Dice distance tests the dissimilarity between two sets.
Second, various kinds of biological features of protein interactions were collected, including domain–domain interaction from DIMA (Pagel et al., 2006), similarity scores based on Gene Ontology (GO; Ashburner et al., 2000) function annotation, GO process annotation and Plant Ontology (PO) annotation (Avraham et al., 2008), gene expression correlation in 36 separate experiments from TAIR (Lamesch et al., 2012)2, and overall gene expression correlation from ATTED II database (Obayashi et al., 2009). We used the overall mutual rank (MR) and Pearson’s correlation scores from ATTED II as two of the 48 features. These scores were computed by ATTED II based on 1388 microarray data collected from several repositories, including ArrayExpress, Gene Expression Omnibus (GEO) and the Center for Information Biology Gene Expression Database (CIBEX; Obayashi and Kinoshita, 2010). Details about normalization and correlation performed at ATTED II can be found on their website3. Since many gene pairs with low correlation scores are functionally relevant (Obayashi et al., 2009), we used all of the correlation values for the training and testing of the classification models without setting a specific threshold.
In total, 48 features were collected. We evaluated each feature by considering its predictive ability, along with the degree of redundancy between them. Domain–domain interaction was the most important feature, followed by the similarity scores based on GO function and process annotations, and the topological feature using Czekanowski–Dice distance (Table S4 in Supplementary Material). PO annotation similarity was not critical to the classification due to too many missing values.
Classification Models
We adopted data mining software Weka (Hall et al., 2009) to apply classifiers to our data. To select the most appropriate classification model, we tested 12 different types of classification models belonging to four different categories and adopted meta-classification methods (including bagging and boosting) to further improve their performance (Table S5 in Supplementary Material). These four categories are decision tree or decision rule, logistic regression, SVM, and Bayesian network implemented in Weka (Hall et al., 2009). To evaluate classification performance, we adopted the biased F-measure (Li et al., 2008). In our study, b (the bias parameter) was set to 0.5 to emphasize the importance of precision.
We tested performance of each model by adjusting each model’s parameters with cross-validation and then further optimizing each model by boosting and bagging (Breiman, 1996; Freund and Schapire, 1996). Since the best model in each category had similar performance, rather than adopting one model that had the best performance (Table S5 in Supplementary Material), we set up a voting system using the best classifiers in each of the categories. The models that were included in the voting are: boosted AD-tree (Keerthi et al., 2001), boosted logistic (le Cessie and van Houwelingen, 1992), bagged BayesNet (Hall et al., 2009), SMO with puk kernel (Keerthi et al., 2001), and LibSVM with RBF kernel (Chang and Lin, 2011). Two SVM models were used since SVM is particularly suitable for high dimensional data. For boosted AD-tree, we only used the top four features by considering predictability of each feature along with the degree of redundancy between them, because tree-based models can easily be over-fitted if there are too many features. For the other classification models, we used all the features.
From the 1949 interactions in the PRIMARY-NET, 826 were classified as potential positive interactions and were selected as DRAFT-NET.
Second mbSUS Interaction Assays
Conditions and interaction assays
In the second mbSUS, we tested all 826 interactions from DRAFT-NET, a randomly selected set of 363 interactions that were classified as negative, and a randomly selected set of 347 interactions that were statistically negative. Each clone was re-verified for insert identity by growing the yeast cells at 28°C overnight, extracting the plasmid, and sequencing the inserts using standard protocols. Confirmed clones were grown in 96-well plates and were re-arrayed into 16 96-well plates for interaction assays using a BioRobot 3000 (Qiagen). These interaction pairs were replica-plated using a colony replicator (Singer RoTor HDA) and tested at three methionine concentrations (0, 150, and 500 μM). We determined the optical density values of two reporter genes LacZ (blue versus white colonies) and HIS3 (growth versus no growth) as previously described (Lalonde et al., 2010). Each experiment was repeated eight times (four times per plate and two plates). In total, each interaction was tested 48 times (2 types of assays × 3 methionine concentrations × 8 replicates).
Interaction data processing and statistical analysis
Images of the interaction plates were scanned using a flatbed scanner (CanoScan 8400F, Canon) and the intensity of the colony growth was quantified using GenePix v6.1 software (Molecular Devices, Sunnyvale, CA, USA) after converting the images to black and white as described previously (Lalonde et al., 2010). For a given protein pair, we obtained medians and inter-quartile ranges from its 48 mbSUS colony growth intensities with GenePix. The inter-quartile range is calculated by integrating the probability density function of a continuous distribution. These values were used to normalize the optical density values of the colonies.
We tested each interaction pair four times on the same plate (placed randomly) and two plates at each methionine concentration. We found that variation of the intensities of the colonies among the replicated interaction pairs came mainly from errors in the image processing by GenePix. Specifically, a strong interaction pair with a large interaction colony tended to occupy extra space in the plate, causing reduced space for an adjacent colony to grow, or worse, the two adjacent colonies could merge and be treated as one colony by GenePix. However, the probability is low for all the four colonies of the same interaction pair on the same plate to be adjacent to a large neighbor. Based on this observation, we set up an iterative process to remove such noise as follows. First, we computed mean and coefficient of variation (CV) values for each interaction from the optical density values among all the biological replicates. Most of the interactions had CV of less than 0.4 (Figures S2 and S3 in Supplementary Material). For these interactions with low CV, the mean values were saved as interaction likelihood values. Otherwise, we repeatedly removed an optical density value that was most distant from the mean and recomputed CV based on the updated mean and standard deviation. The process stopped when the new CV was below the threshold or there were only two optical density values left.
Distribution of the interaction likelihood values was bimodal for all three methionine treatments with a clear separation between the modes as expected (Figure S4 in Supplementary Material). For a bimodal distribution, to separate positive colonies from the background, negative colonies, we determined the threshold between the two peaks with the following k-means likelihood method (Choi et al., 2004). First, we chose a threshold randomly that separated the dataset into two non-empty parts. Second, we computed the centers of the two parts, which were the two center points with mean values on each side. Third, we updated the threshold to be the value that had the same distance from the two center points. Finally, we iterated the steps until the algorithm converged. The thresholds we used for different assays are listed in Table S6 in Supplementary Material. Only the colonies with optical density values greater than the threshold (labeled as 1) were labeled as true interactions and the rests were labeled as false interactions (labeled as −1 or 0).
Finally, we employed a voting system to integrate the likelihood values of each interaction under all conditions to construct the final interaction network. We considered an interaction to be strong if the tests for interaction in both 500 μM and at least one 150 μM methionine concentrations were positive. We considered an interaction to be weak if the tests in only the 0 μM methionine were positive. Finally we considered an interaction to be likely if at least one test was positive and the other tests were not negative. Most of the interactions were identified as strong (214) or weak (252); only 75 interactions were called as likely. In total, 541 interactions were labeled as positive (in which 532 interactions are unique), 887 interactions were labeled as negative, and 108 interactions were labeled as unknown by a vote of all the experiments.
Topological and Functional Characterization of the Network
All topological analyses including the distributions of degree, clustering coefficient, shortest path length, and neighborhood connectivity were conducted using Cytoscape (2.8.2; Smoot et al., 2011) and its NetworkAnalyzer plug-in (Smoot et al., 2011). Gene Ontology (GO) enrichment analysis was performed using agriGO (Du et al., 2010). GO enrichment visualization was performed using REVIGO (Supek et al., 2011). To determine whether the pairs in the final network were more functionally similar than by chance, GO annotation and co-expression data were downloaded from TAIR (Lamesch et al., 2012) and ATTED II (Obayashi et al., 2009). To compare the similarities to random networks, we randomized the nodes 100 times. To find enriched network motifs in a network that combines physical interactions and co-function, we combined AraNet (Lee et al., 2010) and PAIR (Lin et al., 2011) with our network. We used FANMOD (Wernicke and Rasche, 2006) to detect enriched motifs and MAVisto (Schreiber and Schwobbermeyer, 2005) to visualize the genes with the motifs. Transporter family analysis was carried out using family annotations from TransportDB (Ren et al., 2007).
Results
We developed a system to effectively identify a high quality membrane interaction network among 414 Arabidopsis membrane and signaling proteins. Our procedure has three steps: (i) testing mbSUS on all possible protein pairs with a few replicates; (ii) applying statistical and data mining models to remove interactions that are likely to be false positive; and (iii) retesting mbSUS on the candidate interactions with multiple replicates and assays for false positive detection.
First mbSUS-Based Protein Interaction Assay
In the first run of mbSUS, we tested 412 Nub fusion proteins against 147 Cub fusion proteins for interaction in duplicate at 0 or 250 μM methionine, resulting in 52310 putative interactions (Table S7 in Supplementary Material). Of these, 145 proteins were tested both as Nub and Cub clones, 267 as Nub clones only, and 2 protein as Cub clone only. There were fewer Cub than Nub clones because fusion of the TF to the Cub domain for marker detection precludes soluble proteins to be fused with the Cub domain. In addition, Cub fusion proteins were removed from being tested for interaction if they gave reporter activation in the absence of an interaction partner. The 414 proteins we tested for interaction were enriched in transport and signaling proteins; 340 are membrane proteins and 315 are involved in transport. These proteins are involved in diverse processes including metabolism (27%), protein modification (9%), response to abiotic or biotic stimulus (26%), signal-transduction (14%), and development (12%; Table S8 in Supplementary Material).
To identify both strong and weak interactions, two methionine concentrations were applied to control the expression level of the fusion proteins. One of the two constructs, the Cub fusions, uses a methionine-repressible MET25 promoter. At high (e.g., 250 μM) methionine concentrations, the expression of the genes is reduced, favoring the detection of stronger interactions. Decreasing the amount of methionine in the media increases the expression level and decreases the stringency; allowing weaker interactions to be detected.
We took the normalized optical density values for each interaction as a measure of the significance of interaction. We calculated an FDR for each protein pair tested under each methionine concentration using the Bonferroni correction (Strassburger and Bretz, 2008; Table S7 in Supplementary Material). We removed the interactions whose FDR values ≥0.05 under both high and low methionine treatments. In addition, we removed 21 sticky proteins that interacted with most proteins (Table S9 in Supplementary Material). In total, 50361 (96.3%) interactions were removed. We also removed 13 proteins that did not interact with any protein (Table S9 in Supplementary Material). The remaining 1949 interactions were between 380 proteins. We called this network PRIMARY-NET (Figure 1; Table S10 in Supplementary Material).
Computational Prediction of False Positive Protein Interaction
We employed a voting system from the best performing classification models to further remove false positive interactions in both networks. The PRIMARY-NET interactions were divided into two datasets based on the FDR values: SIG-NET (FDR <10−4) and NSE-NET (0.05 > FDR > 10−4). SIG-NET had 931 interactions and NSE-NET 1018 interactions (Tables S11 and S12 in Supplementary Material). Because SIG-NET was more reliable than NSE-NET based on the statistical analysis, we employed a more stringent rule for detecting false positives in SIG-NET where an interaction was classified to be false positive if all the classifiers predicted it to be false positive. Otherwise, the interaction was subjected to the second run of mbSUS. In NSE-NET, since it was considered less reliable than SIG-NET, we marked an interaction as false positive if four out of five classifiers predicted it to be false positive.
We obtained 826 interactions (524 and 302 interactions from SIG-NET and NSE-NET) that were classified as positive (DRAFT-NET) and 1123 interactions that were classified as negative (NEGATIVE; Figure 1). We tested the classification model by randomly hiding 10 interactions from the GOLD-NET and predicting their labels with our model. Eight out of 10 were predicted to be true by at least four classifiers, the other two were predicted to be true by 2–3 classifiers.
Second mbSUS Protein Interaction Assay
In order to test the performance of the statistical and classification methods and to derive a more accurate protein interaction map, we tested three types of interaction data from the previous run in the second mbSUS assay: (i) 826 interactions that were tested positive from both the statistical and classification tests (DRAFT-NET in Figure 1); (ii) 363 interactions that were statistically significant but were classified to be false positive by our classification models (a random subset of NEGATIVE in Figure 1); and (iii) 347 interactions from RAW-NET that were not statistically significant (FDR values were greater than but close to 0.05). In total, we tested 1536 interactions in the second run of mbSUS. Since the number of interactions is much smaller than the first run (52310), it was possible to apply multiple biological replicates and test them under several methionine concentrations.
We obtained the FINAL-NET with 541 (532 unique) interactions between 239 proteins (Table S13 in Supplementary Material). This network contained 214 strong interactions (positive in both 500 μM methionine and at least one 150 μM methionine conditions), 252 weak interactions (positive only in both 0 μM methionine condition) and 75 additional interactions that were positive in at least one condition and were classified as neither positive nor negative in the other conditions. The FINAL-NET is composed mainly of interactions that were statistically significant and classified as positive (402). In addition, the FINAL-NET contained 42 interactions that were statistically significant but classified as negative and 97 interactions that were statistically not significant (FDR near 0.05; Figure 2). There are 11 proteins shared by the interaction network described by Lalonde et al. (2010) and the FINAL-NET, but none of these 11 proteins interact with each other in either of the networks.
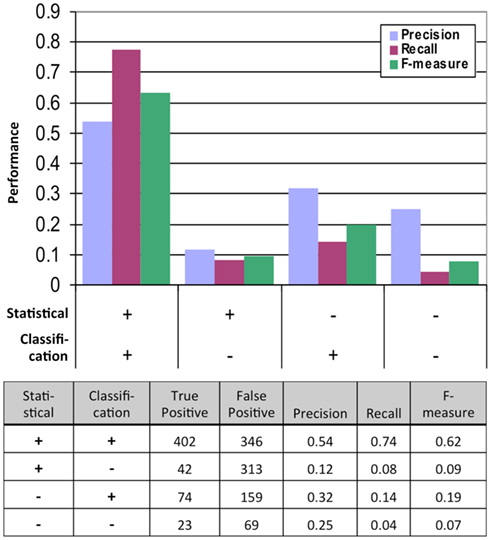
Figure 2. Performance of the statistical and classification methods measured by the results of the second, much more rigorous mbSUS assays. TP, true positive (positive in the second mbSUS) and FP, false positive (negative in the second mbSUS).
Performance of Classification
We tested the performance of our system by analyzing the data from the second mbSUS assays (Figure 2). We found that the interactions that were positive from both the statistical and classification tests were enriched in positives and depleted in negatives in the second run compared to those that were tested positive in either models or neither of the models. Logistic regression of true positive rate on FDR values from the statistical test also showed that the statistical test alone was not sufficient to predict positives (p-value = 0.0527, Figure S5 in Supplementary Material). Incorporating classification increased precision significantly (p-value <0.0001, Fisher’s exact test). In summary, classification, in addition to statistical test, increased the probability of detecting a positive interaction in the second mbSUS.
Performance of Final Network
To test the biological relevance of the final network, we examined the tendency of the interacting pairs to have similar annotations to GO terms or co-expression compared to randomized networks (100 randomizations). The interacting pairs in our network were more likely to be annotated to the same GO molecular function or cellular component terms than random expectation, and had significantly higher co-expression than random expectation (p-values <0.01, Wilcoxon signed-rank test, Figures 3A,B,D). The functional similarities based on GO biological process annotations were not significantly different from randomized network (p-value = 0.26, Wilcoxon signed-rank test, Figure 3C). The number of genes annotated to GO biological process was much smaller than those annotated to GO molecular function and cellular component terms, which could be a reason for the statistical insignificance. Overall, the assessment of functional similarity between interacting pairs showed that the network was enriched in pairs with biological coherence.
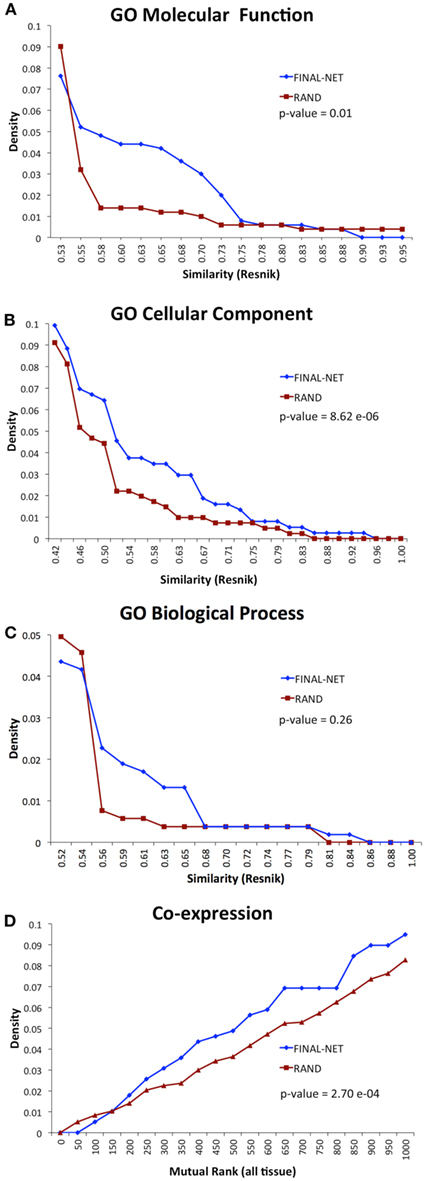
Figure 3. Functional similarity distribution of interaction pairs in our final network compared to an average of 100 randomized networks with the Resnik method (Resnik, 1995) by using GO molecular function annotations (A), GO cellular component annotations (B), GO biological process annotations (C), and gene co-expression from ATTED II (Obayashi et al., 2009) (D).
Topological Characteristics of the Network
The final network of 532 unique interactions among 239 proteins shows topological properties that are consistent with published interaction networks (Figure 4; Yamada and Bork, 2009). First, the network has a degree distribution in which most proteins interact with few other proteins and a few proteins interact with many others (hubs), similar to previously published biological networks (Yamada and Bork, 2009). However, when the degrees of the Nub-proteins and Cub-proteins were examined separately, all of the hubs with degrees greater than 20 were in the Cub-proteins (Figure 4A). It is possible that interactions with these Cub-protein hubs may be non-specific biologically. Therefore, we performed functional characterization on the network that excluded Cub-proteins with more than 20 interactions. This sub-network consisted of 227 interactions among 145 proteins (Table S14 in Supplementary Material). All of the degree distributions fitted a power-law (p-values = 0.253 (all proteins), 0.246 (Nubs only), 0.182 (Cubs only), goodness of fit tests based on the Kolmogorov–Smirnov statistic, 1000 randomizations; Clauset et al., 2009).
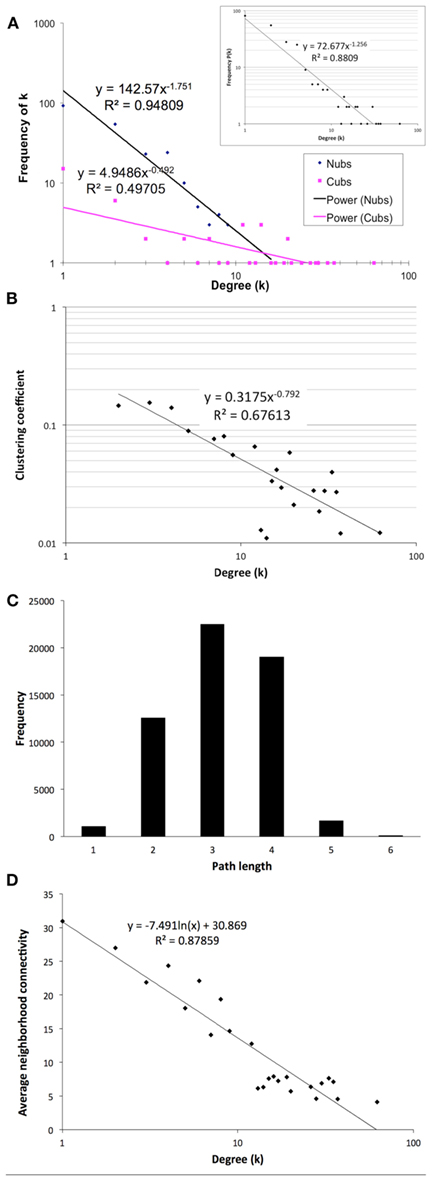
Figure 4. Topological characteristics of our final network as measured by degree distributions of the Nub (blue diamonds) and Cub (pink squares) proteins in the final network (A) or total proteins [(A) inset], clustering coefficients as a function of degree suggesting a hierarchically modular structure (B), distribution of path lengths (C), and average neighborhood connectivity as a function of degree showing a disassortative network (D).
Second, the network has a diameter (longest shortest path between any two proteins) of 6 and an average path length of 3.14 with an average clustering coefficient of 0.079, indicating that it is a small-world network, like most published interaction networks (Barabasi and Oltvai, 2004; Arabidopsis Interactome Mapping Consortium, 2011; Figures 4B,C). Third, the average clustering coefficient decays logarithmically with increasing degree, suggesting a hierarchical organization of topological modules (Barabasi and Oltvai, 2004; Ravasz, 2009; Figure 4B). Finally, distribution of the neighborhood connectivity of a protein indicates that the neighborhood connectivities decrease as the number of neighbors increase (Figure 4D). This “opposites attract” pattern (called disassortativity) is commonly found in physical interaction networks (Yamada and Bork, 2009). In summary, our membrane protein interaction network has topological properties that are consistent with other published interaction networks.
Functional Characteristics of the Network
Because of the possible non-biological specificity of the Cub hubs (Figure 4A), we focused functional analysis on the sub-network that excludes the Cubs with more than 20 interactions. This network of 227 interactions among 145 proteins is enriched in proteins involved in transport, response to environmental signals, and cellular homeostasis (Tables S14 and S15 in Supplementary Material). Of the 145 proteins, 98 (68%) are annotated as transporters and 122 (84%) are annotated to membrane (TAIR4; Lamesch et al., 2012). In addition to the transporters, the network includes proteins that are likely to be involved in signal-transduction such as kinases, receptors, and G-proteins. Furthermore, the network includes proteins localized to other cellular components such as the cell plate, plasmodesma, and pollen tube.
To determine the extent of overlap between our network and other functional networks, we compared our network with two co-function networks of Arabidopsis, AraNet (Lee et al., 2010) and PAIR (Lin et al., 2011). Out of the 145 proteins in our network, 116 and 54 genes were found in AraNet and PAIR, respectively. There were 277 and 58 interactions among these proteins in AraNet and PAIR. However, only two interactions in AraNet and none in PAIR were found in our protein interaction network, underscoring the fact that these inferred co-function networks are devoid of membrane protein interaction data.
To determine to what extent our protein interaction network could expand existing knowledge and help infer new genetic relationships, we combined our network with the overlapping nodes and their interactions in AraNet and PAIR. The resulting union was more cohesive and dense than any of the individual networks (Figure 5). The union network generally reduced the number of disconnected components, network diameter, and average path length, while it increased the number of neighbors in average (Table S16 in Supplementary Material).
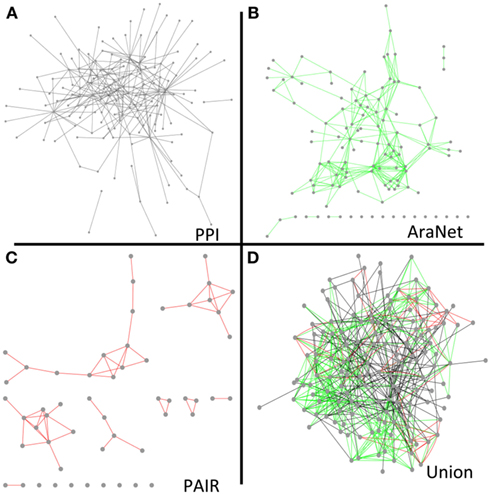
Figure 5. Network diagrams of our final protein interaction network (without the Cub hubs) (A), AraNet (Lee et al., 2010) co-function links (B), PAIR DB (Lin et al., 2011) co-function links (C), and a union of the protein interaction, AraNet, and PAIR DB links (D) visualized by Cytoscape.
Incorporating protein interaction data into genetic interaction networks have shown to increase the predictability of new genetic interactions in yeast (Wong et al., 2004). Particularly, three-node motifs with two genetic interaction links or one genetic interaction and one protein interaction links were highly predictable for the third link to have a non-additive genetic interaction. Therefore, we looked for enriched 3-node motifs and found that of the 16 possible motifs, 10 were significantly enriched in the network compared to randomized expectation (p-value <0.05). Of these, six included at least one physical interaction link that could predict a new genetic interaction linkage (Figure 6). In total, these enriched motifs predict 2804 new genetic interactions/co-functions.
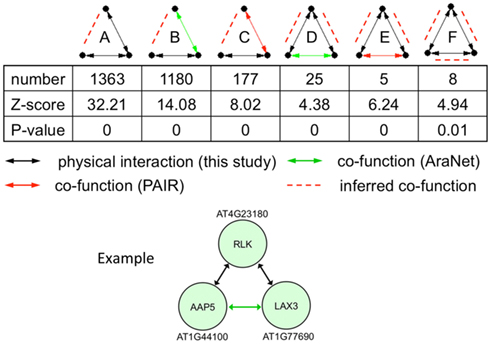
Figure 6. Statistically enriched three-node motifs in the union of the protein interaction (black line), AraNet (Lee et al., 2010; green line), and PAIR DB (Lin et al., 2011; red line) links. Potentially new genetic interactions are shown with red dashed lines. The example motif belongs to class D with two protein interactions and one genetic interaction.
We illustrate an example of inferring a potential new genetic interaction. AT4G23180, AT1G44100, and AT1G77690 form a three-node motif with two physical interactions and a co-function interaction (Figure 6). A receptor-like kinase (AT4G23180), which has been shown to be regulated by WRKY transcription factors upon salicylic acid treatment or bacterial infection (Du and Chen, 2000), physically interacts with a well-characterized amino acid transporter in the root (AT1G44100, AAP5) (Svennerstam et al., 2008) and another well-characterized auxin influx carrier LAX3 (AT1G77690) that promotes lateral root emergence (Vandenbussche et al., 2010). The two transporters have a co-function link based on domain co-occurrence in AraNet (Lee et al., 2010). Auxin-induced expression of LAX3 induces the expression of cell-wall-remodeling enzymes, which are likely to promote cell separation in advance of developing lateral root primordia. Two hypotheses can be made from this information: (i) the RLK (or its homolog) perceives a signal in the root that will activate the auxin influx carrier LAX3 and (ii) AAP5 is perhaps also involved in transporting auxin (or its precursor) into the cells.
Because our network is enriched in transporters, we analyzed patterns of interactions among members of transporter families to ask questions about mechanism and regulation of transport systems. For example, are members of a certain transporter family more likely to interact with members of another family? We used transporter annotations from TransportDB (Ren et al., 2007), which classifies 1278 Arabidopsis proteins into 75 families based on sequence similarities to known proteins in the Transporter Classification (TC) system (Saier et al., 2009). The 75 families are grouped as carriers (782 members or 61%), pumps (293 members or 23%), channels (150 members or 12%), or unclassified (53 members or 4%). Among these, 20 families were represented in our network. The carriers in our network were represented in a similar fraction as the genome (69 or 70%), while there was a depletion of pumps (8 or 8%) and unclassified (1 or 1%) and an enrichment of channels (20 or 20%). In addition to the transporters, the network includes 14 additional classes of proteins involved in signaling such as receptors, kinases, membrane fusion proteins, GTPases, and calmodulin (Table S17 in Supplementary Material).
Our network contained interactions between proteins belonging to 34 families of transporters and signaling protein classes (Table S18 in Supplementary Material). Among these, 24 family level interactions with at least two interactions between families were significantly enriched in the network than by random expectation (p-value <0.01, binomial distribution; Table S19 in Supplementary Material). These family level relationships may provide frameworks for building and testing new hypotheses. For example, there is an enriched interaction between MLOs and membrane fusion proteins (VAMP71 and VAMP72 members), a voltage-gated ion channel (CNGC18), and major facilitator superfamily members, implications of which are described in Section “Discussion.”
Discussion
Here we present a new hybrid (computational and empirical) method to efficiently detect Arabidopsis membrane protein–protein interactions by minimizing the search space for pair-wise interaction assays. Our process is built on three steps. First, mbSUS is applied to all the preselected genes with minimal replication (in our dataset, two replicates in each of two methionine concentrations). Second, statistical and classification methods are applied to detect and remove false positives. Our computational method is different from existing protein interaction prediction or enrichment methods because those methods generally focus on mining the positives from high-throughput experiment results, while we focus on the identification of false positives and pass the potential true positive interactions to the next step. Third, a more rigorous run of mbSUS is applied to the pre-screened network with multiple replications under different conditions (in our dataset, 48 tests per interaction pair). The final network contains 541 (532 unique) interactions among 239 proteins.
To determine how much of our network recapitulates the limited membrane interaction data in the literature, we compared all of the Arabidopsis interaction data available in databases and curated from the literature (5723 interactions between 2695 proteins) against the interactions we tested in this study. There were 38 published interaction pairs that we tested. Of these, none of them were found to be positive in our final network. This breaks down into 17 true negatives; They were found to interact only in an active state (Trotochaud et al., 2000; Li et al., 2002), interacted with only partial protein (Stone et al., 1994; Park et al., 2001; Geisler et al., 2003), or the C-terminal fusion did not work (Schulze et al., 2003; Obrdlik et al., 2004). Fifteen interactions were found using in vivo pull-down assays and may not have been possible to find interactions in a binary test such as ours (Sanderfoot et al., 2001; Blakeslee et al., 2007). Only four interactions that used in vitro pull down or binding assays, we did not identify as positive and could possibly be considered false negative in our study (Qin et al., 1997; Chen et al., 2005; Mishra et al., 2006). However, it is possible that these in vitro assays may have used a lot of the recombinant proteins, which may not be recapitulated in our system. In summary, our network contributes, albeit in a small way, to fill a large gap in the publicly available interactome space by adding new membrane-protein interaction data.
While this is a small fraction of the full in vivo network, it may nevertheless contain interactions that could generate novel hypotheses for many processes. We illustrate this with mildew resistance locus O (MLO) genes. Mildew resistance locus Os have seven membrane-spanning regions and represent a plant-specific protein family (Stein and Somerville, 2002). The first characterized member from barley, called Mlo, is involved in fungal pathogen susceptibility and when mutated, causes resistance to fungal pathogens. Arabidopsis has 15 MLO members divided into four clades. Clade 4 represents the orthologous group to the barley Mlo and the triple mutant, atmlo2;6;12, exhibits fungal resistance, just like the barly Mlo (Consonni et al., 2006). Plasma membrane syntaxin PEN1 (a Q-SNARE) acts antagonistically to MLO in defense; resistance of mlo mutants requires PEN1, suggesting that vesicle fusion is important for MLO function (Consonni et al., 2006). While a Q-SNARE of the vesicle fusion complexes was found to be involved in MLO-mediated susceptibility, R-SNAREs, or synaptobrevins (VAMPs), that are located on the vesicles to mediate fusion with the Q-SNAREs in the plasma membrane have not yet been found. In our network, MLOs interact with VAMPs more frequently than by chance (Table S19 in Supplementary Material). Specifically, we found MLO4 to interact with two VAMPs, AT1G04760 and AT4G32150. AT1G04760 is a member of the VAMP72-clade involved in secretion and AT4G32150 is a member of the VAMP71-clade involved in late endosomal and vacuolar vesicles (Bassham et al., 2008). Recently MLO4 and MLO11, two members of clade 1, were found to be required for thigmomorphogenesis in Arabidopsis root (Chen et al., 2009). MLO4 is localized to plasma membrane and endomembranes, suggesting that it may be involved in endocytotic cycling (Chen et al., 2009). Therefore, our network suggests that VAMPs may also be involved in root thigmomorphogenesis by facilitating the endocytotic cycling of MLO4, and that VAMPs may also interact with MLOs involved in fungal pathogen susceptibility.
Similarly, our network shows that MLOs also interact with voltage-gated channel (VLC) family more frequently than expected (p-value = 1.7622E−05, binomial distribution, Table S19 in Supplementary Material). The member of VLC that interacts with MLOs is a cyclic nucleotide-gated channel, CNGC18, which is required for polarized tip growth of pollen tube (Frietsch et al., 2007). This is intriguing because MLO7, a member of clade 2 submily, is required for pollen tube reception by the synergid cells in the female gametophyte (Kessler et al., 2010). Its localization is polarized upon pollen tube entry and this polar localization requires the activity of a receptor-like kinase FER. Mutants carrying a loss of function allele, fer/fer, are resistant to powdery mildew infection, indicating conservation of mechanism between pollen tube reception and fungal hyphae invasion (Kessler et al., 2010). Our network suggests that CNGCs may interact with MLOs generally and might be involved not only in pollen tube reception but also in other MLO-mediated processes such as fungal susceptibility and thigmomorphogenesis.
In summary, our network contains interactions between membrane and signaling proteins that may suggest possible mechanisms in various biological processes. We highlighted this using the MLO family’s interactions, which suggest that there may be a common molecular mechanism involving vesicle fusion and calcium signaling involved in the perception of a tip growing cell, whether the cell be of a different genotype (pollen tube), a different organism (fungal hypha), or a different cell type (root thigmomorphogenesis).
Caution should be applied that even if these interactions occur in yeast, they might not be relevant in planta because of differential expression, localization, amount, or functional states of the proteins in planta. The interactions in this system only indicate possible interaction and co-function in planta and the actual interactions could take place with a different homolog that is expressed and localized in the right place. The potential interactions in our network represent only a starting point in further investigating the roles and mechanisms of these proteins. Further studies in verifying their interactions in planta will be needed to elucidate their roles in plants.
Conflict of Interest Statement
The authors declare that the research was conducted in the absence of any commercial or financial relationships that could be construed as a potential conflict of interest.
Acknowledgments
We are grateful to Sylvain Brohee, Jacques van Helden, and Noah Whitman for their contributions toward initial statistical analysis of the first mbSUS assays. We also thank Brandon Zoeckler for participating in the curation of protein interactions from the literature. This work was supported in part by grants from Junta de Castilla y León (GR147) and Ministerio de Ciencia y Innovación (BIO2008-00194) to Jose Luis Revuelta and grants from the National Science Foundation (Arabidopsis2010-0618402 and MCB-1052348) to Seung Y. Rhee and Wolf B. Frommer.
Supplementary Material
The Supplementary Material for this article can be found online at: http://www.frontiersin.org/Plant_Physiology/10.3389/fpls.2012.00124/abstract
Table S1. A list of 414 proteins that were tested in the first mbSUS assays.
Table S2. A curated list of 1831 protein interactions from the literature compiled from TAIR (Lamesch et al., 2012), IntAct (Kerrien et al., 2007), and BIND (Bader et al., 2003) databases.
Table S3. High-confidence interactions from the first mbSUS assays, with FDR values less than 10−8 and tested positive in both 0 and 250 μM methionine (GOLD-NET).
Table S4. Feature selection. We evaluated the merit of a subset of features by considering the predictive ability of each feature, along with the degree of redundancy between them.
Table S5. Classification performance. This table lists all the classification models tested in our study. Five classifiers (boosted AD-tree, boosted logistic, bagged BayesNet, SMO with puk kernel, and LibSVM with RBF kernel) showed the best performance in each category (highlighted in red).
Table S6. Thresholds for different mbSUS assays. For a bimodal distribution, to separate potential positive interactions from noise, we determined the threshold between the two peaks with a k-means likelihood method.
Table S7. A list of interaction pairs from the first mbSUS assay, whose FDR values are equal to or less than 1 (RAW-NET).
Table S8. GO annotations of the 414 genes tested in this study.
Table S9. A list of 21 sticky proteins that interacted with most proteins and 13 proteins that did not interact with any protein.
Table S10. A list of 1949 interactions between 380 proteins from the first mbSUS assay whose FDR values were less than 0.05 (PRIMARY-NET).
Table S11. A list of 931 interactions from the first mbSUS assay whose FDR values are less than 10−4 (SIG-NET).
Table S12. A list of 1018 interactions from the first mbSUS assay whose FDR values are between 0.05 and 10−4 (NSE-NET).
Table S13. A list of 541 (532 unique) interactions between 239 proteins that were tested positive in the second mbSUS assay (FINAL-NET).
Table S14. A list of 227 interactions among 145 proteins from FINAL-NET, excluding the interactions with CUB-proteins with greater than 20 interactions.
Table S15. GO annotations for the 145 proteins in the sub-network that was analyzed functionally.
Table S16. Topological characteristics of overlapping nodes in AraNet, PAIR, and our network.
Table S17. Family classification of the 145 proteins in the sub-network that was analyzed functionally.
Table S18. Family classification for each of the 227 interaction pairs.
Table S19. A list of significantly enriched family level interactions.
Figure S1. Comparison of number of potential positive interactions in REF-NET (blue) and PRIMARY-NET (red) at different FDR thresholds.
Figure S2. Distribution of coefficient of variation of the replicates for the second mbSUS assays using cell growth in the absence of histidine in different concentrations of methionine (MET0 = 0 μ{M, MET150 = 150} μ{M, MET500 = 500} μ{M}).
Figure S3. Distribution of coefficient of variation of the replicates for the second mbSUS assays using LacZ reporter gene in different concentrations of methionine (MET0 = 0 μ{M}, MET150 = 150 μ{M, MET500 = 500} μ{M}).
Figure S4. Distribution of optical density of the interaction pairs in the second mbSUS assays based on the growth and LacZ reporter assays in different concentrations of methionine (MET0 = 0 μ{M, MET150 = 150} μ{M, MET500 = 500} μ{M}).
Figure S5. Logistic regression of the probability of a true positive interaction on the statistical analysis of the first mbSUS runs. Histograms of the positive and negative data from the second mbSUS assay are shown on top and bottom, respectively.
Abbreviations
CNGC, cyclic nucleotide-gated ion channel; Cub, C-terminal of ubiquitin; Cub-PLV, Cub-protA-LexA-VP16 peptide; CV, coefficient of variation; FDR, false discovery rate; GO, gene ontology; mbSUS, mating-based split ubiquitin system; MLO, mildew resistance locus O; Nub, N-terminal of ubiquitin; ORF, open reading frame; PO, plant ontology; pPPI, potential protein–protein interaction; RLK, receptor-like kinase; SC, synthetic complete medium; SD, synthetic dextrose minimal medium; SMO, sequential minimal optimization; SVM, support vector machine; TF, transcription factor; VAMP, vesicle-associated membrane protein; Y2H, yeast two hybrid; YPD, yeast extract peptone dextrose complete medium.
Footnotes
References
Arabidopsis Interactome Mapping Consortium. (2011). Evidence for network evolution in an Arabidopsis interactome map. Science 333, 601–607.
Ashburner, M., Ball, C. A., Blake, J. A., Botstein, D., Butler, H., Cherry, J. M., Davis, A. P., Dolinski, K., Dwight, S. S., Eppig, J. T., Harris, M. A., Hill, D. P., Issel-Tarver, L., Kasarskis, A., Lewis, S., Matese, J. C., Richardson, J. E., Ringwald, M., Rubin, G. M., and Sherlock, G. (2000). Gene Ontology: tool for the unification of biology. The Gene Ontology Consortium. Nat. Genet. 25, 25–29.
August, E., and Papachristodoulou, A. (2009). Efficient, sparse biological network determination. BMC Syst. Biol. 3, 25.
Avraham, S., Tung, C. W., Ilic, K., Jaiswal, P., Kellogg, E. A., Mccouch, S., Pujar, A., Reiser, L., Rhee, S. Y., Sachs, M. M., Schaeffer, M., Stein, L., Stevens, P., Vincent, L., Zapata, F., and Ware, D. (2008). The Plant Ontology Database: a community resource for plant structure and developmental stages controlled vocabulary and annotations. Nucleic Acids Res. 36, D449–D454.
Bader, G. D., Betel, D., and Hogue, C. W. (2003). BIND: the Biomolecular Interaction Network Database. Nucleic Acids Res. 31, 248–250.
Barabasi, A. L., and Oltvai, Z. N. (2004). Network biology: understanding the cell’s functional organization. Nat. Rev. Genet. 5, 101–113.
Barbier-Brygoo, H., Gaymard, F., Rolland, N., and Joyard, J. (2001). Strategies to identify transport systems in plants. Trends Plant Sci. 6, 577–585.
Bassham, D. C., Brandizzi, F., Otegui, M. S., and Sanderfoot, A. A. (2008). “The secretory system of Arabidopsis,” in The Arabidopsis Book, eds R. Last, C. Chang, D. Kliebenstein, R. McClung, H. Millar, K. Torii, and D. Wagner (Rockville: American Society of Plant Biologists), e0116.
Bi, J., and Zhang, T. (2004). Support vector classification with input data uncertainty. Adv. Neural Inf. Process Syst. 17, 161–168.
Blakeslee, J. J., Bandyopadhyay, A., Lee, O. R., Mravec, J., Titapiwatanakun, B., Sauer, M., Makam, S. N., Cheng, Y., Bouchard, R., Adamec, J., Geisler, M., Nagashima, A., Sakai, T., Martinoia, E., Friml, J., Peer, W. A., and Murphy, A. S. (2007). Interactions among PIN-FORMED and P-glycoprotein auxin transporters in Arabidopsis. Plant Cell 19, 131–147.
Bork, P., Jensen, L. J., Von Mering, C., Ramani, A. K., Lee, I., and Marcotte, E. M. (2004). Protein interaction networks from yeast to human. Curr. Opin. Struct. Biol. 14, 292–299.
Brun, C., Chevenet, F., Martin, D., Wojcik, J., Guenoche, A., and Jacq, B. (2003). Functional classification of proteins for the prediction of cellular function from a protein-protein interaction network. Genome Biol. 5, R6.
Chang, C.-C., and Lin, C.-J. (2011). LIBSVM: a library for support vector machines. ACM Trans. Intell. Syst. Technol. 2, 1–27.
Chen, Y., Shin, Y. K., and Bassham, D. C. (2005). YKT6 is a core constituent of membrane fusion machineries at the Arabidopsis trans-Golgi network. J. Mol. Biol. 350, 92–101.
Chen, Z., Noir, S., Kwaaitaal, M., Hartmann, H. A., Wu, M. J., Mudgil, Y., Sukumar, P., Muday, G., Panstruga, R., and Jones, A. M. (2009). Two seven-transmembrane domain mildew resistance locus O proteins cofunction in Arabidopsis root thigmomorphogenesis. Plant Cell 21, 1972–1991.
Choi, H., Castleman, K. R., and Bovik, A. C. (2004). “Joint segmentation and classification of M-FISH chromosome images,” in Proceedings of the 26th Annual International Conference of the IEEE EMBS, San Francisco.
Clauset, A., Shalizi, C. R., and Newman, M. E. J. (2009). Power-law distributions in empirical data. SIAM Rev. 51, 661–703.
Consonni, C., Humphry, M. E., Hartmann, H. A., Livaja, M., Durner, J., Westphal, L., Vogel, J., Lipka, V., Kemmerling, B., Schulze-Lefert, P., Somerville, S. C., and Panstruga, R. (2006). Conserved requirement for a plant host cell protein in powdery mildew pathogenesis. Nat. Genet. 38, 716–720.
Cooper, G. F., and Dietterich, T. (1992). A Bayesian method for the induction of probabilistic networks from data. Mach. Learn. 9, 309–347.
Du, L., and Chen, Z. (2000). Identification of genes encoding receptor-like protein kinases as possible targets of pathogen- and salicylic acid-induced WRKY DNA-binding proteins in Arabidopsis. Plant J. 24, 837–847.
Du, Z., Zhou, X., Ling, Y., Zhang, Z., and Su, Z. (2010). agriGO: a GO analysis toolkit for the agricultural community. Nucleic Acids Res. 38, W64–W70.
Fields, S. (2005). High-throughput two-hybrid analysis. The promise and the peril. FEBS J. 272, 5391–5399.
Freund, Y., and Mason, L. (1999). “The alternating decision tree learning algorithm,” in Proceeding of the Sixteenth International Conference on Machine Learning, Bled, 124–133.
Freund, Y., and Schapire, R. E. (1996). “Experiments with a new boosting algorithm,” in Thirteenth International Conference on Machine Learning. San Francisco.
Frietsch, S., Wang, Y. F., Sladek, C., Poulsen, L. R., Romanowsky, S. M., Schroeder, J. I., and Harper, J. F. (2007). A cyclic nucleotide-gated channel is essential for polarized tip growth of pollen. Proc. Natl. Acad. Sci. U.S.A. 104, 14531–14536.
Fusco, C., Guidotti, E., and Zervos, A. S. (1999). In vivo construction of cDNA libraries for use in the yeast two-hybrid system. Yeast 15, 715–720.
Geisler, M., Kolukisaoglu, H. U., Bouchard, R., Billion, K., Berger, J., Saal, B., Frangne, N., Koncz-Kalman, Z., Koncz, C., Dudler, R., Blakeslee, J. J., Murphy, A. S., Martinoia, E., and Schulz, B. (2003). TWISTED DWARF1, a unique plasma membrane-anchored immunophilin-like protein, interacts with Arabidopsis multidrug resistance-like transporters AtPGP1 and AtPGP19. Mol. Biol. Cell 14, 4238–4249.
Hall, M., Frank, E., Holmes, G., Pfahringer, B., Reutemann, P., and Witten, I. H. (2009). The WEKA data mining software: an update. SIGKDD Explor. 11, 10–18.
Hesselberth, J. R., Chen, X., Zhang, Z., Sabo, P. J., Sandstrom, R., Reynolds, A. P., Thurman, R. E., Neph, S., Kuehn, M. S., Noble, W. S., Fields, S., and Stamatoyannopoulos, J. A. (2009). Global mapping of protein-DNA interactions in vivo by digital genomic footprinting. Nat. Methods 6, 283–289.
Jansen, R., Yu, H., Greenbaum, D., Kluger, Y., Krogan, N. J., Chung, S., Emili, A., Snyder, M., Greenblatt, J. F., and Gerstein, M. (2003). A Bayesian networks approach for predicting protein-protein interactions from genomic data. Science 302, 449–453.
Johnsson, N., and Varshavsky, A. (1994). Split ubiquitin as a sensor of protein interactions in vivo. Proc. Natl. Acad. Sci. U.S.A. 91, 10340–10344.
Keerthi, S. S., Shevade, S. K., Bhattacharyya, C., and Murphy, K. R. K. (2001). Improvements to Platt’s SMO algorithm for SVM classifier design. Neural Comput. 13, 637–649.
Kerrien, S., Alam-Faruque, Y., Aranda, B., Bancarz, I., Bridge, A., Derow, C., Dimmer, E., Feuermann, M., Friedrichsen, A., Huntley, R., Kohler, C., Khadake, J., Leroy, C., Liban, A., Lieftink, C., Montecchi-Palazzi, L., Orchard, S., Risse, J., Robbe, K., Roechert, B., Thorneycroft, D., Zhang, Y., Apweiler, R., and Hermjakob, H. (2007). IntAct – open source resource for molecular interaction data. Nucleic Acids Res. 35, D561–D565.
Kessler, S. A., Shimosato-Asano, H., Keinath, N. F., Wuest, S. E., Ingram, G., Panstruga, R., and Grossniklaus, U. (2010). Conserved molecular components for pollen tube reception and fungal invasion. Science 330, 968–971.
Lalonde, S., Ehrhardt, D. W., Loque, D., Chen, J., Rhee, S. Y., and Frommer, W. B. (2008). Molecular and cellular approaches for the detection of protein-protein interactions: latest techniques and current limitations. Plant J. 53, 610–635.
Lalonde, S., Sero, A., Pratelli, R., Pilot, G., Chen, J., Sardi, M., Parsa, S., Kim, D., Acharya, B., Stein, E., Hu, H., Villiers, F., Takeda, K., Yang, Y., Han, Y., Schwacke, R., Chiang, W., Kato, N., Loqué, D., Assmann, S., Kwak, J., Schroeder, J., Rhee, S., and Frommer, W. (2010). A membrane protein/signaling protein interaction network for Arabidopsis. Front. Plant Physiol. 1, 1–14.
Lamesch, P., Berardini, T. Z., Li, D., Swarbreck, D., Wilks, C., Sasidharan, R., Muller, R., Dreher, K., Alexander, D. L., Garcia-Hernandez, M., Karthikeyan, A. S., Lee, C. H., Nelson, W. D., Ploetz, L., Singh, S., Wensel, A., and Huala, E. (2012). The Arabidopsis information resource (TAIR): improved gene annotation and new tools. Nucleic Acids Res. 40, D1202–D1210.
le Cessie, S., and van Houwelingen, J. C. (1992). Ridge estimators in logistic regression. Appl. Stat. 41, 191–201.
Lee, I., Ambaru, B., Thakkar, P., Marcotte, E. M., and Rhee, S. Y. (2010). Rational association of genes with traits using a genome-scale gene network for Arabidopsis thaliana. Nat. Biotechnol. 28, 149–156.
Li, X. Y., Wang, Y.-Y., and Acero, A. (2008). “Learning query intent from regularized click graphs,” in Proceedings of the 31st SIGIR Conference, Singapore.
Li, J., Wen, J., Lease, K. A., Doke, J. T., Tax, F. E., and Walker, J. C. (2002). BAK1, an Arabidopsis LRR receptor-like protein kinase, interacts with BRI1 and modulates brassinosteroid signaling. Cell 110, 213–222.
Lin, M., Shen, X., and Chen, X. (2011). PAIR: the predicted Arabidopsis interactome resource. Nucleic Acids Res. 39, D1134–D1140.
Miller, J. P., Lo, R. S., Ben-Hur, A., Desmarais, C., Stagljar, I., Noble, W. S., and Fields, S. (2005). Large-scale identification of yeast integral membrane protein interactions. Proc. Natl. Acad. Sci. U.S.A. 102, 12123–12128.
Mishra, G., Zhang, W., Deng, F., Zhao, J., and Wang, X. (2006). A bifurcating pathway directs abscisic acid effects on stomatal closure and opening in Arabidopsis. Science 312, 264–266.
Mukhtar, M. S., Carvunis, A. R., Dreze, M., Epple, P., Steinbrenner, J., Moore, J., Tasan, M., Galli, M., Hao, T., Nishimura, M. T., Pevzner, S. J., Donovan, S. E., Ghamsari, L., Santhanam, B., Romero, V., Poulin, M. M., Gebreab, F., Gutierrez, B. J., Tam, S., Monachello, D., Boxem, M., Harbort, C. J., Mcdonald, N., Gai, L., Chen, H., He, Y., Vandenhaute, J., Roth, F. P., Hill, D. E., Ecker, J. R., Vidal, M., Beynon, J., Braun, P., and Dangl, J. L. (2011). Independently evolved virulence effectors converge onto hubs in a plant immune system network. Science 333, 596–601.
Obayashi, T., Hayashi, S., Saeki, M., Ohta, H., and Kinoshita, K. (2009). ATTED-II provides coexpressed gene networks for Arabidopsis. Nucleic Acids Res. 37, D987–D991.
Obayashi, T., and Kinoshita, K. (2010). Coexpression landscape in ATTED-II: usage of gene list and gene network for various types of pathways. J. Plant Res. 123, 311–319.
Obrdlik, P., El-Bakkoury, M., Hamacher, T., Cappellaro, C., Vilarino, C., Fleischer, C., Ellerbrok, H., Kamuzinzi, R., Ledent, V., Blaudez, D., Sanders, D., Revuelta, J. L., Boles, E., Andre, B., and Frommer, W. B. (2004). K+ channel interactions detected by a genetic system optimized for systematic studies of membrane protein interactions. Proc. Natl. Acad. Sci. U.S.A. 101, 12242–12247.
Pagel, P., Oesterheld, M., Stumpflen, V., and Frishman, D. (2006). The DIMA web resource – exploring the protein domain network. Bioinformatics 22, 997–998.
Park, A. R., Cho, S. K., Yun, U. J., Jin, M. Y., Lee, S. H., Sachetto-Martins, G., and Park, O. K. (2001). Interaction of the Arabidopsis receptor protein kinase Wak1 with a glycine-rich protein, AtGRP-3. J. Biol. Chem. 276, 26688–26693.
Qin, W., Pappan, K., and Wang, X. (1997). Molecular heterogeneity of phospholipase D (PLD). Cloning of PLDgamma and regulation of plant PLDgamma, -beta, and -alpha by polyphosphoinositides and calcium. J. Biol. Chem. 272, 28267–28273.
Rahim, G., Bischof, S., Kessler, F., and Agne, B. (2009). In vivo interaction between atToc33 and atToc159 GTP-binding domains demonstrated in a plant split-ubiquitin system. J. Exp. Bot. 60, 257–267.
Raquet, X., Eckert, J. H., Muller, S., and Johnsson, N. (2001). Detection of altered protein conformations in living cells. J. Mol. Biol. 305, 927–938.
Ravasz, E. (2009). Detecting hierarchical modularity in biological networks. Methods Mol. Biol. 541, 145–160.
Ren, Q., Chen, K., and Paulsen, I. T. (2007). TransportDB: a comprehensive database resource for cytoplasmic membrane transport systems and outer membrane channels. Nucleic Acids Res. 35, D274–D279.
Ren, Q., and Paulsen, I. T. (2005). Comparative analyses of fundamental differences in membrane transport capabilities in prokaryotes and eukaryotes. PLoS Comput. Biol. 1, e27.
Resnik, P. (1995). “Using information content to evaluate semantic similarity in a taxonomy,” in Proceedings of the 14th International Joint Conference on Artificial Intelligence (IJCAI). Montreal.
Saier, M. H. Jr., Yen, M. R., Noto, K., Tamang, D. G., and Elkan, C. (2009). The transporter classification database: recent advances. Nucleic Acids Res. 37, D274–D278.
Sanderfoot, A. A., Kovaleva, V., Bassham, D. C., and Raikhel, N. V. (2001). Interactions between syntaxins identify at least five SNARE complexes within the Golgi/prevacuolar system of the Arabidopsis cell. Mol. Biol. Cell 12, 3733–3743.
Schreiber, F., and Schwobbermeyer, H. (2005). MAVisto: a tool for the exploration of network motifs. Bioinformatics 21, 3572–3574.
Schulze, W. X., Reinders, A., Ward, J., Lalonde, S., and Frommer, W. B. (2003). Interactions between co-expressed Arabidopsis sucrose transporters in the split-ubiquitin system. BMC Biochem. 4, 3.
Smoot, M. E., Ono, K., Ruscheinski, J., Wang, P. L., and Ideker, T. (2011). Cytoscape 2.8: new features for data integration and network visualization. Bioinformatics 27, 431–432.
Stein, M., and Somerville, S. C. (2002). MLO, a novel modulator of plant defenses and cell death, binds calmodulin. Trends Plant Sci. 7, 379–380.
Stone, J. M., Collinge, M. A., Smith, R. D., Horn, M. A., and Walker, J. C. (1994). Interaction of a protein phosphatase with an Arabidopsis serine-threonine receptor kinase. Science 266, 793–795.
Strassburger, K., and Bretz, F. (2008). Compatible simultaneous lower confidence bounds for the Holm procedure and other Bonferroni-based closed tests. Stat. Med. 27, 4914–4927.
Streinu, I., and Theran, L. (2009). Sparse hypergraphs and pebble game algorithms. Eur. J. Combinator. 30, 1944–1964.
Supek, F., Bosnjak, M., Skunca, N., and Smuc, T. (2011). REVIGO summarizes and visualizes long lists of gene ontology terms. PLoS ONE 6, e21800.
Svennerstam, H., Ganeteg, U., and Nasholm, T. (2008). Root uptake of cationic amino acids by Arabidopsis depends on functional expression of amino acid permease 5. New Phytol. 180, 620–630.
Tan, P.-N., Steinbach, M., and Kumar, V. (2005). Introduction to Data Mining. Boston: Addison-Wesley Press.
Trotochaud, A. E., Jeong, S., and Clark, S. E. (2000). CLAVATA3, a multimeric ligand for the CLAVATA1 receptor-kinase. Science 289, 613–617.
Vandenbussche, F., Petrasek, J., Zadnikova, P., Hoyerova, K., Pesek, B., Raz, V., Swarup, R., Bennett, M., Zazimalova, E., Benkova, E., and van der Straeten, D. (2010). The auxin influx carriers AUX1 and LAX3 are involved in auxin-ethylene interactions during apical hook development in Arabidopsis thaliana seedlings. Development 137, 597–606.
Verhoeven, K., Simonsen, K., and Mcintyre, L. (2005). Implementing false discovery rate control: increasing your power. Oikos 108, 643–647.
Vlasblom, J., and Wodak, S. J. (2009). Markov clustering versus affinity propagation for the partitioning of protein interaction graphs. BMC Bioinformatics 10, 99.
Wernicke, S., and Rasche, F. (2006). FANMOD: a tool for fast network motif detection. Bioinformatics 22, 1152–1153.
Wong, S. L., Zhang, L. V., Tong, A. H., Li, Z., Goldberg, D. S., King, O. D., Lesage, G., Vidal, M., Andrews, B., Bussey, H., Boone, C., and Roth, F. P. (2004). Combining biological networks to predict genetic interactions. Proc. Natl. Acad. Sci. U.S.A. 101, 15682–15687.
Keywords: Arabidopsis, protein–protein interaction, membrane, transporter, split ubiquitin system, classification
Citation: Chen J, Lalonde S, Obrdlik P, Noorani Vatani A, Parsa SA, Vilarino C, Revuelta JL, Frommer WB and Rhee SY (2012) Uncovering Arabidopsis membrane protein interactome enriched in transporters using mating-based split ubiquitin assays and classification models. Front. Plant Sci. 3:124. doi: 10.3389/fpls.2012.00124
Received: 22 February 2012; Paper pending published: 29 March 2012;
Accepted: 24 May 2012; Published online: 21 June 2012.
Edited by:
Burkhard Schulz, Purdue University, USACopyright: © 2012 Chen, Lalonde, Obrdlik, Noorani Vatani, Parsa, Vilarino, Revuelta, Frommer and Rhee. This is an open-access article distributed under the terms of the Creative Commons Attribution Non Commercial License, which permits non-commercial use, distribution, and reproduction in other forums, provided the original authors and source are credited.
*Correspondence: Jin Chen, MSU-DOE Plant Research Laboratory, Computer Science and Engineering Department, Michigan State University, 612 Wilson Road, East Lansing, MI 40024, USA. e-mail: jinchen@msu.edu;; Seung Y. Rhee, Department of Plant Biology, Carnegie Institution for Science, 260 Panama Street, Stanford, CA 94305, USA. e-mail: rhee@acoma.stanford.edu