
- 1 Institute of Agricultural and Environmental Sciences, Estonian University of Life Sciences, Tartu, Estonia
- 2 Department of Organismic and Evolutionary Biology, Harvard University, Cambridge, MA, USA
Within-canopy variation in light results in profound canopy profiles in foliage structural, chemical, and physiological traits. Studies on within-canopy variations in key foliage traits are often conducted in artificial environments, including growth chambers with only artificial light, and greenhouses with and without supplemental light. Canopy patterns in these systems are considered to be representative to outdoor conditions, but in experiments with artificial and supplemental lighting, the intensity of artificial light strongly deceases with the distance from the light source, and natural light intensity in greenhouses is less than outdoors due to limited transmittance of enclosure walls. The implications of such changes in radiation conditions on canopy patterns of foliage traits have not yet been analyzed. We developed model-based methods for retrospective estimation of distance vs. light intensity relationships, for separation of the share of artificial and natural light in experiments with combined light and for estimation of average enclosure transmittance, and estimated daily integrated light at the time of sampling (Qint,C), at foliage formation (Qint,G), and during foliage lifetime (Qint,av). The implications of artificial light environments were analyzed for altogether 25 studies providing information on within-canopy gradients of key foliage traits for 70 species × treatment combinations. Across the studies with artificial light, Qint,G for leaves formed at different heights in the canopy varied from 1.8- to 6.4-fold due to changing the distance between light source and growing plants. In experiments with combined lighting, the share of natural light at the top of the plants varied threefold, and the share of natural light strongly increased with increasing depth in the canopy. Foliage nitrogen content was most strongly associated with Qint,G, but photosynthetic capacity with Qint,C, emphasizing the importance of explicit description of light environment during foliage lifetime. The reported and estimated transmittances of enclosures varied between 0.27 and 0.85, and lack of consideration of the reduction of light compared with outdoor conditions resulted in major underestimation of foliage plasticity to light. The study emphasizes that plant trait vs. light relationships in artificial systems are not directly comparable to natural environments unless modifications in lighting conditions in artificial environments are taken into account.
Introduction
Light is a key environmental factor altering plant form and function (Givnish, 1988; Valladares, 2003; Niinemets, 2007; Pearcy, 2007; Poorter et al., 2009a). There are extensive light gradients within-plant canopies and numerous studies have demonstrated that foliage structural, chemical, and physiological traits acclimate to these gradients (e.g., Hirose and Werger, 1987; Gutschick and Wiegel, 1988; Terashima and Hikosaka, 1995; Anten, 2005; Hikosaka, 2005; Niinemets, 2007), resulting in enhanced canopy carbon gain compared with invariable foliage characteristics (e.g., Niinemets and Anten, 2009; Dewar et al., 2012; Niinemets, 2012).
Several classical studies investigating plant acclimation along light gradients have been conducted in artificial environments including greenhouses with natural illumination, greenhouses with natural, and supplemental illumination and growth chambers (e.g., Gutschick and Wiegel, 1988; Hirose et al., 1988; Evans, 1993a,b; Pons et al., 1993). Artificial environments are currently also extensively used for within-plant acclimation studies (e.g., Dreccer et al., 2000; Lötscher et al., 2003; Boonman et al., 2009; Pettersen et al., 2010; Trouwborst et al., 2010). While artificial environments provide a means to investigate plant responses to light without interfering interactions with other environmental drivers (e.g., Niinemets, 2010; Poorter et al., 2012), there are a number of important and often neglected differences in within-canopy light environments between artificial systems and outdoor conditions.
In natural environments, instantaneous values of quantum flux density, Q, are strongly variable during the day, between the days and seasons. Thus, average integrated quantum flux density (Qint) at a specific canopy location or relative quantum flux density (RQ), the ratio of Q at a specific canopy position to Q above the canopy (Q0), are used as estimates of long-term light conditions (Anten, 1997; Meir et al., 2002; Aranda et al., 2004; Niinemets, 2007; Posada et al., 2009; Hallik et al., 2012). As RQ can be estimated separately from instantaneous measurements of light profiles (e.g., Parent and Messier, 1996) or by other techniques such as hemispheric photography (e.g., Rich et al., 1993), Qint for a specific location in the canopy can be estimated from RQ and long-term above canopy estimates of Q0 (Qint,0) as:
This equation is widely used in studies on within-canopy variation in plant traits (Chazdon and Field, 1987; Kull and Tulva, 2002; Meir et al., 2002; Fleck et al., 2003; Niinemets, 2007).
Compared with natural illumination, plant lighting conditions are dramatically different when grown under artificial light. In the case of artificial light, light intensity strongly increases with decreasing distance between the lamp and plant leaves (Gates, 1980; Poorter et al., 2012). Thus, Qint,0 for topmost leaves varies as the plants increase in size, unless the distance between plants and light source is maintained constant during the experiment. However, when the lamps are raised to maintain the intensity constant at the top of the canopy, light at the bottom of the canopy is inevitably reduced. In contrast to natural canopies where light intensity decreases from canopy top to bottom only due to plant foliage, in experiments with artificial light, light gradients also result from a distance-dependent reduction of light. As a result, light gradients during foliage development and in mature canopies are expected to be stronger than in plants exposed only to natural illumination, and this may affect plant acclimation and relationships with integrated light at the time of foliage sampling. So far, the implications of distance-dependent variations in Qint,0 on gradients of foliage structural, chemical, and physiological traits have not been investigated, and studies under artificial illumination have been considered to be representative models of field conditions.
The situation is even more complicated in studies using natural illumination supplemented by artificial light as can often occur in experiments conducted in high latitudes in greenhouses beyond the normal growing period when days are short (e.g., Dreccer et al., 2000; Pettersen et al., 2010; Trouwborst et al., 2010). In experiments with combined lighting, incident integrated leaf light is the sum of integrated irradiance from artificial light source that varies with the distance between the foliage and artificial light source, and natural integrated light that fluctuates between the days and varies during the season. The overall effect of distance from the artificial light source strongly depends on the share of total integrated light between artificial and natural light at the top of the canopy, and the degree of distance-dependent reduction of artificial light. Importantly, this share is expected to change as plants increase in size, and consequently, prediction of dynamic changes of light within the canopy illuminated by artificial and natural light sources requires determination of the contributions of natural and artificial light at different vegetation layers.
As noted above, many acclimation studies have examined foliage traits in relation to RQ, rather than in relation to Qint. Outdoors, RQ = 1.0 typically refers to a completely open location (so-called “full sun”) and RQ = 0.0 to an hypothetical situation with no light penetrating at all. Outdoors, a certain maximum value of Qint, Qint,0, corresponds to RQ = 1.0. However, in studies conduced in artificial environments, RQ is commonly taken as 1.0 at the top of the vegetation inside the enclosure (apparent relative light, RQ,A), implying that Qint values different from Qint,0 can correspond to RQ,A = 1.0 inside the enclosure, and generally RQ ≠ RQ,A. As foliage traits adjust to integrated rather than to relative light, this is problematic. In studies with artificial light, variations in Qint corresponding to RQ,A = 1.0 can vary due to differences in intensity of artificial light used in different studies and variations in overall vegetation height (distance between light source and plants). In studies with natural light, Qint for RQ,A = 1.0 can vary due to geographical location, season, and weather conditions during the period of interest, whereas in studies with combined supply of natural and artificial light, all the aforementioned factors can result in variations in Qint at the top of the canopy.
In the case of enclosures such as greenhouses or microcosms relying on natural or natural and supplemental light, it is also important to consider that the enclosure surface only partly transmits the natural light incident to the enclosure surface (Kittas et al., 1999; Papadakis et al., 2000). Accordingly, Qint corresponding to RQ,A = 1.0 inside the enclosure also varies due to variations in enclosure transmittance, and is essentially always less than Qint above the enclosure. The circumstance that light intensity inside the greenhouse is generally less than outside is not always considered when summarizing the results of past studies by meta-analyses (e.g., Poorter et al., 2009a, 2011). However, typical daily average values of greenhouse transmittances are on the order of 0.4–0.6 (Kittas et al., 1999; Papadakis et al., 2000), implying that consideration of light reduction due to greenhouse material is important to be able to estimate the actual light levels corresponding to RQ,A = 1.0 in given studies. The major implication of RQ ≠ RQ,A, is that the parameters of the regressions of foliage, physiological, chemical, and structural traits on RQ,A, characterizing foliage responsiveness to light, are not comparable with studies in field environments, and furthermore, they are also not comparable among different studies using different lighting setups.
In the current study, we first developed approaches for retrospective estimation of Qint values corresponding to RQ,A = 1.0 at the top of the canopy for various experimental setups in artificial environments, and methods for the determination of integrated light throughout plant development in artificial systems. Thereafter we tested the hypothesis that foliage structural, chemical, and physiological traits in fast-growing herb canopies are more strongly associated with Qint during plant growth than with Qint in the fully developed canopies. Finally, we evaluated the implications of RQ ≠ RQ,A on statistical relationships of foliage key traits on RQ,A. The results underscore the importance of detailed description of light in studies in artificial environment, and also emphasize that caution should be exercised in interpreting plasticity data obtained in such systems.
Theory: Light in Manipulated Environments (Microcosms, Greenhouses, Growth Chambers)
Enclosures with Natural Lighting
In an enclosure exposed to natural light, the amount of light incident to vegetation (Qen) is related to the light incident above the enclosure, Qab, as:
where κQ is the fraction of light penetrating the enclosure (transmittance). κQ depends on enclosure material optical properties and the angle of incidence of solar radiation. Thus, as the instantaneous values of Qab vary, instantaneous values of κQ can strongly vary too. In practice, an average value during the study period, κQ,av, is needed to convert the integrated light outside the enclosure (Qint,ab) to integrated light inside the enclosure (Qint,en), and to relate the observed (apparent) relative light inside the enclosure, RQ,A (RQ,A = 1.0 at the top of the vegetation inside the enclosure) to relative light outside the enclosure (RQ = 1.0 for a completely open location):
The transmittance for direct light (κQ,dir) of the cover materials used in greenhouses such as glass and transparent plastic, e.g., plexiglass (acrylic), polyethylene films, etc., decreases with increasing angle of incidence (angle between the light beam incident on a surface and the normal to the surface; Pollet and Pieters, 1999; Altuglas International, 2000). For example, the transmittance of glass for direct beam Q is ca. 0.89 for the angle of incidence, ϕ, of 0°, 0.7–0.8 for the angle of incidence of 50°, and only ca. 0.4–0.5 for the angle of incidence of 75° (Pollet and Pieters, 1999, 2002). Thus, transmittance becomes particularly low in morning and evening hours and is generally low in winter months in mid- to high latitudes.
Although the diffuse light transmittance (κQ,diff) of the enclosure materials is less sensitive to the angle of incidence, diffuse transmittance is typically less than the direct transmittance at low angles of incidence (Kittas et al., 1999; Papadakis et al., 2000). For example, diffuse transmittance for glass is 0.72–0.84, for acrylic sheet 0.70, and for low density polyethylene 0.62 (Foster and Stearns, 1971; Pollet and Pieters, 1999; Papadakis et al., 2000). Furthermore, condensation on enclosure surface due to humidity buildup inside the enclosure and surface wetness due to precipitation and dew outside the enclosure can importantly reduce the transmittance. Depending on the angle of incidence, the reduction due to surface water can be 2–10% for glass and 10–25% for various plastic materials (Pollet and Pieters, 2000, 2002). In addition, material aging for various plastic enclosures can alter the material spectral properties and overall light transmittance (Kittas et al., 1999; Papadakis et al., 2000). Thus, the geometry of the enclosure, weather conditions, latitude, and time of the year that alter the angle of incidence for solar radiation importantly affect the enclosure light transmittance. Given the optical properties of the enclosure material for direct and diffuse light, κQ,av is given as:
where κQ,dir,av is the radiation intensity-weighted and angle of incidence corrected daily average κQ,dir, and fdif is the average fraction of diffuse light in total light. fdif depends on atmospheric clearness and cloudiness conditions (Misson et al., 2005; Wang et al., 2006; Still et al., 2009).
Although enclosures for plant growth such as greenhouse facilities are typically built outside high density urban areas with tall buildings, we note that apart from the enclosure transmittance, possible structures outside the enclosure can nevertheless alter the light availability relative to full sunlight. Such effects cannot be considered in retrospective analyses, but we argue that modification of light availability by buildings and vegetation outside the enclosure should be assessed in future studies. Reduction of light intensity by outside structures can be assessed by simultaneous light measurements on top of the enclosure and above the surrounding structures. Even point measurements conducted on overcast days (Parent and Messier, 1996; Messier and Parent, 1997) can provide a realistic estimate of light reduction on the top of the enclosure relative to a completely open location (e.g., Pons et al., 1993), but longer-term continuous measurements at least over several days are recommended to improve the accuracy. Alternatively, hemispheric photographs can be taken above the enclosure and reduction of both direct and diffuse components of light assessed (Anderson, 1964; Pearcy, 1989; Grimmond et al., 2001). This initially for woodlands designed method can be improved for the use in urbanized areas by using simultaneously visible and near-infrared hemispheric photography (Osmond, 2009, 2010) or hemispheric CCD radiometers (Kuusk et al., 2002; Kuusk and Paas, 2007) that allow for better accounting of scattered light fluxes from vegetation and artificial structures.
Enclosures with Artificial Light: Roles of Illuminaire Depreciation and Distance from Light Source
In the case of wholly artificial light with a constant intensity of Q, the daily light integral incident to a given leaf (mol m−2 day−1) is the product of Q, and photoperiod length (ΔP, h):
Once assessed, Qint is typically assumed to be invariable. However, this does not consider that light intensity of any illumination source decreases in time due to a variety of reasons. The light output of lamps slowly decreases in time (lamp lumen depreciation), e.g., due to bulb wall darkening, phosphor exhaustion, filament depreciation, etc., that follow lamp-specific time kinetics. According to manufacturer’s (Philips, Osram, Sylvania, General Electric) specifications, the reduction of light level of most widely used gas discharge lamps during a typical experiments of 2–5 months is only 1–3%. However, the light output of fluorescent lamps decreases somewhat faster, 5–10% over 2–5 months (DiLaura et al., 2011). On the other hand, luminaire dirt depreciation can dramatically reduce light output if the luminaire surfaces are not regularly cleaned (e.g., Clark, 1966), but such effects cannot be considered a posteriori on the basis of information typically reported in plant acclimation studies. At most, we estimate that such problems can result in changes in light availability by 10–20%. On the other hand, changes in lamp spectra during lamp aging can importantly alter plant extension growth (Diffey, 1988), but again, this cannot be considered in retrospective analyses with any degree of accuracy.
A much larger source of uncertainty can result from the circumstance that the illumination source is at a finite distance r from the chamber floor. This is important as the intensity of light at any height, h, in the growth chamber without plants, QL(h), is expected to decrease with the distance from the radiation source, d = r − h. For a point light source with completely isotropic radiation, the reduction of light intensity without any obstructing elements follows the inverse square law (Gates, 1980):
where Q0,L is the light intensity at the lamp surface. In practice, light sources used for plant growth have finite sizes and are equipped with reflectors, and cannot therefore be considered isotropic point sources. For these light sources, the reduction of light intensity depends on the geometry of light source, e.g., bulb shape and reflector geometry. The reduction of light intensity in plant growth chambers also depends on the radiative characteristics of growth chamber walls, and in practice, empirical functions need to be derived to describe the actual distance-dependent reductions in light intensity (see Measurement of Light Fields of Common Lamps Used in Plant Growth Studies, Figure 1).
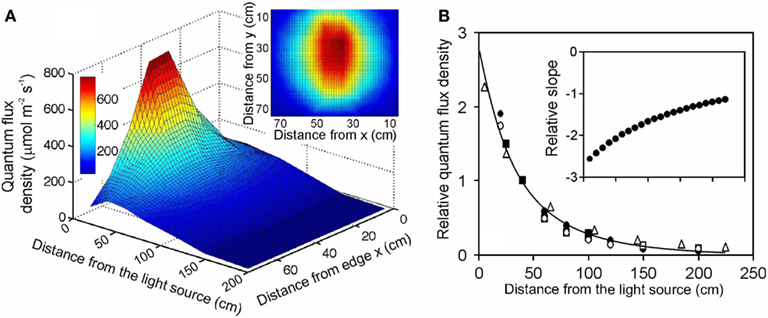
Figure 1. Illustration of (A) the light field of a quartz metal halide lamp with opalized elliptical bulb (Philips Master HPI Plus Daylight 400 W) embedded in a rectangular low bay (length × width × height: 480 × 300 × 160 mm) Start SM HPI-TE40 luminaire (C Luce Srl., Truccazzano, Milan, Italy) and (B) the normalized change of light intensity for four different light sources: filled circles – the same light source as in (A) open squares – the same lamp, but embedded in a circular high bay (height of 548 mm and diameter of the luminaire window of 488 mm) Easy C Base HPI-BU luminaire (C Luce Srl.); open circles – quartz metal halide lamp with clear tubular bulb (Philips Master HPI-T Plus 400 W) in the Start SM luminaire; open triangles – fluorescent tube (Polylux XL, F36W/840, General Electric, Inc.) embedded in a Philips TMS022 luminaire (1225 × 80 × 56 mm). The light field was measured with a LI-190 quantum sensor (Li-Cor, Inc., Lincoln, Nebraska, USA) every 0.2 m from the lamp distance using a black squared board (0.8 m side length) with 64 regularly spaced measurement locations (altogether 7 heights, giving 448 measurements). The inset in (A) demonstrates a representative light field taken at 20 cm from the lamp surface (x and y correspond to the distance from the edge of the board). The relationship between lamp distance and light intensity in (B) was developed for averages measured for the central 30 cm × 30 cm area, and the data were normalized with respect to the measurements at 40 cm from the luminaire surface. For comparison, data for a high pressure sodium lamp with a clear tubular bulb (Philips, Master SON-T PIA Plus 600 W) from Buck-Sorlin et al. (2010) are also demonstrated (filled squares). The data in (B) were fitted Eq. 12, and the inset demonstrates changes in relative slope (m−1) calculated as where Δy and Δx are finite changes in the function value and argument, and is the average function value over the given finite range.
When the plants are enclosed in the chamber, the light available to the leaves at different depths in the canopy is driven both by the distance from the light source and cumulative leaf area from canopy top to given canopy depth, Lc(h). In a most simple form following the Lambert–Beer law (Monsi and Saeki, 1953), the light intensity incident to the foliage at given height h, Q(h), is:
where k1 is the extinction coefficient for the artificial light, and QL(h) (Eq. 6) provides a light intensity incident to a given layer in the canopy. The key implication of this equation is that the light gradient is much stronger with artificial light than with natural illumination, for which r − h is very large relative to h, and thus, QL is a constant equal to light intensity above the canopy (standard Lambert–Beer model). Another important implication for calculating the average light integral at different depths in the canopy is that the light integral will inevitably change for growing plants continuously increasing in height unless the distance between the light source(s) and plants is not kept constant. On the other hand, raising the height of the light source(s) to maintain the light integral for the top of the canopy, will unavoidably reduce the light for the bottom of the canopy. Thus, estimation of an average Qint gradient through the canopy would require frequent measurements of light profiles within the developing canopy. Additional complications arise from reflectance of chamber walls, non-homogeneous incident light fields, etc., and in practice, highly complex light gradients can occur within growth chambers such that Eq. 6 is a crude simplification (Chelle et al., 2007; Delepoulle et al., 2009) and prediction of the dynamics of the light field in growing plant stands can be an highly tedious task (Chelle et al., 2004, 2007; Delepoulle et al., 2008). In fact, each chamber can even be considered a unique radiative transfer system, and numerical approaches may be needed for precise description of light environment (Chelle, 2005; Chelle et al., 2007). Parameterization of such numerical models requires highly detailed information on chamber, plant, and lighting geometry that is typically not available. In fact, even the distances between the light source and chamber floor and vegetation top were not reported in any of the studies investigating light gradients in plants grown with artificial illumination (Table 1 for the studies). In the current study, a simplified method is developed based first on estimation of a generalized light intensity vs. distance relationship and using this relationship to determine relevant light field characteristics for the specific studies (see Measurement of Light Fields of Common Lamps Used in Plant Growth Studies,” and “Estimation of Dynamic Changes in Light Profiles in Growth Chambers).
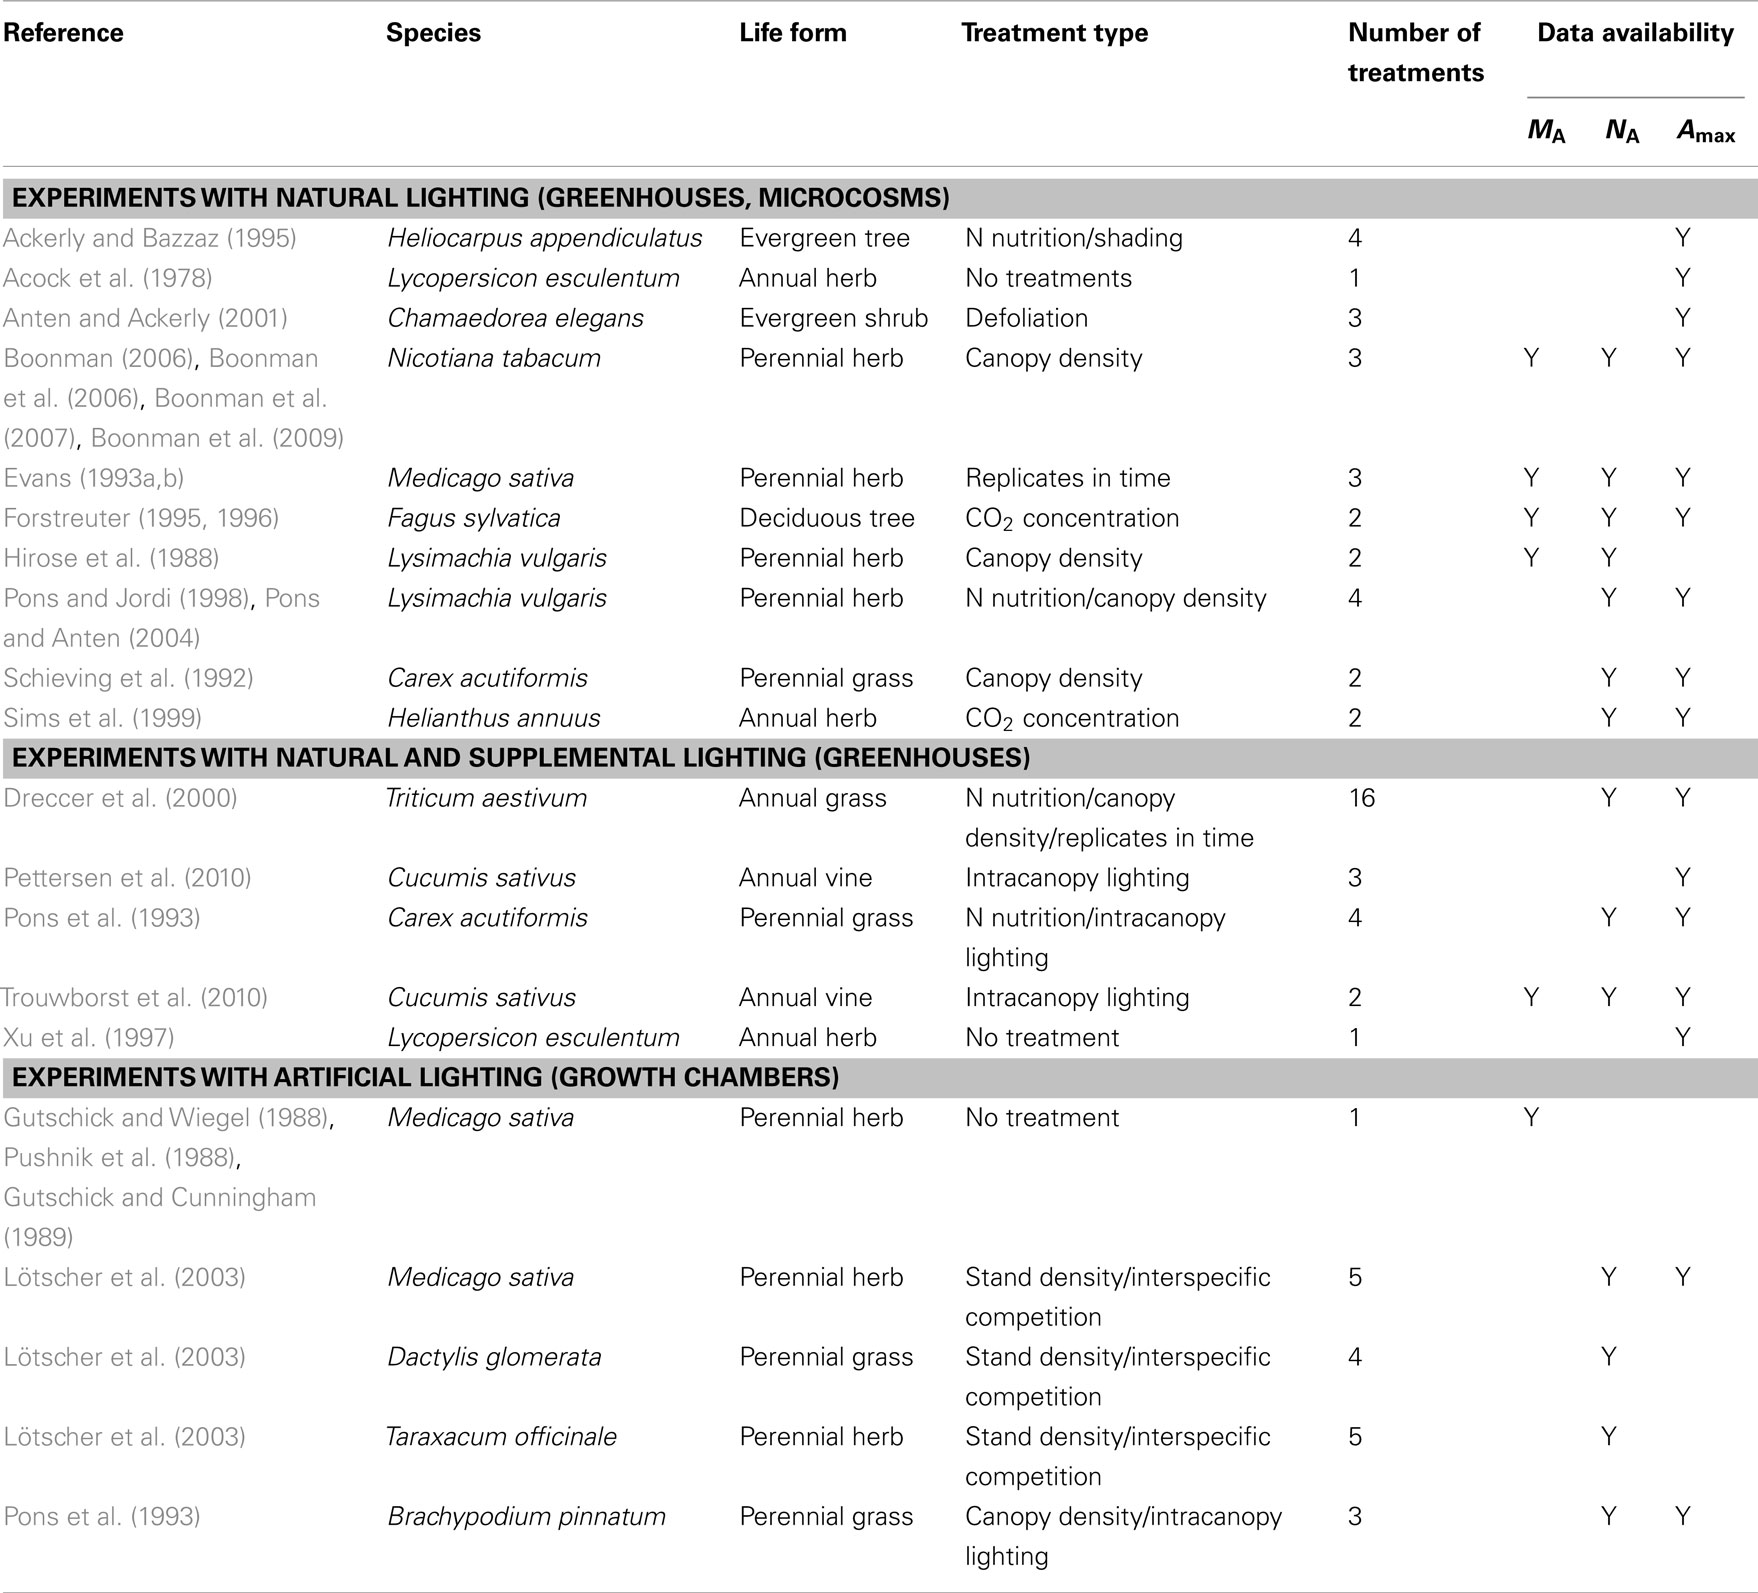
Table 1. Analyzed studies investigating within-canopy plasticity in foliage dry mass per unit area (MA), nitrogen content per area (NA), and photosynthetic capacity (Amax) under different treatments in artificial environments.
Enclosures with Combined Natural and Supplemental Artificial Light
The situation is even more complex when plants are simultaneously exposed to both natural and artificial light as is common practice in greenhouses operated over the entire year in seasonal climates. The total light input to the plant under such circumstances is the sum of artificial and natural light. As discussed above, the intensity of artificial light sources varies relatively little, and the major source of variation of light incident to plant foliage is due to the distance between plants and the light source. In contrast, natural light input strongly varies between days and seasons and its intensity is also importantly affected by enclosure transmittance. Thus, it is difficult to obtain a constant daily light integral incident to vegetation over a certain time period (Ferentinos et al., 2000; Ferentinos and Albright, 2005; Seginer et al., 2006; Ioslovich, 2009). In studies on within-canopy light acclimation using combined lighting, no attempt has been made to compensate for temporal variations in natural light by changing the artificial light input. Thus, an effort is needed to obtain the integrated light over the standardized time period.
For combined lighting, the incident quantum flux density by artificial light source is given by Eq. 7, and an analogous equation based on Lambert–Beer law can be employed to describe the reduction of natural light within the canopy. For both components of light:
The effective light extinction coefficients for artificial (k1) and natural (k2) light can be different due to different lighting geometries, and k2 varies during the day and season due to differences in solar position and sky conditions. As we are interested in integrated light incident to the plant foliage, Qint(h), we rewrite the equation as:
where Qint,ab is the average integrated quantum flux density above the enclosure, and kint is the effective canopy extinction coefficient characterizing the penetration of integrated radiation during the period of interest. The total average integrated quantum flux density at the top of the canopy (Lc = 0) at height h0 is given as:
Equations 9 and 10 predict that the contribution of artificial light decreases with increasing depth in the canopy due to reduction of artificial light intensity with the distance from the light source. This needs to be considered when estimating dynamic changes in light during plant growth. The relative quantum flux density, RQ, provided by most studies is Qint(h)/Qint(h0), and is driven by the share of light at the top of canopy between artificial and relative light, by the distance from canopy top and light extinction by vegetation (Eqs 9 and 10).
Materials and Methods
Studies on Within-Canopy Variations in Key Foliage Structural, Chemical, and Physiological Traits in Artificial Environments
A thorough literature survey was carried out to find studies on acclimation of key foliage traits to within-canopy light gradients in artificial environments. In particular, focusing on studies investigating within-canopy variations in leaf dry mass per unit area (MA), leaf nitrogen content per area (NA), and photosynthetic capacity (Amax). Altogether data from 25 papers were included in the analysis providing information for 70 study × species × treatment combinations (Table 1).
Estimation of Enclosure Light Transmittances
When average transmittance values of the enclosure, κQ,av, were available in the original study, we used these values: (Anten and Ackerly, 2001) – 0.27; (Pons et al., 1993) – 0.48; (Dreccer et al., 2000) – 0.60; (Trouwborst et al., 2010) – 0.62. However, unrealistic values of κQ,av were reported in some studies (e.g., a value of 0.85 in Sims et al., 1999), suggesting that measurements of transmittance corresponding to mid-day only were used, thereby ignoring the angular dependence of transmittance [see Theory: Light in Manipulated Environments (Microcosms, Greenhouses, Growth Chambers)]. In these cases, and when κQ,av was not available, it was derived according to Eq. 4. In derivation of κQ,av, data on transmittance for direct light at different angles of incidence, κQ,dir(Φ), and for diffuse light, κQ,dif, for various enclosure wall materials were taken from Nijskens et al. (1985), Altuglas International (2000), Papadakis et al. (2000) and Pollet and Pieters (2002). For average κQ,dir,av over the period used to estimate Qint (see Enclosures with Natural Lighting), the daily time-course of quantum flux density at specific times of the year and geographic latitude was predicted according to Campbell and Norman (1998), and an average κQ,dir,av corresponding to the time of the study was derived. If the values of the fraction of diffuse light over the study period, fdif, had been reported in the original studies, these could have been used in Eq. 4. However, as this information was not available in any of the studies, a global annual average value of 0.42 (Mercado et al., 2009) was used, and κQ,av calculated.
Measurement of Light Fields of Common Lamps Used in Plant Growth Studies
To evaluate the overall effect of changes of the distance between light source and vegetation, and develop a generalized distance vs. light intensity relationship, light fields were measured for four characteristic light sources used in plant growth studies: (1) a quartz metal halide lamp with elliptical opalized bulb (Philips Master HPI Plus Daylight 400 W) embedded in a rectangular low bay (length × width × height: 480 × 300 × 160 mm) Start SM HPI-TE40 luminaire (C Luce Srl., Truccazzano, Milan, Italy); (2) the same lamp, but embedded in a circular high bay (height 548 mm and the diameter of the luminaire window 488 mm) Easy C Base HPI-BU luminaire (C Luce Srl.); (3) quartz metal halide lamp with clear tubular bulb (Philips Master HPI-T Plus 400 W) in the Start SM luminaire; (4) fluorescent tube (Polylux XL, F36W/840, General Electric, Inc.) embedded in Philips TMS022 luminaire (1225 × 80 × 56 mm). The light field was measured with a LI-190 quantum sensor (Li-Cor, Inc., Lincoln, Nebraska, USA) every 0.2 m from the luminaire surface using a black squared board (0.8 m side length) with 64 regularly spaced measurement locations (Figure 1A). For each lamp, best fit relationships between distance from the luminaire and light intensity were developed for average quantum flux densities measured for the central 30 cm × 30 cm area. Using different areas from 10 cm × 10 cm to 60 cm × 60 cm for averaging did not qualitatively change the shape of the relationship. Although multiple light sources may be simultaneously used with overlapping light fields at the bottom of the enclosure, the horizontal distance of the lamps is typically adjusted such that the light fields overlap relatively far from the light source (Chelle et al., 2007; Delepoulle et al., 2009; Buck-Sorlin et al., 2010). In our study, we estimated that for multiple low bay illuminaires spaced 0.5 m apart, light intensity for the central 30 cm × 30 cm part used for averaging in our study (Figure 1B) is 1–2% (0.2 m from the lamp) to 20–30% (0.8 m from the lamp) larger than for a single luminaire (data not shown). Thus, this simulation suggests that strong light gradients are also present with multiple light sources. Clearly light gradients and the uniformity of light field can be importantly altered by varying the number of lamps and their spacing, and for smaller enclosures by altering the wall reflectance characteristics (Chelle et al., 2007; Delepoulle et al., 2008, 2009; Buck-Sorlin et al., 2010), but these effects cannot be accurately considered in retrospective analyses.
Starting from the classical inverse square relationship (Eq. 6), various inverse power models were tested to describe the reduction of light intensity with distance d = r − h from the light source, Q(d). An empirical model in the form
where g1–g4 are empirical parameters, was found to best describe the reduction of light intensity with the distance from the light source for all different light sources (r2 = 0.995–0.9999, Table 2).
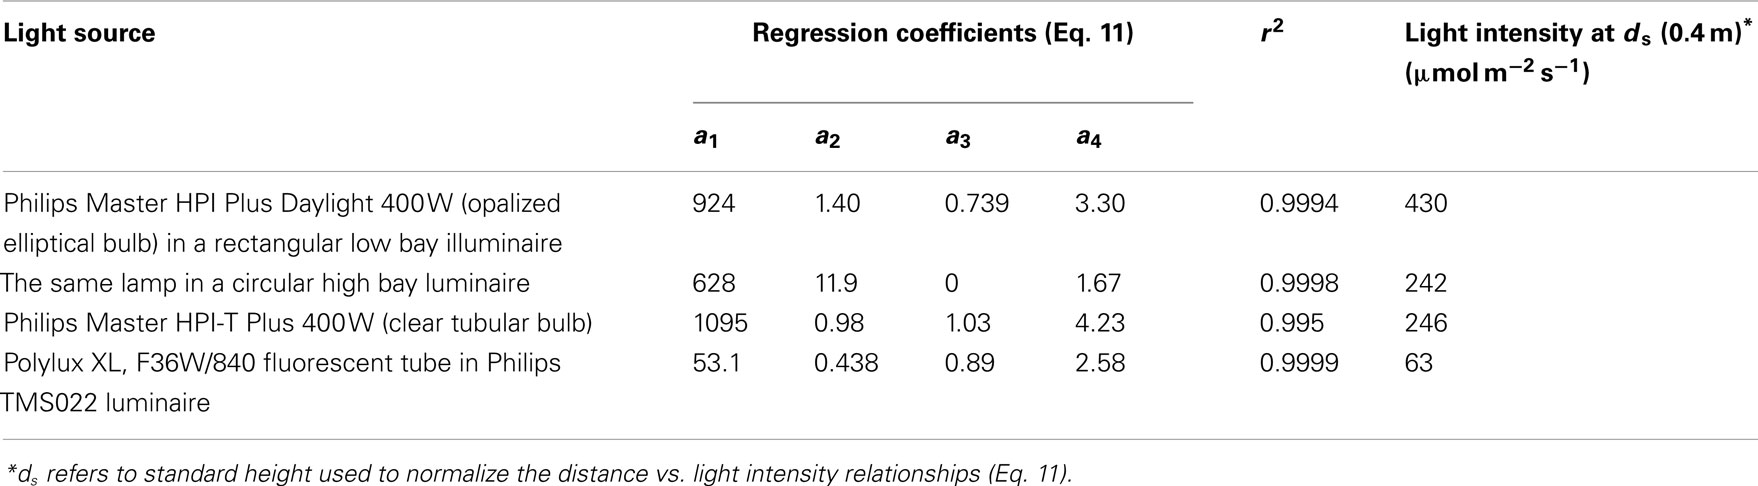
Table 2. Distance-dependent changes in light intensity for four different plant growth light sources.
The light intensity of different lamps differs due to lamp output and illuminaire characteristics, determining the effective solid angle of light, and resulting in different parameter values g1–g4 of Eq. 11 (Table 2). Therefore, the data were normalized with respect to the measurements conducted at 0.4 m from the lamp surface (standard distance, ds), and a best fit relationship was developed for all standardized data pooled (r2 = 0.975, P < 0.001, Figure 1B):
where d is in m. All lamps closely fit this relationship, demonstrating that it adequately captured the shape of the distance-dependent reductions of light. This equation also fit an independent dataset for a high pressure sodium lamp with a clear tubular bulb (Philips, Master SON-T PIA Plus 600 W) from Buck-Sorlin et al. (2010; Figure 1B).
Overall, it is hard to assess the error in derivation of a posteriori estimates of lamp height vs. intensity relationships. We suggest that the degree of deviation of data points for different lamps from the best fit general relationship (Figure 1B) can be considered as a measure of accuracy of this method. The deviation for different lamps at heights different from the standard height was 3–50%, on average 22% for all data points (Figure 1B).
Estimation of Dynamic Changes in Light Profiles in Growth Chambers
The generalized relationship between the distance from the lamp and quantum flux density relative to the measurement at standardized height ds of 0.4 m (Eq. 12) was further employed to determine the actual distance-dependent light gradient in specific studies. The studies reported the quantum flux density at the top of the vegetation, Q(h0), but did not report the distance between the lamp and vegetation (r − h0). The key issue in using Eq. 12 for prediction of the actual light gradient is to determine this distance that allows for conversion of the relative dependence to absolute scale going through Q(h0). This was achieved by considering that the light intensity at the standard height ds of a given lamp, Q1(ds), together with the information of the overall light output of the lamp (μmol s−1) can be used to estimate the light intensity at a given height for another lamp with different output. The photosynthetic quantum output of a lamp is given by its lumen output, Φ, and its lumen/quantum conversion factor, χ (lm s μmol−1). Thus, for another lamp, the light intensity at the standard height, Q2(ds), is given as:
where Φ1 is the lumen output of the first and Φ2 of the second lamp, and χ1 and χ2 are the photometric to quantum unit conversion factors for the first and the second lamp. We used Philips SON-T-600 W as an independent standard lamp (the light intensity at a distance of 0.4 m based on the data of Buck-Sorlin et al., 2010). Using this estimate, we calculated the light intensity at the standardized height for all the light sources used in different studies. The lumen outputs were taken from manufacturers specifications and χ values from Thimijan and Heins (1983). The estimates of Q(ds) along with the information on Q(h0) and vegetation height (h0) reported in original studies were further used to compute r − h0 and r from Eq. 12. To quantitatively evaluate the importance of considering the distance from the lamp, we estimated the change in light intensity at the top of plants for stands of hypothetical height (Gutschick and Wiegel, 1988; Gutschick and Cunningham, 1989; Pons et al., 1993; Lötscher et al., 2003; Pettersen et al., 2010).
To gain further insight into the effects of distance-dependent changes in light intensity, we calculated the integrated quantum flux density during foliage growth (Qint,G) using the study-specific relationships between light intensity and distance. For canopies developing mainly from the top such as herbs and graminoids primarily carrying leaves on parent shoots and tillers with few elongated basal leaves, the Qint,G was simply taken as the integrated quantum flux density at the vegetation height at a particular time. We acknowledge that this is a simplified estimate as it does not consider elongation of older phytomers and growth of new tillers into the expanding canopy. Nevertheless, phyllochron (phytomer formation) is a relatively non-plastic trait, and new leaves are generally not emerging from the sheath of the previous leaf until the older leaf has attained ca. 50% of its final length (Schnyder et al., 1987; Nelson, 2000). Given also the erect habit of grass foliage, we argue that Qint,G estimated this way for tillering grasses provides a realistic estimate of light environment during the formation of the bulk of the leaves. Average quantum flux density during foliage lifetime (Qint,av) was further calculated as the average of Qint,G and integrated quantum flux density at the time of the measurements (Qint,C). Calculating the average value this way assumes that the amount of shading due to canopy development increases linearly in time.
In contrast, in graminoids with primarily basal growth such as tuft-forming Carex species, determination of Qint,G is more complex. In these species, leaves continuously extend from basal leaf portions. The leaf parts formed earlier have been exposed to higher irradiance than the leaf parts developed later when there is already considerable shading by upper canopy elements. In growth chambers, the maximum irradiance experienced by uppermost leaves during their growth is that provided by the light source to the bottom of the chamber, Qint,B. For the next lower section, as a first approximation, Qint,G is the product of Qint,B and current relative light at that layer, RQ. However, as the upper layers have not yet been fully developed at the time when the given lower layer had developed, we estimated Qint,G as the product of Qint,B and the average of RQ of the next two upper layers (typically 10 cm thick layers as sampled in original studies). With leaf elongation, leaf Qint continuously increases as foliage becomes positioned closer to the light source. Given a layered canopy, and assuming a constant leaf elongation rate, average Qint during leaf lifetime for given leaf layer i was estimated as:
where Qint,L(n) is the integrated quantum flux density without plants for layer n, x is the number of leaf layers below the current layer i, and l is the sum of given and upper leaf layers used for calculating average RQ that characterizes the shading of developing canopy (l = 3 for all, except for the uppermost layer: l = 1, and for the layer below the uppermost layer: l = 2).
Estimation of Changes in Light Profiles for Studies with Combined Natural and Supplemental Lighting
Only one study (Pons et al., 1993) reported the variation in the contributions of artificial and natural light along the canopy. Other studies provided data on relative light or on integrated light based on the sum of supplemental and natural light. For these studies, we first estimated the height profile of artificial light from Q(h0) and canopy height as for studies with artificial light only. Thereafter, we evaluated the overall share of incident light between natural and artificial light. For natural light, if available, we used the estimates provided by original studies (Pons et al., 1993; Trouwborst et al., 2010). For other studies we derived an estimate as described in the Section “Estimation of Integrated Incident Light Over A Standardized Time Period” and corrected this for greenhouse transmittance. For studies reporting leaf area index profiles, we fit Eq. 9 to the data by minimizing the sum of squares between estimated and measured Qint or RQ. As fitting both the extinction coefficients k1 and kint (Eq. 9) simultaneously yielded often unrealistic estimates for the extinction coefficient(s), a single extinction coefficient for both artificial and natural light was used. If leaf area index profiles were lacking, we used canopy light profiles in relation to depth into the canopy, h0 − h, instead of Lc, and fitted an apparent extinction coefficient, wj .
Two studies included treatments with intracanopy lighting (Pettersen et al., 2010; Trouwborst et al., 2010). For these treatments, side illumination was included in the height profile of artificial light QL(h), and Eq. 9 was re-fitted as above for all other treatments.
The integrated light during foliage development, Qint,G, is the sum of artificial and natural light at the time of foliage development. The contribution of artificial light for all species was found as for the studies with artificial light only. Natural light during foliage formation for herbs and tillering grasses growing from apex is equal to that at the top of vegetation during the study. However, for turf-forming graminoids, the intensity of natural light during growth at leaf base decreases due to canopy development. For these species, natural light was taken as the average of light in the current and the next upper layer at the time of sampling as with artificial light.
For species with apical growth, average light during leaf lifetime, Qint,av, was found as the average of Qint,G and Qint,C. For species with basal growth, Qint,G for artificial light was computed by Eq. 14, while Qint,G for natural light was taken as the average of light in the current and the next two upper layers at the time of sampling.
Estimation of Integrated Incident Light Over a Standardized Time Period
For artificial light, the leaf light availability estimates, Qint,C, Qint,G, and Qint,av, are derived assuming that lamp light output does not change in time (Eq. 5). However, for studies with natural and with supplemental lighting, inherent variation in natural light intensity incident to enclosures due to day-to-day and seasonal variations in a given study and among studies due to different integration periods and times of measurement implies that it is important to derive a standardized estimate of incident integrated natural light. Typically, in acclimation studies, average integrated quantum flux density of 3–90 days prior to foliage sampling is used as an estimate of leaf light availability (Klein et al., 1991; Barker, 1996; Le Roux et al., 1999; Koike et al., 2001; Casella and Ceulemans, 2002; Fleck et al., 2003; Niinemets et al., 2004). On the other hand, it has been demonstrated that stable values of Qint vs. leaf trait relationships are observed with average integrated light of 30–60 days following leaf formation (Niinemets et al., 2004). We estimated the dates of budburst and leaf formation based on information on the dates of the start of the experiment, dates of seed germination, and whenever pertinent, on the rate of leaf formation and longevity, reported in original studies. We further estimated a standardized average Qint for 50 days following budburst or seed germination for all studies. This estimate was derived on the basis of a global gridded database of shortwave daily radiation data from the NASA Langley Research Center Global Energy and Water Cycle Experiment (GEWEX 3.0, http://www.gewex.org/srbdata.htm; Cox et al., 2006; Fritsen et al., 2011; Stackhouse et al., 2011). Dates of the experiments and coordinates of study sites were extracted from the papers and shortwave radiation at each pixel was estimated from the 1°× 1° gridded data. Shortwave radiation data were further converted to PAR (photosynthetically active radiation, W m−2) using a conversion factor of 0.434 (Ross and Sulev, 2000). Thereafter, PAR data were converted to photosynthetic quantum flux density using a representative Q/PAR conversion factor of 4.56 μmol J−1 (Dye, 2004). Finally, average integrated values of Qint for 50 days after leaf formation were derived.
Analyses of the Effects of Different Light Estimates on Foliage Structural, Chemical, and Physiological Traits
We used linear and non-linear regressions in the form y = a1 xb1c and y = a2Ln(x) + b2 to fit the statistical relationships among leaf traits and current, growth and average integrated quantum flux density for all studies. All three functions have often been employed in investigating the effects of light on foliage traits (e.g., Hirose et al., 1988; Niinemets et al., 2004, 2010; Pons and Anten, 2004).
The studies analyzed often included multiple treatments (Table 1), but the correlations with foliage traits within any specific treatment were generally similar for Qint,C, Qint,G, and Qint,av (data not shown). However, treatments importantly altered canopy height and foliage distribution, and thus, leaf “light history” at given Qint,C. To assess the fundamental differences between different light estimates, we pooled treatments within a given study to assess the explanatory power of different light estimates in determining foliage traits.
As a measure of the goodness of fit, the explained variance, r2, was used. Average r2 values across the studies for given trait with Qint,C, Qint,G, or Qint,av, and for thee different types of regressions were compared by paired samples t-tests. Only two studies with artificial and combined lighting (Gutschick and Wiegel, 1988; Trouwborst et al., 2010) provided information on MA, and thus, only the effect of different light estimates on NA and Amax was tested.
Estimation of the Bias Introduced in Light vs. Foliage Trait Relationships by Use of Apparent Relative Light
To estimate the potential bias of using relative light inside the enclosure, RQ,A, instead of light relative to full sun, RQ, typically estimated in field experiments (RQ = κQ,av RQ,A), in the regressions with plant traits, we fitted linear (y = ax + b, where x is either RQ or RQ,A), and non-linear power (y = a1 xc) and logarithmic (y = a2Ln(x) + b2) regressions to the data and derived regression parameters for key leaf traits, MA, NA, and Amax in each study. As here we were interested in potential bias in regression parameters within and across studies, different treatments were fitted separately. For all regression parameters, we calculated the relative change in a given parameter value (pj) due to use of RQ,A instead of RQ as:
For linear regressions, y = a,RQ RQ + b = a,RQA RQ,A + b =a,RQA RQ/κQ,av + b, where a,RQ is the slope for fits with RQ, and a,RQA is the slope for fits with RQ,A. From this, b is the same for fits with both RQ and RQ,A, and the relative change in the slope a, υ, is equal to 1 − κQ,av.
For power regression, where a1,RQ is the regression slope for fits with RQ, and a1,RQA for fits with RQ,A. Thus, the relative change for the slope is:
Finally, for logarithmic regression, y = a2Ln(RQ) + b2,RQ = a2Ln(RQ,A) + b2,RQA = a2Ln(RQ/κQ,av) + b2,RQA where b2,RQ is the intercept for fits with RQ and b2,RQA the slope for fits with RQ,A. Accordingly, the intercept b2,RQA is equal to b2,RQ + a2Ln(κQ,av). From this, the relative change for the intercept is given as:
Results
Natural Light Transmittance in Greenhouses
For enclosures with natural illumination only, average transmittance (κQ,av, Eq. 4) values obtained were between 0.46 and 0.84, on average (±SE) 0.648 ± 0.042 (Table 3). Only four studies (Pons and Jordi, 1998; Sims et al., 1999; Anten and Ackerly, 2001; Pons and Anten, 2004) reported a value for enclosure transmittance, and these values varied between 0.27 and 0.85 (average ± SE = 0.57 ± 0.16). The exceptional value of 0.27 in (Anten and Ackerly, 2001) refers to an enclosure painted white to result in lower light intensities than in typical greenhouses (Anten and Ackerly, 2001), while the high value of 0.85 for two-layer acrylic greenhouse roof and polyethylene tops of EcoCELL mesocosms (Griffin et al., 1996) employed in Sims et al. (1999) likely reflected mid-day estimations with low solar incidence angle.
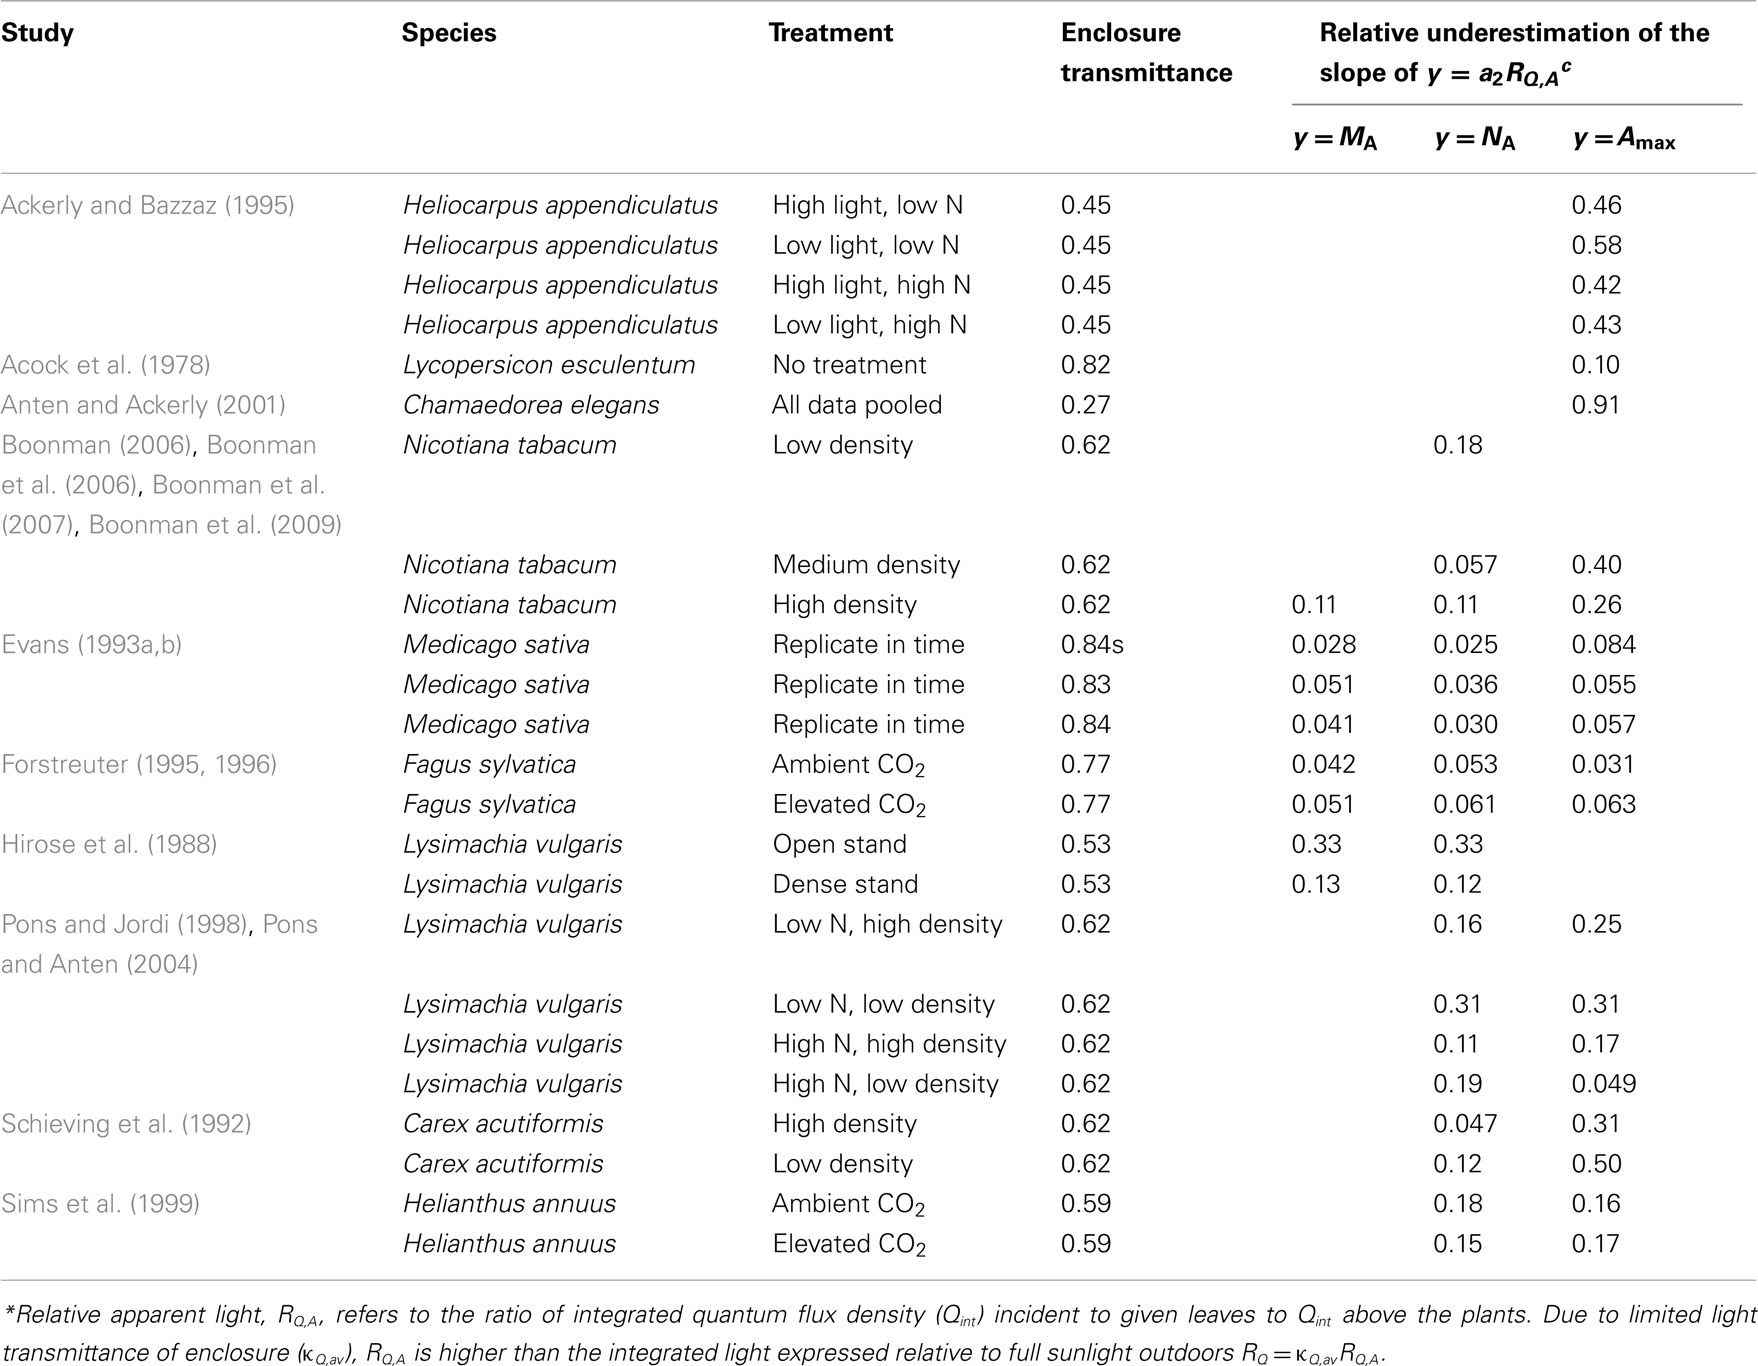
Table 3. Enclosure transmittances and potential biases (Eq. 15) introduced in the non-linear regressions of leaf dry mass per unit area (MA), nitrogen content per area (NA), and photosynthetic capacity per area (Amax) with apparent relative light (RQ,A)* in studies with natural illumination in greenhouses and microcosms.
For greenhouses with supplemental lighting (Pons et al., 1993; Dreccer et al., 2000; Pettersen et al., 2010; Trouwborst et al., 2010), the range of κQ,av was 0.48–0.62. For these studies, the only value derived was for Pettersen et al. (2010; κQ,av = 0.57). The values of κQ,av were employed to convert the RQ,A values to corresponding estimates of RQ (Eq. 3), and in analyzing the bias in light vs. leaf structure regressions (Eqs 15–17).
Changes in Light Gradients in Experiments with Artificial Lighting
After adjusting the standardized distance vs. light intensity curves to specific studies (Eq. 12, see Measurement of Light Fields of Common Lamps Used in Plant Growth Studies and Estimation of Dynamic Changes in Light Profiles in Growth Chambers), light intensity at the top of canopies with varying height, h0, could be determined. These relationships predicted that an hypothetical 50% shorter stand (0.125–0.95 m shorter) compared with the stand at the time of measurements (0.25–1.90 m; Gutschick and Wiegel, 1988; Gutschick and Cunningham, 1989; Pons et al., 1993; Lötscher et al., 2003; Pettersen et al., 2010) had 1.3- to 5.4-fold lower Q(h0). For a given reduction of stand height of 0.2 m, the reduction in light intensity was 1.4- to 3.1-fold, and a 0.5-m reduction in stand height (for stands taller than 0.5 m) was predicted to lead to 2.3- to 3.7-fold lower Q(h0). As the reduction of light intensity with distance from the luminaire, dQ/dd, becomes progressively less with increasing the distance (inset in Figure 1B), this variation in the reduction of light for a certain reduction of stand height reflects the study-to-study differences in the lamp to vegetation distance at the time of sampling.
The gradient in integrated light during foliage development (Qint,G) provides further insight into the effects of varying distance between the lamp and plant due to differences in leaf height. The ratio of Qint,G at the leaves developing last at the top to Qint,G at the bottom of canopy at the leaves developing first (for herbs and tillering grasses), varied between 1.8 and 6.4. The gradient in integrated light at the time of measurements (Qint,C) varied from 4.6 to 47 across the stands, being 1.4- to 12-fold larger than the gradient in Qint,G. Both Qint,G and Qint,C were correlated across the studies (Figure 2A), but the correlation was scattered and the ratio Qint,G/Qint,C increased with decreasing height in the canopy (Figure 2B), indicating that for leaves developing first at the bottom of the canopy, the difference in growth and current light was the largest.
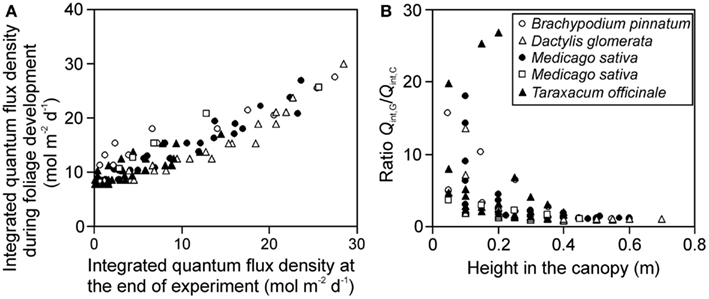
Figure 2. Correlations between the integrated quantum flux density during growth (Qint,G) and at the time of measurements (current, Qint,C) (A), and the ratio of Qint,G/Qint,C in relation to leaf height within the canopy (B) across studies conducted in growth chambers with artificial light only. Qint,G was determined as described in Materials and Methods (see Estimation of dynamic changes in light profiles in growth chambers and Estimation of Changes in Light Profiles for Studies with Combined Natural and Supplemental Lighting) after retrospective determination of plant height vs. incident quantum flux density relationships (see Measurement of Light Fields of Common Lamps Used in Plant Growth Studies and Estimation of dynamic changes in light profiles in growth chambers”). Data for Brachypodium pinnatum are from Pons et al. (1993), data for Dactylis glomerata, Medicago sativa (filled circles) and Taraxacum officinale are from Lötscher et al. (2003). Data for another experiment in Medicago sativa (open squares) are from Gutschick et al. (Gutschick and Wiegel, 1988; Pushnik et al., 1988; Gutschick and Cunningham, 1989).
Variation in the Contributions of Natural and Artificial Light in Experiments with Combined Lighting
In studies with combined lighting, the contribution of natural light to total integrated light at the top of the canopy varied from 24 to 64% (average ± SE = 41.7 ± 1.5%), demonstrating a significant contribution of natural light. Integrated natural light gradient through the canopy (ratio of integrated light at canopy top to bottom) varied from 2.5- to 17-fold, on average 11.7-fold gradient between canopy top to bottom. The gradient in total light (natural plus supplemental) varied from 4.1- to 57-fold (without treatments with intracanopy lighting), on average 26-fold, indicating a much stronger gradient in artificial light, from 8.2- to almost 200-fold, on average 91-fold between canopy top and bottom.
The ratio of natural to artificial light increased with increasing depth in the canopy in all experiments, except for experiments with intracanopy lighting (Figure 3A). The study-to-study variation was large, reflecting differences in stand height, and variations in the share of light at the top of the canopy between artificial and natural light (Figure 3B). The latter variation resulted from differences in integrated natural light (2.2–17.8 mol m−2 day−1) due to differences of enclosure transmittance and time of the year, and from variations in lamp light output and distance between the luminaire and vegetation.
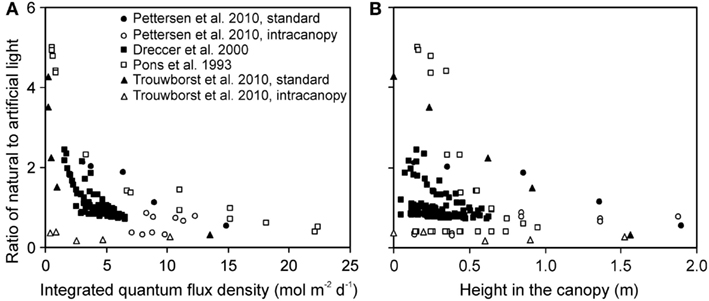
Figure 3. Ratio of the solar to artificial light in relation to total integrated daily quantum flux density within-canopy (A) and height from the bottom of the canopy (B) in studies conducted in greenhouses with supplemental lighting. The share of natural and artificial light was determined as described in Material and methods (see Estimation of Changes in Light Profiles for Studies with Combined Natural and Supplemental Lighting). The studies were conducted in the canopies of the herb Cucumis sativus (Pettersen et al., 2010; Trouwborst et al., 2010), and grasses Carex acutiformis (Pons et al., 1993) and Triticum aestivum (Dreccer et al., 2000). In Cucumis sativus, the experiments were conducted with standard top lighting and with intracanopy lighting, resulting in greater contribution of supplemental lighting at deeper canopy layers (Pettersen et al., 2010; Trouwborst et al., 2010).
Foliage Traits in Relation to Different Integrated Light Estimates
Correlations of NA and photosynthetic capacity per area (Amax) with integrated light estimates were explored by linear, logarithmic, and power regressions across studies with artificial and with combined natural and supplemental lighting (Figure 4 for sample relationships with NA). All three mathematical functions resulted in high degrees of explained variance (r2, Figure 5). The average explained variance obtained with current integrated light at the time of the measurements (Qint,C) and with average light through leaf lifetime (Qint,av) did not generally differ for the three functions (P > 0.2), except for the comparison of r2 for linear and logarithmic regressions with Qint,av. For this comparison, the average r2 for logarithmic regressions was marginally higher than that for linear regressions (P = 0.06). In contrast, average r2 for regressions with Qint,G differed for all functions (P < 0.04), resulting in the following ranking r2(logarithmic) > r2(power) > r2(linear).
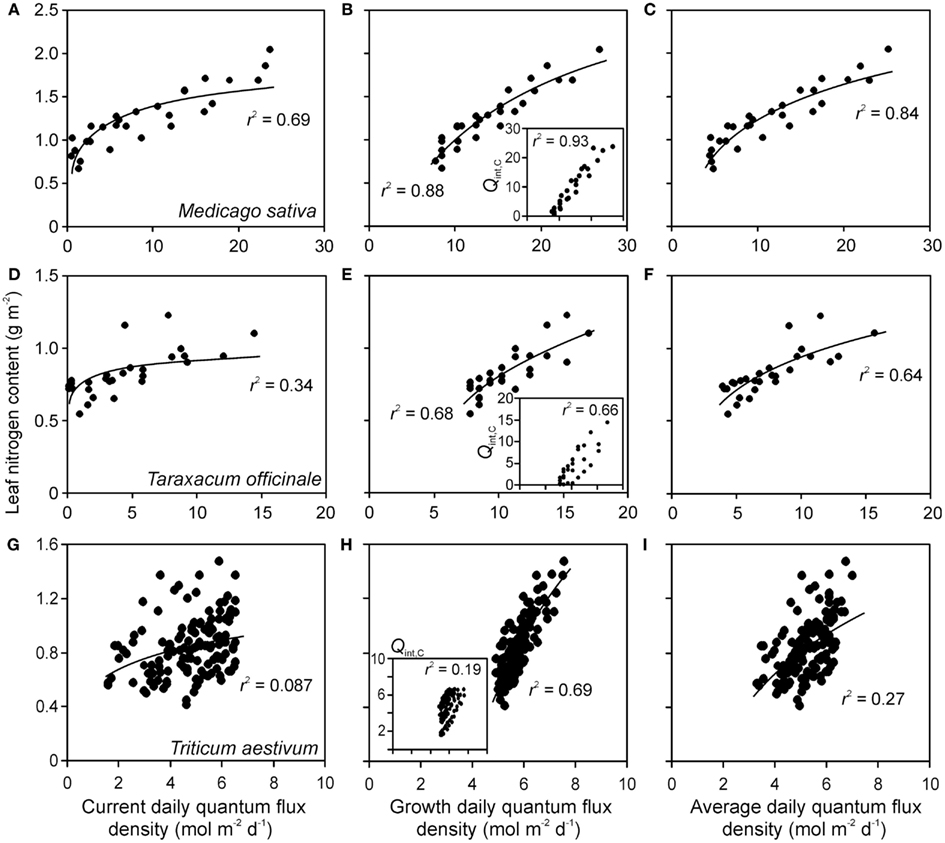
Figure 4. Sample relationships of leaf nitrogen content per area vs. integrated quantum flux density within the canopy at the time of measurements (current, Qint,C) (A,D,G), during growth (Qint,G) (B,E,H) and average of Qint,C and Qint,G (C,F,I) in herbs Medicago sativa (A–C) Taraxacum officinale (D–F) (data of Lötscher et al., 2003) and grass Triticum aestivum(G–I) (data of Dreccer et al., 2000) grown under completely artificial light in growth chambers (Lötscher et al., 2003) or with supplemental lighting in greenhouses (Dreccer et al., 2000). Whenever multiple treatments were available for given species (Table 1), the data were pooled. Insets in (B,E,H) demonstrate the correlations between Qint,C and Qint,G. Data were fitted by non-linear regressions in the form of y = aLn(x) + b, that generally provided the highest degree of explained variance (r2), except for the insets, where r2 values for linear regressions are provided (all regressions are significant at P < 0.001). Details of calculation of Qint,G are provided in Material and methods (see Estimation of dynamic changes in light profiles in growth chambers and Estimation of Changes in Light Profiles for Studies with Combined Natural and Supplemental Lighting).
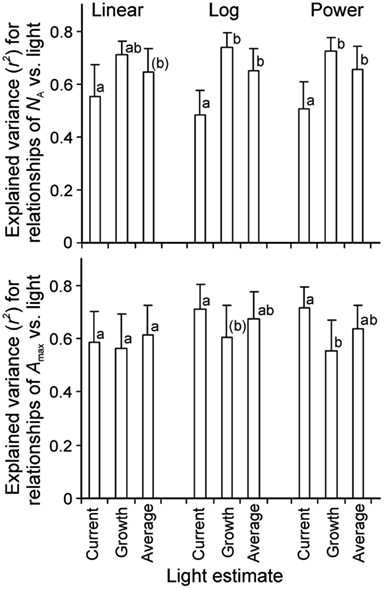
Figure 5. Average (+SE) explained variance of relationships of nitrogen content pear area (NA, n = 7) and photosynthetic capacity (Amax, n = 6) vs. integrated quantum flux density (Qint) within the canopy. The integrated light used in the data fitting was either Qint at the time of measurements (current, Qint,C), during growth (Qint,G), or the average during foliage lifetime until sampling (typically average of Qint,C and Qint,G), and the data were either fitted by linear or non-linear regressions in the form of y = aLn(x) + b (Log) or y = axb (Power). Figure 4 demonstrates sample relationships of NA vs. Qint fitted by y = aLn(x) + b. The r2 data were compared by paired samples t-tests and different letters denote statistically significant differences among average r2 values within given type of regression at P < 0.05, except for letters in parentheses that denote differences at P < 0.1. Only studies with completely artificial light in growth chambers (Pons et al., 1993; Lötscher et al., 2003) or with partial supply of artificial light in greenhouses (Pons et al., 1993; Xu et al., 1997; Dreccer et al., 2000; Pettersen et al., 2010; Trouwborst et al., 2010) were included in the analyses. The species available in these studies were grasses Brachypodium pinnatum (Pons et al., 1993), Carex acutiformis (Pons et al., 1993), Dactylis glomerata (Lötscher et al., 2003), and herbs Lycopersicon esculentum (Xu et al., 1997), Medicago sativa (Lötscher et al., 2003), Taraxacum officinale (Lötscher et al., 2003), and Cucumis sativus (Pettersen et al., 2010; Trouwborst et al., 2010; Table 1 for further information of data sources).
Correlations of NA with Qint,G were generally the strongest, followed by the correlations with Qint,av (Figure 4). Statistical differences among average r2 − s for different light estimates were particularly pronounced for fits with logarithmic and power regressions (Figure 5). In contrast, correlations of Amax with light estimates tended to be the strongest with Qint,C, followed by Qint,av (Figure 5).
Bias Introduced by Apparent Relative Light in Foliage Trait vs. Light Relationships
Although it is established that plant plastic responses to light environment are driven by the absolute integrated light, Qint, relative light is often used in acclimation studies. For enclosure studies, this is often the apparent relative light, RQ,A, i.e., the light intensity relative to that at the top of vegetation in the enclosure rather than light intensity relative to full sunlight (relative to light outside the enclosure, RQ). The use of RQ,A resulted in more extended light range, and shallower leaf trait vs. light relationships (Figure 6 for sample NA vs. RQ,A and RQ relationships). As Eqs 16 and 17 predict, the bias in the regression characteristics scales with the transmittance of the enclosure (κQ,av). The relative change due to use of RQ,A (Eq. 15) in the regression intercept of the logarithmic regression for all key traits studied – MA, NA, and Amax – increased with decreasing κQ,av (Figure 7A). The relative change of the slope of power regression also scaled negatively with κQ,av (Figure 7B; Table 3 for the changes across different studies and treatments), and positively with the scaling exponent (Figure 7C; Eq. 16) for these traits.
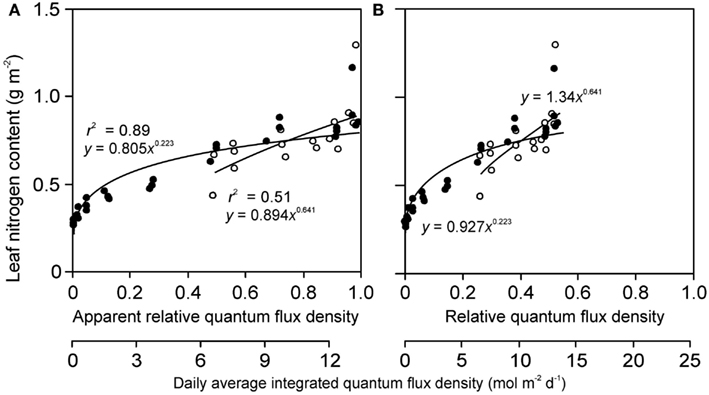
Figure 6. Sample relationships of leaf nitrogen content per area vs. apparent (A) and actual relative quantum flux density (B) in herb Lysimachia vulgaris grown in dense (360 plants m−2, filled symbols) and open (40 plants m−2, open symbols) stands in a greenhouse (data of Hirose et al., 1988). In the original study, the quantum flux density at different locations within the canopy was expressed relative to above canopy values inside the greenhouse. However, this is an apparent estimate of relative quantum flux density (RQ,A) due to reduction of ambient solar radiation by greenhouse roof and walls (greenhouse wall transmittance κQ). As the actual relative quantum flux density (relative to full sun outdoors), RQ, is always less than RQ,A, RQ = κQ RQ,A, the data expressed in relation to true relative light are compressed compared with the data expressed relative to RQ,A. The absolute light scale is also shown for both panels to underscore this fact. Data were fitted by power regressions that yielded the highest degree of explained variance for the given dataset.
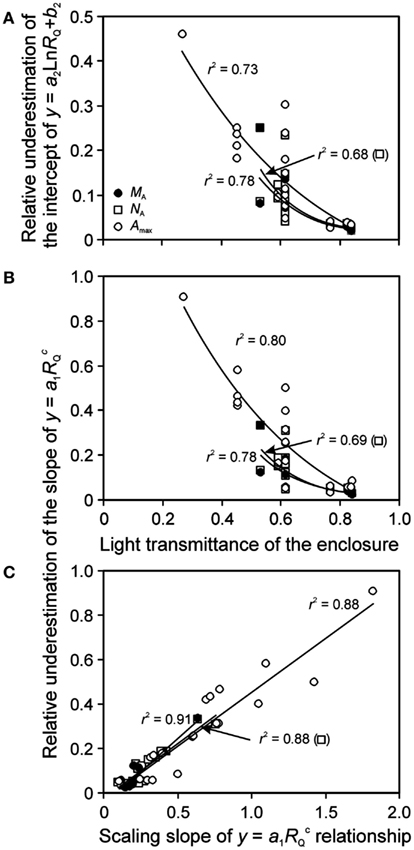
Figure 7. Bias introduced by lack of consideration of reduction of light by enclosure on the shape of leaf structure, chemistry, and physiology vs. relative light (RQ) relationships. Correlations of (A) the relative underestimation of the intercept (b2) of y = a2Ln(RQ) + b2 (Eq. 17) and (B) the relative underestimation of the slope (a1) of (Eq. 16) by using the apparent relative light (RQ,A) with the light transmittance of the enclosure, and the correlation between the slope (a1) and scaling exponent (C) of across the studies investigating within-canopy variation in foliage characteristics in greenhouses (Table 1 for the studies included). The relative change is defined as [pj(RQ) − pj(RQ,A)]/pj(RQ), where pj refers to a given regression parameter. In addition to leaf nitrogen content per area (NA) and photosynthetic capacity (Amax), bias in leaf dry mass per unit area (MA) relationships is also analyzed. The correlations were fitted by non-linear or linear regressions whichever provided the best fit (all regressions are significant at P < 0.001). Data sources are provided in Table 3.
The effect of using RQ,A on regression characteristics was similar for all traits, and the relative changes for different traits were generally strongly correlated with each other (r2 = 0.76 − 0.996), with the exception of weak correlations with the change of the slope of the power function (Eq. 16) for Amax and NA (r2 = 0.15, P = 0.18) and change of the logarithmic function intercept (Eq. 17) for the same traits (r2 = 0.33, P < 0.05). The numerical values of relative changes of given regression characteristics were generally also not significantly different for different traits. Only the difference in relative change in the slope of power regression for MA was marginally different from that of Amax (P = 0.10 according to a paired t-test).
Discussion
Light in Artificial Environments
As demonstrated in this study, light in artificial environments differs from outdoor light in several important respects. First, in enclosures with natural illumination, maximum light intensity is always less than that outdoors due to light absorption and reflection by enclosure surface (Table 1). Second, in studies with artificial lighting, light gradients in vegetation are not only dependent on canopy characteristics, but are also strongly driven by the distance between light source(s) and vegetation (Figure 1; Poorter et al., 2012). There have been extensive efforts to mimic the spectral composition of light in plant growth applications to be as close as sunlight and some progress has been made by combining different light sources and improving the spectral output of different lamps (Gaastra, 1970; Heathcote et al., 1979; Cathey and Campbell, 1980; Hartmann and Kaufmann, 1989), but still the light spectrum of artificial growth environments is often far from ideal. In particular, achieving red to far red ratios similar to sunlight is problematic (Cumming, 2011), and such modification in light spectral quality can have important implications on key plant structural and physiological traits (Rousseaux et al., 1996; Pons and de Jong-van Berkel, 2004). On the other hand, a meta-analysis demonstrated a surprisingly weak effect of red to far red ratio on leaf dry mass per unit area (Poorter et al., 2009a). As shown in the current study, distance-dependent reduction of light intensity remains a further inherent major limitation in experiments with top lighting. Furthermore, in experiments with combined natural and artificial lighting both the transmittance effects and distance effects require consideration.
Transmittance of Solar Irradiance by Enclosures
In greenhouse studies, there is surprisingly little information on the average transmittance characteristics in specific experiments. Furthermore, we note that typical measurements of transmittance of greenhouses or environment-controlled enclosures used in plant acclimation studies have been conducted under high solar elevation angles when the solar beams are close to perpendicular to the enclosure surface. As the transmittance decreases with increasing angle of incidence [see Theory: Light in Manipulated Environments (Microcosms, Greenhouses, Growth Chambers)], such point transmittance estimates would significantly underrate the role of enclosure transmittance on daily integrated light. For example, although the transmittance of standard glass is high 0.85–0.9 for perpendicular beam irradiance (Papadakis et al., 2000; Pollet and Pieters, 2000), average glasshouse transmittance is typically on the order of only 0.5–0.6 (Kittas et al., 1999), implying that consideration of enclosure transmittance is of paramount significance.
Multiple factors, including the geometry of the enclosure, weather conditions, latitude, and time of the year can alter the enclosure light transmittance [see Theory: Light in Manipulated Environments (Microcosms, Greenhouses, Growth Chambers)]. Some of these effects are hard to consider a posteriori, as many important details such as the exact geometry of the enclosure, reflectance characteristics of the enclosure materials, etc., are typically not reported in original studies. Thus, we derived the average transmittance values of the enclosure, κQ,av, relying on reported optical characteristics of the enclosure material as dependent on the angle of incidence (Kittas et al., 1999; Papadakis et al., 2000; Pollet and Pieters, 2000). Although a simplified approach was used, transmittances derived in our study (Table 1) were within the general range of values reported for greenhouses (Kittas et al., 1999). In addition, the range of available estimates of transmittance in the within-canopy acclimation studies (Table 1) was similar to the range of κQ,av derived here. Overall, the reported and derived κQ,av values demonstrate that light was reduced by 15–73%, on average 40–50% in greenhouses, indicating that enclosure transmittance is a major factor determining light availability in the enclosure. As discussed in Section “Enclosures with Natural Lighting” surrounding vegetation and buildings outside the enclosure can further reduce the light availability, and in future studies, we suggest that the effects of such structures on incident light availability should be quantified.
Within-Canopy Light Profiles in Studies with Artificial Light
The theory predicts that for a completely isotropic light source, the intensity of radiation decreases with the square of the distance (Eq. 6). However, lamps in plant growth studies are generally not isotropic, and their light field depends on lamp and illuminaire (and reflector) geometry. Nevertheless, light field measurements for typical lamps used in plant studies, standardized with respect to quantum flux density relative to the measurement at a fixed distance from illuminaire surface ds (0.4 m), yielded a single strong empirical relationship between the distance from the lamp and Q (Figure 1, Eq. 12), and this relationship was verified by an independent dataset of Buck-Sorlin et al. (2010; Figure 1). Although a certain departure from the generalized distance vs. intensity relationship is observed for different lamps, the general fit is remarkably good (Figure 1B).
The empirical equation predicted that at 1 m from illuminaire surface, Q is reduced by ca. 10-fold, and at 2 m by 45-fold, indicating a major effect of the distance from the lamp on light intensity (Figure 1). This implies that for artificial lighting, changes in vegetation height during stand development are associated with major changes in light available for developing leaves, as a rule, several-fold changes during plant development. Accordingly, the variation of light during foliage development, Qint,G, is often larger than that in plants growing under natural irradiance (Figure 2). Furthermore, due to distance effect, the overall light gradient from canopy top to bottom is often larger under artificial light, up to 50-fold in our study, than under natural light, typically between 5- and 25-fold (Starzecki, 1975; Hirose and Werger, 1987; Niinemets, 1995; Niinemets and Kull, 1998; Le Roux et al., 1999; Koike et al., 2001), except for field studies with a size hierarchy of individuals (Oberbauer and Strain, 1986; Anten et al., 1998; Hikosaka et al., 1999).
The empirical equation further predicted that the reduction of light intensity with distance, dQ/dd becomes progressively less with increasing distance d from the light source. Thus, the overall sensitivity of integrated plant light to changes in vegetation height (dQint/dh) depends on the initial distance between the lamp and vegetation. The distances between the light source and chamber floor, and plant heights widely varied across the studies, and this did result in large variation in the range of dQint/dh across the analyzed stands. Thus, prediction of changes in light availability in growing plants requires not only information on light intensity at the top of vegetation and plant growth rate, but also information on the distance between plants and lamps. Typically, the distance between the plants and light source(s) is kept relatively short to have high Q at the top of the vegetation, but this inevitably results in large dQ/dd and most sensitive changes in Q with changing vegetation height.
There are few studies reporting height-dependent light gradients in enclosures. As mentioned in Section “Measurement of Light Fields of Common Lamps Used in Plant Growth Studies,” our results on the magnitude of light gradients agree with Buck-Sorlin et al. (2010). On the other hand, Poorter et al. (2012) reported light gradients of 1.5- to 2.2-fold with distance of up to 1.5 m from the pot level for different growth chambers. This smaller range in Poorter et al. (2012) may seem initially inconsistent with the data in Figure 1B, but without information of the distance of pot to light source, we cannot evaluate the steepness of the light gradient, dQ/dd, and directly compare our results to Poorter et al. (2012). Although the variation associated with a posteriori estimations of lamp height vs. light intensity relationships can be potentially large, our predictions and data of Buck-Sorlin et al. (2010) and Poorter et al. (2012) suggest that major variations in light availability due to changes in the distance between the light sources and vegetation elements are inherent to studies with artificial illumination, especially in studies with fast-growing plants such as herbs and grasses.
Light Profiles in Studies with Combined Lighting
Light intensity in greenhouses with supplemental illumination is the sum of natural and artificial light (Eq. 10). As artificial light intensity depends on the distance from light source, and natural light intensity varies during and among days, the contributions of the two light components change in time and within the canopy (Figure 3). Thus, relative quantum flux density, RQ, estimated using instantaneous values of Q as often used in studies on within-canopy light gradients is bound to vary with all these time-dependent alterations. Therefore, RQ based on integrated Q, and integrated Q itself are more pertinent variables to characterize light environment in studies with combined lighting, and we argue that future studies should be based on these estimates only.
There is an overall large variation among the studies in the share of contributions of artificial and natural light at the top of the canopy, more than an order of magnitude, reflecting differences in time of the year of the study, greenhouse transmittance and light output of artificial light sources. Another key implication of distance-dependent changes of artificial light intensity is that the contribution of different light components varies within the canopy (Figure 3), and it changes due to vegetation growth that alters the distance of canopy elements from artificial light source. In the current study, we have proposed a methodology to separate the contributions of artificial and natural illumination based on retrospective analyses of light intensity vs. distance relationships, measured light gradients within vegetation, enclosure transmittance, and integrated average irradiance above the vegetation. We suggest that in future studies, an effort should be made to measure separately light gradients with natural (e.g., artificial light sources temporarily switched off during daytime) and artificial light (during night).
Different Integrated Light Estimates for Studies on Plant Acclimation
There is a general consensus that foliage acclimates to integrated average light rather than to maximum instantaneous light intensity in a given environment (Chabot et al., 1979; Niinemets et al., 2004; Poorter et al., 2009a, 2010). As light availability continuously changes in the lower canopy due to vegetation growth, especially in fast-growing canopies, a key question is to what integrated light signal the foliage acclimates. Foliage structural traits, such as MA, typically are determined early in growing leaves, and after cell wall rigidification, MA of mature leaves is relatively invariable (Naidu and DeLucia, 1997a,b; Yamashita et al., 2002; Oguchi et al., 2006), although in younger leaves, MA may partly acclimate to altered light climate (Pons and Pearcy, 1994; Yamashita et al., 2002).
In the case of NA, it is important to consider that it is the product of MA and nitrogen content per dry mass (NM, NA = MA NM), and within-canopy variation in NA can be driven by both of its components. In tree canopies where a new leaf flush is formed almost simultaneously in the beginning of the growing season, and no new leaves are formed during the rest of the growing season, NM varies relatively little within the canopy, and thus, NA is mainly determined by MA and is therefore expected to respond to the same light signal as MA (Niinemets, 2007; Niinemets and Anten, 2009; Dewar et al., 2012). In fast-growing canopies with continuous leaf turnover, NM can decline in the lower canopy due to induction of leaf senescence that triggers nitrogen resorption (e.g., Niinemets and Anten, 2009), and consequently, NA can also respond to light signals later in the ontogeny. Nevertheless, even in herb canopies that have completed the height growth, high NM values in the lower canopy can be maintained until leaf senescence (Hikosaka et al., 1994; Hikosaka and Hirose, 2001; Yasumura et al., 2007). This implies that in mature herbaceous canopies where leaf senescence in the lower canopy has not yet been induced, NA gradient is also expected to strongly depend on MA.
As with NA, foliage photosynthetic capacity per area (Amax) is the product of MA and photosynthetic capacity per dry mass. Amax is strongly correlated with MA and NA through light gradients (Pons and Anten, 2004; Anten, 2005; Niinemets, 2007; Niinemets and Anten, 2009). Although modifications in Amax in fully developed leaves are constrained by leaf anatomy, Amax can adjust to altered light availability as the result of modifications in nitrogen allocation among rate-limiting photosynthetic proteins and light-harvesting pigment-binding complexes and by changes in chloroplast dimensions (Oguchi et al., 2003, 2005, 2006).
This evidence collectively implies that it is important to analyze light environment through canopy development, especially in short-term experiments with fast-growing species in artificial environments where light changes particularly strongly. However, light gradients are typically assessed in mature canopies immediately before foliage sampling (current Qint, Qint,C). Here we retrospectively assessed Qint during foliage formation (Qint,G), and during foliage lifetime from development to harvesting (Qint,av). The explanatory power of the NA vs. Qint relationships was generally the largest with Qint,G, followed by Qint,av and the weakest relationships were generally observed with current light estimates, especially for non-linear fits (Figures 4 and 5). This agrees with the hypothesis that NA is determined by the early light signal.
Overall, poor relationships of NA vs. Qint,C when multiple treatments are pooled (Table 1 for treatments), and excellent relationships when Qint,G is used as the explanatory variable (Figures 4 and 5) further suggest that part of the treatment effects on within-canopy distribution of foliage traits is actually associated with treatment effects on light environment, e.g., on plant to lamp distance due to changes in plant size, rather than treatment effects on the inherent distribution pattern itself. Testing this suggestion requires additional experiments in growth chambers across different treatments explicitly characterizing foliage light environment through leaf lifetime. Nevertheless, outdoor studies have demonstrated analogous strong effects of early light signals (Niinemets et al., 2004; Oguchi et al., 2006), even influences of light availability during bud-set have been demonstrated (Uemura et al., 2000). However, derivation of growth vs. current light estimates for fast-growing canopies in the natural stands in the field may be more complicated because there is often a pronounced variation in age and size of individuals (Anten et al., 1998; Hikosaka et al., 1999; Hikosaka and Hirose, 2001).
In contrast to the relationships with NA, an opposite pattern was observed with Amax, where the highest explained variances were generally achieved with current, followed by lifetime average and growth light (Figure 5). This suggests that acclimation in photosynthetic capacity can be relatively fast such that current light availability is a stronger determinant of leaf photosynthetic potential than the light availability encountered in the past.
Bias of Using Apparent Relative Light in Fitting Leaf Trait vs. Light Responses
The slopes of regressions of foliage traits vs. integrated or relative light are often used as estimates of foliage plasticity (Chazdon and Kaufmann, 1993; Nicotra et al., 1997; Niinemets et al., 2001; Portsmuth and Niinemets, 2007). Leaf trait vs. light relationships are also employed in exploring the hypotheses about mechanisms of light acclimation, including the hypotheses about optimality and evolutionary stable strategies (Hirose et al., 1988; Hollinger, 1996; Anten and Hirose, 2001; Anten, 2002). Although Qint is the pertinent variable in investigating plant plastic responses to light environment, relative light is still often used. As shown in this study, relative light intensity in enclosures, estimated as the ratio of integrated light inside the vegetation to that at the top of vegetation, RQ,A is an apparent estimate of relative light that is always higher than that estimated relative to full sunlight RQ (RQ = κQ,av RQ,A). Thus, use of RQ,A as the explanatory variable in leaf trait vs. light relationships results in stretched responses (Figure 6), underestimating foliage responsiveness to light. For linear regressions, the relative underestimation of regression slope (Eq. 15) is inversely proportional to κQ,av. In the case of non-linear fits, changes in the regression parameters (slope for the power regression and intercept for the logarithmic regression) scale inversely with κQ,av (Figure 7), but also depend on the other regression parameters (Eqs 16 and 17). As our study demonstrates, use of RQ,A introduces a major bias in the relationships of foliage traits vs. light, and this needs consideration when comparing trait vs. light relationships across studies and in constructing meta-databases on plasticity (e.g., Poorter et al., 2009b, 2010, 2011). Although exact estimation of κQ,av and regression bias may not be always possible, the important point is that relative light vs. trait relationships estimated indoors and outdoors are not necessarily comparable.
Conclusion: Acclimation Studies in Artificial Environments
A number of influential pioneering studies on foliage acclimation to within-canopy light gradients have been conducted in artificial environments (e.g., Gutschick and Wiegel, 1988; Hirose et al., 1988; Schieving et al., 1992; Evans, 1993a,b; Pons et al., 1993; Pons and Jordi, 1998; Pons and Anten, 2004), and artificial environments remain an important platform to gain insight into plant acclimation (Table 1, Poorter et al., 2012). However, the major message of the current study is that light intensity and light gradients can importantly differ among artificial and natural environments. In studies conducted with artificial light, the key issue is that the light gradient depends on the distance between light source and vegetation. This is particularly relevant for studies with fast-growing species such as herbs and grasses, most commonly used in growth chamber and greenhouse studies (Table 1). In enclosures illuminated with natural light, reduction in light intensity by enclosure requires consideration when comparing the shapes of the statistical relationships with those in the field. So far, these important aspects have not been given due consideration. We argue that intrinsic differences in light environment between natural and enclosure studies need to be explicitly addressed in future studies and in meta-analyses summarizing information gained in the past, and recommend that in future studies, the integrated absolute light, Qint, be used as a measure of light availability.
Conflict of Interest Statement
The authors declare that the research was conducted in the absence of any commercial or financial relationships that could be construed as a potential conflict of interest.
Acknowledgments
We thank Thijs Pons (Utrecht University, The Netherlands), and Manfred Forstreuter (Freie Universität Berlin, Germany) for providing unpublished information about the experimental details. We also acknowledge Evi Vaino and Alo Raidaru for skilled technical assistance with light measurements and Kaia Kask and Lea Hallik for invaluable help with data digitizing. The study was supported by the Estonian Ministry of Science and Education (grant SF1090065s07), and the European Commission through European Regional Fund (the Center of Excellence in Environmental Adaptation).
Abbreviations
Amax, leaf photosynthetic capacity per unit area (μmol m−2 s−1); d, distance from the light source, r − h (m); ds, standardized distance from illuminaire surface (taken as 0.4 m in the current study) (m); fdif, fraction of diffuse light; g1 – g4, empirical parameters characterizing distance-dependent reduction in light intensity (Eq. 11); h, height relative to chamber floor (m); h0, top height of vegetation (m); k1, extinction coefficient for artificial light; k2, extinction coefficient for natural light; kint, extinction coefficient for integrated natural light; Lc, cumulative leaf area index (m2 m−2); MA, leaf dry mass per unit area (g m−2); NA, leaf nitrogen content per unit area (g m−2); pj, regression parameter j (Eq. 15); Q, photosynthetically active quantum flux density (μmol m−2 s−1); Q0, Q incident to the canopy (μmol m−2 s−1); Q0,L, Q at lamp surface (μmol m−2 s−1); QL, Q of artificial light without plants (μmol m−2 s−1); Qab, Q incident to enclosure surface (μmol m−2 s−1); Qen, Q penetrating the enclosure material (μmol m−2 s−1); Qint, integrated quantum flux density (mol m−2 day−1); Qint,0, Qint incident to the canopy (mol m−2 day−1); Qint,ab, integrated quantum flux density incident to the enclosure (mol m−2 day−1); Qint,av, average Qint through leaf lifetime (mol m−2 day−1); Qint,en, Qint for light penetrating the enclosure material (mol m−2 day−1); Qint,C, Qint at the time of measurements (mol m−2 day−1); Qint,G, Qint during growth (mol m−2 day−1); Qint,L, integrated quantum flux density for given height in the chamber without plants (mol m−2 day−1); r, distance between the illuminaire surface and chamber floor (m); RQ, relative quantum flux density, i.e., instantaneous or integrated quantum flux density at given location inside the vegetation relative to quantum flux density above the canopy (full sunlight); RQ,A, apparent relative quantum flux density, i.e., relative light in an enclosure; wj, extinction coefficient characterizing reduction of light with depth into the canopy (m−1); ΔP, photoperiod length (h); κQ, transmittance of enclosure material for photosynthetically active quanta; κQ,av, average κQ for Qint and average RQ; κQ,diff, κQ for diffuse light; κQ,dir, κQ for direct light; χ, photometric to quantum unit conversion factor (lm s μmol−1); υ, relative change in regression parameter pj (Eq. 15); Φ, angle of incidence; Φ, lumen output of a lamp (luminous flux, lm).
References
Ackerly, D. D., and Bazzaz, F. A. (1995). Leaf dynamics, self-shading and carbon gain in seedlings of a tropical pioneer tree. Oecologia 101, 289–298.
Acock, B., Charles-Edwards, D. A., Fitter, D. J., Hand, D. W., Ludwig, L. J., Warren Wilson, J., and Withers, A. C. (1978). The contribution of leaves from different levels within a tomato crop to canopy net photosynthesis: an experimental examination of two canopy models. J. Exp. Bot. 29, 815–827.
Altuglas International. (2000). Plexiglas. Acrylic sheet. Optical and Transmission Characteristics. Philadelphia, PA: Altuglas International, Arkema Inc.
Anderson, M. C. (1964). Studies of the woodland light climate. I. The photographic computation of light conditions. J. Ecol. 52, 27–41.
Anten, N. P. R. (1997). Modelling canopy photosynthesis using parameters determined from simple non-destructive measurements. Ecol. Res. 12, 77–88.
Anten, N. P. R. (2002). Evolutionarily stable leaf area production in plant populations. J. Theor. Biol. 217, 15–32.
Anten, N. P. R. (2005). Optimal photosynthetic characteristics of individual plants in vegetation stands and implications for species coexistence. Ann. Bot. 95, 495–506.
Anten, N. P. R., and Ackerly, D. D. (2001). Canopy-level photosynthetic compensation after defoliation in a tropical understorey palm. Funct. Ecol. 15, 252–262.
Anten, N. P. R., and Hirose, T. (2001). Limitations on photosynthesis of competing individuals in stands and the consequences for canopy structure. Oecologia 129, 186–196.
Anten, N. P. R., Miyazawa, K., Hikosaka, K., Nagashima, H., and Hirose, T. (1998). Leaf nitrogen distribution in relation to leaf age and photon flux density in dominant and subordinate plants in dense stands of a dicotyledonous herb. Oecologia 113, 314–324.
Aranda, I., Pardo, F., Gil, L., and Pardos, J. A. (2004). Anatomical basis of the change in leaf mass per area and nitrogen investment with relative irradiance within the canopy of eight temperate tree species. Acta Oecol. 25, 187–195.
Barker, M. G. (1996). Vertical profiles in a Brunei rain forest. I. Microclimate associated with a canopy tree. J. Trop. Forest Sci. 8, 505–519.
Boonman, A. (2006). Plant Acclimation to the Light Gradient in Canopies; Functional Significance and Regulation by Cytokinin. Ph.D. thesis, Utrecht University, Utrecht.
Boonman, A., Anten, N. P. R., Dueck, T. A., Jordi, W. J. R. M., Van Der Werf, A., Voesenek, L. A. C. J., and Pons, T. L. (2006). Functional significance of shade-induced leaf senescence in dense canopies: an experimental test using transgenic tobacco. Am. Nat. 168, 597–607.
Boonman, A., Prinsen, E., Gilmer, F., Schurr, U., Peeters, A. J. M., Voesenek, L. A. C. J., and Pons, T. L. (2007). Cytokinin import rate as a signal for photosynthetic acclimation to canopy light gradients. Plant Physiol. 143, 1841–1852.
Boonman, A., Prinsen, E., Voesenek, L. A. C. J., and Pons, T. L. (2009). Redundant roles of photoreceptors and cytokinins in regulating photosynthetic acclimation to canopy density. J. Exp. Bot. 60, 1179–1190.
Buck-Sorlin, G. H., Hemmerling, R., Vos, J., and De Visser, P. H. B. (2010). “Modelling of spatial light distribution in the greenhouse: description of the model,” in Proceedings of the Third International Symposium on Plant Growth Modeling, Simulation, Visualization and Applications (PMA), 9–13 November, Bejing, China, eds B. Li, M. Jaeger, and Y. Guo (Los Alamitos: IEEE Computer Society), 79–86.
Campbell, G. S., and Norman, J. M. (1998). An Introduction to Environmental Biophysics. New York: Springer-Verlag.
Casella, E., and Ceulemans, R. (2002). Spatial distribution of leaf morphological and physiological characteristics in relation to local radiation regime within 3-year-old populus clones under coppice culture. Tree Physiol. 22, 1277–1288.
Cathey, H. M., and Campbell, L. E. (1980). Light and lighting systems for horticultural plants. Hortic. Rev. (Am. Soc. Hortic. Sci.) 2, 491–537.
Chabot, B. F., Jurik, T. W., and Chabot, J. F. (1979). Influence of instantaneous and integrated light-flux density on leaf anatomy and photosynthesis. Am. J. Bot. 66, 940–945.
Chazdon, R. L., and Field, C. B. (1987). Photographic estimation of photosynthetically active radiation: evaluation of a computerized technique. Oecologia 73, 525–532.
Chazdon, R. L., and Kaufmann, S. (1993). Plasticity of leaf anatomy of two rain forest shrubs in relation to photosynthetic light acclimation. Funct. Ecol. 7, 385–394.
Chelle, M. (2005). Phylloclimate or the climate perceived by individual plant organs: what is it? How to model it? What for? New Phytol. 166, 781–790.
Chelle, M., Demirel, M., and Renaud, C. (2004). “Towards a 3D light model for growth chambers using an experiment-assisted design,” in Proceedings of the 4th International Workshop on Functional-Structural Plant Models, 7–11 June 2004, Montpellier, France, eds C. Godin, J. Hanan, W. Kurth, A. Lacointe, A. Takenaka, P. Prusinkiewicz, T. Dejong, C. Beveridge, and B. Andrieu (Montpellier: UMR AMAP), 192–193.
Chelle, M., Renaud, C., Delepoulle, S., and Combes, D. (2007). “Modeling light phylloclimate within growth chambers,” in Proceedings of the 5th International Workshop on Functional Structural Plant Models, Napier, New Zealand, eds P. Prusinkiewicz, J. Hanan, and B. Lane (Napier: Print Solutions Hawke’s Bay Limited), 57/51–57/54.
Clark, F. (1966). Accurate maintenance factors. Part 2. Luminaire dirt depreciation. Illum. Eng. 61, 37–46.
Cox, S. J., Stackhouse, P. W. Jr., Gupta, S. K., Mikovitz, J. C., Zhang, T., Hinkelman, L. M., Wild, M., and Ohmura, A. (2006). “The NASA/GEWEX surface radiation budget project: overview and analysis, Vol. 6,” in Proceedings of the 12th Conference on Atmospheric Radiation (Madison, WI: American Meteorological Society), 6.
Cumming, I. G. (2011). Red to far-red ratio correction in plant growth chambers. Acta Hortic. 907, 145–149.
Delepoulle, S., Renaud, C., and Chelle, M. (2008). “Improving light position in a growth chamber through the use of a genetic algorithm,” in Artificial Intelligence Techniques for Computer Graphics, eds D. Plemenos and G. Miaoulis (Berlin: Springer), 67–82.
Delepoulle, S., Renaud, C., and Chelle, M. (2009). “Genetic algorithms for light sources positioning,” in Proceedings of the 11th 3IA: International Conference on Computer Graphics and Artificial Intelligence, eds D. Plemenos and G. Miaoulis (Limoges: Universite de Limoges), 11 pp.
Dewar, R. C., Tarvainen, L., Parker, K., Wallin, G., and Mcmurtrie, R. E. (2012). Why does leaf nitrogen decline within tree canopies less rapidly than light? An explanation from optimization subject to a lower bound on leaf mass per area. Tree Physiol. 32, 520–534.
Diffey, B. L. (1988). The stability of light sources: implications for photobiological studies. Photochem. Photobiol. 47, 317–320.
DiLaura, D., Houser, K., Mistrick, R., and Steffy, G. (eds). (2011). 10th Edition of the IES Lighting Handbook. New York: Illuminating Engineering Society.
Dreccer, M. F., Van Oijen, M., Schapendonk, A. H. C. M., Pot, C. S., and Rabbinge, R. (2000). Dynamics of vertical leaf nitrogen distribution in a vegetative wheat canopy. Impact on canopy photosynthesis. Ann. Bot. 86, 821–831.
Dye, D. (2004). Spectral composition and quanta-to-energy ratio of diffuse photosynthetically active radiation under diverse cloud conditions. J. Geophys. Res. 109, D10203.
Evans, J. R. (1993a). Photosynthetic acclimation and nitrogen partitioning within a lucerne canopy. I. Canopy characteristics. Aust. J. Plant Physiol. 20, 55–67.
Evans, J. R. (1993b). Photosynthetic acclimation and nitrogen partitioning within a lucerne canopy. II. Stability through time and comparison with a theoretical optimum. Aust. J. Plant Physiol. 20, 69–82.
Ferentinos, K. P., and Albright, L. D. (2005). Optimal design of plant lighting system by genetic algorithms. Eng. Appl. Artif. Intell. 18, 473–484.
Ferentinos, K. P., Albright, L. D., and Ramani, D. V. (2000). Optimal light integral and carbon dioxide concentration combinations for lettuce in ventilated greenhouses. J. Agric. Eng. Res. 77, 309–315.
Fleck, S., Niinemets, Ü., Cescatti, A., and Tenhunen, J. D. (2003). Three-dimensional lamina architecture alters light harvesting efficiency in Fagus: a leaf-scale analysis. Tree Physiol. 23, 577–589.
Forstreuter, M. (1995). “Bestandesstruktur und netto-photosynthese von jungen Buchen (Fagus sylvatica L.) unter erhöhter CO2-Konzentration,” in Verhandlungen der Gesellschaft für Ökologie, ed. J. Pfadenhauer (Freising-Weihenstephan: Gesellschaft für Ökologie), 283–292.
Forstreuter, M. (1996). “CO2-Abhängigkeit des Gaswechsels (CO2/H2O) von jungen Buchenbeständen (Fagus sylvatica L.) nach Langzeitbegasung bei 350 und 700 μmol mol−1 CO2,” in Verhandlungen der Gesellschaft für Ökologie, ed. J. Pfadenhauer (Stuttgart: Gustv Fischer Verlag), 629–636.
Foster, W. H. Jr., and Stearns, E. I. (1971). Diffuse transmittance of glass. J. Opt. Soc. Am. 61, 60–62.
Fritsen, C. H., Memmott, J. C., Ross, R. M., Quetin, L. B., Vernet, M., and Wirthlin, E. D. (2011). The timing of sea ice formation and exposure to photosynthetically active radiation along the Western Antarctic Peninsula. Polar Biol. 34, 683–692.
Gaastra, P. (1970). “Climate rooms as a tool for measuring physiological parameters for models of photosynthetic systems,” in Prediction and Measurement of Photosynthetic Productivity. Proceedings of the IBP/PP Technical Meeting, TřeboŘ, 14–21 September 1969, ed. I. Šetlík (Wageningen: Centre for Agricultural Publishing and Documentation), 387–398.
Givnish, T. J. (1988). Adaptation to sun and shade: a whole-plant perspective. Aust. J. Plant Physiol. 15, 63–92.
Griffin, K. L., Ross, P. D., Sims, D. A., Luo, Y., Seemann, J. R., Fox, C. A., and Ball, J. T. (1996). EcoCELLs: tools for mesocosm scale measurements of gas exchange. Plant Cell Environ. 19, 1210–1221.
Grimmond, C. S. B., Potter, S. K., Zutter, H. N., and Souch, C. (2001). Rapid methods to estimate sky-view factors applied to urban areas. Int. J. Climatol. 21, 903–913.
Gutschick, V., and Cunningham, G. (1989). A Physiological Route to Increased Water Use-Efficiency in Alfalfa. Technical Report TR239. New Mexico Water Resources Research Institute in cooperation with Department of Biology and Plant Genetic Engineering Laboratory, New Mexico State University, Las Cruces.
Gutschick, V. P., and Wiegel, F. W. (1988). Optimizing the canopy photosynthetic rate by patterns of investment in specific leaf mass. Am. Nat. 132, 67–86.
Hallik, L., Niinemets, Ü., and Kull, O. (2012). Photosynthetic acclimation to light in woody and herbaceous species: a comparison of leaf structure, pigment content and chlorophyll fluorescence characteristics measured in the field. Plant Biol. 14, 88–99.
Hartmann, K. M., and Kaufmann, W. F. (1989). “Solar simulation for growth chambers,” in Environmental Research with Plants in Closed Chambers. Air Pollution Research Report 26. Proceedings of an International Symposium Jointly Organised by the Commission of the European Communities and the Gesellschaft für Strahlen- und Umweltforschung München-Neuherberg, FRG, 9–11 October 1989, eds H. D. Payer, T. Pfirrmann, and P. Mathy (Brussels: E Guyot Sa), 279–293.
Heathcote, L., Bambridge, K. R., and Mclaren, J. S. (1979). Specially constructed growth cabinets for simulation of the spectral photon distributions found under natural vegetation canopies. J. Exp. Bot. 30, 347–353.
Hikosaka, K. (2005). Leaf canopy as a dynamic system: ecophysiology and optimality in leaf turnover. Ann. Bot. 95, 521–533.
Hikosaka, K., and Hirose, T. (2001). Nitrogen uptake and use by competing individuals in a Xanthium canadense stand. Oecologia 126, 174–181.
Hikosaka, K., Sudoh, S., and Hirose, T. (1999). Light acquisition and use by individuals competing in a dense stand of an annual herb, Xanthium canadense. Oecologia 118, 388–396.
Hikosaka, K., Terashima, I., and Katoh, S. (1994). Effects of leaf age, nitrogen nutrition and photon flux density on the distribution of nitrogen among leaves of a vine (Ipomoea tricolor Cav.) grown horizontally to avoid mutual shading of leaves. Oecologia 97, 451–457.
Hirose, T., and Werger, M. J. A. (1987). Maximizing daily canopy photosynthesis with respect to the leaf nitrogen allocation pattern in the canopy. Oecologia 72, 520–526.
Hirose, T., Werger, M. J. A., Pons, T. L., and Van Rheenen, J. W. A. (1988). Canopy structure and leaf nitrogen distribution in a stand of Lysimachia vulgaris L. as influenced by stand density. Oecologia 77, 145–150.
Hollinger, D. Y. (1996). Optimality and nitrogen allocation in a tree canopy. Tree Physiol. 16, 627–634.
Ioslovich, I. (2009). Optimal control strategy for greenhouse lettuce: incorporating supplemental lighting. Biosyst. Eng. 103, 57–67.
Kittas, C., Baille, A., and Giaglaras, P. (1999). Influence of covering material and shading on the spectral distribution of light in greenhouses. J. Agric. Eng. Res. 73, 341–351.
Klein, I., Dejong, T. M., Weinbaum, S. A., and Muraoka, T. T. (1991). Specific leaf weight and nitrogen allocation responses to light exposure within walnut trees. HortScience 26, 183–185.
Koike, T., Kitao, M., Maruyama, Y., Mori, S., and Lei, T. T. (2001). Leaf morphology and photosynthetic adjustments among deciduous broad-leaved trees within the vertical canopy profile. Tree Physiol. 21, 951–958.
Kull, O., and Tulva, I. (2002). Shoot structure and growth along a vertical profile within a Populus-Tilia canopy. Tree Physiol. 22, 1167–1175.
Kuusk, A., Nilson, T., and Paas, M. (2002). Angular distribution of radiation beneath forest canopies using a CCD-radiometer. Agric. Forest Meteorol. 110, 259–273.
Kuusk, A., and Paas, M. (2007). Radiometric correction of hemispheric images. ISPRS J. Photogram. Rem. Sens. 61, 405–412.
Le Roux, X., Sinoquet, H., and Vandame, M. (1999). Spatial distribution of leaf dry weight per area and leaf nitrogen concentration in relation to local radiation regime within an isolated tree crown. Tree Physiol. 19, 181–188.
Lötscher, M., Stroh, K., and Schnyder, H. (2003). Vertical leaf nitrogen distribution in relation to nitrogen status in grassland plants. Ann. Bot. 92, 679–688.
Meir, P., Kruijt, B., Broadmeadow, M., Barbosa, E., Kull, O., Carswell, F., Nobre, A., and Jarvis, P. G. (2002). Acclimation of photosynthetic capacity to irradiance in tree canopies in relation to leaf nitrogen concentration and leaf mass per unit area. Plant Cell Environ. 25, 343–357.
Mercado, L. M., Bellouin, N., Sitch, S., Boucher, O., Huntingford, C., Wild, M., and Cox, P. M. (2009). Impact of changes in diffuse radiation on the global land carbon sink. Nature 458, 1014–1017.
Messier, C., and Parent, S. (1997). Reply – the effects of direct-beam light on overcast-day estimates of light availability: on the accuracy of the instantaneous one-point overcast-sky conditions method to estimate mean daily %PPFD under heterogeneous overstory canopy conditions. Can. J. Forest Res. 27, 274–275.
Misson, L., Lunden, M., Mckay, M., and Goldstein, A. H. (2005). Atmospheric aerosol light scattering and surface wetness influence the diurnal pattern of net ecosystem exchange in a semi-arid ponderosa pine plantation. Agric. Forest Meteorol. 129, 69–83.
Monsi, M., and Saeki, T. (1953). Über den Lichtfaktor in den Pflanzengesellschaften und seine Bedeutung für die Stoffproduktion. Jpn. J. Bot. 14, 22–52.
Naidu, S. L., and DeLucia, E. H. (1997a). Acclimation of shade-developed leaves on saplings exposed to late-season canopy gaps. Tree Physiol. 17, 367–376.
Naidu, S. L., and DeLucia, E. H. (1997b). Growth, allocation and water relations of shade-grown Quercus rubra L. saplings exposed to a late-season canopy gap. Ann. Bot. 80, 335–344.
Nelson, C. J. (2000). “Shoot morphological plasticity of grasses: leaf growth vs. tillering,” in Grassland Ecophysiology and Grazing Ecology, eds G. Lemaire, J. Hodgson, A. De Moraes, C. Nabinger, and P. C. De F. Carvalho (Wallingford: CAB International), 101–126.
Nicotra, A. B., Chazdon, R. L., and Schlichting, C. D. (1997). Patterns of genotypic variation and phenotypic plasticity of light response in two tropical piper (Piperaceae) species. Am. J. Bot. 84, 1542–1552.
Niinemets, Ü. (1995). Distribution of foliar carbon and nitrogen across the canopy of Fagus sylvatica: adaptation to a vertical light gradient. Acta Oecol. 16, 525–541.
Niinemets, Ü. (2007). Photosynthesis and resource distribution through plant canopies. Plant Cell Environ. 30, 1052–1071.
Niinemets, Ü. (2010). Responses of forest trees to single and multiple environmental stresses from seedlings to mature plants: past stress history, stress interactions, tolerance and acclimation. For. Ecol. Manage. 260, 1623–1639.
Niinemets, Ü. (2012). Commentary. Optimization of foliage photosynthetic capacity in tree canopies: towards identifying missing constraints. Tree Physiol. 32, 505–509.
Niinemets, Ü., and Anten, N. P. R. (2009). “Packing the photosynthesis machinery: from leaf to canopy,” in Photosynthesis in silico: Understanding Complexity from Molecules to Ecosystems, 29th Edn, eds A. Laisk, L. Nedbal, and Govindjee (Berlin: Springer-Verlag), 363–399.
Niinemets, Ü., Copolovici, L., and Hüve, K. (2010). High within-canopy variation in isoprene emission potentials in temperate trees: implications for predicting canopy-scale isoprene fluxes. J. Geophys. Res. 115, G04029.
Niinemets, Ü., Ellsworth, D. S., Lukjanova, A., and Tobias, M. (2001). Site fertility and the morphological and photosynthetic acclimation of Pinus sylvestris needles to light. Tree Physiol. 21, 1231–1244.
Niinemets, Ü., and Kull, O. (1998). Stoichiometry of foliar carbon constituents varies along light gradients in temperate woody canopies: implications for foliage morphological plasticity. Tree Physiol. 18, 467–479.
Niinemets, Ü., Kull, O., and Tenhunen, J. D. (2004). Within canopy variation in the rate of development of photosynthetic capacity is proportional to integrated quantum flux density in temperate deciduous trees. Plant Cell Environ. 27, 293–313.
Nijskens, J., Deltour, J., Coutisse, S., and Nisen, A. (1985). Radiation transfer through covering materials, solar and thermal screens of greenhouses. Agric. Forest Meteorol. 35, 229–242.
Oberbauer, S. F., and Strain, B. R. (1986). Effects of canopy position and irradiance on the leaf physiology and morphology of Pentaclethra macroloba (Mimosaceae). Am. J. Bot. 73, 409–416.
Oguchi, R., Hikosaka, K., and Hirose, T. (2003). Does leaf photosynthetic light-acclimation need change in leaf anatomy? Plant Cell Environ. 26, 505–512.
Oguchi, R., Hikosaka, K., and Hirose, T. (2005). Leaf anatomy as a constraint for photosynthetic acclimation: differential responses in leaf anatomy to increasing growth irradiance among three deciduous trees. Plant Cell Environ. 28, 916–927.
Oguchi, R., Hikosaka, K., Hiura, T., and Hirose, T. (2006). Leaf anatomy and light acclimation in woody seedlings after gap formation in a cool-temperate forest. Oecologia 149, 571–582.
Osmond, P. (2009). “Application of near-infrared hemispherical photography to estimate leaf area index of urban vegetation,” in Extended Abstracts. The Seventh International Conference on Urban Climate, 29 June–3 July 2009, Yokohama, 4 pp.
Osmond, P. (2010). Hemispherical photography as a tool for urban sustainability evaluation and design. OIDA Int. J. Sustain. Dev. 1, 63–74.
Papadakis, G., Briassoulis, D., Scarascia Mugnozza, G., Vox, G., Feuilloley, P., and Stoffers, J. A. (2000). Radiometric and thermal properties of, and testing methods for, greenhouse covering materials. J. Agric. Eng. Res. 77, 7–38.
Parent, S., and Messier, C. (1996). A simple and efficient method to estimate microsite light availability under a forest canopy. Can. J. Forest Res. 26, 151–154.
Pearcy, R. W. (1989). “Radiation and light measurements,” in Plant Physiological Ecology. Field Methods and Instrumentation, eds R. W. Pearcy, J. R. Ehleringer, H. A. Mooney, and P. W. Rundel (London: Chapman and Hall), 97–116.
Pearcy, R. W. (2007). “Responses of plants to heterogeneous light environments,” in Handbook of Functional Plant Ecology, 2nd Edn, eds F. I. Pugnaire and F. Valladares (Boca Raton: CRC Press), 213–257.
Pettersen, R. I., Torre, S., and Gislerød, H. R. (2010). Effects of intracanopy lighting on photosynthetic characteristics in cucumber. Sci. Hortic. 125, 77–81.
Pollet, I. V., and Pieters, J. G. (1999). Condensation and radiation transmittance of greenhouse cladding materials. Part 1. Laboratory measuring unit and performance. J. Agric. Eng. Res. 74, 369–377.
Pollet, I. V., and Pieters, J. G. (2000). Condensation and radiation transmittance of greenhouse cladding materials. Part 2. Results for a complete condensation cycle. J. Agric. Eng. Res. 75, 65–72.
Pollet, I. V., and Pieters, J. G. (2002). PAR transmittances of dry and condensate covered glass and plastic greenhouse cladding. Agric. Forest Meteorol. 110, 285–298.
Pons, T. L., and Anten, N. P. R. (2004). Is plasticity in partitioning of photosynthetic resources between and within leaves important for whole-plant carbon gain in canopies? Funct. Ecol. 18, 802–811.
Pons, T. L., and de Jong-van Berkel, Y. (2004). Species-specific variation in the importance of the spectral quality gradient in canopies as a signal for photosynthetic resource partitioning. Ann. Bot. 94, 725–732.
Pons, T. L., and Jordi, W. (1998). “Induction of leaf senescence and shade acclimation in leaf canopies – variation with leaf longevity,” in Inherent Variation in Plant Growth. Physiological Mechanisms and Ecological Consequences, eds H. Lambers, H. Poorter, and M. M. I. Van Vuuren (Leiden: Backhuys Publishers), 121–137.
Pons, T. L., and Pearcy, R. W. (1994). Nitrogen reallocation and photosynthetic acclimation in response to partial shading in soybean plants. Physiol. Plant 92, 636–644.
Pons, T. L., Van Rijnberk, H., Scheurwater, I., and Van Der Werf, A. (1993). Importance of the gradient in photosynthetically active radiation in a vegetation stand for leaf nitrogen allocation in two monocotyledons. Oecologia 95, 416–424.
Poorter, H., Fiorani, F., Stitt, M., Schurr, U., Finck, A., Gibon, Y., Usadel, B., Munns, R., Atkin, O. K., Tardieu, F., and Pons, T. L. (2012). The art of growing plants for experimental purposes: a practical guide for the plant biologist. Funct. Plant Biol. xx. (in press).
Poorter, H., Niinemets, Ü., Poorter, L., Wright, I. J., and Villar, R. (2009a). Tansley review. Causes and consequences of variation in leaf mass per area (LMA): a meta-analysis. New Phytol. 182, 565–588.
Poorter, H., Walter, A., Fiorani, F., Schurr, U., and Niinemets, Ü. (2009b). Meta-phenomics: building a unified framework for interpreting plant growth responses to diverse environmental variables. Comp. Biochem. Physiol. A 153, S224.
Poorter, H., Niinemets, Ü., Walter, A., Fiorani, F., and Schurr, U. (2010). A method to construct dose-response curves for a wide range of environmental factors and plant traits by means of a meta-analysis of phenotypic data. J. Exp. Bot. 61, 2043–2055.
Poorter, H., Niklas, K. J., Reich, P. B., Oleksyn, J., Poot, P., and Mommer, L. (2011). Biomass allocation to leaves, stems and roots: meta-analyses of interspecific variation and environmental control. New Phytol. 193, 30–50.
Portsmuth, A., and Niinemets, Ü. (2007). Structural and physiological plasticity to light and nutrients in five temperate deciduous woody species of contrasting shade tolerance. Funct. Ecol. 21, 61–77.
Posada, J. M., Lechowicz, M. J., and Kitajima, K. (2009). Optimal photosynthetic use of light by tropical tree crowns achieved by adjustment of individual leaf angles and nitrogen content. Ann. Bot. 103, 795–805.
Pushnik, J. C., Swanton, B. A., and Gutschick, V. (1988). High irradiance in plant growth chambers. Bioscience 38, 44–46.
Rich, P. M., Clark, D. B., Clark, D. A., and Oberbauer, S. F. (1993). Long-term study of solar radiation regimes in a tropical wet forest using quantum sensors and hemispherical photography. Agric. Forest Meteorol. 65, 107–127.
Ross, J., and Sulev, M. (2000). Sources of errors in measurements of PAR. Agric. Forest Meteorol. 100, 103–125.
Rousseaux, M. C., Hall, A. J., and Sánchez, R. A. (1996). Far-red enrichment and photosynthetically active radiation level influence leaf senescence in field-grown sunflower. Physiol. Plant 96, 217–224.
Schieving, F., Pons, T. L., Werger, M. J. A., and Hirose, T. (1992). The vertical distribution of nitrogen and photosynthetic activity at different plant densities in Carex acutiformis. Plant Soil 14, 9–17.
Schnyder, H., Nelson, C. J., and Coutts, J. H. (1987). Assessment of spatial distribution of growth in the elongation zone of grass leaf blades. Plant Physiol. 85, 290–293.
Seginer, I., Albright, L. D., and Ioslovich, I. (2006). Improved strategy for a constant daily light integral in greenhouses. Biosyst. Eng. 93, 69–80.
Sims, D. A., Cheng, W. X., Luo, Y. Q., and Seemann, J. R. (1999). Photosynthetic acclimation to elevated CO2 in a sunflower canopy. J. Exp. Bot. 50, 645–653.
Stackhouse, P. W. Jr., Gupta, S. K., Cox, S. J., Zhang, T., Mikovitz, J. C., and Hinkelman, L. M. (2011). 24.5-Year SRB data set released. GEWEX News 21, 10–12.
Starzecki, W. (1975). Ecophysiological investigation on photosynthetic productivity of leaves of chosen tree species. Pol. Ecol. Stud. 1, 51–63.
Still, C. J., Riley, W. J., Biraud, S. C., Noone, D. C., Buenning, N. H., Randerson, J. T., Torn, M. S., Welker, J. M., White, J. W. C., Vachon, R., Farquhar, G. D., and Berry, J. A. (2009). Influence of clouds and diffuse radiation on ecosystem-atmosphere CO2 and CO18O exchanges. J. Geophys. Res. 114, G01018.
Terashima, I., and Hikosaka, K. (1995). Comparative ecophysiology of leaf and canopy photosynthesis. Plant Cell Environ. 18, 1111–1128.
Thimijan, R. W., and Heins, R. D. (1983). Photometric, radiometric, and quantum light units of measure: a review of procedures for interconversion. HortScience 18, 818–822.
Trouwborst, G., Oosterkamp, J., Hogewoning, S. W., Harbinson, J., and Van Ieperen, W. (2010). The responses of light interception, photosynthesis and fruit yield of cucumber to LED-lighting within the canopy. Physiol. Plant 138, 289–300.
Uemura, A., Ishida, A., Nakano, T., Terashima, I., Tanabe, H., and Matsumoto, Y. (2000). Acclimation of leaf characteristics of Fagus species to previous-year and current-year solar irradiances. Tree Physiol. 20, 945–951.
Valladares, F. (2003). “Light heterogeneity and plants: from ecophysiology to species coexistence and biodiversity,” in Progress in Botany, eds K. Esser, U. Lüttge, W. Beyschlag, and F. Hellwig (Berlin: Springer-Verlag), 439–471.
Wang, Q., Tenhunen, J., Schmidt, M., Kolcun, O., Droesler, M., and Reichstein, M. (2006). Estimation of total, direct and diffuse PAR under clear skies in complex alpine terrain of the National Park Berchtesgaden, Germany. Ecol. Modell. 196, 149–162.
Xu, H.-L., Gauthier, L., Desjardins, Y., and Gosselin, A. (1997). Photosynthesis in leaves, fruits, stem and petioles of greenhouse-grown tomato plants. Photosynthetica 33, 113–123.
Yamashita, N., Koike, N., and Ishida, A. (2002). Leaf ontogenetic dependence of light acclimation in invasive and native subtropical trees of different successional status. Plant Cell Environ. 25, 1341–1356.
Keywords: dry mass per unit area, greenhouse transmittance, growth chambers, lighting in plant growth, meta-analysis, nitrogen content, photosynthetic capacity, standardization of environmental conditions
Citation: Niinemets Ü and Keenan TF (2012) Measures of light in studies on light-driven plant plasticity in artificial environments. Front. Plant Sci. 3:156. doi: 10.3389/fpls.2012.00156
Received: 28 January 2012; Accepted: 25 June 2012;
Published online: 17 July 2012.
Edited by:
Sebastian Leuzinger, Eidgenössische Technische Hochschule Zürich, SwitzerlandReviewed by:
Thijs Leendert Pons, Utrecht University, NetherlandsRyo Matsuda, The University of Tokyo, Japan
Copyright: © 2012 Niinemets and Keenan. This is an open-access article distributed under the terms of the Creative Commons Attribution License, which permits use, distribution and reproduction in other forums, provided the original authors and source are credited and subject to any copyright notices concerning any third-party graphics etc.
*Correspondence: Ülo Niinemets, Institute of Agricultural and Environmental Sciences, Estonian University of Life Sciences, Kreutzwaldi 1, Tartu 51014, Estonia. e-mail: ylo@emu.ee