
- 1Dipartimento di Scienze Agrarie, Alimentari ed Ambientali, Università Politecnica delle Marche, Ancona, Italy
- 2Dipartimento di Agraria, Università degli Studi di Sassari, Sassari, Italy
- 3Centro per la Conservazione e la Valorizzazione della Biodiversità Vegetale, Università degli Studi di Sassari, Surigheddu, Alghero, Italy
- 4Cereal Research Centre, Consiglio per la Ricerca e Sperimentazione in Agricoltura, Foggia, Italy
Evolutionary studies that are aimed at defining the processes behind the present level and organization of crop genetic diversity represent the fundamental bases for biodiversity conservation and use. A Mesoamerican origin of the common bean Phaseolus vulgaris was recently suggested through analysis of nucleotide polymorphism at the nuclear level. Here, we have used chloroplast microsatellites to investigate the origin of the common bean, on the basis of the specific characteristics of these markers (no recombination, haploid genome, uniparental inheritance), to validate these recent findings. Indeed, comparisons of the results obtained through analysis of nuclear and cytoplasmic DNA should allow the resolution of some of the contrasting information available on the evolutionary processes. The main outcomes of the present study are: (i) confirmation at the chloroplast level of the results obtained through nuclear data, further supporting the Mesoamerican origin of P. vulgaris, with central Mexico representing the cradle of its diversity; (ii) identification of a putative ancestral plastidial genome, which is characteristic of a group of accessions distributed from central Mexico to Peru, but which have not been highlighted beforehand through analyses at the nuclear level. Finally, the present study suggests that when a single species is analyzed, there is the need to take into account the complexity of the relationships between P. vulgaris and its closely related and partially intercrossable species P. coccineus and P. dumosus. Thus, the present study stresses the importance for the investigation of the speciation processes of these taxa through comparisons of both plastidial and nuclear variability. This knowledge will be fundamental not only from an evolutionary point of view, but also to put P. coccineus and P. dumosus germplasm to better use as a source of useful diversity for P. vulgaris breeding.
Introduction
The wild forms of the common bean Phaseolus vulgaris grow across a wide geographic area of the Americas, from northern Mexico to northwestern Argentina (Toro et al., 1990). Morphological, biochemical, and molecular data have indicated that the wild populations from Mexico, Central America, and Colombia differ from those of southern Peru, Bolivia, and Argentina (Gepts et al., 1986; Delgado-Salinas et al., 1988; Koenig and Gepts, 1989; Gepts and Debouck, 1991; Becerra-Velásquez and Gepts, 1994; Papa and Gepts, 2003; Angioi et al., 2009a; Kwak and Gepts, 2009; Rossi et al., 2009). Indeed, these two groups represent two geographically distinct and isolated gene pools (Mesoamerica and Andes, respectively) that were already present before domestication of the common bean (for reviews, see Papa et al., 2006; Bitocchi et al., 2012, 2013). This complex scenario is further characterized by the presence within the wild forms of a third gene pool that is characteristic of a restricted area in northern Peru and Ecuador (Debouck et al., 1993). Along with accessions from the two main gene pools, wild populations collected in this restricted area have been analyzed according to a portion of the gene encoding for the seed-storage protein phaseolin (Kami et al., 1995). This study showed that the “Inca” phaseolin type I is not present in Central and South America. Moreover, this phaseolin appears to be ancestral to the other phaseolin sequences of P. vulgaris, suggesting that the northern Peru and Ecuador populations were those from which the common bean originated and subsequently spread into Central and South America (Kami et al., 1995). This hypothesis was the most credited until the study of Bitocchi et al. (2012) that analyzed the genetic diversity at five nuclear gene fragments across a wide sample of wild P. vulgaris accessions, where they showed that the wild forms of P. vulgaris originated in Mesoamerica, and most likely in central Mexico. This study also indicated that both the Andean and the northern Peru and Ecuador gene pools originated through different migration events from central Mexico. This conclusion was suggested by the evidence of a bottleneck that occurred in the Andes prior to domestication (Rossi et al., 2009; Nanni et al., 2011; Bitocchi et al., 2012) and to the presence of high genetic structure in Mesoamerica (Bitocchi et al., 2012), with the different genetic groups identified having diverse relationships with the wild populations from northern Peru and Ecuador and from the Andes.
Chloroplast microsatellite (cpSSR) markers are widely used in population genetics and evolutionary studies of plants (for review, see Provan et al., 2001). Due to their specific characteristics, which include a haploid and non-recombinant genome and uniparental inheritance, they have become very useful tools to investigate different evolutionary processes. These include, e.g., historical bottlenecks, founder effects, identification of progenitors of cultivated species, and the role of introgression in crop evolution (for review, see Provan et al., 2001).
In the present study, we used a set of cpSSRs to analyze a wide sample of wild P. vulgaris accessions from the Americas. These cpSSRs have been demonstrated to be very useful to study the diversity and evolution of several legume species, and in particular of P. vulgaris and P. coccineus (Angioi et al., 2009a,b, 2010). The main aim was to investigate the origin of the common bean and to compare the results with those obtained by analyses based on nuclear nucleotide diversity (Bitocchi et al., 2012). Indeed, at the nuclear level, recombination might have affected the data obtained, although to reduce this problem, fragments of a few hundreds of base pairs were used. Thus, the comparison and combination of nuclear and plastidial polymorphism analyses should give complementary insights into the evolutionary history of the common bean, especially considering that such analyses can often provide contrasting information on evolutionary processes (Birky, 1988; McCauley, 1995; Ennos et al., 1999; Provan et al., 1999; Weising and Gardner, 1999; Ishii et al., 2001; Lira et al., 2003; Ueno et al., 2005).
Finally, cpSSR genotyping of a smaller set of P. coccineus accessions was carried out, with the aim being to gain information about the evolutionary relationship between P. coccineus and P. vulgaris.
Materials and Methods
Plant Materials
A total of 109 wild accessions of P. vulgaris were analyzed in the present study. These materials encompassed the entire geographical distribution of this species, from northern Mexico to northwestern Argentina, and included seven wild accessions from northern Peru and Ecuador that are characterized by the ancestral phaseolin type I (Debouck et al., 1993; Kami et al., 1995). The geographical distribution of these common bean accessions is shown in Figure 1. Ten wild accessions of P. coccineus were also included. Each accession is represented by an individual plant genotype. A complete list of the accessions studied, along with their “passport” information, is given in Table A1 in Appendix.
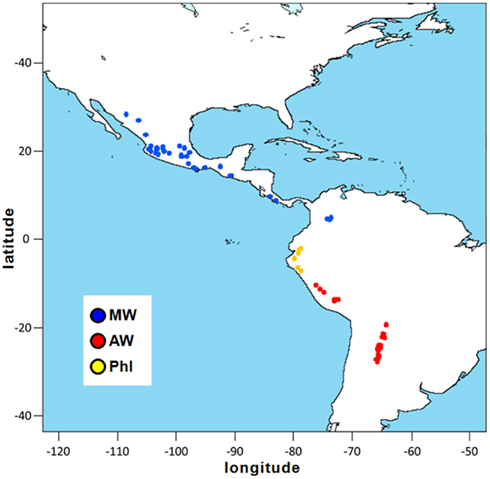
Figure 1. Geographical distribution of the P. vulgaris accessions used in the present study. Latitude and longitude are expressed in the Universal Transverse Mercator system. MW, Mesoamerican wild; AW, Andean wild; PhI, northern Peru and Ecuador.
The seeds were provided by the United States Department of Agriculture (USDA) Western Regional Plant Introduction Station in the USA, the International Center of Tropical Agriculture (CIAT) in Colombia, and the Laboratory of Plant Genetics (D3A) at the Polytechnic University of Marche (UNIVPM) in Italy. Most of these accessions had already been characterized using different types of molecular markers, such as amplified fragment length polymorphism (AFLP; Rossi et al., 2009) and nucleotide data (Nanni et al., 2011; Bitocchi et al., 2012). Moreover a small subset of accessions (15 wild P. vulgaris, eight wild P. coccineus) were analyzed previously by Angioi et al. (2009a) with the same set of cpSSRs.
PCR and CpSSR Genotyping
Genomic DNA was extracted from each accession from young leaf tissue of a single, greenhouse-grown plant, using the miniprep extraction method (Doyle and Doyle, 1987). A total of 17 cpSSRs derived from the literature (Weising and Gardner, 1999; Chung and Staub, 2003; Angioi et al., 2009a) were used for the genetic characterization of the whole sample. One of the two SSR primers was end-labeled with a phosphoramidite fluorescent dyes, 6-FAM or HEX. A list of the cpSSRs used in this study is given Table A2 in Appendix. The amplifications were conducted using a Perkin-Elmer 9700 Thermal Cycler (PE Applied Biosystems) in a total volume of 25 μl, which contained 25 ng template DNA, 10 pmol of each primer, 200 μM dNTPs, 1× Taq polymerase buffer, 2.5 mM MgCl2 and 1 U Taq polymerase (Promega). The PCR conditions were as reported in Table A2 in Appendix. Multiplex PCRs were performed (including two primer pairs that were differently end-labeled, with amplification of SSRs of different sizes under the same amplification conditions). SSR genotyping was carried out using the ABI PRISM 3100-Avant Genetic Analyzer with the GeneScan 7.0 analysis software (PE Applied Biosystems).
Genetic Diversity Analysis
The percentage of polymorphic loci, the average number of observed alleles per locus (Na), the effective number of alleles per locus (Ne; Kimura and Crow, 1964), the number of private alleles (Np), and the expected heterozygosity (He; Nei, 1978) estimates based on allele frequencies, were computed using the Arlequin software, version 3.5 (Excoffier and Lischer, 2010). The whole sample, and the following partitions of the accessions were considered for these analyses: P. coccineus; P. vulgaris; and within the common bean sample according to the gene pool, the Andean wild (AW), Mesoamerican wild (MW), and northern Peru and Ecuador (PhI) populations.
The differences between the AW and MW populations for the genetic diversity estimates (Ne and He) were tested using Wilcoxon signed-ranks non-parametric test for two groups, arranged for paired observations (i.e., one pair of estimates for each locus; Wilcoxon, 1945; Sokal and Rohlf, 1995).
An ad hoc statistic (ΔH) was used to compare the diversity between the two main gene pools (AW, MW); this estimate measures the loss of diversity of one population compared to another, and it was originally proposed by Vigouroux et al. (2002): ΔH = 1 − (HePOP1/HePOP2), where POP1 refers to the population that shows the lower level of genetic diversity (He) compared to the other population (POP2).
Principal Component Analysis
Using the JMP software, version 8 (SAS Institute, Inc., 2008), principal component analysis (PCA) was performed from allele frequencies. The same analysis was carried out also to investigate the genetic relationships among the P. vulgaris accessions.
Population Structure Analysis
A Bayesian model-based approach that was implemented in the Bayesian analysis of population structure (BAPS) software, version 5.3 (Corander et al., 2003), was used to infer the hidden genetic population structure of the whole sample (109 P. vulgaris and 10 P. coccineus accessions), and thus to assign the genotypes into genetically structured groups/populations (K). A spatial genetic mixture analysis was conducted (Corander et al., 2008). This method uses a Markov chain Monte Carlo simulation approach to group samples into variable user-defined numbers (K) of clusters. The best partition of populations into K clusters is identified as the one with the highest marginal log-likelihood. We carried out 10 repetitions of the algorithm for each K ranging between 2 and 20.
The genetic diversity statistics described above were also computed for the genetic groups highlighted by the BAPS analysis (hereafter referred to as clusters). The differences between the clusters identified according to the genetic diversity estimates (Ne, He) were tested using the Wilcoxon signed-ranks non-parametric test for two groups, arranged for paired observations (Wilcoxon, 1945; Sokal and Rohlf, 1995), and the Bonferroni correction for multiple comparisons.
Divergence between Populations
The divergence among the P. coccineus and P. vulgaris populations defined a priori according to the gene pools (AW, MW, PhI) were estimated as FST (Weir and Cockerham, 1984), D (Jost, 2008), and RST (Slatkin, 1995). In contrast to FST and D, RST contains information not only about the frequency with which particular alleles occur, but also on the evolutionary distance between them, inasmuch as it is measured as the expected squared difference in repeat numbers between alleles. For this reason, it is intended to take advantage of this additional information to provide greater insight into the patterns of relationships among populations (for review, see Holsinger and Weir, 2009). These correspond to the infinite allele and the step-wise mutation models. The significance of the estimates was obtained through permutation tests, using 10,000 permutations. The same divergence estimates were also computed for clusters identified by BAPS analysis. The Arlequin software, version 3.5 (Excoffier and Lischer, 2010), was used.
Comparison of Results Based on CpSSR Data with Those Obtained Using Nucleotide Data
The sequences of five gene regions (from 500 to 900 bp) for 71 accessions were available from Bitocchi et al. (2012). These five gene fragments include four legume anchor (Leg) markers, developed by Hougaard et al. (2008), and one gene fragment, PvSHP1, developed by Nanni et al. (2011); PvSHP1 is a homolog of the SHATTERPROOF (SHP1) gene, which is involved in the control of fruit shattering in Arabidopsis thaliana. These data allowed a comparison of the data from the population structure analyses carried out using cpSSRs and nuclear sequences. Thus, for the 71 accessions shared between this study and that of Bitocchi et al. (2012), a population structure analysis was carried out using both the cpSSRs and the nucleotide data. For the nucleotide data, the procedures were as described in Bitocchi et al. (2012), while for the cpSSRs, the procedures were the same as reported in the above section.
To compare the geographical distributions of the clusters identified through the cpSSR and nucleotide data, spatial interpolation of membership coefficients (q) was performed according to the kriging method, with each of the clusters identified by population structure analysis, which was implemented in the R packages spatial (http://www.r-project.org/). In the case of the cpSSRs, due to the non-recombinant nature of these markers, which does not allow admixture, the membership coefficients were represented by one or zero (i.e., membership or non-membership to one cluster); thus, the interpolation for plastidial data represents an approximation.
The association between the results obtained by the BAPS analyses carried out with the cpSSR and nucleotide data was tested by analysis of contingency tables with the likelihood ratio chisquared (χ2) test, which was performed using the JMP 8.0 software (SAS Institute, Inc., 2008).
Results
Each of the primer pairs produced a single and clear amplification, and all of the 17 loci studied were polymorphic considering the whole analyzed sample. The size of the amplification products ranged from 79 bp (ccmp3) to 378 bp (ccSSR19). Overall, the number of alleles per locus (Na) ranged from two (cp2) to 12 (ccSSR20); in parallel the same two markers showed the lowest and the highest genetic diversity, He = 0.13 and He = 0.85, respectively (Table A3 in Appendix).
Considering the P. coccineus sample, six out of the 17 loci were monomorphic. For the polymorphic loci, Na ranged from two (cp2, ccSSR2, ccSSR4, ccSSR12, and ccSSR16) to six (ccSSR20). One locus (cp2) was monomorphic in the P. vulgaris sample. For the remaining 16 loci, Na ranged from two (cp3 and ccSSR12) to 11 (ccSSR20). The highest level of genetic diversity was detected for the ccSSR20 locus, as an He of 0.84 for both P. vulgaris and P. coccineus (Table A3 in Appendix).
Genetic Diversity Analysis
Genetic diversity estimates were computed considering the whole sample and the following major subdivisions: different species (P. vulgaris, P. coccineus) and within the P. vulgaris Andean (AW), Mesoamerican (MW), and northern Peru and Ecuador accession (PhI) populations.
As showed in Table 1, the common bean was characterized by a higher level of genetic diversity (Na, Ne, Np, and He) than P. coccineus. However, the large difference between the size of the two samples suggests caution in the consideration of these estimates.
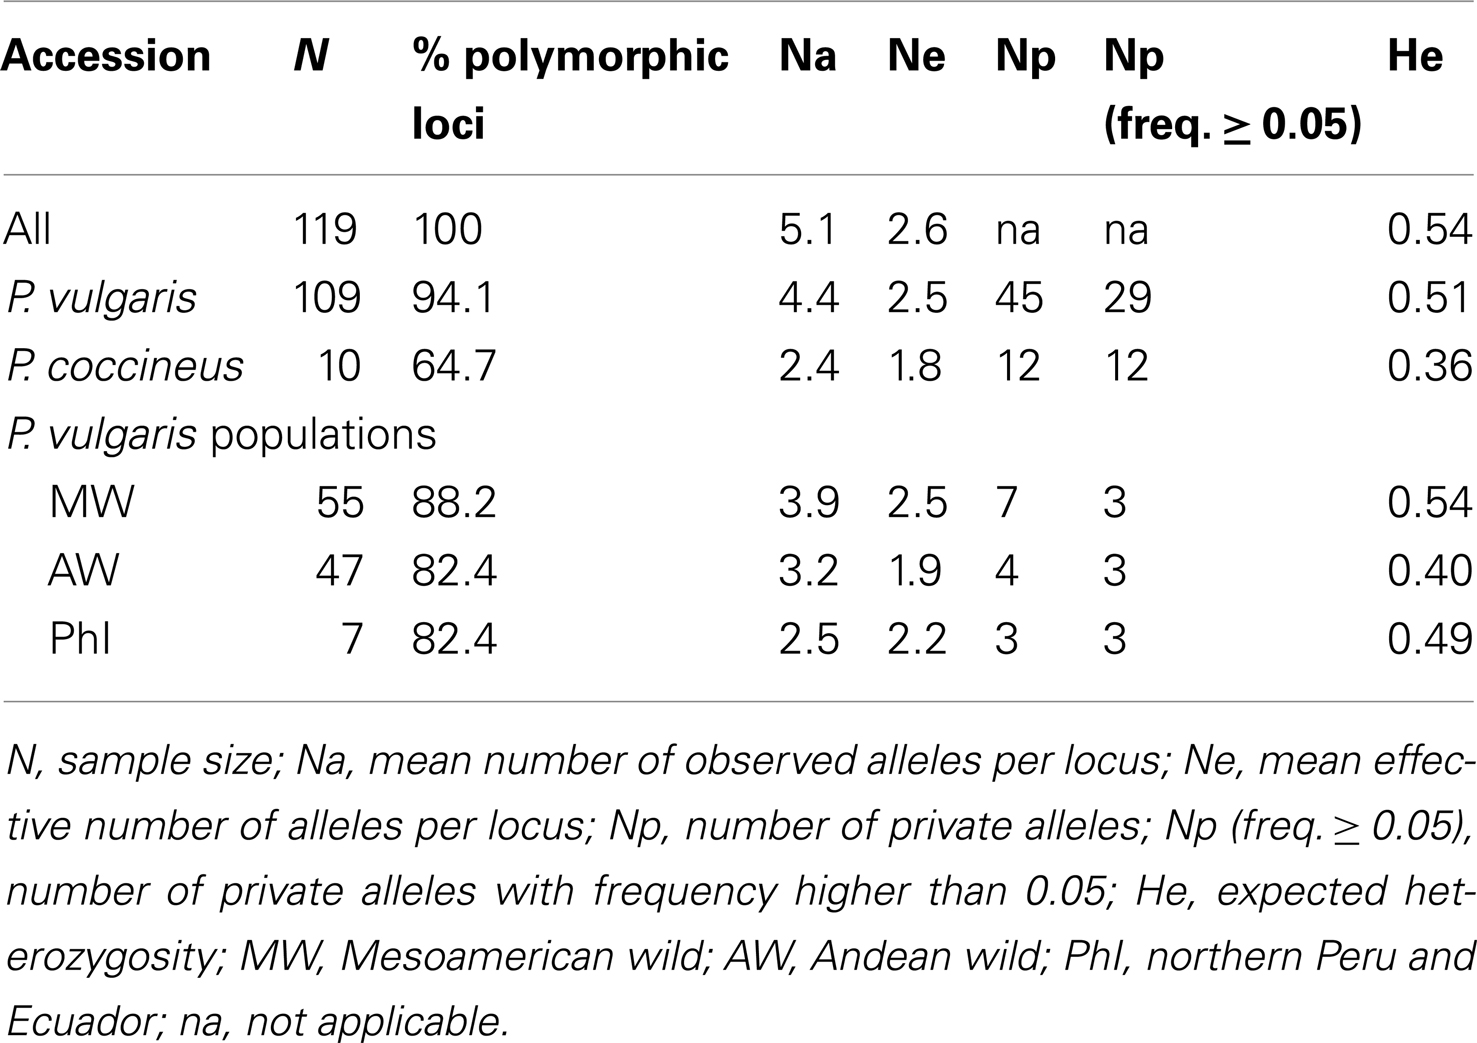
Table 1. Genetic diversity estimates computed for all of the 17 cpSSR loci considering the whole sample, the P. vulgari s and P. coccineu s samples, and the three P. vulgari s populations defined according to the gene pools.
Among the three P. vulgaris populations, the MW accessions showed the highest genetic diversity for all of the parameters (Table 1). In particular, considering the populations that represent the two major common bean gene pools (Mesoamerican and Andean), the MW showed a higher level of genetic diversity (Ne = 2.5 and He = 0.54) compared to the AW accessions (Ne = 1.9 and He = 0.40; Table 1). This difference was significant for both the genetic diversity estimates Ne and He (P < 0.02; Wilcoxon signed-ranks non-parametric test for two groups, arranged for paired observations). There was a 26% reduction in genetic diversity (ΔH) of the AW population compared to the MW population.
Principal Component Analysis
The relationships among all of the individuals considered, including both the P. vulgaris and P. coccineus accessions, were investigated by PCA (Figure 2). The first (PC1) and second (PC2) principal components explain 43.03 and 26.82%, respectively. Three main groups were identified by this analysis, one including eight wild P. coccineus accessions, one including all of the seven PhI, two WA, and 39 WM accessions and one P. coccineus accession, and the remaining 45 WA and 16 WM accessions, and even if more distant, one P. coccineus accessions.
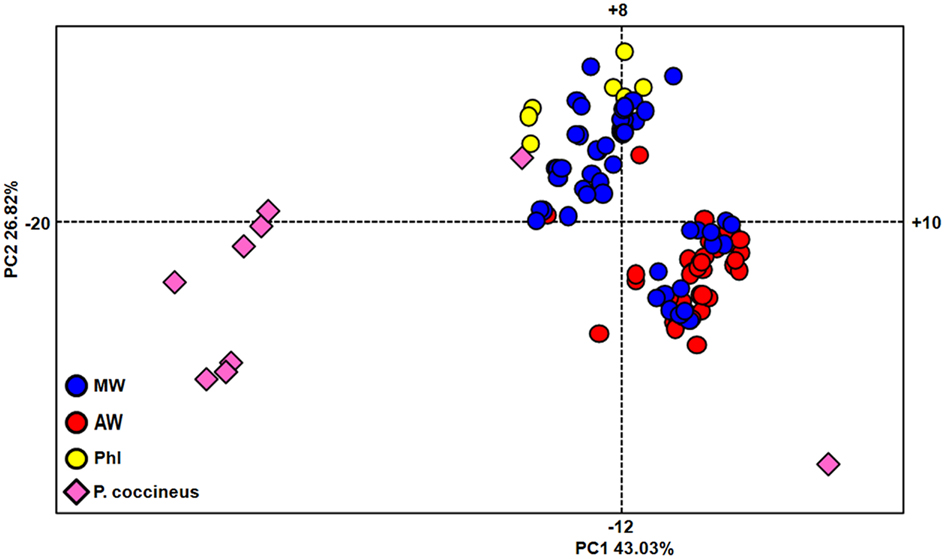
Figure 2. Genetic relationships within the whole set of accessions, as determined by principal component analysis. MW, Mesoamerican wild; AW, Andean wild; PhI, northern Peru and Ecuador.
Principal component analysis was also performed to investigate the genetic relationships among the P. vulgaris accessions (Figure 3). The first (PC1) and second (PC2) principal components explain 45.73 and 23.65%, respectively. This analysis identified two major groups, as A and B (Figure 3). The majority of the MW accessions (73%; including five of the six Colombian accessions) belonged to group A, along with three AW accessions from northern Argentina (Salta and Tucumán Provinces) and all of the seven PhI accessions. Group B included almost all of the AW accessions (94%) and 15 MW accessions, 14 of which were from central Mexico, and only one from Colombia.
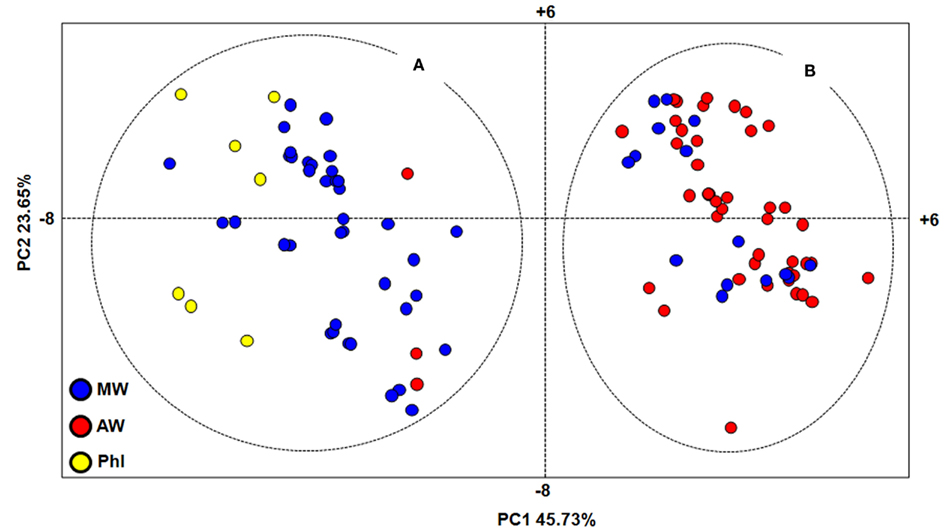
Figure 3. Genetic relationships within the P. vulgaris accessions, as assessed by principal component analysis. MW, Mesoamerican wild; AW, Andean wild; PhI, northern Peru and Ecuador; (A,B), major groups identified by PCA analysis.
Population Structure
The population structure analysis identified four different clusters (C1, C2, C3, C4) as the best partition of the whole sample (all of the 10 best marginal log-likelihood values were for K = 4, with the highest of −1,996.54; Table 2). Cluster C1 was characterized by almost all of the AW accessions (98%) and 13 MW accessions from Central Mexico. Cluster C2 included 21 MW and three PhI accessions, along with two P. coccineus genotypes. There were accessions from all of the three common bean populations in cluster C3 (4, 1, 21 for the PhI, AW, MW populations, respectively), while cluster C4 was exclusive to the remaining eight P. coccineus accessions. The geographical distribution of the P. vulgaris accessions based on the BAPS cluster membership is showed in Figure 4.
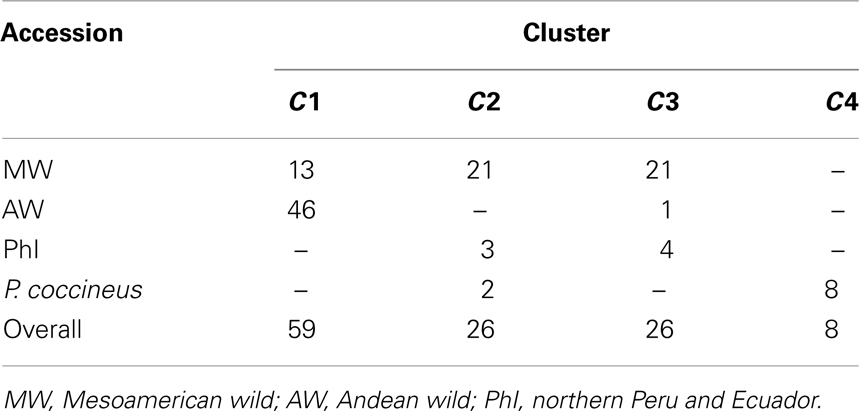
Table 2. Distribution of the accessions into the four cpSSR clusters (C1, C2, C3, C4) identified by the BAPS analysis.
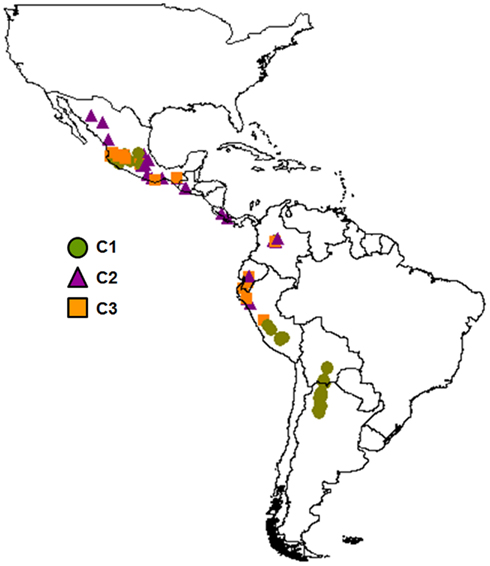
Figure 4. Geographical distribution of the P. vulgaris accessions based on the BAPS cluster membership.
The genetic diversity estimates for the BAPS clusters are showed in Table 3. The three clusters characteristic of P. vulgaris accessions (C1, C2, C3) showed similar levels of genetic diversity (Ne = 2.0, 2.1, 1.8, and He = 0.42, 0.45, 0.36, for C1, C2, C3, respectively). Cluster C4 showed the lowest Ne (1.6) and He (0.29) estimates. However, there were no significant differences in the levels of genetic diversity between these four clusters (Wilcoxon signed-ranks non-parametric tests, after Bonferroni correction).
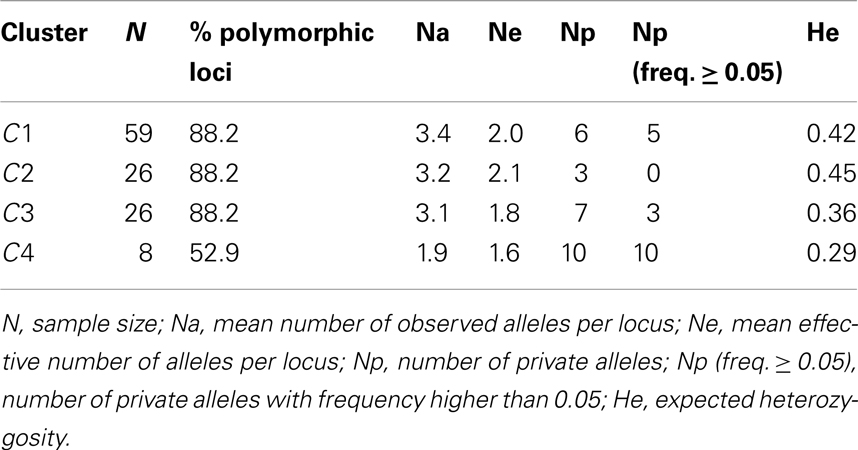
Table 3. Genetic diversity estimates computed for the 17 cpSSRs considering the four clusters (C1, C2, C3, and C4) identified by BAPS analysis.
Divergence between Populations
The genetic divergence between the P. vulgaris populations (MW, AW, PhI) and the P. coccineus accessions was estimated as FST, D, and RST. The FST and D estimates were very similar, as expected for populations that have a very low number of unique alleles (Whitlock, 2011), and thus only the FST data are shown. The lowest, and non-significant, differentiation was between the PhI and MW populations (FST = 0.08; RST = 0.12; both non-significant; Table 4). Considering the comparisons among the P. vulgaris populations, the divergence between AW and PhI (FST = 0.21; RST = 0.70; both significant P ≤ 0.001) was greater than that between AW and MW (FST = 0.13; RST = 0.24; both significant P ≤ 0.01). The highest values of FST were those in the comparisons with the P. coccineus population; however, the MW population showed the lowest levels of differentiation with P. coccineus (FST = 0.33; P ≤ 0.001) compared to the other P. vulgaris populations [FST(PhI-P. coccineus) = 0.38, P ≤ 0.001; FST(AW-P. coccineus) = 0.49, P ≤ 0.001; Table 4]. The RST showed a similar trend, with the MW population being less differentiated than P. coccineus (RST = 0.58, P ≤ 0.001), and PhI [RST(PhI-P. coccineus) = 0.60, P ≤ 0.001], and AW [RST(AW-P. coccineus) = 0.78, P ≤ 0.001; Table 4].
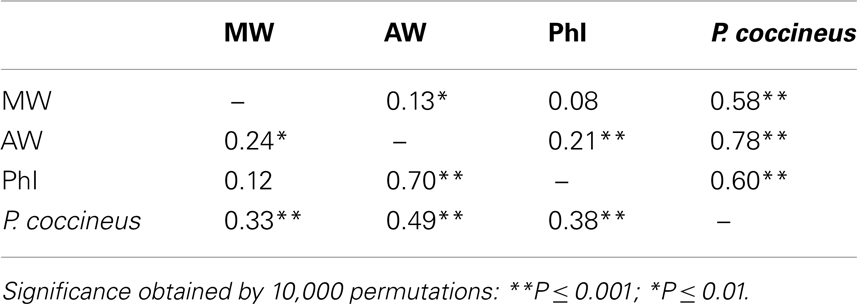
Table 4. Genetic divergence (FST and RST, below and above the diagonal, respectively) within the P. vulgari s populations and with P. coccineu s.
The same divergence estimates were computed considering the four genetic clusters (C1, C2, C3, C4) identified by the BAPS analysis (Table 5). All of the divergence estimates (for both FST and RST) were significantly different from zero (P ≤ 0.001). We observed less differentiation (lower FST and RST) among the three clusters predominated by the P. vulgaris accessions (C1, C2, C3), than between any of these and C4, which was comprised exclusively of P. coccineus accessions. When considering these comparisons with the P. coccineus cluster (C4), the lowest FST was with the C2 cluster [FST(C2–C4) = 0.39]. RST gave a slightly different pattern, with comparisons involving the C3 cluster showing the lowest RST (Table 5).
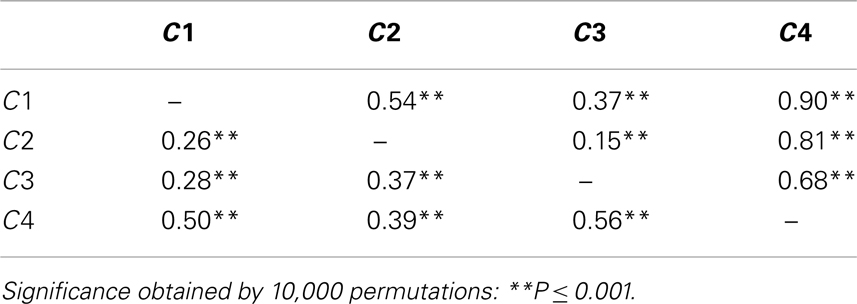
Table 5. Genetic divergence (FST and RST, below and above the diagonal, respectively) between the four cpSSR clusters identified by population structure analysis.
Nucleotide Data versus cpSSRs
The availability of sequence data for five gene fragments for 71 out of the 109 P. vulgaris accessions allowed a comparison between these different kinds of data (plastidial and nuclear). Three clusters were identified by the analysis carried out with cpSSRs. They corresponded to clusters (C1, C2, and C3) determined previously using all the accessions, while the Cluster C4 was not determined due to the exclusion, in this comparative analysis, of the P. coccineus accessions. Six clusters (B1, B2, B3, B4, B5, and B6), as in Bitocchi et al. (2012) were identified with nuclear nucleotide data. The distribution of the accessions into the nucleotide data and cpSSR clusters is reported in Table 6. Figures 5A,B shows the geographical distribution of these clusters. The analysis of contingency tables indicated a significant association (P < 0.0001; likelihood ratio χ2 test) between the genetic clusters obtained with these different markers (Figure 5C). In particular, cluster C1 was represented by clusters B3, B4, and B6, while cluster C2 included the B1, B2, and B5 clusters. In contrast, cluster C3 did not show any associations, although it is represented by accessions from the gene pools from Mesoamerica (B1, B2, B3), the Andes (B6), and northern Peru and Ecuador (B5).
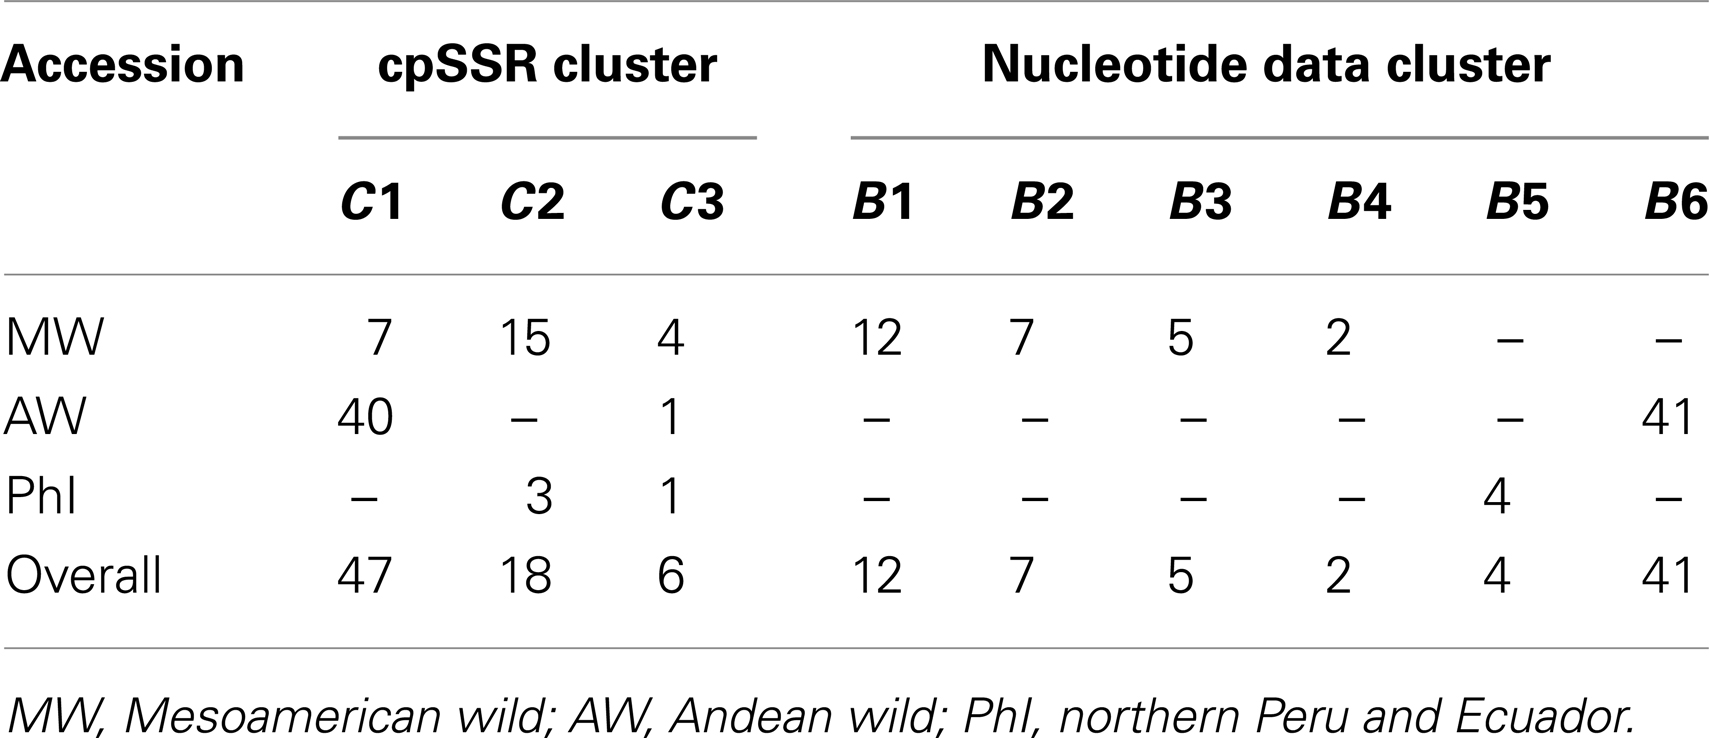
Table 6. Distribution of the 71 accessions shared between nucleotide and cpSSR data into the six nucleotide data clusters (B1, B2, B3, B4, B5, and B6) and the four cpSSR clusters (C1, C2, C3, C4) identified by the BAPS analysis.
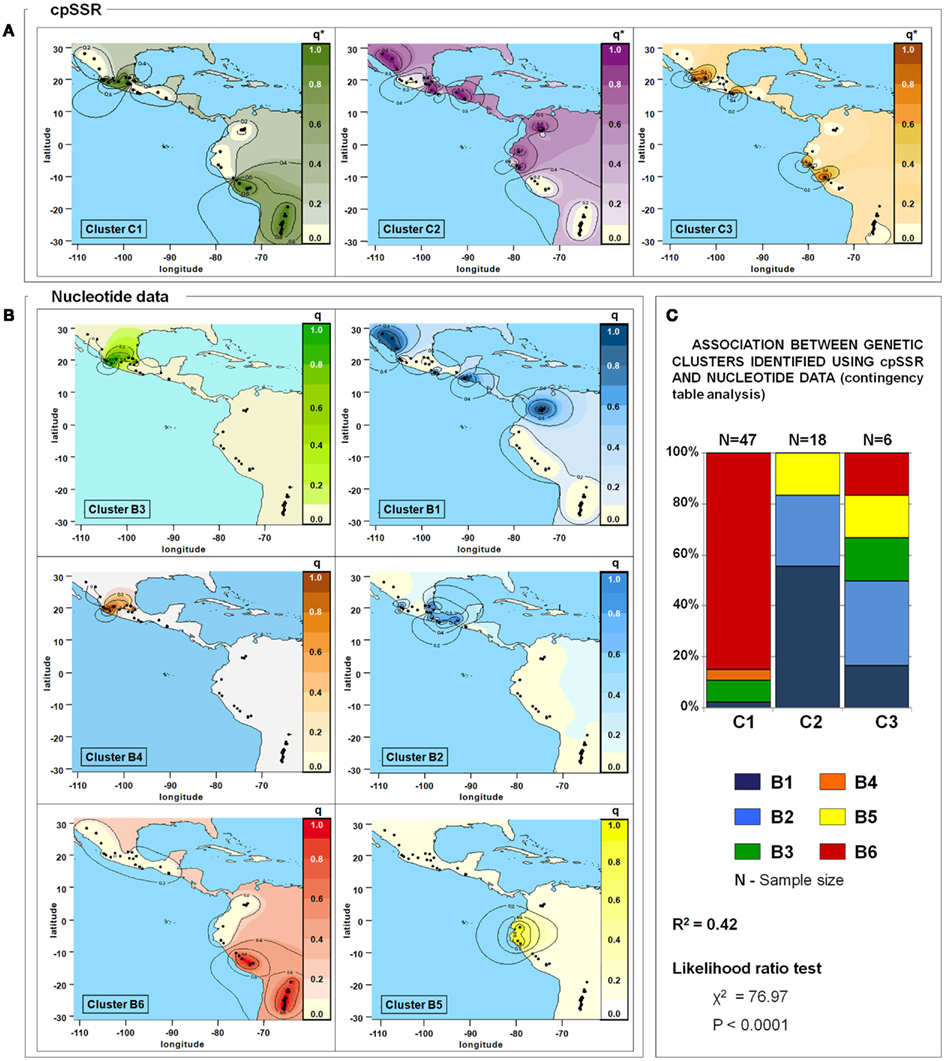
Figure 5. Spatial interpolation of the membership coefficients (q) for the clusters identified by the population structure analysis using cpSSR (A) and for the nucleotide data (B), and results of the association test between these (C). q*, for cpSSRs, the geographical representation of the membership coefficients represents an approximation to easily compare the results obtained for the two different markers; indeed cpSSR q* values are represented by one or zero (i.e., membership or non-membership to one cluster), even if the spatial interpolation gives intermediate values. Only the 71 accessions shared between this study and that of Bitocchi et al. (2012) are included in this analysis. Latitude and longitude are expressed in the Universal Transverse Mercator system.
Discussion
The main aim of the present study was to investigate the complex evolutionary history that characterizes P. vulgaris through an analysis of its genetic diversity at the plastidial DNA level, in comparison with the study of Bitocchi et al. (2012) that was based on nuclear nucleotide data. Thus, taking into account the specific characteristics of the plastidial genome (haploidy, lack of recombination, uniparental inheritance), we used cpSSRs to contribute to the existing knowledge of the evolution of the common bean and its closely related species, and to provide new insights, especially considering that comparisons of data obtained through analyses of nuclear and cytoplasmic DNA can provide contrasting information on evolutionary processes (Birky, 1988; McCauley, 1995; Ennos et al., 1999; Provan et al., 1999; Weising and Gardner, 1999; Ishii et al., 2001; Lira et al., 2003; Ueno et al., 2005).
The data obtained here are in agreement with the Mesoamerican origin of P. vulgaris, thus confirming the findings of Bitocchi et al. (2012), where the nucleotide diversity at five nuclear gene fragments in a wide sample of wild P. vulgaris accessions was analyzed (mostly shared with the present study). Moreover, the absence of phaseolin type I in the Mesoamerican gene pool might be due to its extinction in Mesoamerica, or it might still be present, but just not included in the samples analyzed in the literature.
The first outcome was the reduction in the genetic diversity (26%) in the Andean gene pool, compared to that of Mesoamerica. This has already been shown, even if to different extents, by analyses carried out with different nuclear molecular markers (SSRs: 7%, Kwak and Gepts, 2009; AFLPs: 45%, Rossi et al., 2009) and sequence data (90%, Bitocchi et al., 2012). In particular, the loss of diversity detected with cpSSRs is intermediate between the SSRs and AFLPs, as is their mutation rate (10−3–10−5 mutations per generation; Provan et al., 1999; Marshall et al., 2002). Indeed SSRs are characterized by a very high mutation rate (10−3–10−4 mutations per generation; Estoup and Angers, 1998; Mariette et al., 2001; Udupa and Baum, 2001; Vigouroux et al., 2002; Thuillet et al., 2005; Garoia et al., 2007) and AFLPs by a lower one (10−6–10−5 mutations per generation; Mariette et al., 2001; Gaudeul et al., 2004; Kropf et al., 2009). Consistent with the evidence obtained for the nuclear genome (Kwak and Gepts, 2009; Rossi et al., 2009; Nanni et al., 2011; Bitocchi et al., 2012), our data provide further evidence of the bottleneck that occurred before domestication of the common bean in the Andes, which led to impoverishment of the genetic diversity also at the plastidial level in the present gene pool. Moreover, this confirms the strong relationship between the mutation rate and the time needed for a population to recover the genetic diversity that can be lost after a bottleneck: the higher the mutation rate, the shorter the time needed (Glémin and Bataillon, 2009; Rossi et al., 2009; Nanni et al., 2011; Bitocchi et al., 2012, 2013).
Moreover, the BAPS analysis allows the division into three main clusters for the P. vulgaris accessions (C1, C2, C3). The Andean accessions are almost all included in cluster C1, with the only exception being an accession from southern Peru that belongs to cluster C3. Considering the nuclear data, cluster C1 is significantly associated with clusters B3, B6, and B4. This supports the close relationship between the Andean (B6) and the MW accessions from central Mexico (B3; Bitocchi et al., 2012), which indicates that these MW accessions represent the most probable plant material that spread and adapted to the southern part of the Andes.
Cluster C2 is characterized by the Mesoamerican accessions assigned using nucleotide data to clusters B1 and B2, and three of the seven PhI accessions, while cluster C3 groups the accessions that are representative of all of the gene pools (Mesoamerican, Andean, and northern Peru and Ecuador). These data provide further confirmation of the evidence highlighted by the nuclear data (Bitocchi et al., 2012); indeed, the Mesoamerican population is highly subdivided also at the plastidial level, and all of the genetic groups identified are present in particular in Central Mexico, which indicates this geographical area as the center of origin of P. vulgaris.
However, an interesting and novel outcome is revealed by the cpSSRs, which is probably due to the different characteristics of the nuclear and plastidial genome (and in particular to the presence of recombination for the nuclear genome): the identification of cluster C3 as a genetic group that incorporates accessions that are representative of all of the gene pools (MW, AW, PhI) and are not significantly associated with any genetic cluster identified with the nuclear data. In particular, almost all of the MW in cluster C3 are from Central Mexico, with the only exception being one Colombian genotype; moreover, cluster C3 comprised four PhI accessions and one AW accession. The wide distribution in cluster C3 can be interpreted as evidence that these accessions carry the ancestral plastidial genome that spread over the entire distribution that is now covered by P. vulgaris. This pattern is also confirmed by the RST divergence estimations, where cluster C3 shows the lowest values compared to all of the other clusters, including most of the various alleles, when the size of the alleles is considered as a measure of the evolutionary distance among alleles. However, the same does not hold when the infinite allele model is considered: FST. Indeed, for FST, C2 shows the lowest divergence. This appears to be determined by the higher diversity (He) of C2 compared to C3, but not as alleles number (richness), with C2 showing the more uniform distribution of allele frequencies. Thus, we can speculate that the different results obtained for RST and FST might be the result of the more precise estimation of allele divergence using RST and because C3 has more skewed allele frequencies due to the drift (e.g., a bottleneck).
The membership of the two P. coccineus genotypes to cluster C2 suggests that this cluster can be considered as having been derived from an ancestral lineage from which P. vulgaris separated from P. coccineus. Alternatively, this might result from post speciation introgression from P. vulgaris (with P. vulgaris as the maternal parent of the initial hybridization). This putative introgression of plastidial DNA from P. vulgaris to P. coccineus is consistent with the hypothesis that the P. dumosus species originated from a cross of P. vulgaris as maternal and P. coccineus as paternal parent, followed by successive backcrosses from P. coccineus as paternal donor (Schmit et al., 1993; Llaca et al., 1994; Angioi et al., 2009a). Indeed, P. dumosus is closer to P. coccineus according to nuclear DNA comparisons (Piñero and Eguiarte, 1988; Delgado-Salinas et al., 1999), while according to chloroplast DNA comparisons it appears to be more closely related to P. vulgaris (Llaca et al., 1994; Angioi et al., 2009a). These outcomes reveal the complexity of the evolution of P. vulgaris within the evolutionary history of its closely related species, P. coccineus and P. dumosus (Schmit et al., 1993; Delgado-Salinas et al., 1999, 2006; Chacón et al., 2007), both of which are found in Mesoamerica (Schmit and Debouck, 1991; Freytag and Debouck, 2002). In spite of the marked differences in mating systems and life cycles, P. coccineus (predominantly allogamous and perennial), P. vulgaris (predominantly autogamous and annual), and P. dumosus (intermediate characteristics between P. coccineus and P. vulgaris) are partially intercrossable, although only when P. vulgaris is the female parent (Mendel, 1866; Wall, 1970; Shii et al., 1982; Hucl and Scoles, 1985). However, further studies should be carried out here, to compare a larger sample that includes genotypes from all three of these sister species and uses both nuclear and plastidial DNA analyses.
Conclusion
Chloroplast SSRs are widely used for evolutionary and phylogenetic studies as they have been demonstrated to be effective indicators of the genetic structure of a population. Therefore, we used this alternative form of analysis (with respect to nuclear data) with the aim of obtaining a more detailed picture of the history of the common bean. These cpSSR data strongly support the nuclear data of Bitocchi et al. (2012), that indicated a clear Mesoamerican origin of this species, and in particular, they support Central Mexico as, with high probability, the cradle of common bean diversity.
A novel outcome was also provided by these analyses based on the polymorphism at the chloroplast DNA level: the identification of a genetic group (cluster C3) that includes accessions distributed from northern Mexico to Peru that appear to carry a putative ancestral plastidial genome.
Finally, the present study highlights the potential to evaluate the evolutionary history of P. vulgaris within the evolution of the whole species complex that includes P. vulgaris, P. coccineus, and P. dumosus. A deeper study of the formation and evolution of these closely related and intercrossable species will be intriguing from an evolutionary point of view. At the same time, such data should be particularly relevant for common bean breeding programs, as demonstrated by the increasing interest in the development of interspecific lines (P. vulgaris-P. coccineus and P. vulgaris-P. dumosus crosses) for the introgression of important traits; e.g., resistance to biotic and abiotic stress in P. vulgaris elite germplasm (Singh et al., 2009; Klaedtke et al., 2012).
Conflict of Interest Statement
The authors declare that the research was conducted in the absence of any commercial or financial relationships that could be construed as a potential conflict of interest.
Acknowledgments
This work was supported by grants from the Italian Government (MIUR; Grant number 20083PFSXA_001, PRIN Project 2008), the Università Politecnica delle Marche (2008–2011) and the Marche Region (Grant number L. R.37/99 art. 2lett. I – PARDGR 247/10 – DDPF98/CSI10).
References
Angioi, S. A., Desiderio, F., Rau, D., Bitocchi, E., Attene, G., and Papa, R. (2009a). Development and use of chloroplast microsatellites in Phaseolus spp. and other legumes. Plant Biol. 11, 598–612.
Angioi, S. A., Rau, D., Rodriguez, M., Logozzo, G., Desiderio, F., Papa, R., et al. (2009b). Nuclear and chloroplast microsatellite diversity in Phaseolus vulgaris L. from Sardinia (Italy). Mol. Breed. 23, 413–429.
Angioi, S. A., Rau, D., Attene, G., Nanni, L., Bellucci, E., Logozzo, G., et al. (2010). Beans in Europe: origin and structure of the European landraces of Phaseolus vulgaris L. Theor. Appl. Genet. 121, 829–843.
Becerra-Velásquez, V. L., and Gepts, P. (1994). RFLP diversity in common bean (Phaseolus vulgaris L.). Genome 37, 256–263.
Birky, C. W. (1988). “Evolution and population genetics of organelle genes: mechanisms and models,” in Plant Evolutionary Biology, eds L. D. Gottlieb and S. K. Jain (London: Chapman and Hall), 23–53.
Bitocchi, E., Nanni, L., Bellucci, E., Rossi, M., Giardini, A., Spagnoletti Zeuli, P., et al. (2012). Mesoamerican origin of the common bean (Phaseolus vulgaris L.) is revealed by sequence data. Proc. Natl. Acad. Sci. USA. 109, E788–E796.
Bitocchi, E., Bellucci, E., Giardini, G., Rau, R., Rodriguez, M., Biagetti, E., et al. (2013) Molecular analysis of the parallel domestication of the common bean (Phaseolus vulgaris) in Mesoamerica and the Andes. New Phytol. 197, 300–313.
Chacón, S. M. I., Pickersgill, B., Debouck, D. G., and Salvador Arias, J. (2007). Phylogeographic analysis of the chloroplast DNA variation in wild common bean (Phaseolus vulgaris L.) in the Americas. Plant Syst. Evol. 266, 175–195.
Chung, S., and Staub, J. E. (2003). The development and evaluation of consensus chloroplast primer pairs that possess highly variable sequence regions in a diverse array of plant taxa. Theor. Appl. Genet. 107, 757–767.
Corander, J., Marttinen, P., Sirén, J., and Tang, J. (2008). Enhanced Bayesian modelling in BAPS software for learning genetic structures of populations. BMC Bioinformatics 9:539. doi:10.1186/1471-2105-9-539
Corander, J., Waldmann, P., and Sillanpää, M. J. (2003). Bayesian analysis of genetic differentiation between populations. Genetics 163, 367–374.
Debouck, D. G., Toro, O., Paredes, O. M., Johnson, W. C., and Gepts, P. (1993). Genetic diversity and ecological distribution of Phaseolus vulgaris in northwestern South America. Econ. Bot. 47, 408–423.
Delgado-Salinas, A., Bibler, R., and Lavin, M. (2006). Phylogeny of the genus Phaseolus (Leguminosae): a recent diversification in an ancient landscape. Syst. Bot. 31, 779–791.
Delgado-Salinas, A., Bonet, A., and Gepts, P. (1988). “The wild relative of Phaseolus vulgaris in Middle America,” in Genetic Resources of Phaseolus Beans, ed. P. Gepts (Boston: Kluwer), 163–184.
Delgado-Salinas, A., Turley, T., Richman, A., and Lavin, M. (1999). Phylogenetic analysis of the cultivated and wild species of Phaseolus (Fabaceae). Syst. Bot. 24, 438–460.
Doyle, J. J., and Doyle, J. L. (1987). A rapid DNA isolation procedure for small quantities of fresh leaf tissue. Phytochem. Bull. 19, 11–15.
Ennos, R. A., Sinclair, W. T., Hu, X. S., and Langdon, A. (1999). “Using organelle markers to elucidate the history, ecology and evolution of plant populations,” in Molecular Systematics and Plant Evolution, eds P. M. Hollingsworth, R. B. Bateman, and R. J. Gornall (London: Taylor & Francis), 1–19.
Estoup, A., and Angers, B. (1998). “Microsatellites and minisatellites for molecular ecology: theoretical and experimental considerations,” in Advances in Molecular Ecology, ed G. Carvalho (Amsterdam: IOS Press), 55–86.
Excoffier, L., and Lischer, H. E. L. (2010). Arlequin suite version 3.5: A new series of programs to perform population genetics analyses under linux and windows. Mol. Ecol. Resour. 10, 564–567.
Freytag, G. F., and Debouck, D. G. (2002). Taxonomy, Distribution, and Ecology of the Genus Phaseolus (Leguminosae-Papilionoideae) in North America, Mexico and Central America. Fort Worth, TX: Botanical Research Institute of Texas.
Garoia, F., Guarniero, I., Grifoni, D., Marzola, S., and Tinti, F. (2007). Comparative analysis of AFLPs and SSRs efficiency in resolving population genetic structure of Mediterranean Solea vulgaris. Mol. Ecol. 16, 1377–1387.
Gaudeul, M., Till-Bottraud, I., Barjon, F., and Manel, S. (2004). Genetic diversity and differentiation in Eryngium alpinum L. (Apiaceae): Comparison of AFLP and microsatellite markers. Heredity 92, 508–518.
Gepts, P., and Debouck, D. G. (1991). “Origin, domestication, and evolution of the common bean, Phaseolus vulgaris,” in Common Beans: Research for Crop Improvement, eds O. Voysest and A. Van Schoonhoven (Wallingford, Oxon: CAB International), 7–53.
Gepts, P., Osborn, T. C., Rashka, K., and Bliss, F. A. (1986). Phaseolin-protein variability in wild forms and landraces of the common bean (Phaseolus vulgaris): evidence for multiple centers of domestication. Econ. Bot. 40, 451–468.
Glémin, S., and Bataillon, T. (2009). A comparative view of the evolution of grasses under domestication. New Phytol. 183, 273–290.
Holsinger, K. E., and Weir, B. S. (2009). Genetics in geographically structured populations: defining, estimating and interpreting FST. Nat. Rev. Genet. 10, 639–650.
Hougaard, B. K., Heegaard Madsen, L., Sandal, N., de Carvalho Moretzsohn, M., Fredslund, J., Schauser, L., et al. (2008). Legume anchor markers link syntenic regions between Phaseolus vulgaris, Lotus japonicus, Medicago truncatula and Arachis. Genetics 179, 2299–2312.
Hucl, P., and Scoles, G. J. (1985). Interspecific hybridization in the common bean: a review. Hort. Sci. 20, 352–357.
Ishii, T., Xu, Y., and McCouch, S. R. (2001). Nuclear- and chloroplast-microsatellite variation in A-genome species of rice. Genome 44, 658–666.
Kami, J., Velásquez, V. B., Debouck, D. G., and Gepts, P. (1995). Identification of presumed ancestral DNA sequences of phaseolin in Phaseolus vulgaris. Proc. Natl. Acad. Sci. USA. 92, 1101–1104.
Kimura, M., and Crow, J. F. (1964). The number of alleles that can be maintained in a finite population. Genetics 49, 725–738.
Klaedtke, S. M., Cajiao, C., Grajales, M., Polanía, J., Borrero, G., Guerrero, A., et al. (2012). Photosynthate remobilization capacity from drought-adapted common bean (Phaseolus vulgaris L.) lines can improve yield potential of interspecific populations within the secondary gene pool. J. Plant Breed. Crop Sci. 4, 49–61.
Koenig, R., and Gepts, P. (1989). Allozyme diversity in wild Phaseolus vulgaris: further evidence for two major centers of genetic diversity. Theor. Appl. Genet. 78, 809–817.
Kropf, M., Comes, H. P., and Kadereit, J. W. (2009). An AFLP clock for the absolute dating of shallow-time evolutionary history based on the intraspecific divergence of southwestern European alpine plant species. Mol. Ecol. 18, 697–708.
Kwak, M., and Gepts, P. (2009). Structure of genetic diversity in the two major gene pools of common bean (Phaseolus vulgaris L., Fabaceae). Theor. Appl. Genet. 118, 979–992.
Lira, C. F., Cardoso, R. S., Ferreira, C. G., Cardoso, M. A., and Proven, J. (2003). Long-term population isolation in the endangered tropical tree species Caesalpinia echinata Lam. revealed by chloroplast microsatellites. Mol. Ecol. 12, 3219–3225.
Llaca, V., Delgado, S. A., and Gepts, P. (1994). Chloroplast DNA as an evolutionary marker in the Phaseolus vulgaris complex. Theor. Appl. Genet. 88, 646–652.
Mariette, S., Chagne, D., Lezier, C., Pastuszka, P., Raffin, A., Plomion, C., et al. (2001). Genetic diversity within and among Pinus pinaster populations: comparison between AFLP and microsatellite markers. Heredity 86, 469–479.
Marshall, H. D., Newton, C., and Ritland, K. (2002). Chloroplast phylogeography and evolution of highly polymorphic microsatellites in lodgepole pine (Pinus contorta). Theor. Appl. Genet. 104, 367–378.
McCauley, D. E. (1995). The use of chloroplast DNA polymorphism in studies of gene flow in plants. Trends Ecol. Evol. 10, 198–202.
Mendel, G. (1866). “Experiments on plant hybrids,” in The Origin of Genetics eds C. Stern and E. R. Sherwood (San Francisco: W. H. Freeman & Company), 1–48.
Nanni, L., Bitocchi, E., Bellucci, E., Rossi, M., Rau, D., Attene, G., et al. (2011). Nucleotide diversity of a genomic sequence similar to SHATTERPROOF (PvSHP1) in domesticated and wild common bean (Phaseolus vulgaris L.). Theor. Appl. Genet. 123, 1341–1357.
Nei, M. (1978). Estimation of average heterozygosity and genetic distance from a small number of individuals. Genetics 89, 583–590.
Papa, R., and Gepts, P. (2003). Asymmetry of gene flow and differential geographical structure of molecular diversity in wild and domesticated common bean (Phaseolus vulgaris L.) from Mesoamerica. Theor. Appl. Genet. 106, 239–250.
Papa, R., Nanni, L., Sicard, D., Rau, D., and Attene, G. (2006). “The evolution of genetic diversity in Phaseolus vulgaris L,” in Darwin’s Harvest – New Approaches to the Origins, Evolution and Conservation of Crops, eds T. J. Motley, N. Zerega, and H. Cross (New York: Columbia University Press), 121–142.
Piñero, D., and Eguiarte, L. (1988). The origin and biosystematic status of Phaseolus coccineus subsp. polyanthus: electrophoretic evidence. Euphytica 37, 199–203.
Provan, J., Powell, W., and Hollingsworth, P. M. (2001). Chloroplast microsatellites: new tools for studies in plant ecology and evolution. Trends Ecol. Evol. 16, 142–147.
Provan, J., Soranzo, N., Wilson, N. J., Goldstein, D. B., and Powell, W. (1999). A low mutation rate for chloroplast microsatellites. Genetics 153, 943–947.
Rossi, M., Bitocchi, E., Bellucci, E., Nanni, L., Rau, D., Attene, G., et al. (2009). Linkage disequilibrium and population structure in wild and domesticated populations of Phaseolus vulgaris L. Evol. Appl. 2, 504–522.
Schmit, V., and Debouck, D. G. (1991). Observations on the origin of Phaseolus polyanthus Greenman. Econ. Bot. 45, 345–364.
Schmit, V., du Jardin, P., Baudoin, J. P., and Debouck, D. G. (1993). Use of chloroplast DNA polymorphism for the phylogenetic study of seven Phaseolus taxa including P. vulgaris and P. coccineus. Theor. Appl. Genet. 87, 506–516.
Shii, C. T., Rabakoarihanta, A., Mok, M. C., and Mok, D. W. S. (1982). Embryo development in reciprocal crosses of Phaseolus vulgaris and Phaseolus coccineus. Theor. Appl. Genet. 62, 59–64
Singh, S. P., Terán, H., Schwartz, H. F., Otto, K., and Lema, M. (2009). Introgressing white mold resistance from Phaseolus species of the secondary gene pool into common bean. Crop Sci. 49, 1629–1637.
Slatkin, M. (1995). A measure of population subdivision based on microsatellite allele frequencies. Genetics 139, 457–462.
Sokal, R. R., and Rohlf, F. J. (1995). Biometry: the Principles and Practice of Statistics in Biological Research. New York: W. H. Freeman.
Thuillet, A. C., Bataillon, T., Poirier, S., Santoni, S., and David, J. L. (2005). Estimation of long-term effective population sizes through the history of durum wheat using microsatellite data. Genetics 169, 1589–1599.
Toro, O., Tohme, J., and Debouck, D. G. (1990). Wild bean (Phaseolus vulgaris L): Description and Distribution. Cali, Colombia: Centro Internacional de Agricultura Tropical.
Udupa, S. M., and Baum, M. (2001). High mutation rate and mutational bias at (TAA) (n) microsatellite loci in chickpea (Cicer arietinum L). Mol. Genet. Genom. 265, 1097–1103.
Ueno, S., Setsuko, S., Kawahara, T., and Yoshimaru, H. (2005). Genetic diversity and differentiation of the endangered Japanese endemic tree Magnolia stellata using nuclear and chloroplast microsatellite markers. Conserv. Genet. 6, 563–574.
Vigouroux, Y., McMullen, M., Hittinger, C. T., Houchins, K., Schulz, L., Kresovich, S., et al. (2002). Identifying genes of agronomic importance in maize by screening microsatellites for evidence of selection during domestication. Proc. Natl. Acad. Sci. USA. 99, 9650–9655.
Wall, J. R. (1970). Experimental introgression in the genus Phaseolus. 1. Effect of mating systems on interspecific gene flow. Evolution 24, 356–366.
Weir, B. S., and Cockerham, C. C. (1984). Estimating F-statistics for the analysis of population structure. Evolution 38, 1358–1370.
Weising, K., and Gardner, R. C. (1999). A set of conserved PCR primers for the analysis of simple sequence repeat polymorphisms in chloroplast genomes of dicotyledonous angiosperms. Genome 42, 9–19.
Appendix
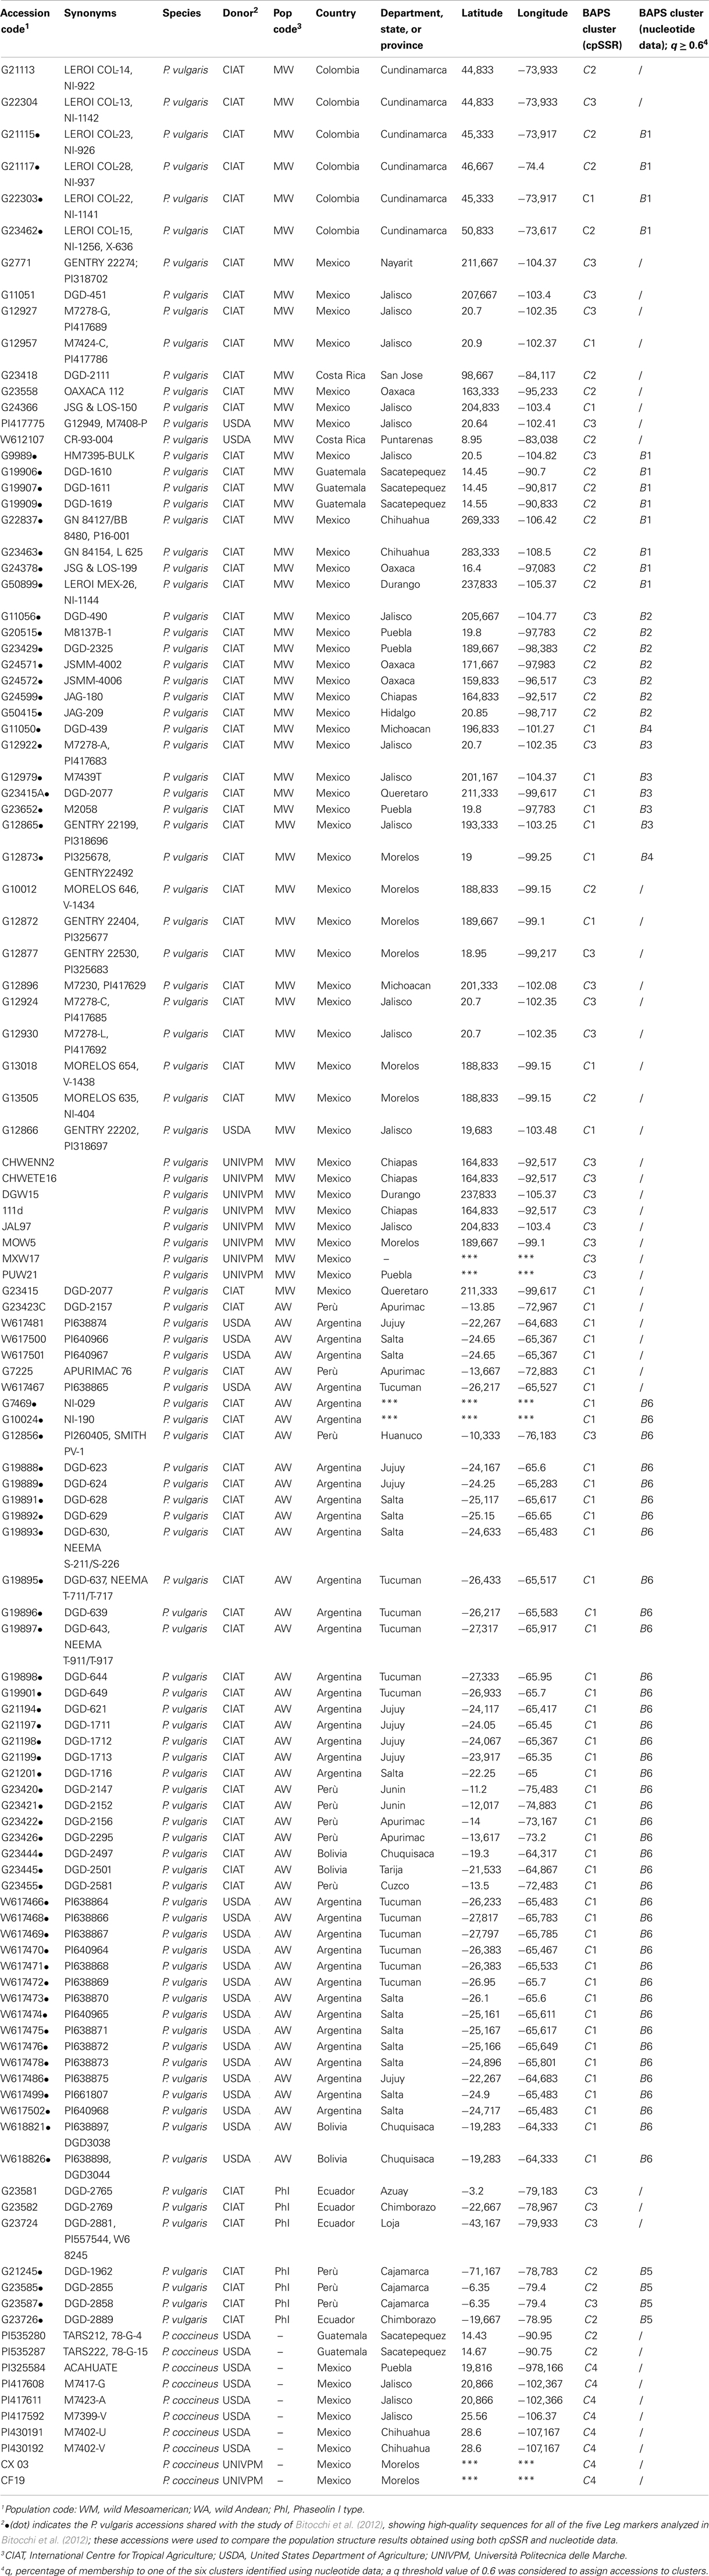
Table A1. List of accessions used in this study.
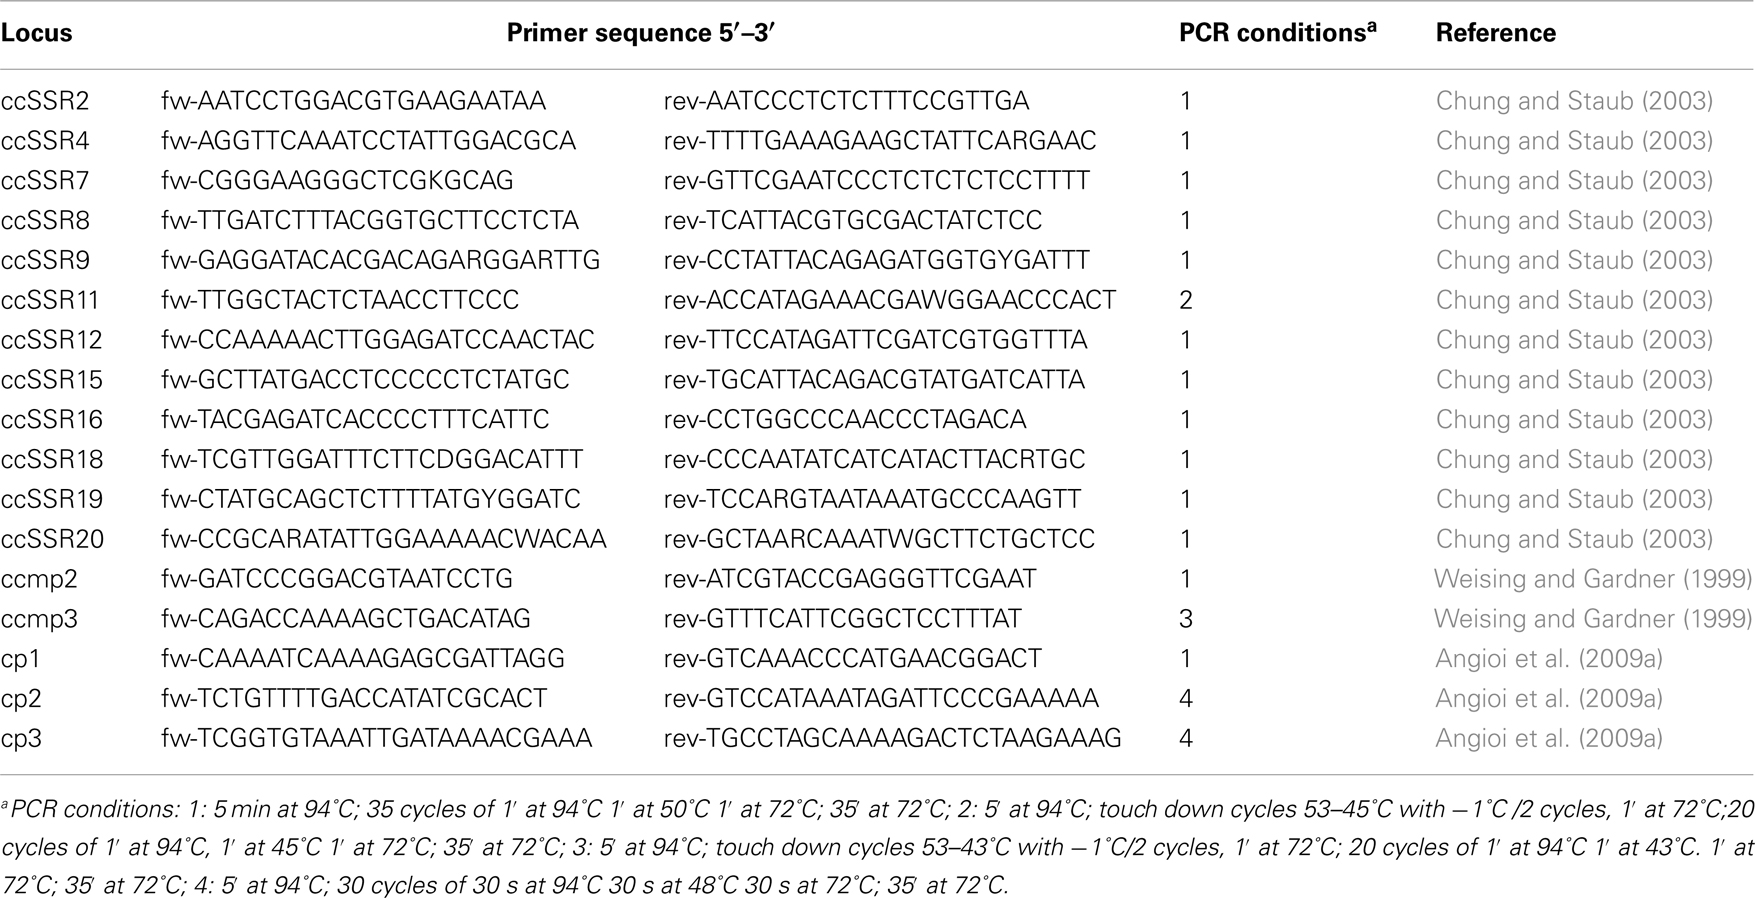
Table A2. List of SSR used in this study.
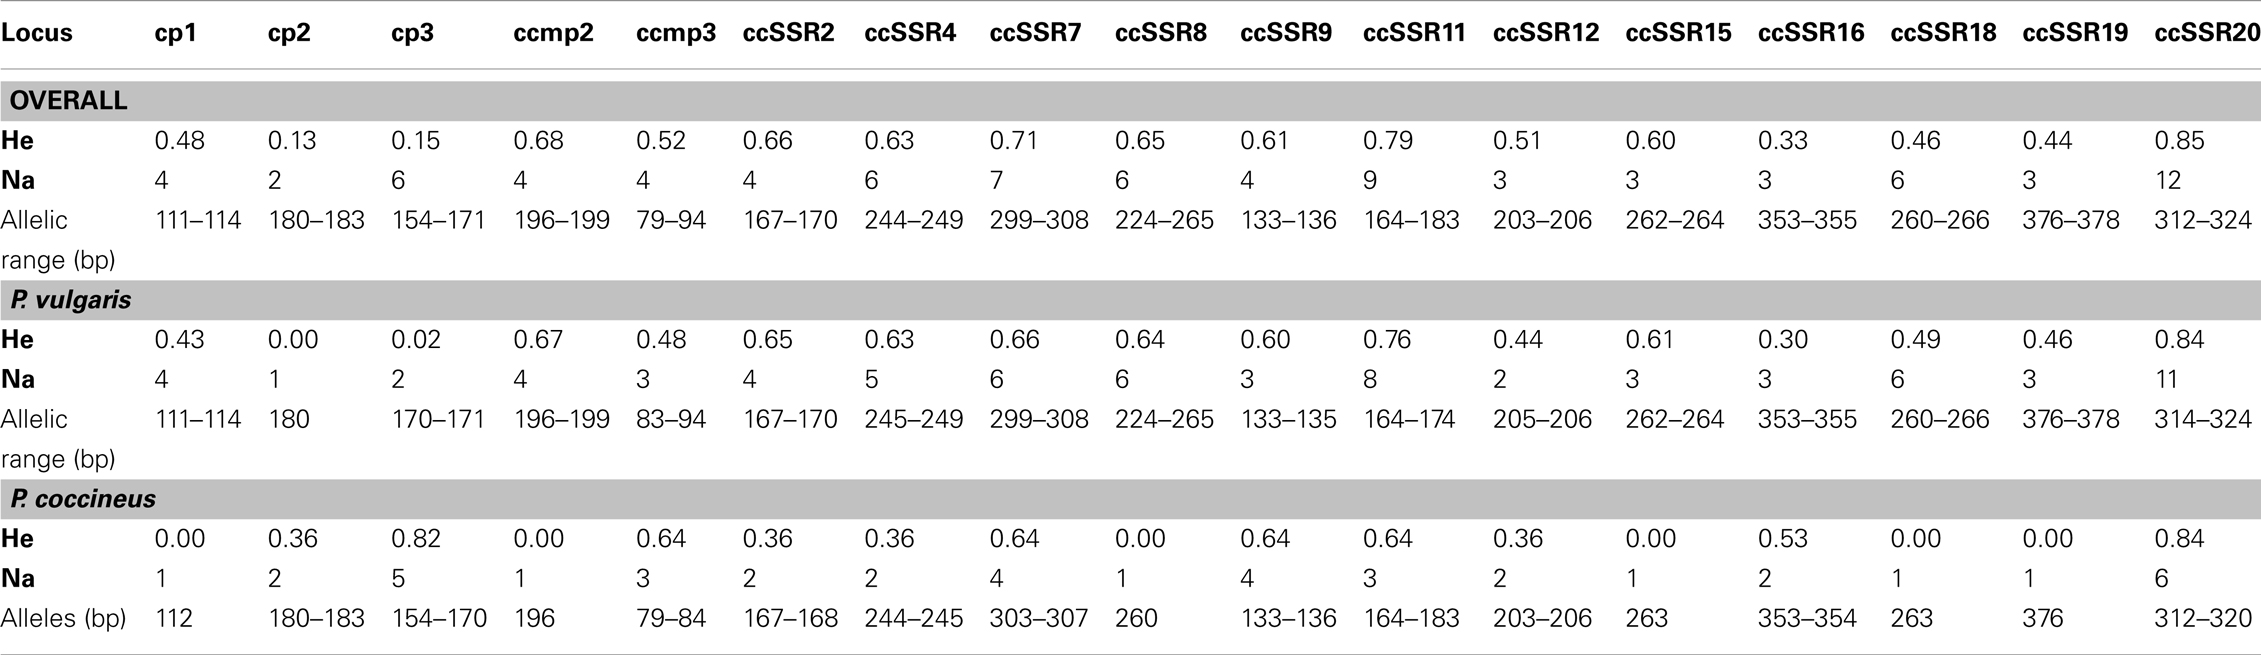
Table A3. Number of alleles (Na) and gene diversity (He, Nei, 1978) in the overall, P. vulgaris and P. coccineus samples for each of the 17 cpSSRs used.
Keywords: Phaseolus, crop evolution, cpSSR, recombination, population structure, speciation, introgression
Citation: Desiderio F, Bitocchi E, Bellucci E, Rau D, Rodriguez M, Attene G, Papa R and Nanni L (2013) Chloroplast microsatellite diversity in Phaseolus vulgaris. Front. Plant Sci. 3:312. doi: 10.3389/fpls.2012.00312
Received: 30 October 2012; Paper pending published: 27 November 2012;
Accepted: 27 December 2012; Published online: 22 January 2013.
Edited by:
Scott Jackson, University of Georgia, USAReviewed by:
Steven B. Cannon, United States Department of Agriculture, USAJeremy Coate, Cornell University, USA
Copyright: © 2013 Desiderio, Bitocchi, Bellucci, Rau, Rodriguez, Attene, Papa and Nanni. This is an open-access article distributed under the terms of the Creative Commons Attribution License, which permits use, distribution and reproduction in other forums, provided the original authors and source are credited and subject to any copyright notices concerning any third-party graphics etc.
*Correspondence: L. Nanni, Dipartimento di Scienze Agrarie, Alimentari ed Ambientali, Università Politecnica delle Marche, Via Brecce Bianche, 60131 Ancona, Italy. e-mail: l.nanni@univpm.it